|
|||||||||||||||||||||||||||||||||||||||||||||||||||||||||||||||||||||||||||||||||||||||||||||||||||||||||||||||||||||||||||||||||||||||||||||||||||||||||||||||||||||||||||||||||||||||||||||||||||||||||||||||||||||||||||||||||||||||||||||||||||||||||||||||||||||||||||||||||||||||||||||||||||||||||||||||||||||||||||||||||||||||||||||||||||||||||||||||
| |
| Phenotypic Information (metabolism pathway, cancer, disease, phenome) |
| |
| |
| Gene-Gene Network Information: Co-Expression Network, Interacting Genes & KEGG |
| |
|


| Gene Summary for GNG2 |
| Basic gene info. | Gene symbol | GNG2 |
| Gene name | guanine nucleotide binding protein (G protein), gamma 2 | |
| Synonyms | - | |
| Cytomap | UCSC genome browser: 14q21 | |
| Genomic location | chr14 :52327021-52436518 | |
| Type of gene | protein-coding | |
| RefGenes | NM_001243773.1, NM_001243774.1,NM_053064.4, | |
| Ensembl id | ENSG00000186469 | |
| Description | g gamma-Iguanine nucleotide binding protein gamma 2guanine nucleotide-binding protein G(I)/G(O) gamma-2 subunitguanine nucleotide-binding protein G(I)/G(S)/G(O) subunit gamma-2 | |
| Modification date | 20141207 | |
| dbXrefs | MIM : 606981 | |
| HGNC : HGNC | ||
| Ensembl : ENSG00000186469 | ||
| HPRD : 16234 | ||
| Vega : OTTHUMG00000171083 | ||
| Protein | UniProt: P59768 go to UniProt's Cross Reference DB Table | |
| Expression | CleanEX: HS_GNG2 | |
| BioGPS: 54331 | ||
| Gene Expression Atlas: ENSG00000186469 | ||
| The Human Protein Atlas: ENSG00000186469 | ||
| Pathway | NCI Pathway Interaction Database: GNG2 | |
| KEGG: GNG2 | ||
| REACTOME: GNG2 | ||
| ConsensusPathDB | ||
| Pathway Commons: GNG2 | ||
| Metabolism | MetaCyc: GNG2 | |
| HUMANCyc: GNG2 | ||
| Regulation | Ensembl's Regulation: ENSG00000186469 | |
| miRBase: chr14 :52,327,021-52,436,518 | ||
| TargetScan: NM_001243773 | ||
| cisRED: ENSG00000186469 | ||
| Context | iHOP: GNG2 | |
| cancer metabolism search in PubMed: GNG2 | ||
| UCL Cancer Institute: GNG2 | ||
| Assigned class in ccmGDB | A - This gene has a literature evidence and it belongs to cancer gene. | |
| References showing role of GNG2 in cancer cell metabolism | 1. Matimba A, Li F, Livshits A, Cartwright CS, Scully S, et al. (2014) Thiopurine pharmacogenomics: association of SNPs with clinical response and functional validation of candidate genes. Pharmacogenomics 15: 433-447. doi: 10.2217/pgs.13.226. pmid: 4027966. go to article 2. Yajima I, Kumasaka MY, Tamura H, Ohgami N, Kato M (2012) Functional analysis of GNG2 in human malignant melanoma cells. J Dermatol Sci 68: 172-178. doi: 10.1016/j.jdermsci.2012.09.009. go to article | |
| Top |
| Phenotypic Information for GNG2(metabolism pathway, cancer, disease, phenome) |
| Cancer | CGAP: GNG2 |
| Familial Cancer Database: GNG2 | |
| * This gene is included in those cancer gene databases. |
|
|
|
|
|
| . | |||||||||||||||||||||||||||||||||||||||||||||||||||||||||||||||||||||||||||||||||||||||||||||||||||||||||||||||||||||||||||||||||||||||||||||||||||||||||||||||||||||||||||||||||||||||||||||||||||||||||||||||||||||||||||||||||||||||||||||||||||||||||||||||||||||||||||||||||||||||||||||||||||||||||||||||||||||||||||||||||||||||||||||||||||||||||
Oncogene 1 | Significant driver gene in | ||||||||||||||||||||||||||||||||||||||||||||||||||||||||||||||||||||||||||||||||||||||||||||||||||||||||||||||||||||||||||||||||||||||||||||||||||||||||||||||||||||||||||||||||||||||||||||||||||||||||||||||||||||||||||||||||||||||||||||||||||||||||||||||||||||||||||||||||||||||||||||||||||||||||||||||||||||||||||||||||||||||||||||||||||||||||||||||
| cf) number; DB name 1 Oncogene; http://nar.oxfordjournals.org/content/35/suppl_1/D721.long, 2 Tumor Suppressor gene; https://bioinfo.uth.edu/TSGene/, 3 Cancer Gene Census; http://www.nature.com/nrc/journal/v4/n3/abs/nrc1299.html, 4 CancerGenes; http://nar.oxfordjournals.org/content/35/suppl_1/D721.long, 5 Network of Cancer Gene; http://ncg.kcl.ac.uk/index.php, 1Therapeutic Vulnerabilities in Cancer; http://cbio.mskcc.org/cancergenomics/statius/ |
| REACTOME_INTEGRATION_OF_ENERGY_METABOLISM | |
| OMIM | 606981; gene. |
| Orphanet | |
| Disease | KEGG Disease: GNG2 |
| MedGen: GNG2 (Human Medical Genetics with Condition) | |
| ClinVar: GNG2 | |
| Phenotype | MGI: GNG2 (International Mouse Phenotyping Consortium) |
| PhenomicDB: GNG2 | |
| Mutations for GNG2 |
| * Under tables are showing count per each tissue to give us broad intuition about tissue specific mutation patterns.You can go to the detailed page for each mutation database's web site. |
| There's no structural variation information in COSMIC data for this gene. |
| * From mRNA Sanger sequences, Chitars2.0 arranged chimeric transcripts. This table shows GNG2 related fusion information. |
| ID | Head Gene | Tail Gene | Accession | Gene_a | qStart_a | qEnd_a | Chromosome_a | tStart_a | tEnd_a | Gene_a | qStart_a | qEnd_a | Chromosome_a | tStart_a | tEnd_a |
| BF886210 | GNG2 | 18 | 144 | 14 | 52435791 | 52435921 | GNG2 | 139 | 192 | 14 | 52435844 | 52435897 | |
| Top |
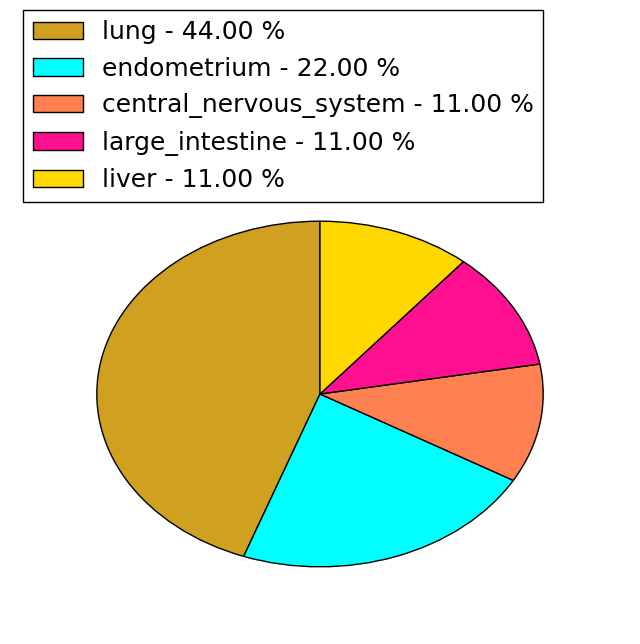
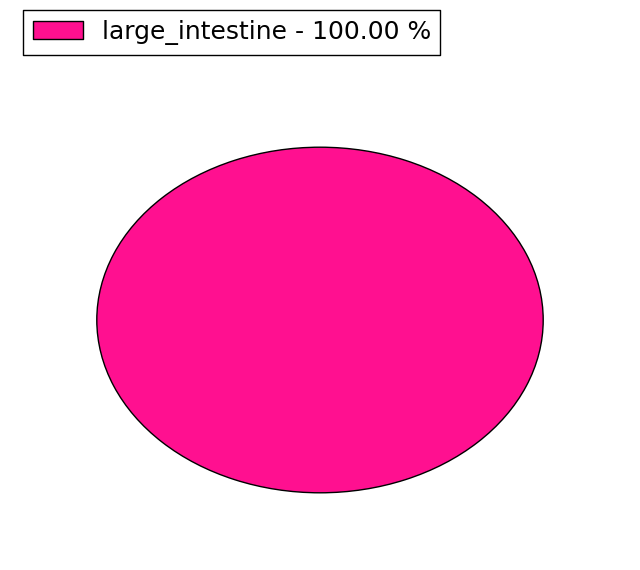
| Mutation type/ Tissue ID | brca | cns | cerv | endome | haematopo | kidn | Lintest | liver | lung | ns | ovary | pancre | prost | skin | stoma | thyro | urina | |||
| Total # sample | 4 | 2 | 1 | 1 | ||||||||||||||||
| GAIN (# sample) | 4 | 2 | 1 | |||||||||||||||||
| LOSS (# sample) | 1 |
| cf) Tissue ID; Tissue type (1; Breast, 2; Central_nervous_system, 3; Cervix, 4; Endometrium, 5; Haematopoietic_and_lymphoid_tissue, 6; Kidney, 7; Large_intestine, 8; Liver, 9; Lung, 10; NS, 11; Ovary, 12; Pancreas, 13; Prostate, 14; Skin, 15; Stomach, 16; Thyroid, 17; Urinary_tract) |
| Top |
|
 |
| Top |
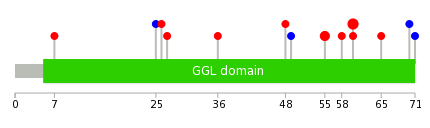
| Stat. for Non-Synonymous SNVs (# total SNVs=9) | (# total SNVs=1) |
 |  |
(# total SNVs=0) | (# total SNVs=0) |
| Top |
| * When you move the cursor on each content, you can see more deailed mutation information on the Tooltip. Those are primary_site,primary_histology,mutation(aa),pubmedID. |
| GRCh37 position | Mutation(aa) | Unique sampleID count |
| chr14:52433367-52433367 | p.P60S | 5 |
| chr14:52433353-52433353 | p.P55L | 3 |
| chr14:52433368-52433368 | p.P60L | 1 |
| chr14:52417415-52417415 | p.A7T | 1 |
| chr14:52433384-52433384 | p.K65N | 1 |
| chr14:52417471-52417471 | p.I25I | 1 |
| chr14:52433399-52433399 | p.I70I | 1 |
| chr14:52417474-52417474 | p.D26E | 1 |
| chr14:52433402-52433402 | p.L71L | 1 |
| chr14:52417477-52417477 | p.R27S | 1 |
| Top |
|
 |
| Point Mutation/ Tissue ID | 1 | 2 | 3 | 4 | 5 | 6 | 7 | 8 | 9 | 10 | 11 | 12 | 13 | 14 | 15 | 16 | 17 | 18 | 19 | 20 |
| # sample | 1 | 1 | 4 | 5 | 2 | |||||||||||||||
| # mutation | 1 | 1 | 4 | 3 | 2 | |||||||||||||||
| nonsynonymous SNV | 1 | 1 | 4 | 1 | 2 | |||||||||||||||
| synonymous SNV | 2 |
| cf) Tissue ID; Tissue type (1; BLCA[Bladder Urothelial Carcinoma], 2; BRCA[Breast invasive carcinoma], 3; CESC[Cervical squamous cell carcinoma and endocervical adenocarcinoma], 4; COAD[Colon adenocarcinoma], 5; GBM[Glioblastoma multiforme], 6; Glioma Low Grade, 7; HNSC[Head and Neck squamous cell carcinoma], 8; KICH[Kidney Chromophobe], 9; KIRC[Kidney renal clear cell carcinoma], 10; KIRP[Kidney renal papillary cell carcinoma], 11; LAML[Acute Myeloid Leukemia], 12; LUAD[Lung adenocarcinoma], 13; LUSC[Lung squamous cell carcinoma], 14; OV[Ovarian serous cystadenocarcinoma ], 15; PAAD[Pancreatic adenocarcinoma], 16; PRAD[Prostate adenocarcinoma], 17; SKCM[Skin Cutaneous Melanoma], 18:STAD[Stomach adenocarcinoma], 19:THCA[Thyroid carcinoma], 20:UCEC[Uterine Corpus Endometrial Carcinoma]) |
| Top |
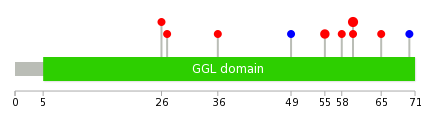
| * We represented just top 10 SNVs. When you move the cursor on each content, you can see more deailed mutation information on the Tooltip. Those are primary_site, primary_histology, mutation(aa), pubmedID. |
| Genomic Position | Mutation(aa) | Unique sampleID count |
| chr14:52433367 | p.P60S,GNG2 | 3 |
| chr14:52433353 | p.P55L,GNG2 | 2 |
| chr14:52433399 | p.D26E,GNG2 | 1 |
| chr14:52417474 | p.R27S,GNG2 | 1 |
| chr14:52417477 | p.D36Y,GNG2 | 1 |
| chr14:52433295 | p.P49P,GNG2 | 1 |
| chr14:52433336 | p.E58Q,GNG2 | 1 |
| chr14:52433361 | p.P60L,GNG2 | 1 |
| chr14:52433368 | p.K65N,GNG2 | 1 |
| chr14:52433384 | p.I70I,GNG2 | 1 |
| * Copy number data were extracted from TCGA using R package TCGA-Assembler. The URLs of all public data files on TCGA DCC data server were gathered on Jan-05-2015. Function ProcessCNAData in TCGA-Assembler package was used to obtain gene-level copy number value which is calculated as the average copy number of the genomic region of a gene. |
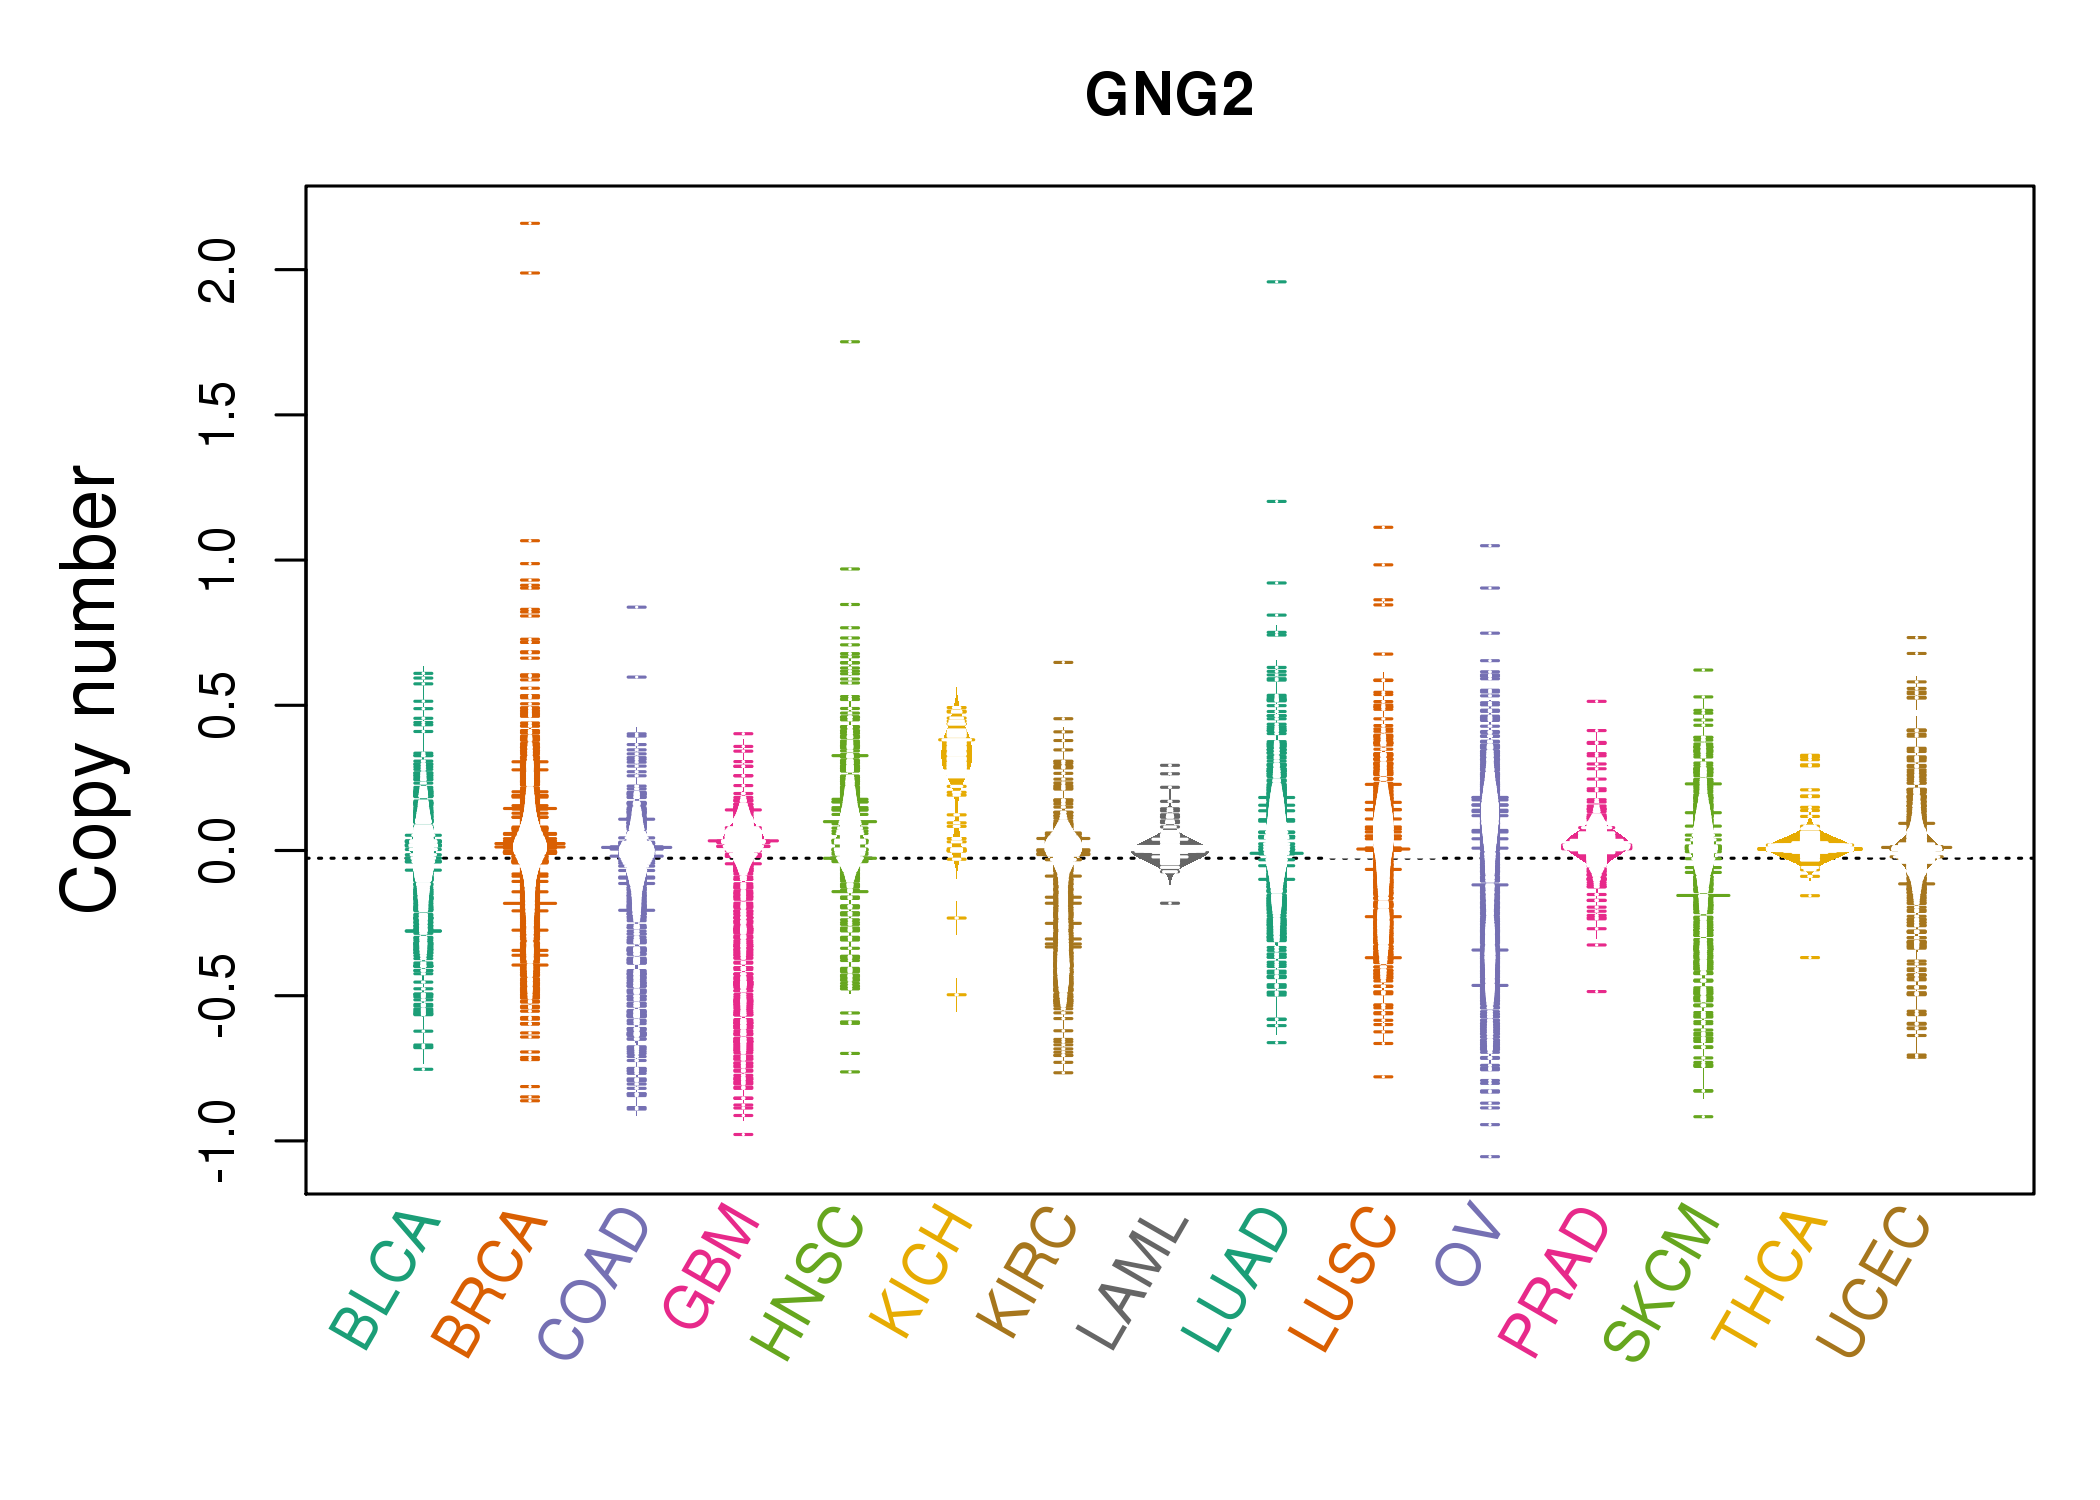 |
| cf) Tissue ID[Tissue type]: BLCA[Bladder Urothelial Carcinoma], BRCA[Breast invasive carcinoma], CESC[Cervical squamous cell carcinoma and endocervical adenocarcinoma], COAD[Colon adenocarcinoma], GBM[Glioblastoma multiforme], Glioma Low Grade, HNSC[Head and Neck squamous cell carcinoma], KICH[Kidney Chromophobe], KIRC[Kidney renal clear cell carcinoma], KIRP[Kidney renal papillary cell carcinoma], LAML[Acute Myeloid Leukemia], LUAD[Lung adenocarcinoma], LUSC[Lung squamous cell carcinoma], OV[Ovarian serous cystadenocarcinoma ], PAAD[Pancreatic adenocarcinoma], PRAD[Prostate adenocarcinoma], SKCM[Skin Cutaneous Melanoma], STAD[Stomach adenocarcinoma], THCA[Thyroid carcinoma], UCEC[Uterine Corpus Endometrial Carcinoma] |
| Top |
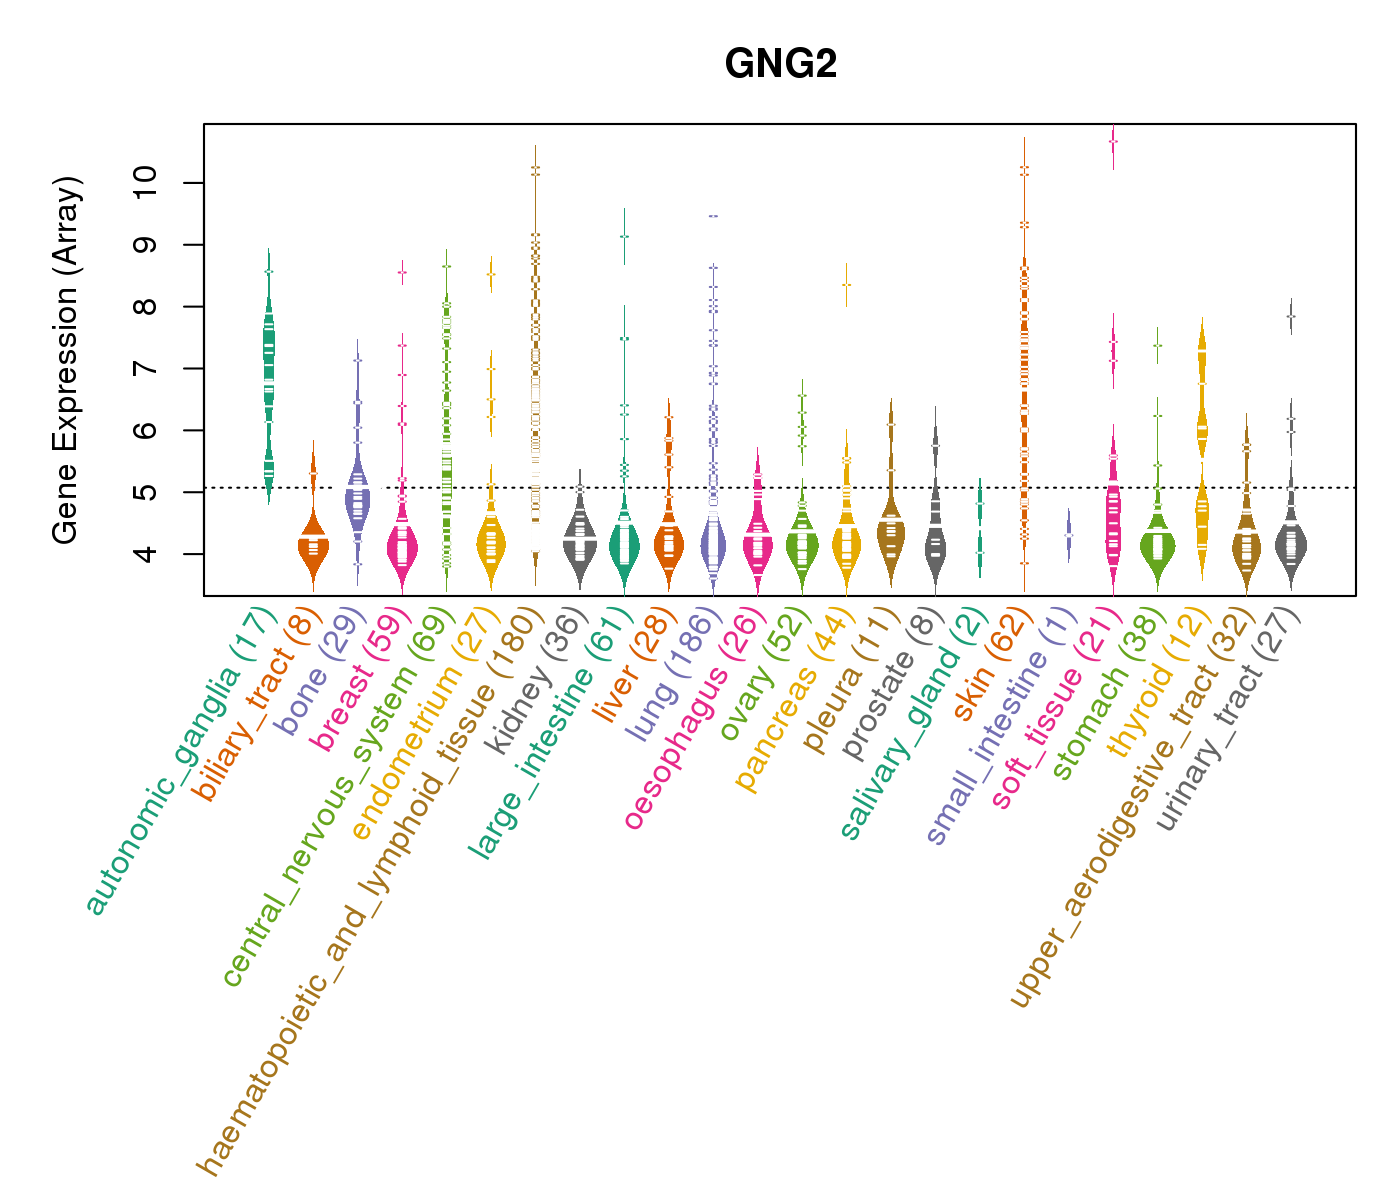
| Gene Expression for GNG2 |
| * CCLE gene expression data were extracted from CCLE_Expression_Entrez_2012-10-18.res: Gene-centric RMA-normalized mRNA expression data. |
 |
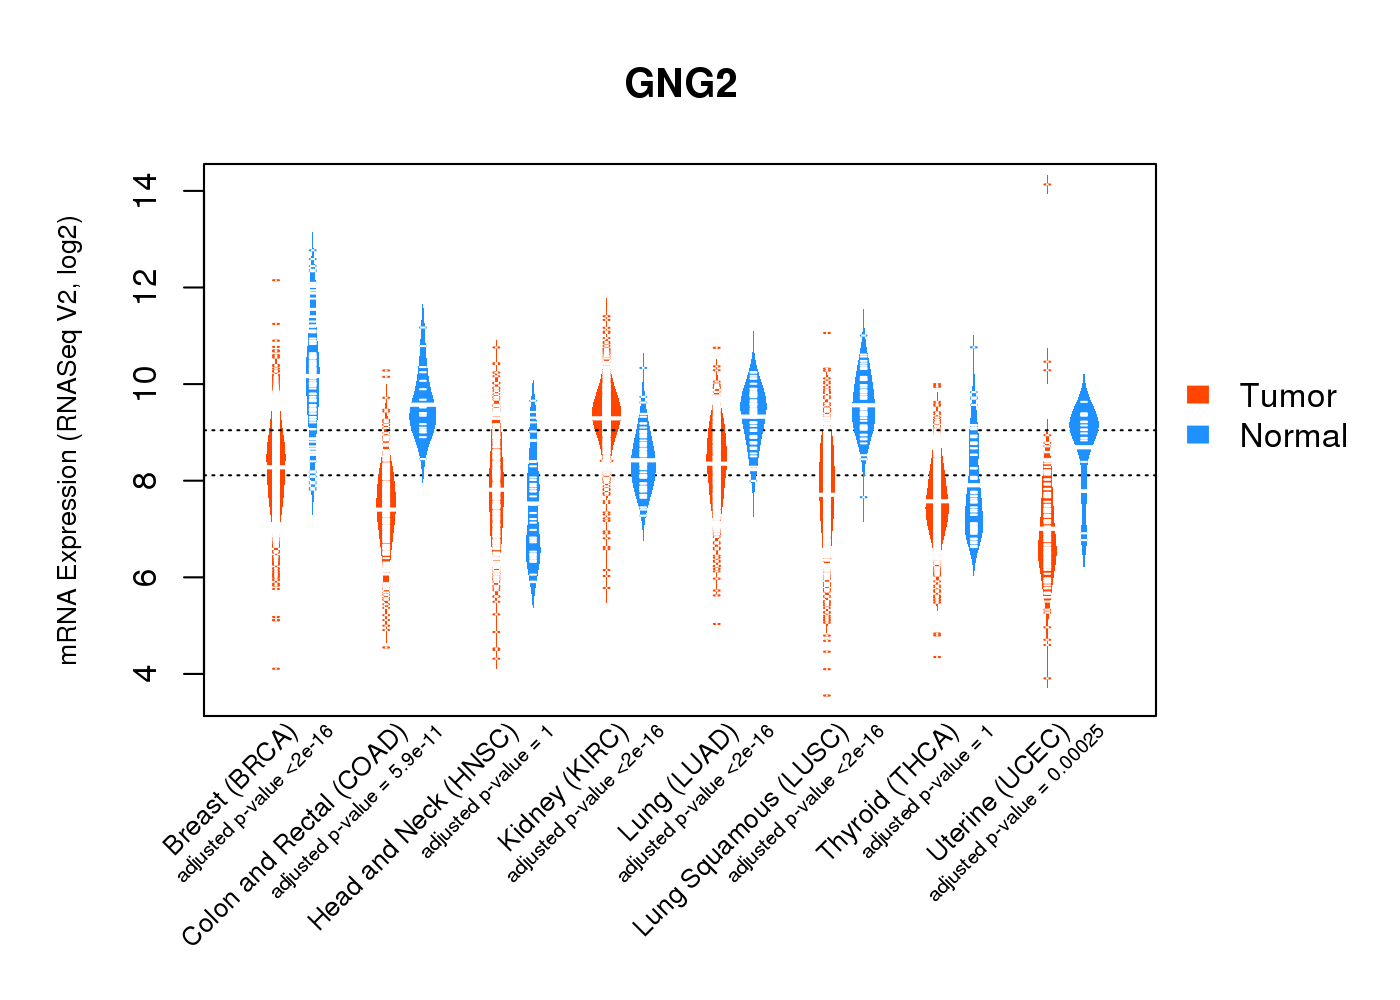
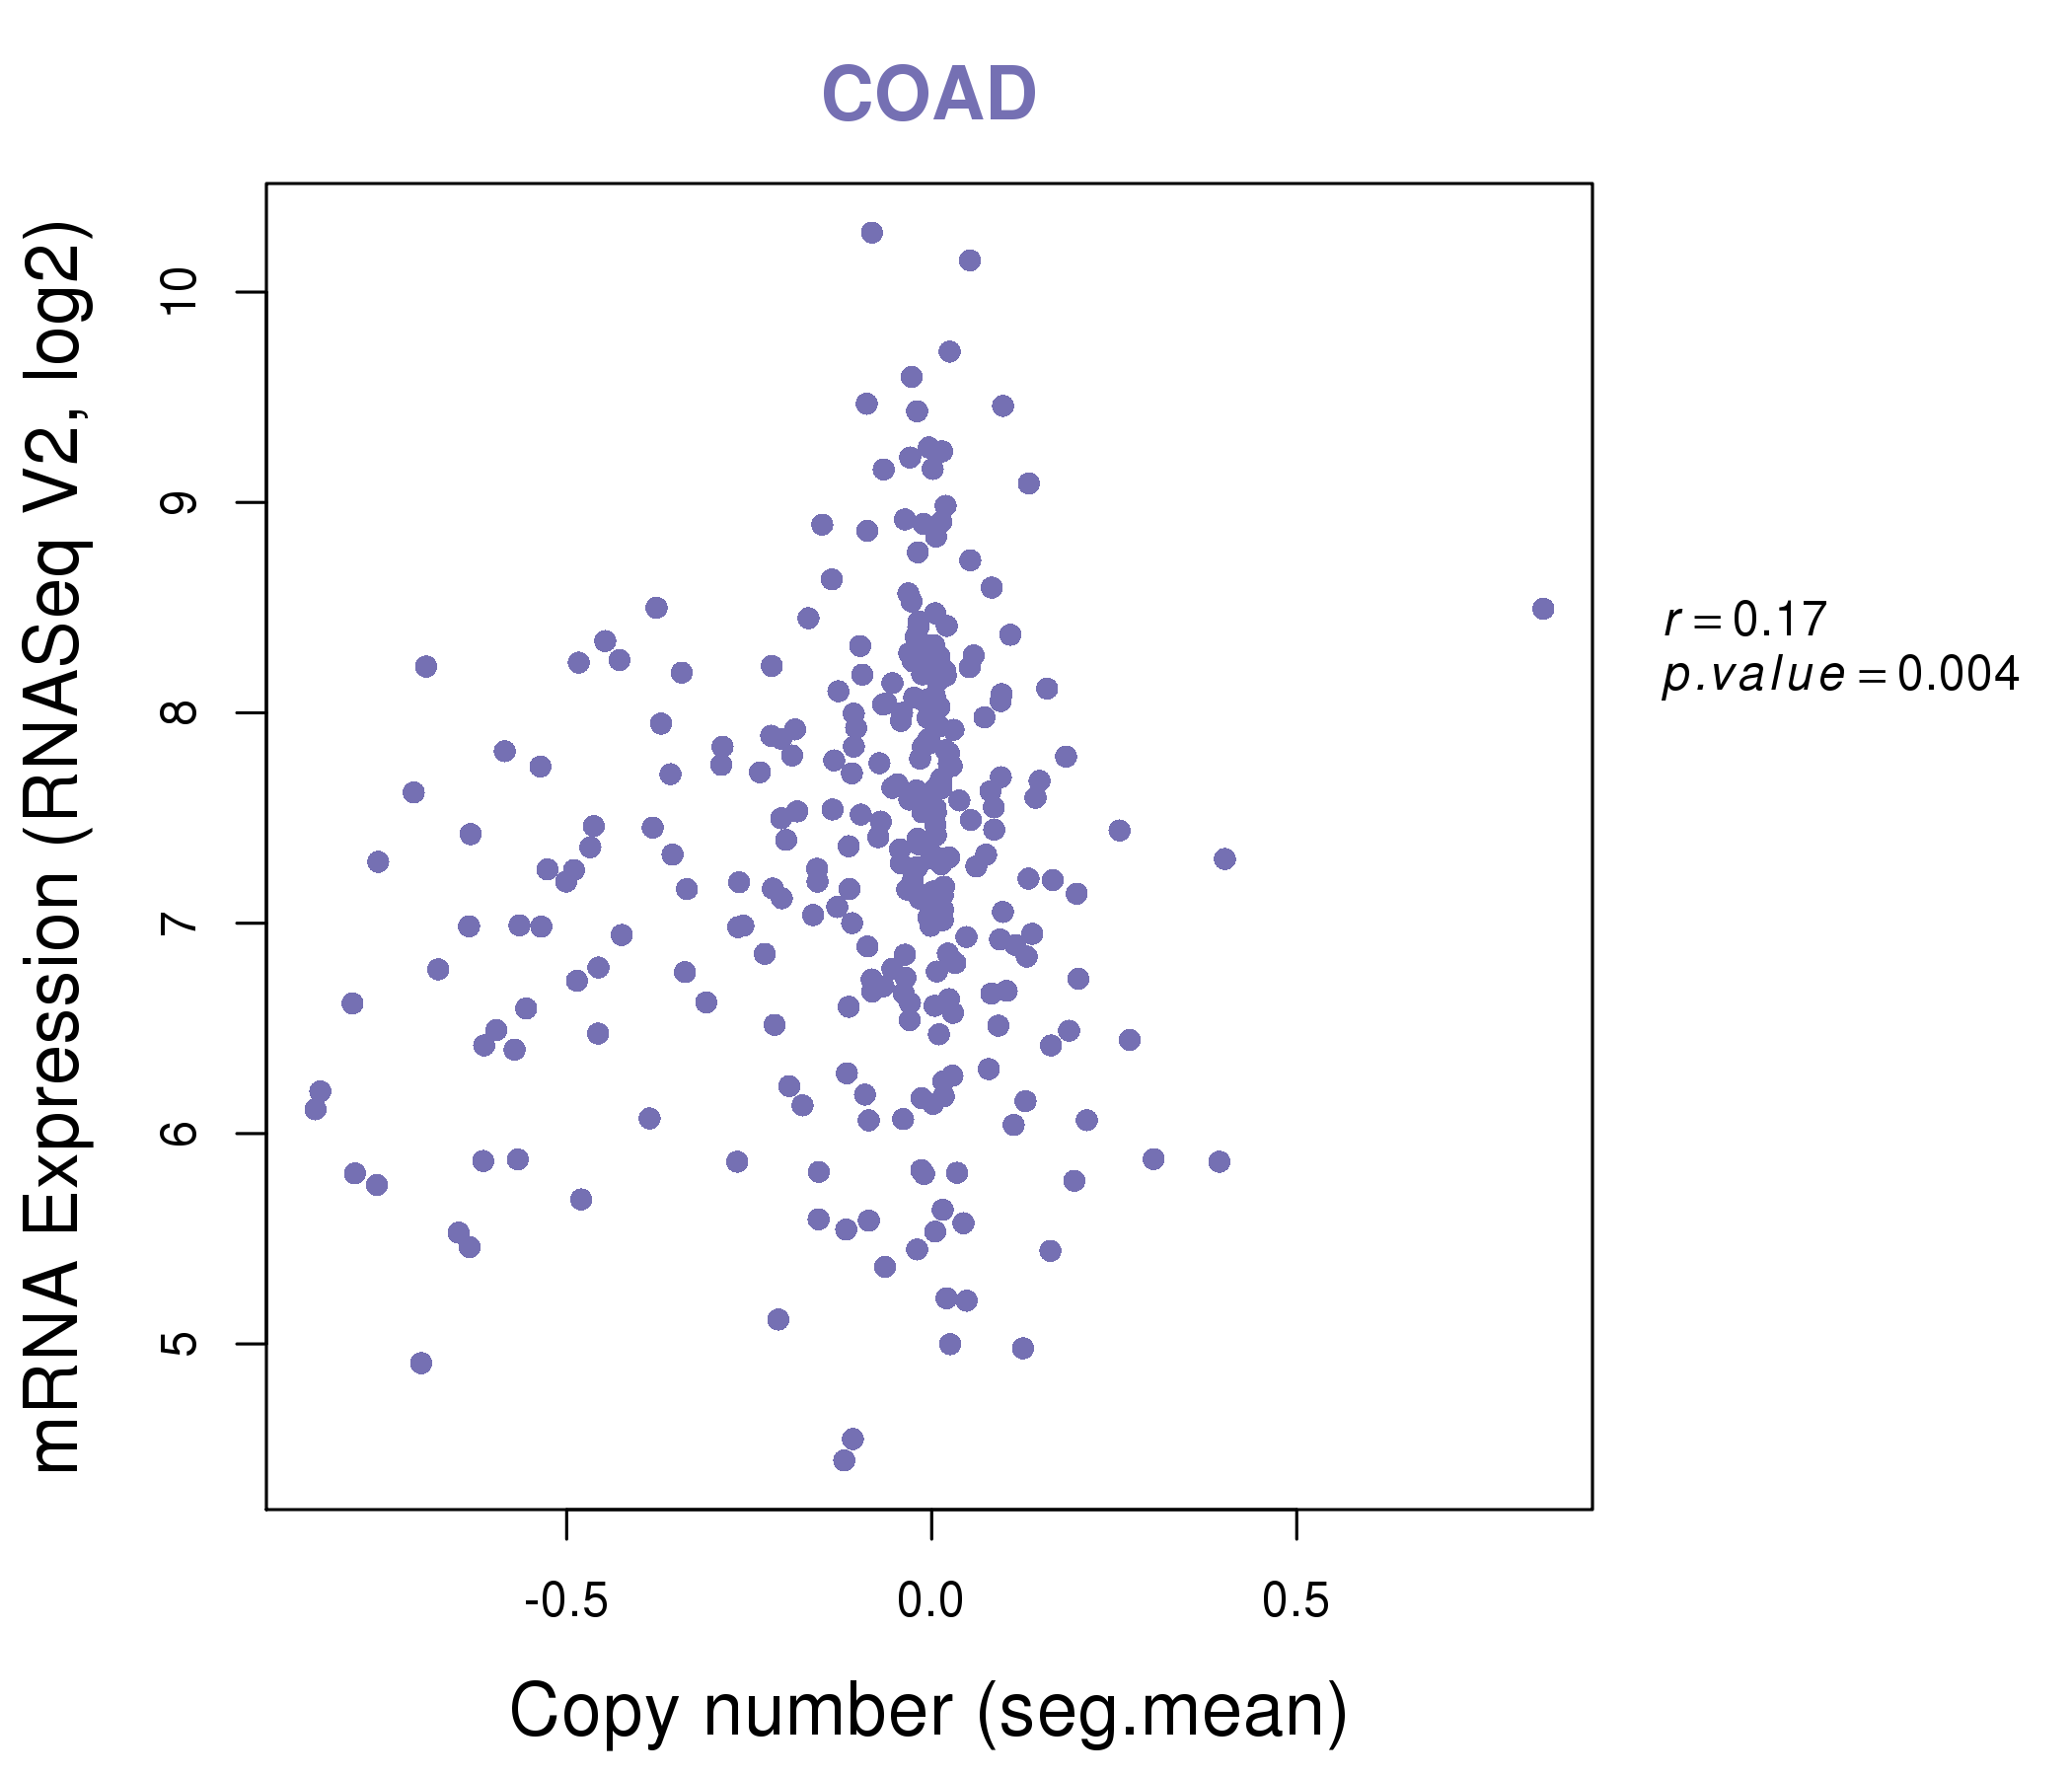
| * Normalized gene expression data of RNASeqV2 was extracted from TCGA using R package TCGA-Assembler. The URLs of all public data files on TCGA DCC data server were gathered at Jan-05-2015. Only eight cancer types have enough normal control samples for differential expression analysis. (t test, adjusted p<0.05 (using Benjamini-Hochberg FDR)) |
 |
| Top |
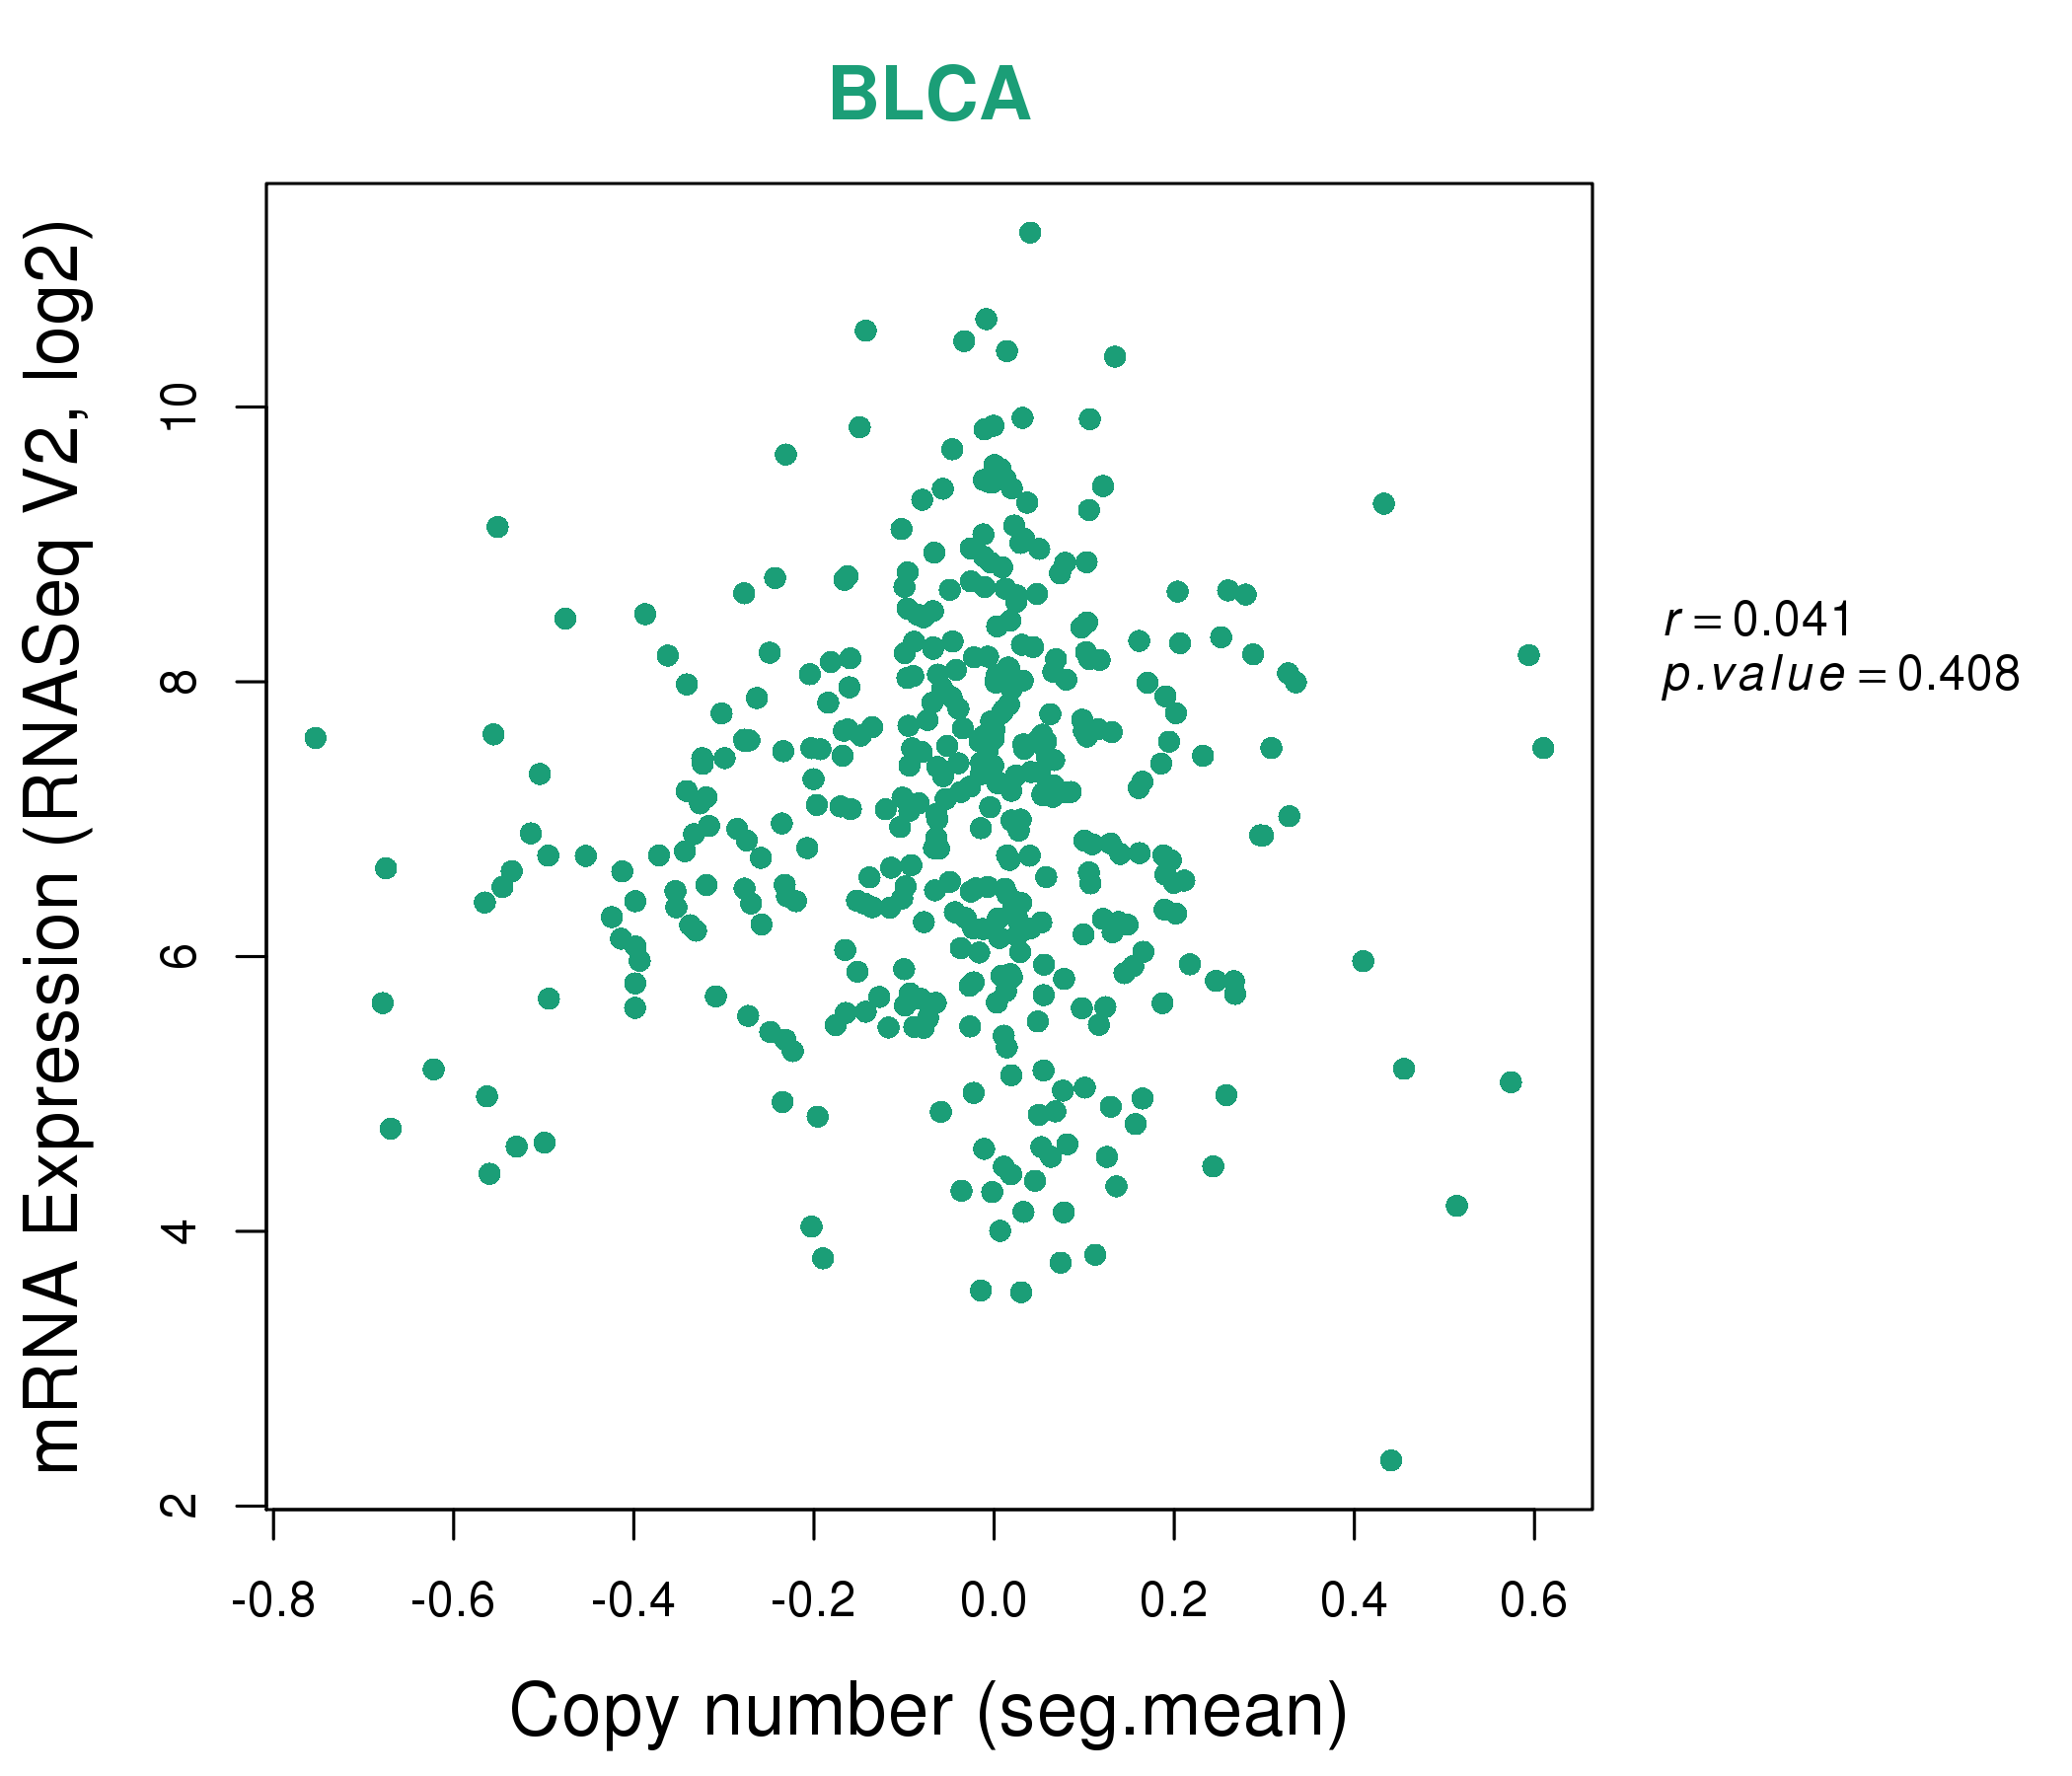
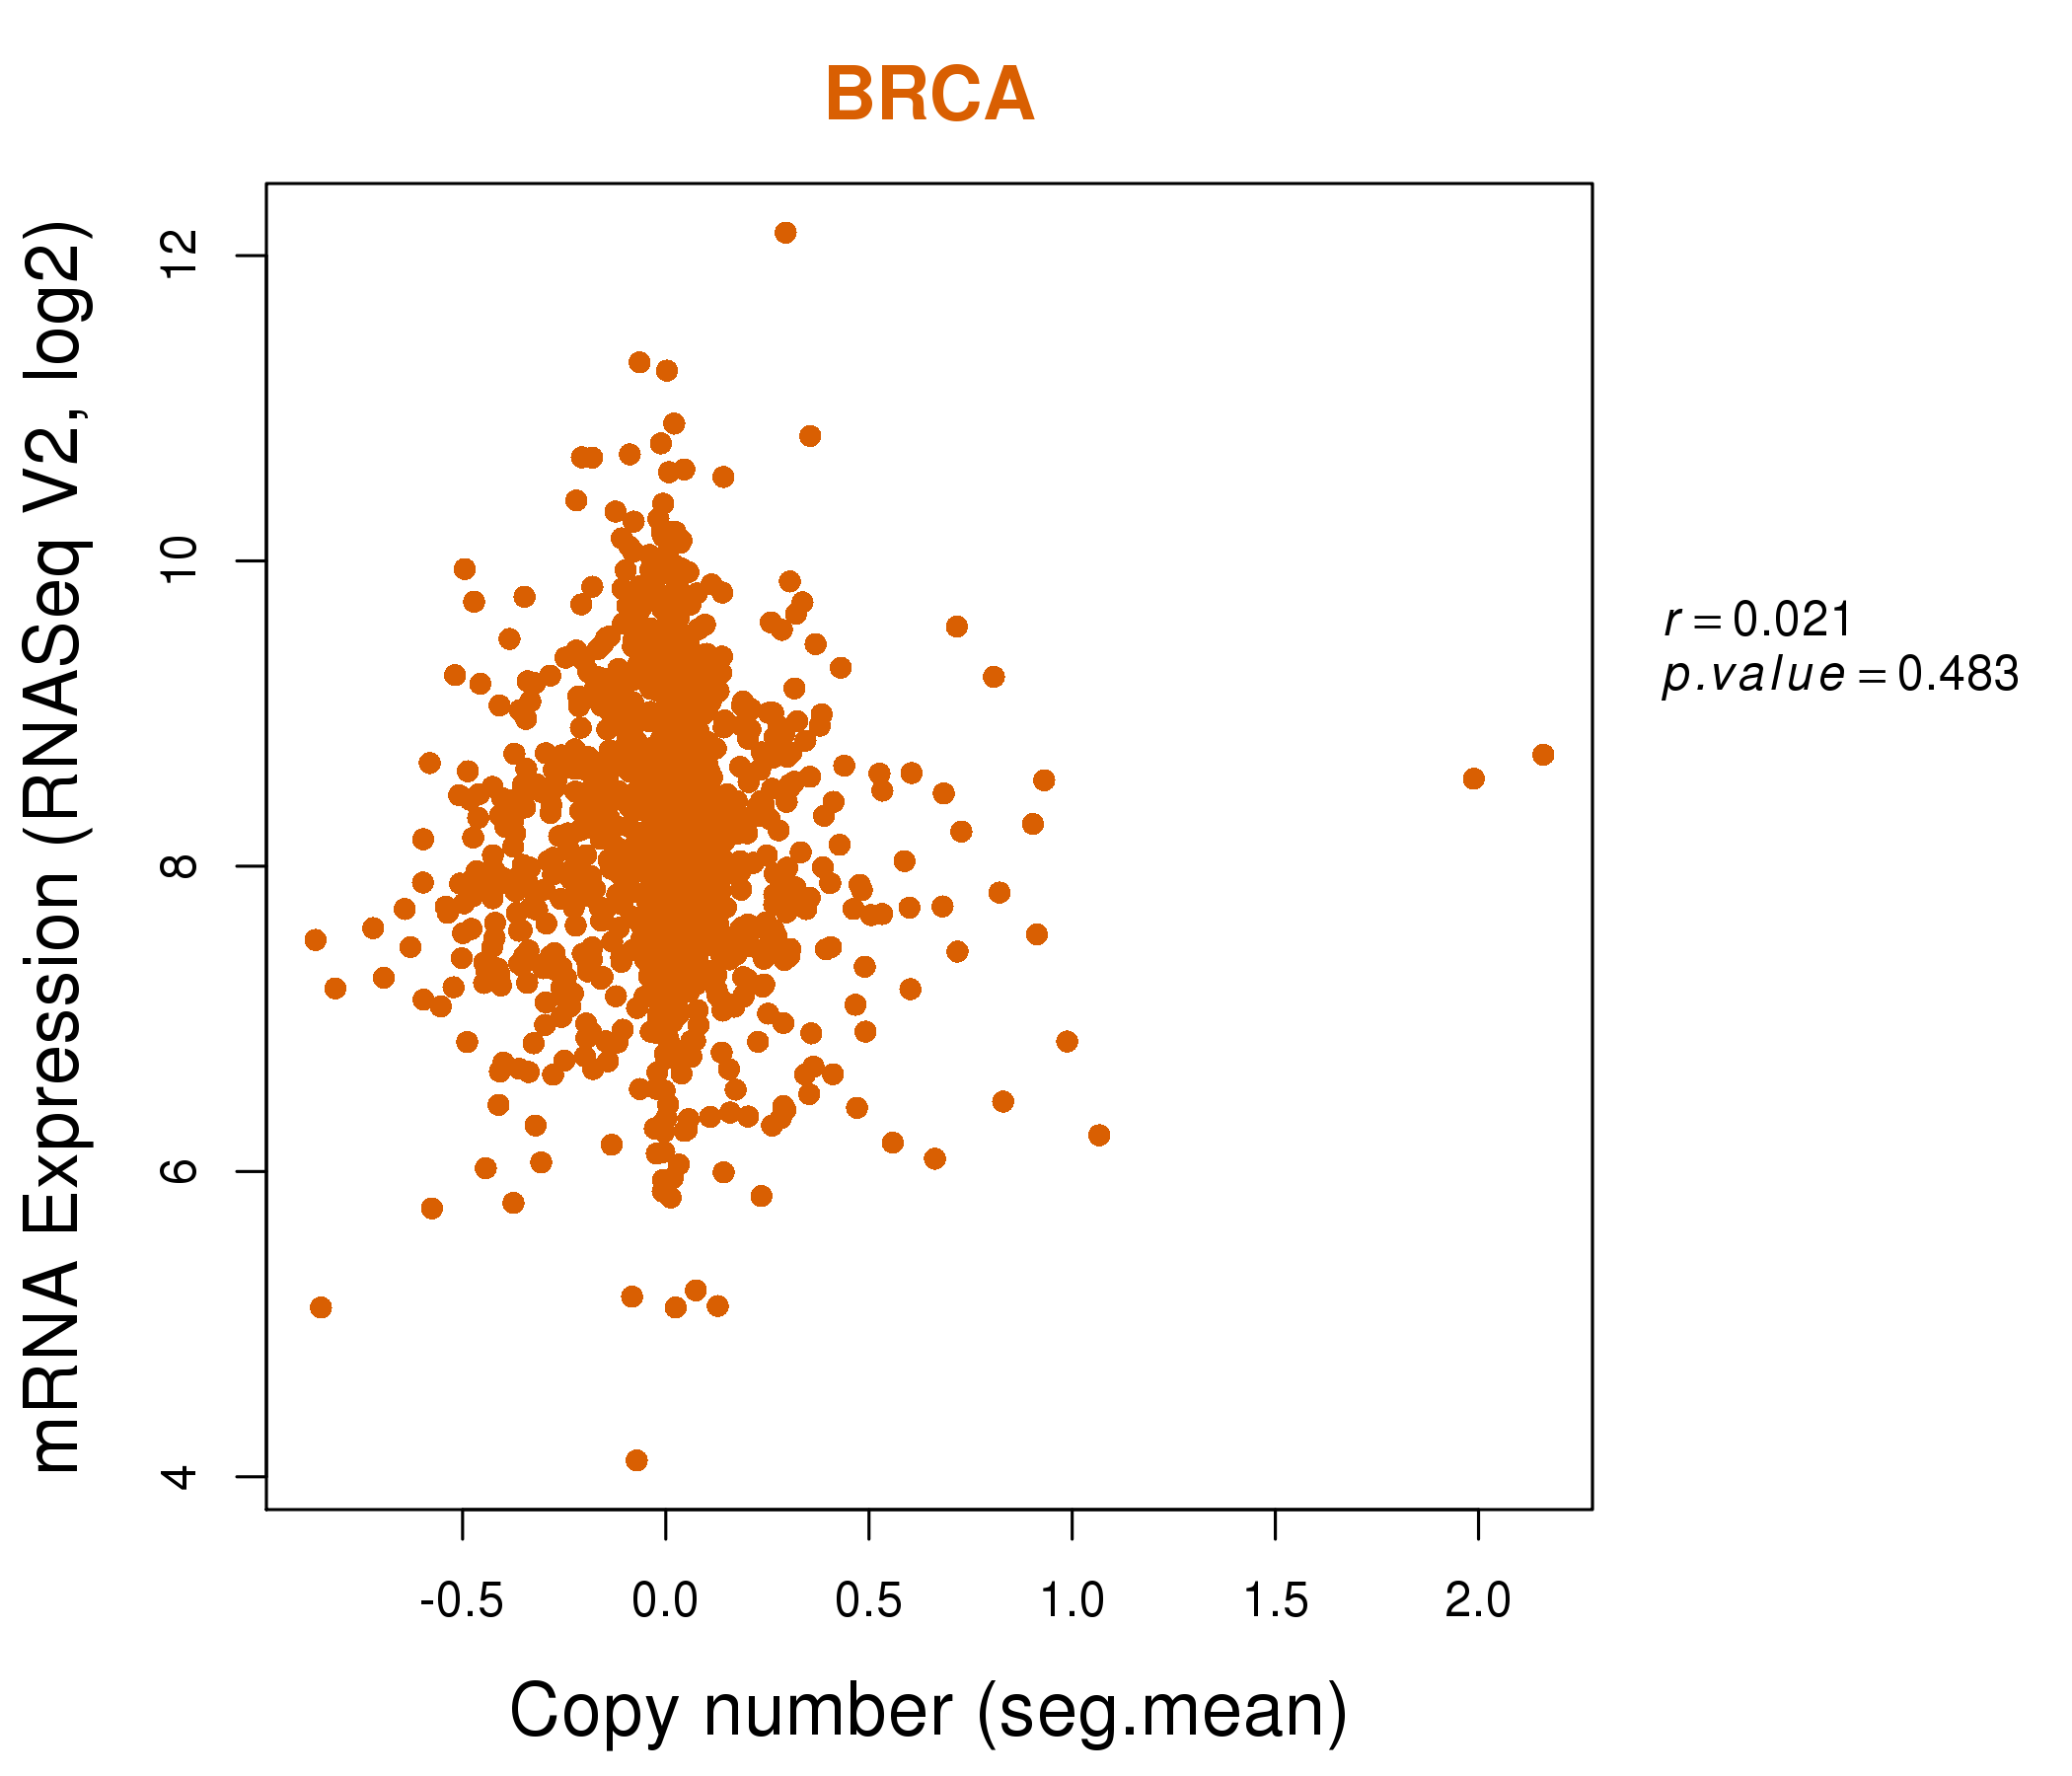
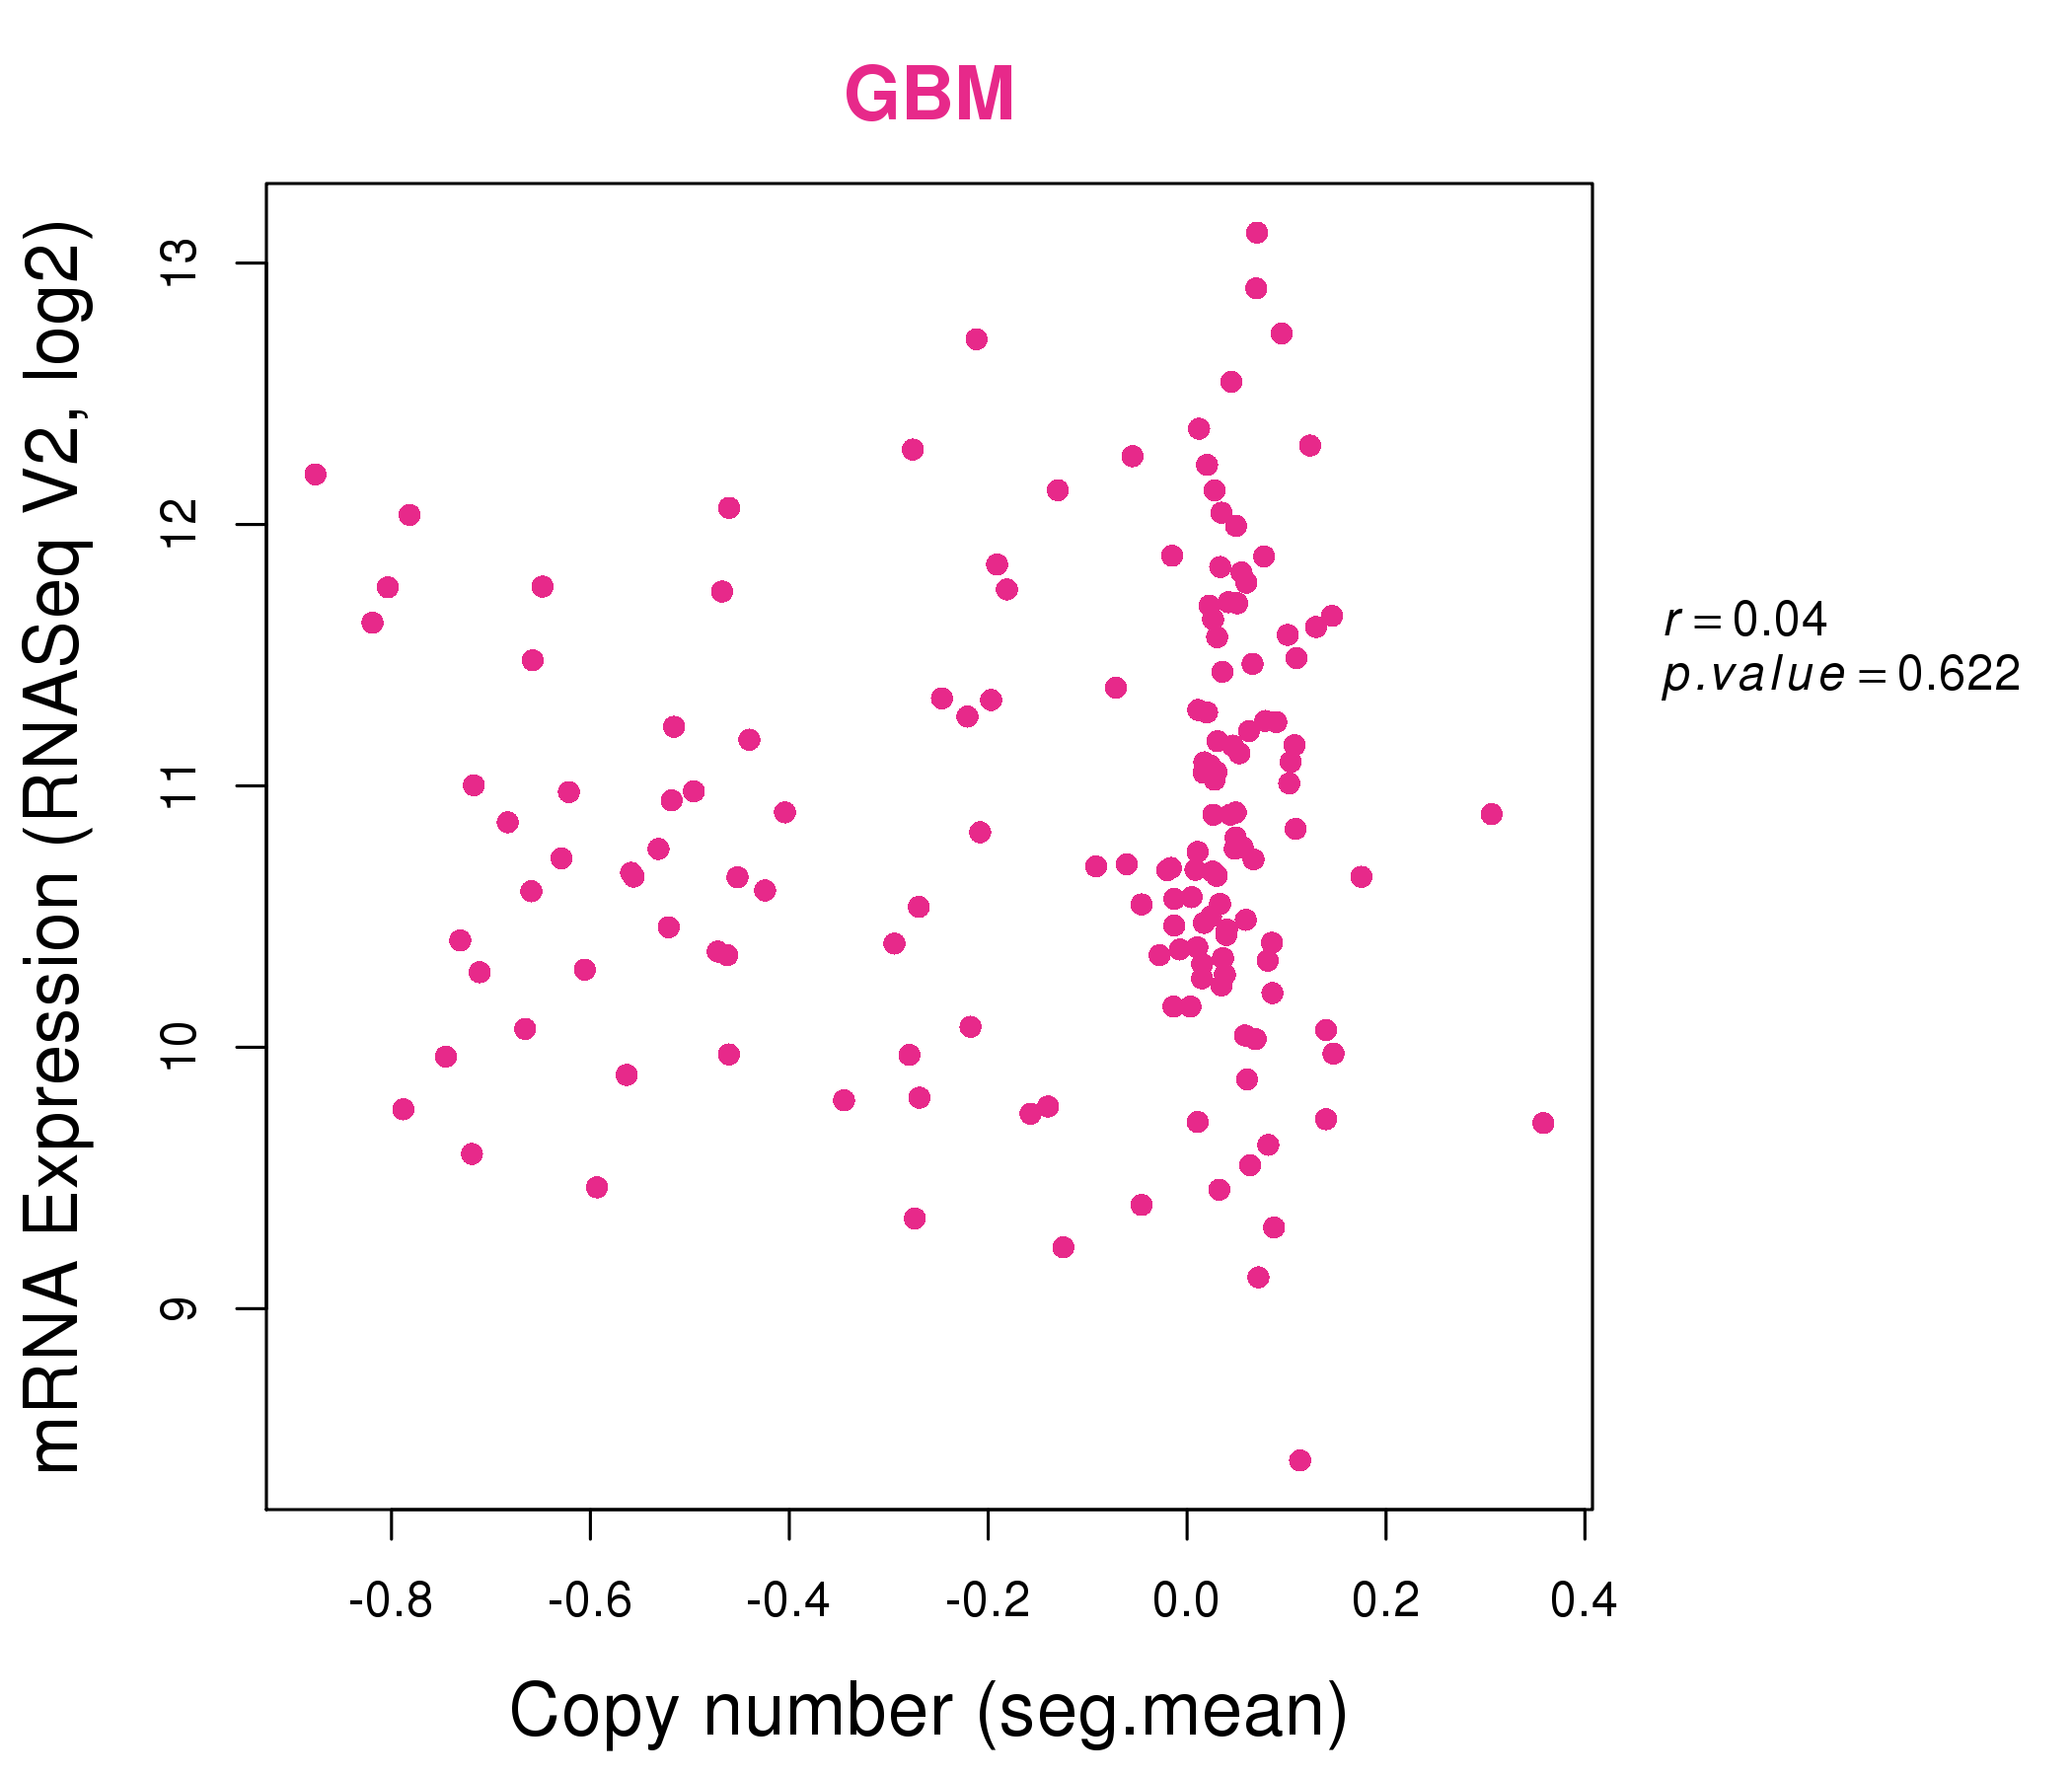
| * This plots show the correlation between CNV and gene expression. |
: Open all plots for all cancer types
 |
|
 |
|
| Top |
| Gene-Gene Network Information |
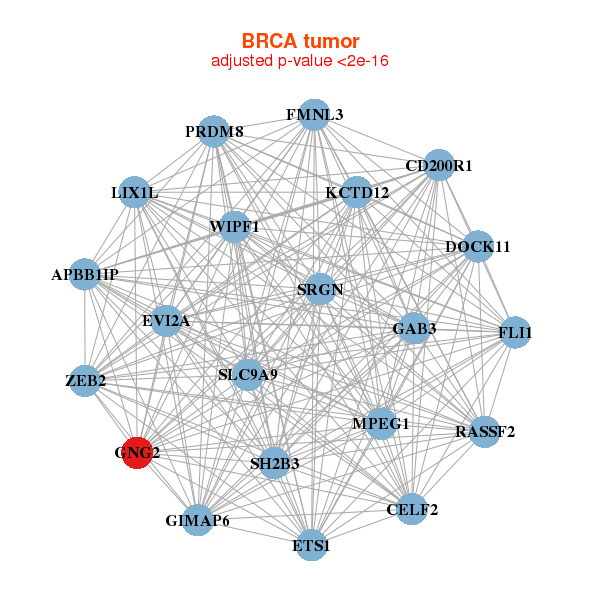
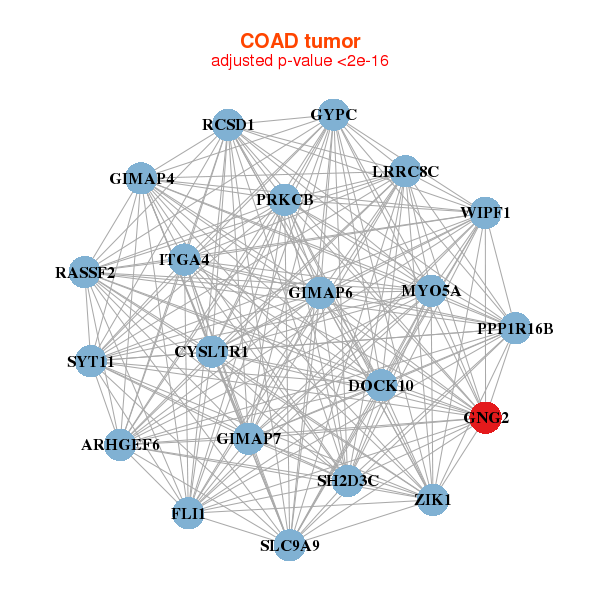
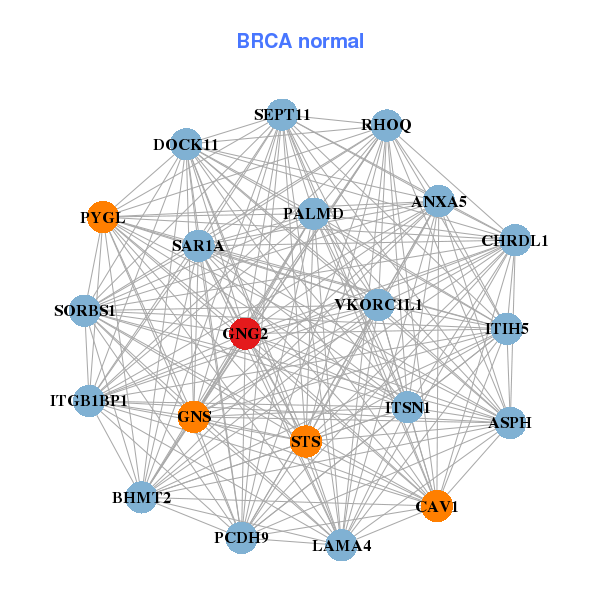
| * Co-Expression network figures were drawn using R package igraph. Only the top 20 genes with the highest correlations were shown. Red circle: input gene, orange circle: cell metabolism gene, sky circle: other gene |
: Open all plots for all cancer types
 |
| ||||
| APBB1IP,CD200R1,CELF2,DOCK11,ETS1,EVI2A,FLI1, FMNL3,GAB3,GIMAP6,GNG2,KCTD12,LIX1L,MPEG1, PRDM8,RASSF2,SH2B3,SLC9A9,SRGN,WIPF1,ZEB2 | ANXA5,ASPH,BHMT2,CAV1,CHRDL1,DOCK11,GNG2, GNS,ITGB1BP1,ITIH5,ITSN1,LAMA4,PALMD,PCDH9, PYGL,RHOQ,SAR1A,SEPT11,SORBS1,STS,VKORC1L1 | ||||
 |
| ||||
| ARHGEF6,CYSLTR1,DOCK10,FLI1,GIMAP4,GIMAP6,GIMAP7, GNG2,GYPC,ITGA4,LRRC8C,MYO5A,PPP1R16B,PRKCB, RASSF2,RCSD1,SH2D3C,SLC9A9,SYT11,WIPF1,ZIK1 | AGTR1,AP1S2,BAI3,BCHE,CADM1,CEND1,CRISPLD1, DDIT4L,DGKB,EID2B,FAM171B,GLRB,GNG2,GYG1, NECAB1,NUDT10,SGCE,SH3BGRL,SSBP2,ZDHHC15,ZDHHC22 |
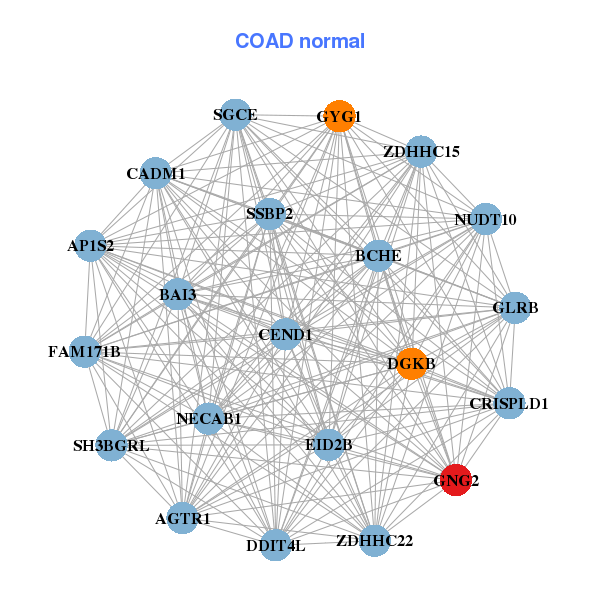
| * Co-Expression network figures were drawn using R package igraph. Only the top 20 genes with the highest correlations were shown. Red circle: input gene, orange circle: cell metabolism gene, sky circle: other gene |
: Open all plots for all cancer types
| Top |
: Open all interacting genes' information including KEGG pathway for all interacting genes from DAVID
| Top |
| Pharmacological Information for GNG2 |
| DB Category | DB Name | DB's ID and Url link |
| Organism-specific databases | PharmGKB | PA28784; -. |
| Organism-specific databases | CTD | 54331; -. |
| * Gene Centered Interaction Network. |
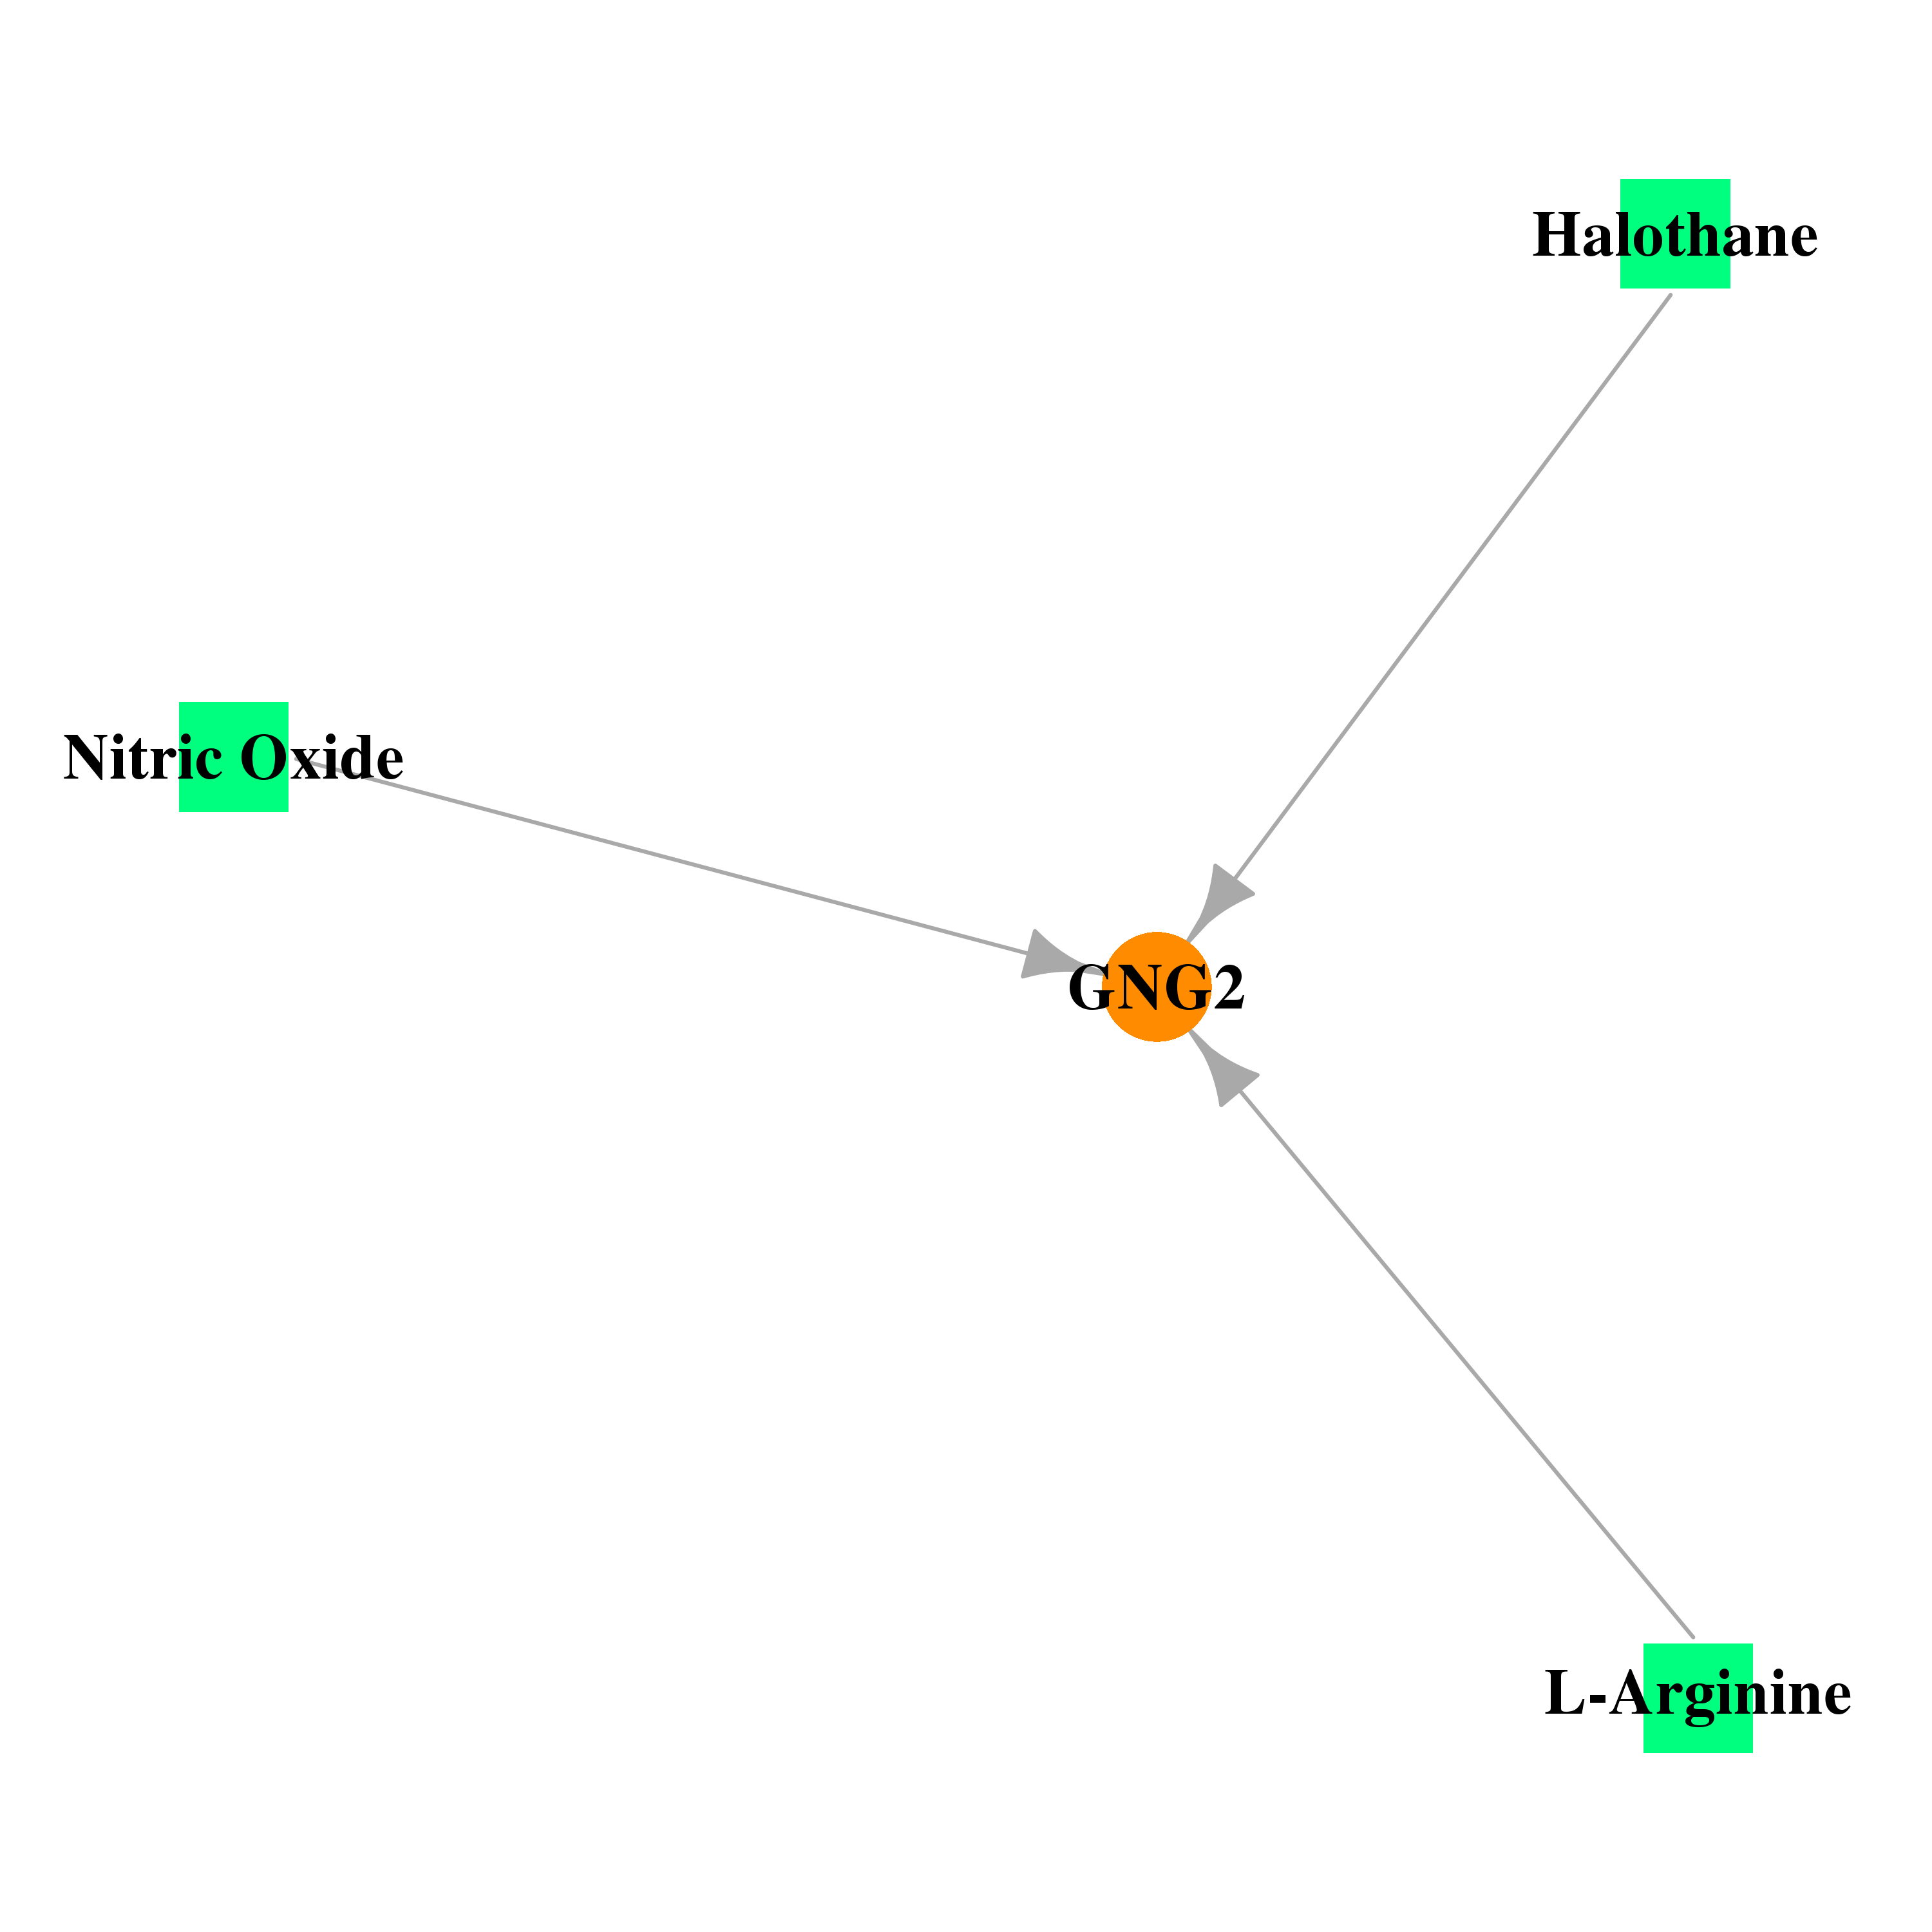 |
| * Drug Centered Interaction Network. |
| DrugBank ID | Target Name | Drug Groups | Generic Name | Drug Centered Network | Drug Structure |
| DB01159 | guanine nucleotide binding protein (G protein), gamma 2 | approved | Halothane | 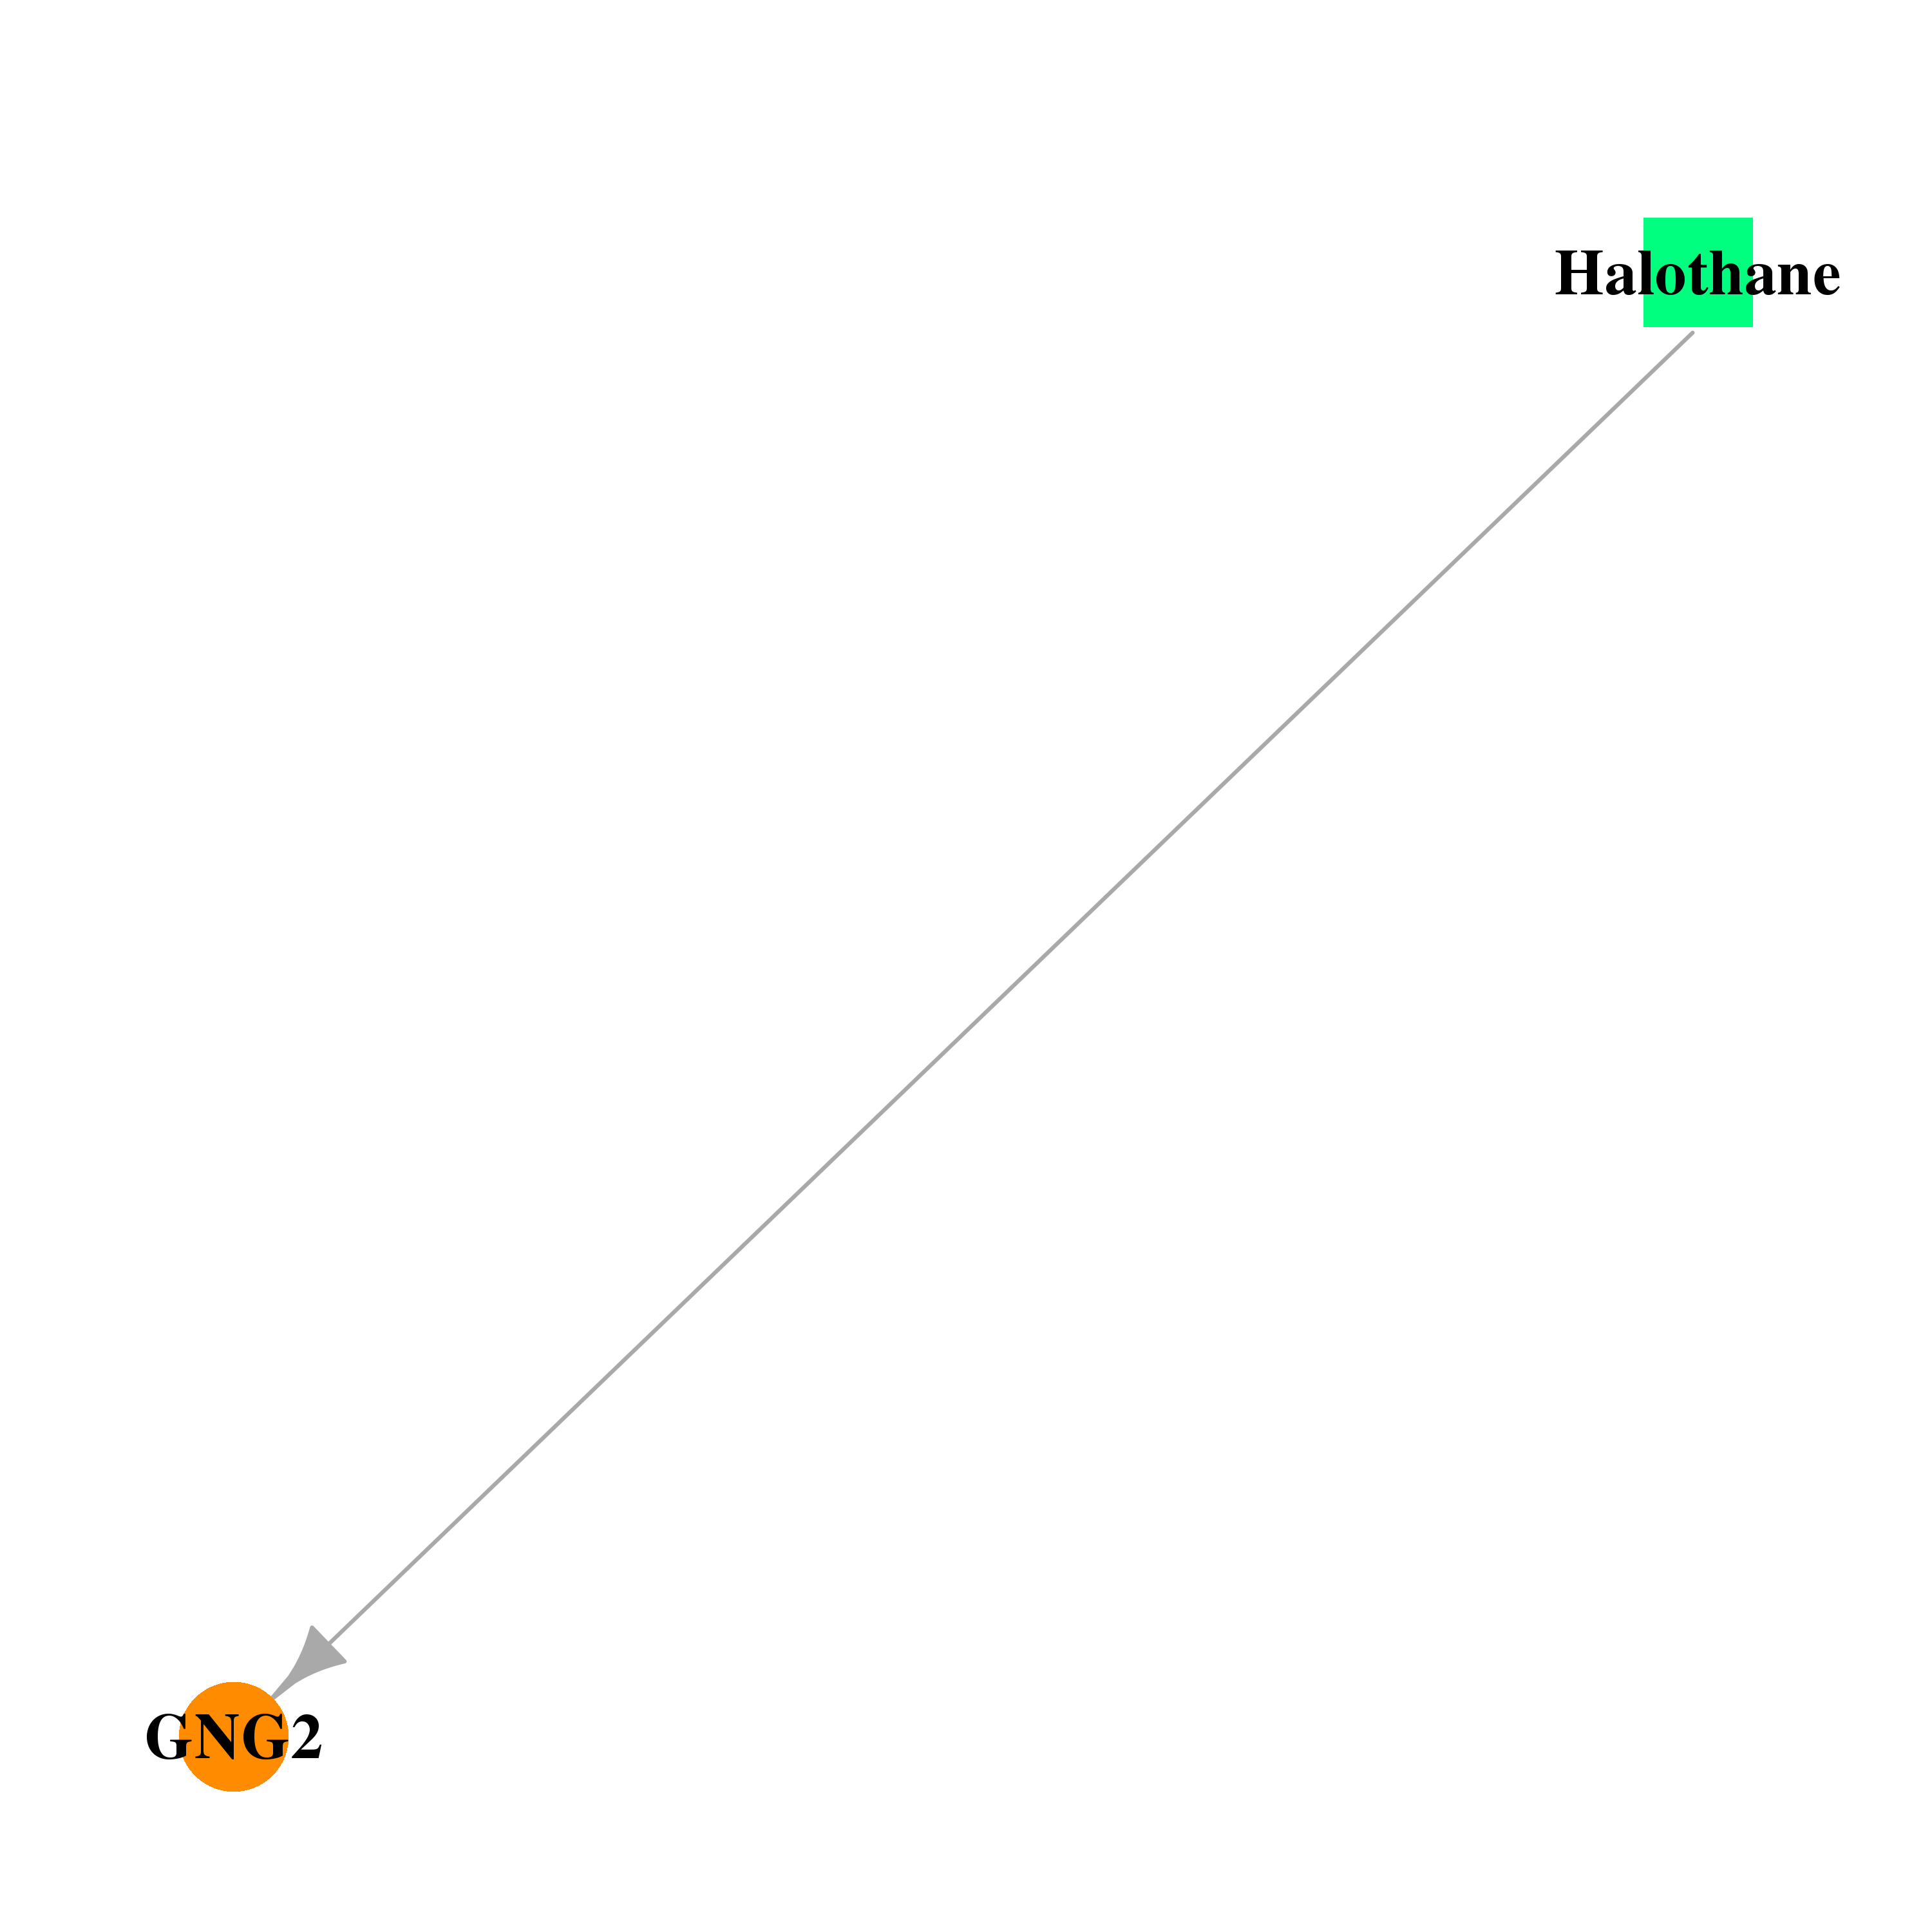 | 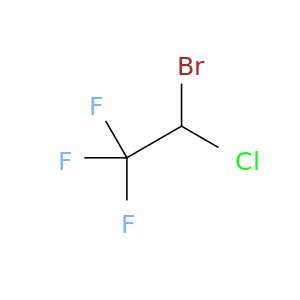 |
| DB00125 | guanine nucleotide binding protein (G protein), gamma 2 | approved; nutraceutical | L-Arginine |  |  |
| DB00435 | guanine nucleotide binding protein (G protein), gamma 2 | approved | Nitric Oxide | 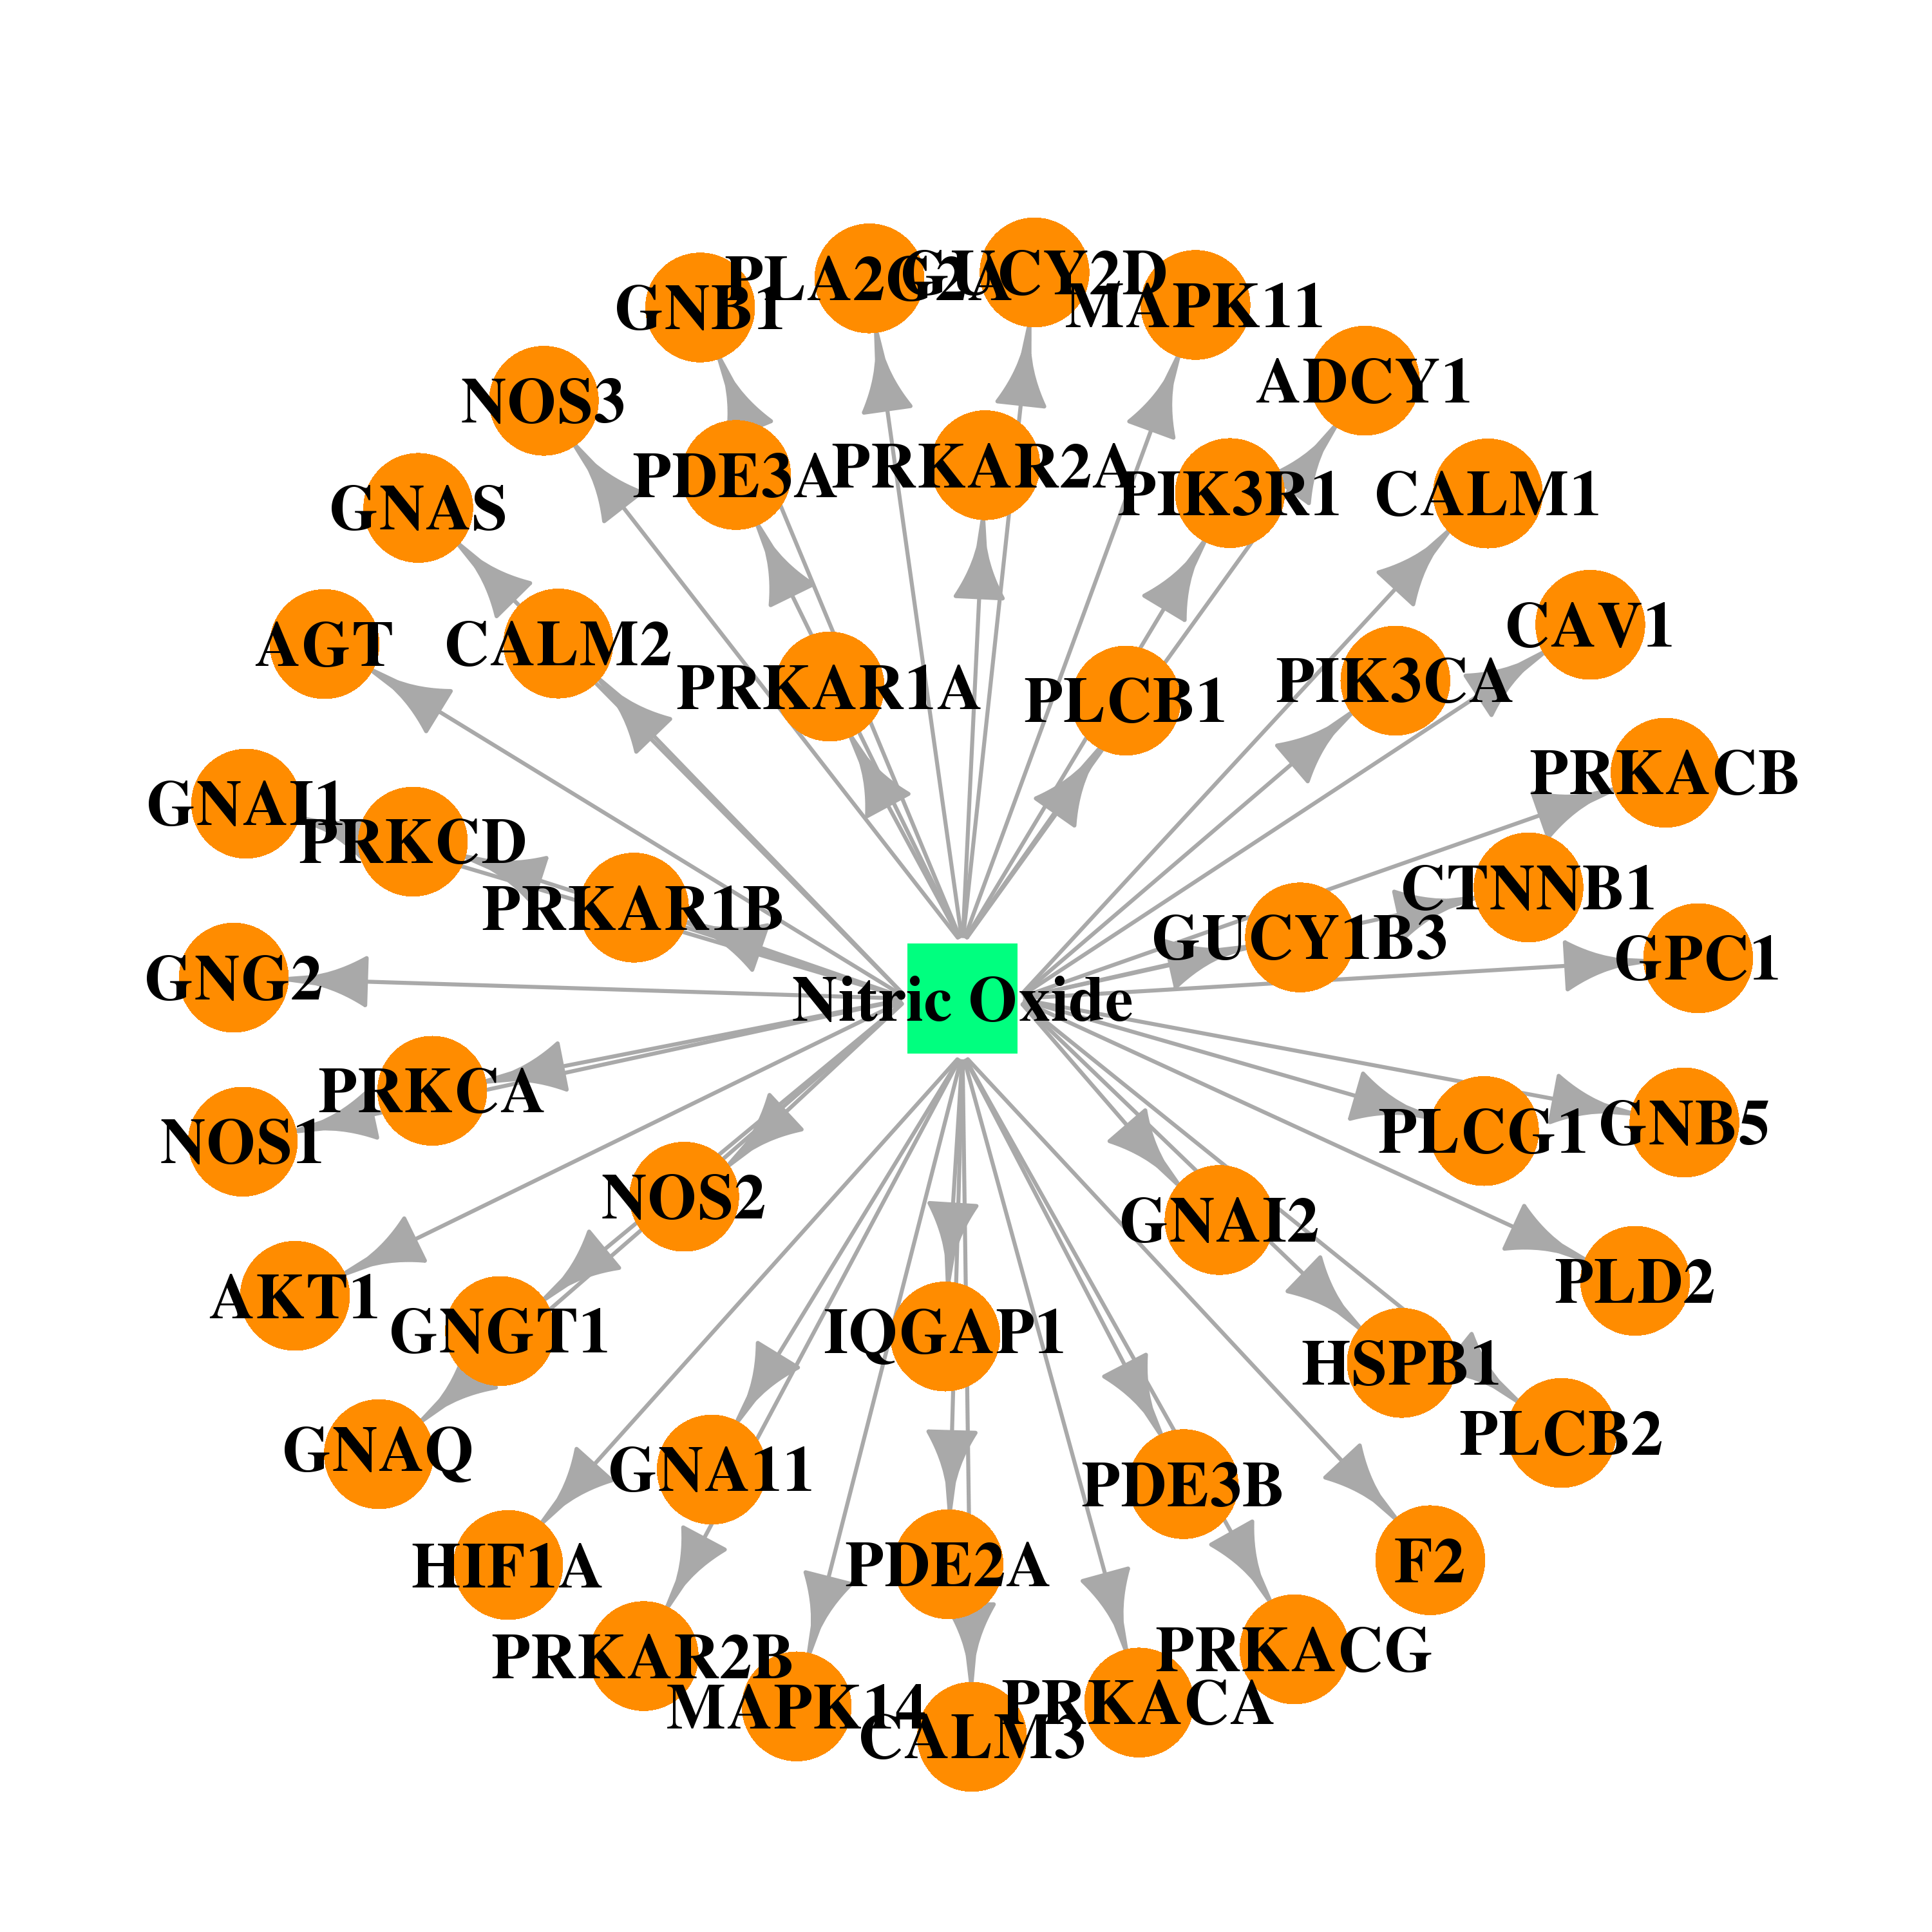 |  |
| Top |
| Cross referenced IDs for GNG2 |
| * We obtained these cross-references from Uniprot database. It covers 150 different DBs, 18 categories. http://www.uniprot.org/help/cross_references_section |
: Open all cross reference information
|
Copyright © 2016-Present - The Univsersity of Texas Health Science Center at Houston @ |