|
|||||||||||||||||||||||||||||||||||||||||||||||||||||||||||||||||||||||||||||||||||||||||||||||||||||||||||||||||||||||||||||||||||||||||||||||||||||||||||||||||||||||||||||||||||||||||||||||||||||||||||||||||||||||||||||||||||||||||||||||||||||||||||||||||||||||||||||||||||||||||||||||||||||||||||||||||||||||||||||||||||||||||||||||||||||||||||||||||||||||||||||||||||||||||||||||||||||||||||||||
| |
| Phenotypic Information (metabolism pathway, cancer, disease, phenome) |
| |
| |
| Gene-Gene Network Information: Co-Expression Network, Interacting Genes & KEGG |
| |
|


| Gene Summary for HAO1 |
| Basic gene info. | Gene symbol | HAO1 |
| Gene name | hydroxyacid oxidase (glycolate oxidase) 1 | |
| Synonyms | GOX|GOX1|HAOX1 | |
| Cytomap | UCSC genome browser: 20p12 | |
| Genomic location | chr20 :7863630-7921093 | |
| Type of gene | protein-coding | |
| RefGenes | NM_017545.2, | |
| Ensembl id | ENSG00000101323 | |
| Description | (S)-2-hydroxy-acid oxidaseglycolate oxidasehydroxyacid oxidase 1 | |
| Modification date | 20141207 | |
| dbXrefs | MIM : 605023 | |
| HGNC : HGNC | ||
| Ensembl : ENSG00000101323 | ||
| HPRD : 05429 | ||
| Vega : OTTHUMG00000031841 | ||
| Protein | UniProt: go to UniProt's Cross Reference DB Table | |
| Expression | CleanEX: HS_HAO1 | |
| BioGPS: 54363 | ||
| Gene Expression Atlas: ENSG00000101323 | ||
| The Human Protein Atlas: ENSG00000101323 | ||
| Pathway | NCI Pathway Interaction Database: HAO1 | |
| KEGG: HAO1 | ||
| REACTOME: HAO1 | ||
| ConsensusPathDB | ||
| Pathway Commons: HAO1 | ||
| Metabolism | MetaCyc: HAO1 | |
| HUMANCyc: HAO1 | ||
| Regulation | Ensembl's Regulation: ENSG00000101323 | |
| miRBase: chr20 :7,863,630-7,921,093 | ||
| TargetScan: NM_017545 | ||
| cisRED: ENSG00000101323 | ||
| Context | iHOP: HAO1 | |
| cancer metabolism search in PubMed: HAO1 | ||
| UCL Cancer Institute: HAO1 | ||
| Assigned class in ccmGDB | C | |
| Top |
| Phenotypic Information for HAO1(metabolism pathway, cancer, disease, phenome) |
| Cancer | CGAP: HAO1 |
| Familial Cancer Database: HAO1 | |
| * This gene is included in those cancer gene databases. |
|
|
|
|
|
|
| |||||||||||||||||||||||||||||||||||||||||||||||||||||||||||||||||||||||||||||||||||||||||||||||||||||||||||||||||||||||||||||||||||||||||||||||||||||||||||||||||||||||||||||||||||||||||||||||||||||||||||||||||||||||||||||||||||||||||||||||||||||||||||||||||||||||||||||||||||||||||||||||||||||||||||||||||||||||||||||||||||||||||||||||||||||||||||||||||||||||||||||||||||||||||||||||||||||||||
Oncogene 1 | Significant driver gene in | ||||||||||||||||||||||||||||||||||||||||||||||||||||||||||||||||||||||||||||||||||||||||||||||||||||||||||||||||||||||||||||||||||||||||||||||||||||||||||||||||||||||||||||||||||||||||||||||||||||||||||||||||||||||||||||||||||||||||||||||||||||||||||||||||||||||||||||||||||||||||||||||||||||||||||||||||||||||||||||||||||||||||||||||||||||||||||||||||||||||||||||||||||||||||||||||||||||||||||||||
| cf) number; DB name 1 Oncogene; http://nar.oxfordjournals.org/content/35/suppl_1/D721.long, 2 Tumor Suppressor gene; https://bioinfo.uth.edu/TSGene/, 3 Cancer Gene Census; http://www.nature.com/nrc/journal/v4/n3/abs/nrc1299.html, 4 CancerGenes; http://nar.oxfordjournals.org/content/35/suppl_1/D721.long, 5 Network of Cancer Gene; http://ncg.kcl.ac.uk/index.php, 1Therapeutic Vulnerabilities in Cancer; http://cbio.mskcc.org/cancergenomics/statius/ |
| KEGG_GLYOXYLATE_AND_DICARBOXYLATE_METABOLISM REACTOME_METABOLISM_OF_AMINO_ACIDS_AND_DERIVATIVES | |
| OMIM | |
| Orphanet | |
| Disease | KEGG Disease: HAO1 |
| MedGen: HAO1 (Human Medical Genetics with Condition) | |
| ClinVar: HAO1 | |
| Phenotype | MGI: HAO1 (International Mouse Phenotyping Consortium) |
| PhenomicDB: HAO1 | |
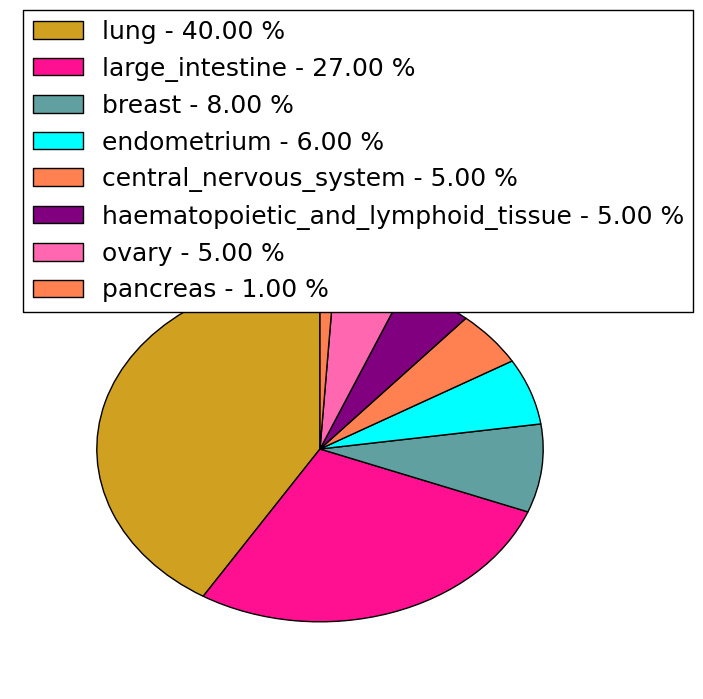
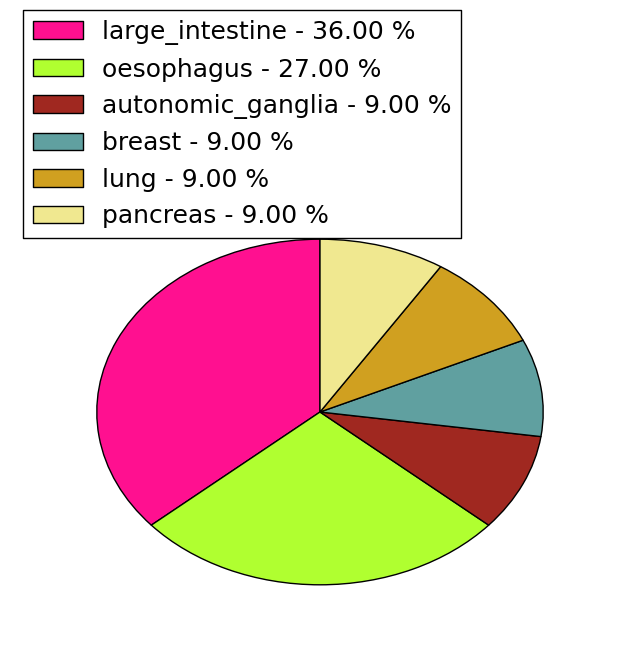
| Mutations for HAO1 |
| * Under tables are showing count per each tissue to give us broad intuition about tissue specific mutation patterns.You can go to the detailed page for each mutation database's web site. |
| - Statistics for Tissue and Mutation type | Top |
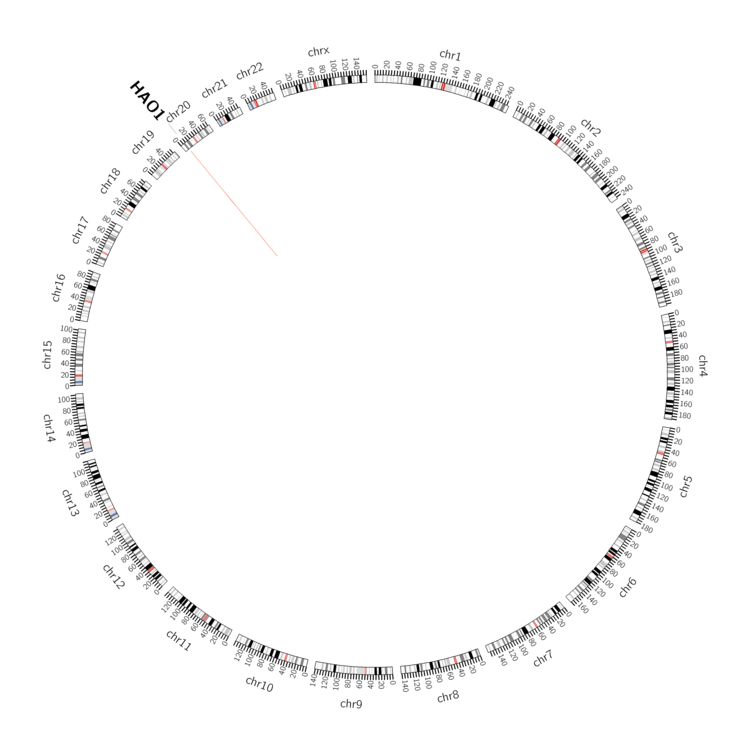 |
| - For Inter-chromosomal Variations |
| There's no inter-chromosomal structural variation. |
| - For Intra-chromosomal Variations |
| * Intra-chromosomal variantions includes 'intrachromosomal amplicon to amplicon', 'intrachromosomal amplicon to non-amplified dna', 'intrachromosomal deletion', 'intrachromosomal fold-back inversion', 'intrachromosomal inversion', 'intrachromosomal tandem duplication', 'Intrachromosomal unknown type', 'intrachromosomal with inverted orientation', 'intrachromosomal with non-inverted orientation'. |
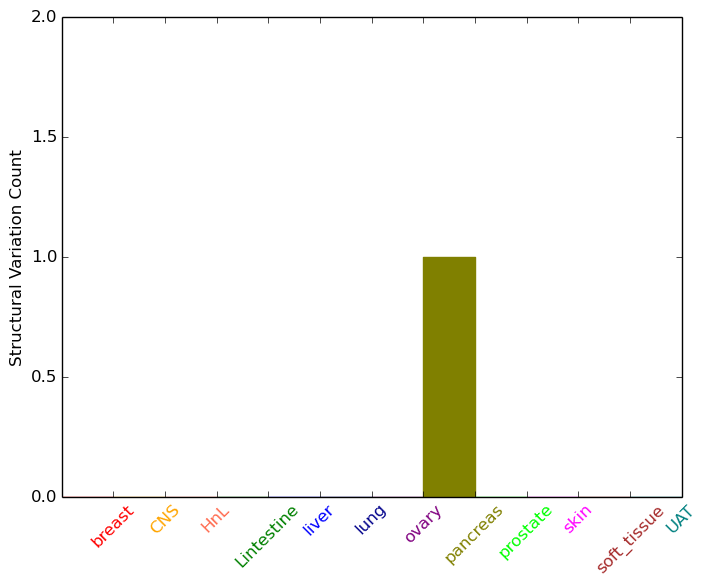 |
| Sample | Symbol_a | Chr_a | Start_a | End_a | Symbol_b | Chr_b | Start_b | End_b |
| pancreas | HAO1 | chr20 | 7902358 | 7902378 | HAO1 | chr20 | 7902905 | 7902925 |
| cf) Tissue number; Tissue name (1;Breast, 2;Central_nervous_system, 3;Haematopoietic_and_lymphoid_tissue, 4;Large_intestine, 5;Liver, 6;Lung, 7;Ovary, 8;Pancreas, 9;Prostate, 10;Skin, 11;Soft_tissue, 12;Upper_aerodigestive_tract) |
| * From mRNA Sanger sequences, Chitars2.0 arranged chimeric transcripts. This table shows HAO1 related fusion information. |
| ID | Head Gene | Tail Gene | Accession | Gene_a | qStart_a | qEnd_a | Chromosome_a | tStart_a | tEnd_a | Gene_a | qStart_a | qEnd_a | Chromosome_a | tStart_a | tEnd_a |
| Top |
| Mutation type/ Tissue ID | brca | cns | cerv | endome | haematopo | kidn | Lintest | liver | lung | ns | ovary | pancre | prost | skin | stoma | thyro | urina | |||
| Total # sample | 1 | 1 | 1 | 1 | ||||||||||||||||
| GAIN (# sample) | 1 | 1 | 1 | |||||||||||||||||
| LOSS (# sample) | 1 |
| cf) Tissue ID; Tissue type (1; Breast, 2; Central_nervous_system, 3; Cervix, 4; Endometrium, 5; Haematopoietic_and_lymphoid_tissue, 6; Kidney, 7; Large_intestine, 8; Liver, 9; Lung, 10; NS, 11; Ovary, 12; Pancreas, 13; Prostate, 14; Skin, 15; Stomach, 16; Thyroid, 17; Urinary_tract) |
| Top |
|
 |
| Top |
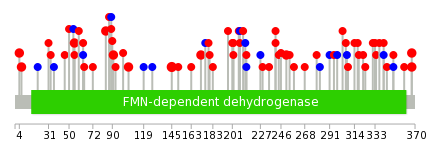
| Stat. for Non-Synonymous SNVs (# total SNVs=59) | (# total SNVs=11) |
 |  |
(# total SNVs=0) | (# total SNVs=0) |
| Top |
| * When you move the cursor on each content, you can see more deailed mutation information on the Tooltip. Those are primary_site,primary_histology,mutation(aa),pubmedID. |
| GRCh37 position | Mutation(aa) | Unique sampleID count |
| chr20:7864254-7864254 | p.V367F | 4 |
| chr20:7894923-7894923 | p.R145W | 3 |
| chr20:7915257-7915257 | p.R55W | 2 |
| chr20:7921060-7921060 | p.R4W | 2 |
| chr20:7886918-7886918 | p.D202N | 2 |
| chr20:7886801-7886801 | p.G241S | 2 |
| chr20:7915169-7915169 | p.R84H | 2 |
| chr20:7864303-7864303 | p.Q350H | 2 |
| chr20:7895041-7895041 | p.M105I | 2 |
| chr20:7886880-7886880 | p.D214E | 2 |
| Top |
|
 |
| Point Mutation/ Tissue ID | 1 | 2 | 3 | 4 | 5 | 6 | 7 | 8 | 9 | 10 | 11 | 12 | 13 | 14 | 15 | 16 | 17 | 18 | 19 | 20 |
| # sample | 1 | 4 | 1 | 12 | 2 | 7 | 1 | 10 | 6 | 3 | 1 | 7 | 9 | 4 | ||||||
| # mutation | 1 | 4 | 1 | 10 | 2 | 7 | 1 | 10 | 6 | 3 | 1 | 6 | 9 | 4 | ||||||
| nonsynonymous SNV | 1 | 4 | 1 | 6 | 2 | 5 | 7 | 6 | 3 | 1 | 5 | 4 | 4 | |||||||
| synonymous SNV | 4 | 2 | 1 | 3 | 1 | 5 |
| cf) Tissue ID; Tissue type (1; BLCA[Bladder Urothelial Carcinoma], 2; BRCA[Breast invasive carcinoma], 3; CESC[Cervical squamous cell carcinoma and endocervical adenocarcinoma], 4; COAD[Colon adenocarcinoma], 5; GBM[Glioblastoma multiforme], 6; Glioma Low Grade, 7; HNSC[Head and Neck squamous cell carcinoma], 8; KICH[Kidney Chromophobe], 9; KIRC[Kidney renal clear cell carcinoma], 10; KIRP[Kidney renal papillary cell carcinoma], 11; LAML[Acute Myeloid Leukemia], 12; LUAD[Lung adenocarcinoma], 13; LUSC[Lung squamous cell carcinoma], 14; OV[Ovarian serous cystadenocarcinoma ], 15; PAAD[Pancreatic adenocarcinoma], 16; PRAD[Prostate adenocarcinoma], 17; SKCM[Skin Cutaneous Melanoma], 18:STAD[Stomach adenocarcinoma], 19:THCA[Thyroid carcinoma], 20:UCEC[Uterine Corpus Endometrial Carcinoma]) |
| Top |
| * We represented just top 10 SNVs. When you move the cursor on each content, you can see more deailed mutation information on the Tooltip. Those are primary_site, primary_histology, mutation(aa), pubmedID. |
| Genomic Position | Mutation(aa) | Unique sampleID count |
| chr20:7894842 | p.R172C | 3 |
| chr20:7895041 | p.M105I | 2 |
| chr20:7866373 | p.L306I | 1 |
| chr20:7894996 | p.R227R | 1 |
| chr20:7866489 | p.E91K | 1 |
| chr20:7915207 | p.A31G | 1 |
| chr20:7886883 | p.R28G | 1 |
| chr20:7920988 | p.L304R | 1 |
| chr20:7866374 | p.I213I | 1 |
| chr20:7894999 | p.G90S | 1 |
| * Copy number data were extracted from TCGA using R package TCGA-Assembler. The URLs of all public data files on TCGA DCC data server were gathered on Jan-05-2015. Function ProcessCNAData in TCGA-Assembler package was used to obtain gene-level copy number value which is calculated as the average copy number of the genomic region of a gene. |
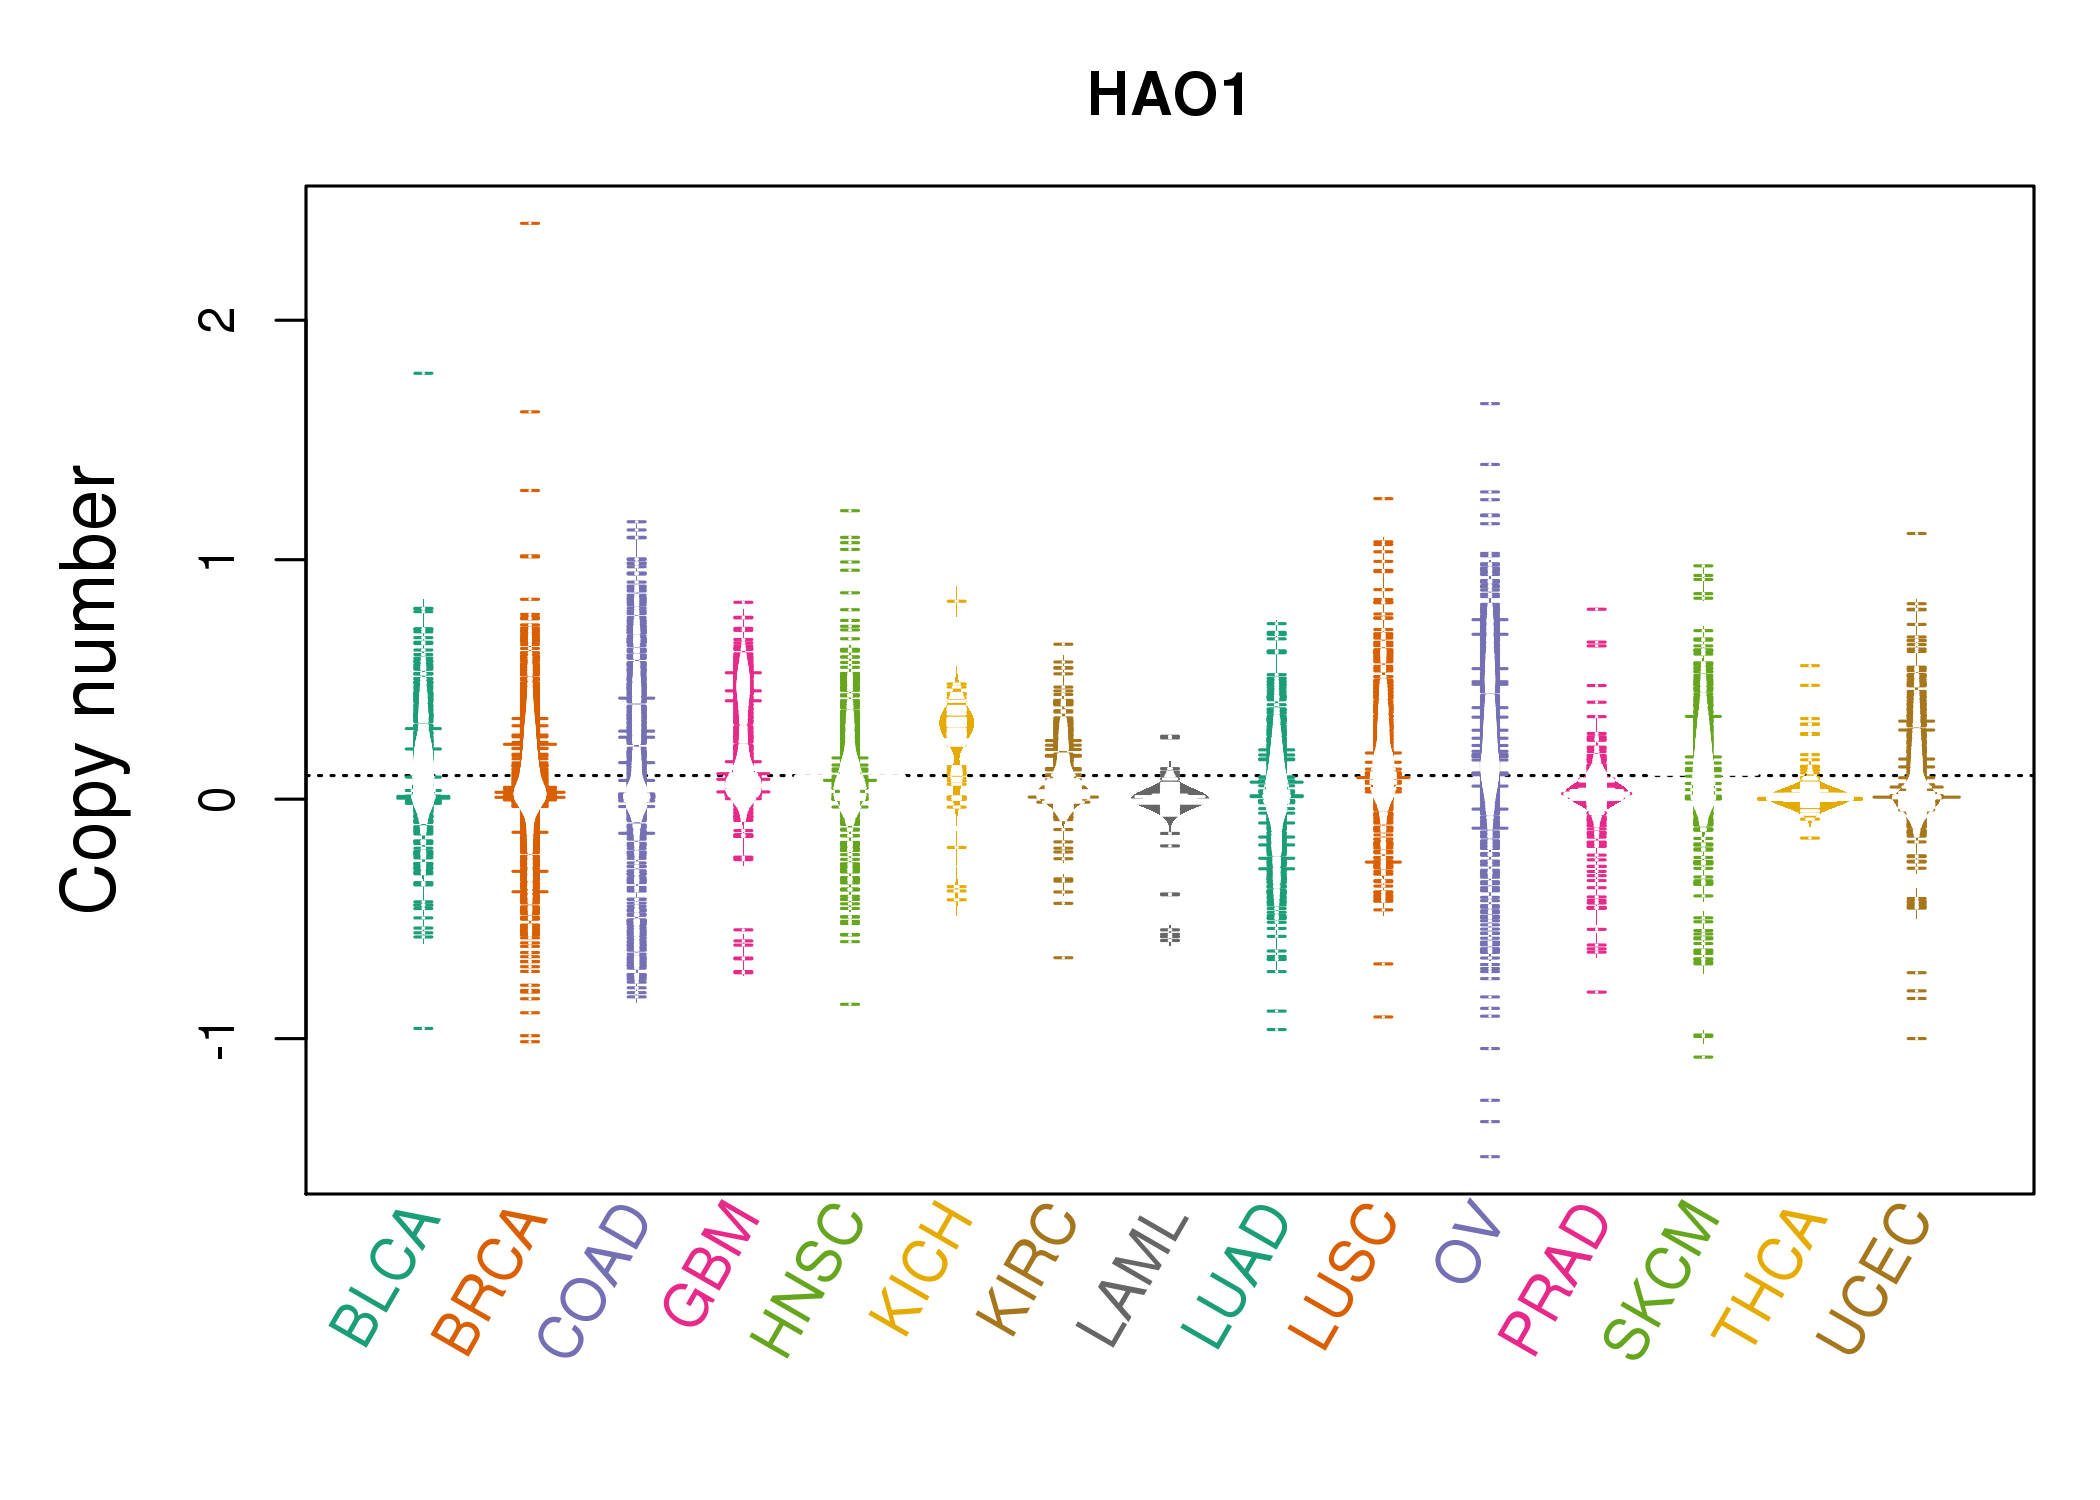 |
| cf) Tissue ID[Tissue type]: BLCA[Bladder Urothelial Carcinoma], BRCA[Breast invasive carcinoma], CESC[Cervical squamous cell carcinoma and endocervical adenocarcinoma], COAD[Colon adenocarcinoma], GBM[Glioblastoma multiforme], Glioma Low Grade, HNSC[Head and Neck squamous cell carcinoma], KICH[Kidney Chromophobe], KIRC[Kidney renal clear cell carcinoma], KIRP[Kidney renal papillary cell carcinoma], LAML[Acute Myeloid Leukemia], LUAD[Lung adenocarcinoma], LUSC[Lung squamous cell carcinoma], OV[Ovarian serous cystadenocarcinoma ], PAAD[Pancreatic adenocarcinoma], PRAD[Prostate adenocarcinoma], SKCM[Skin Cutaneous Melanoma], STAD[Stomach adenocarcinoma], THCA[Thyroid carcinoma], UCEC[Uterine Corpus Endometrial Carcinoma] |
| Top |
| Gene Expression for HAO1 |
| * CCLE gene expression data were extracted from CCLE_Expression_Entrez_2012-10-18.res: Gene-centric RMA-normalized mRNA expression data. |
 |
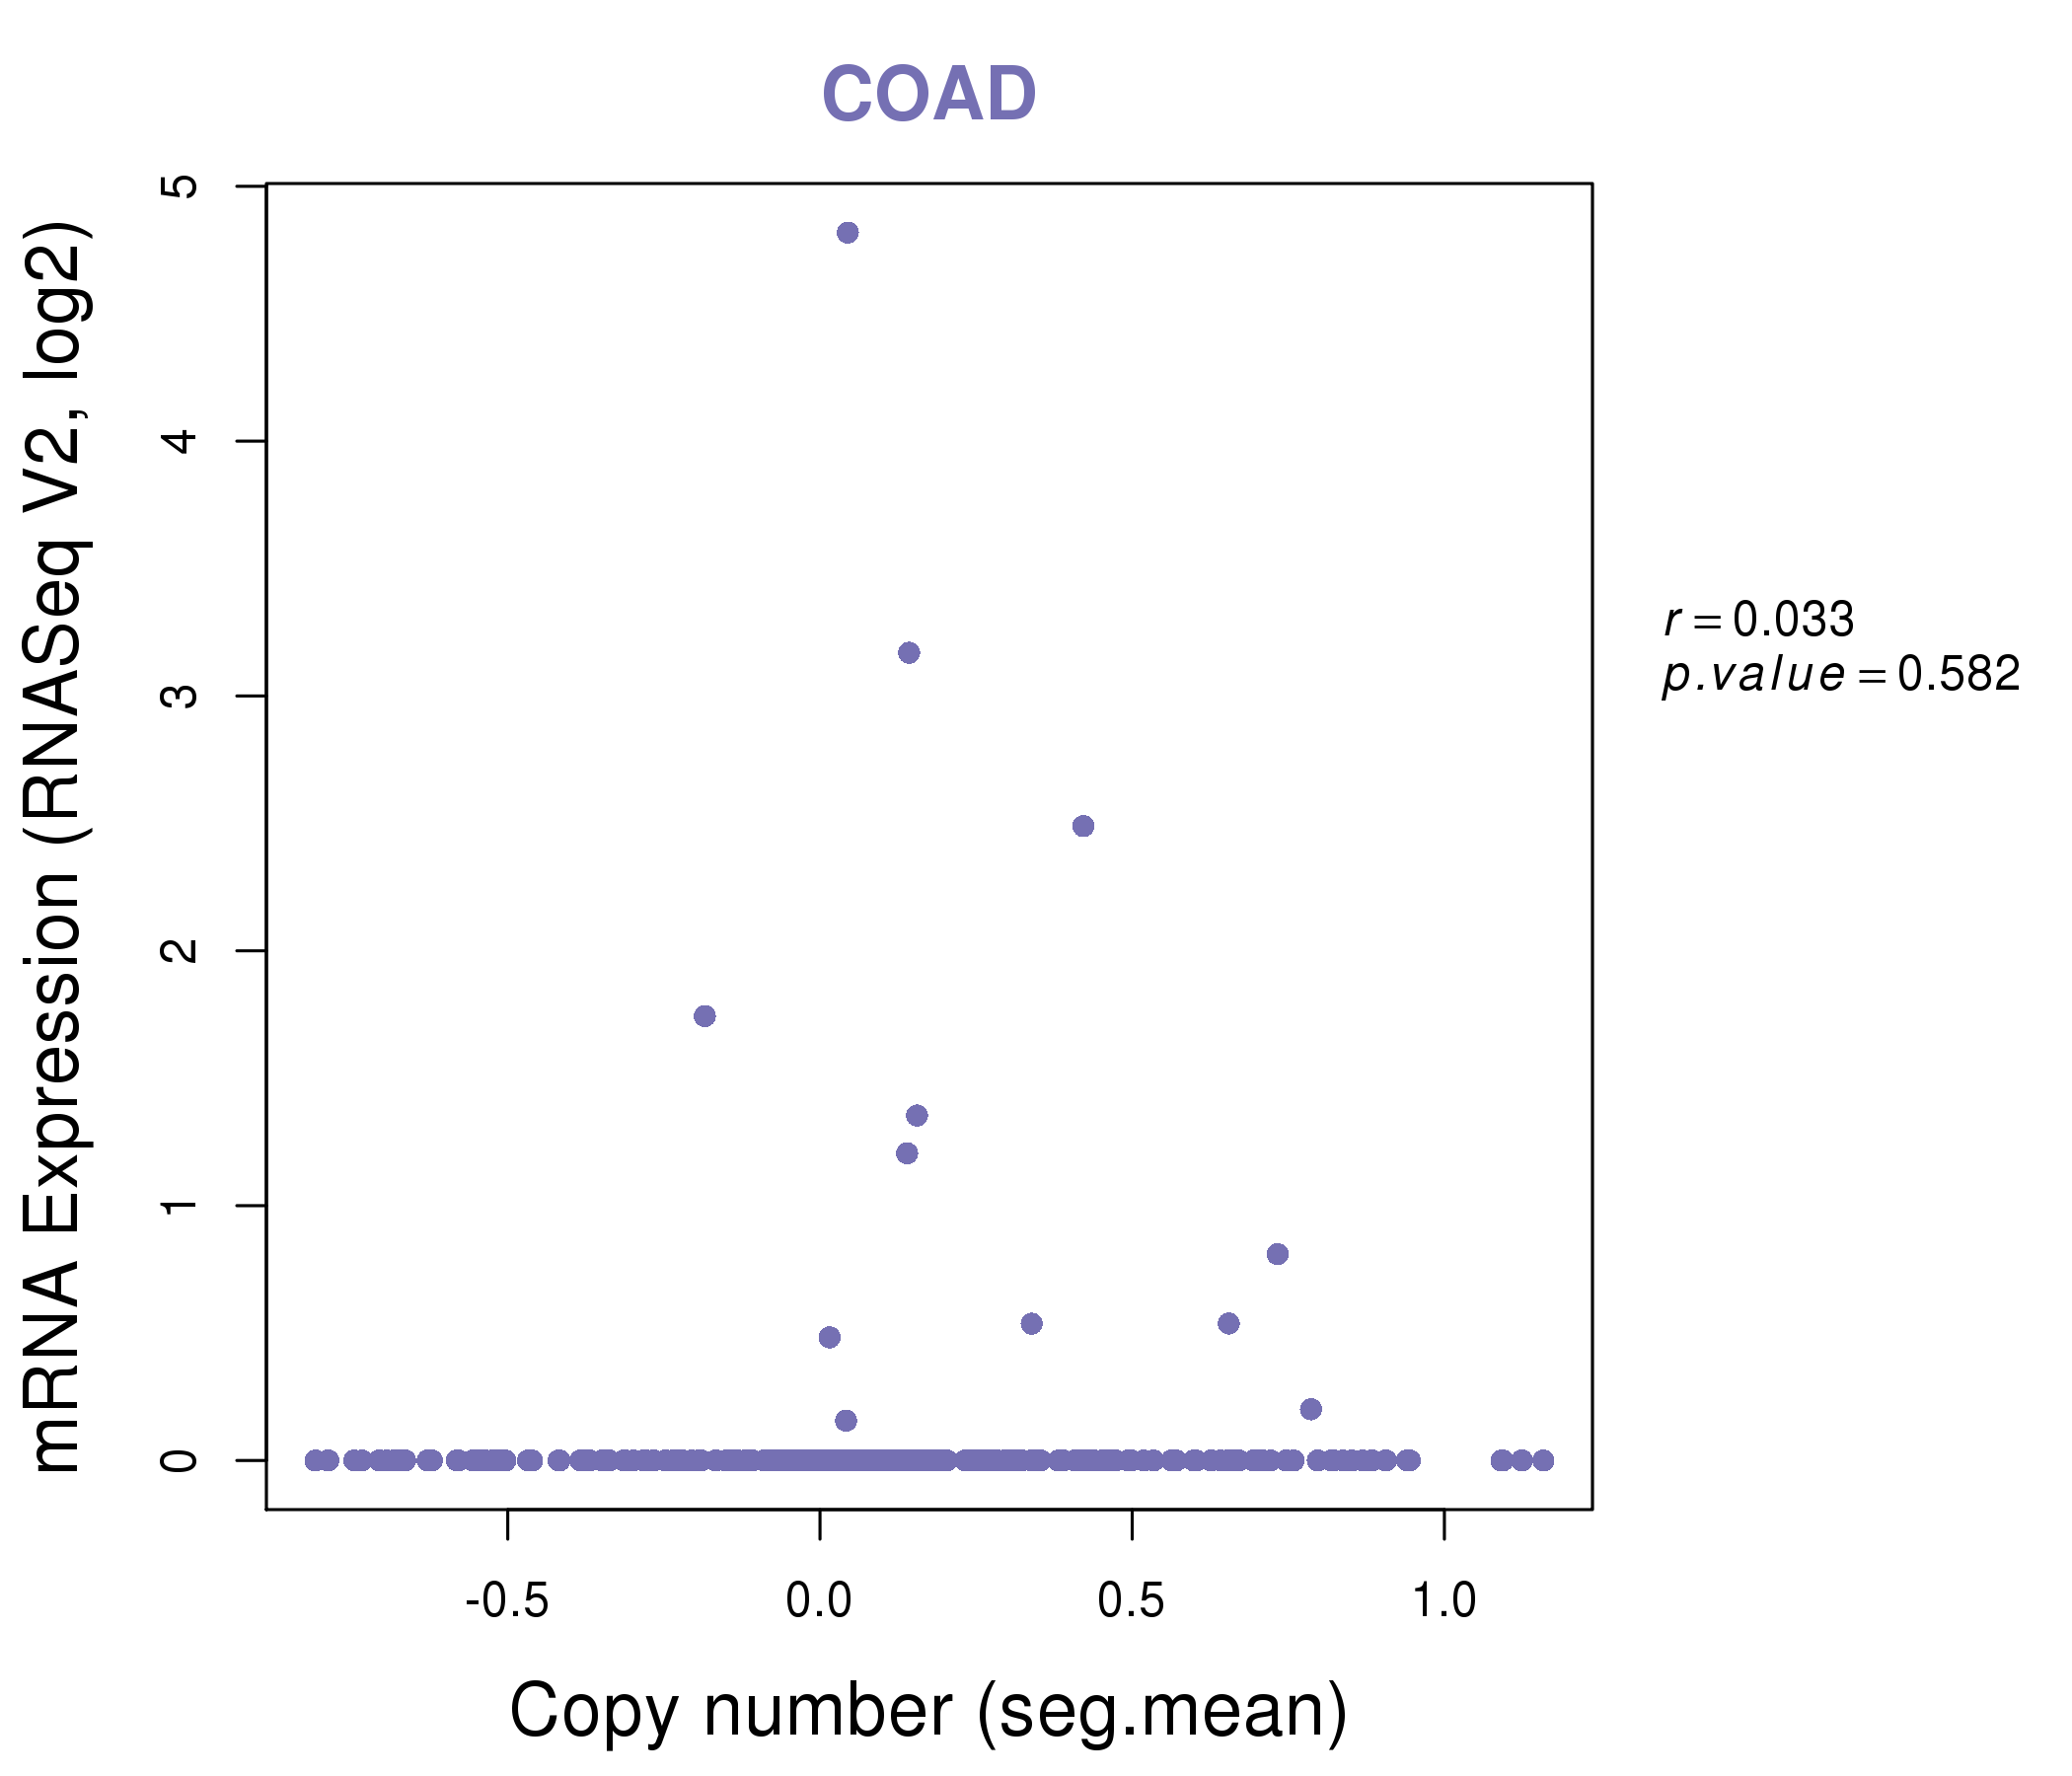
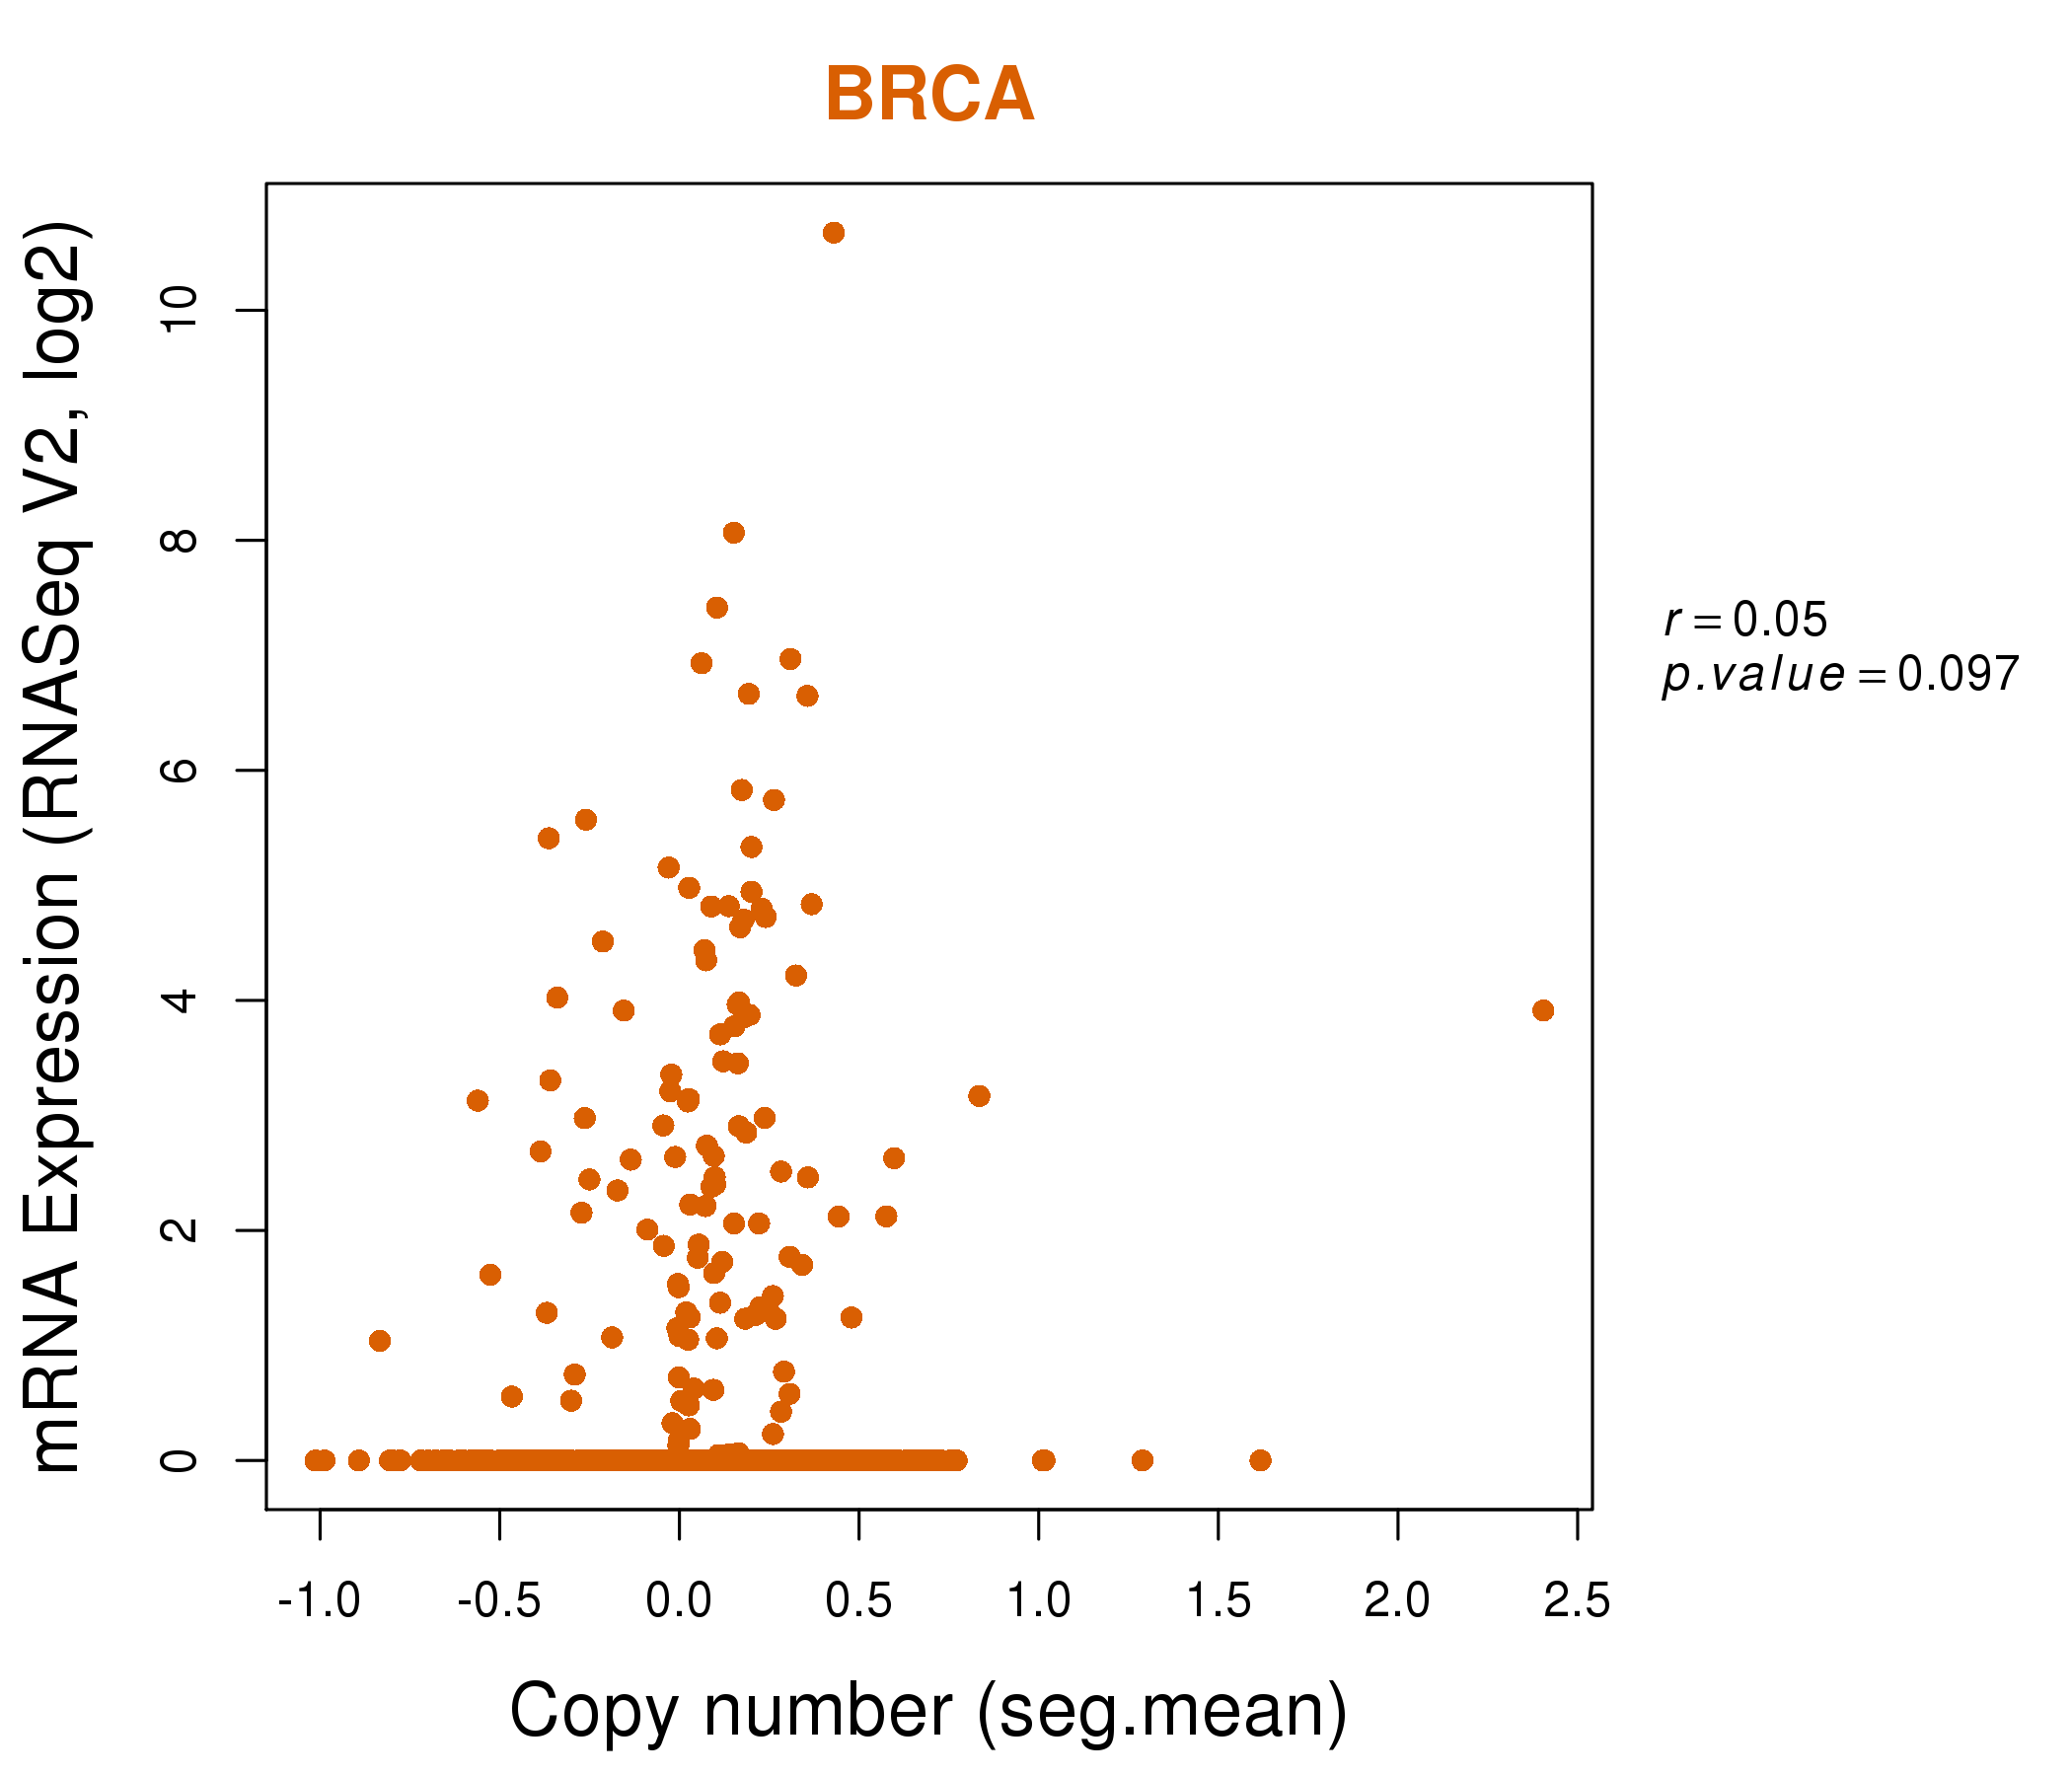
| * Normalized gene expression data of RNASeqV2 was extracted from TCGA using R package TCGA-Assembler. The URLs of all public data files on TCGA DCC data server were gathered at Jan-05-2015. Only eight cancer types have enough normal control samples for differential expression analysis. (t test, adjusted p<0.05 (using Benjamini-Hochberg FDR)) |
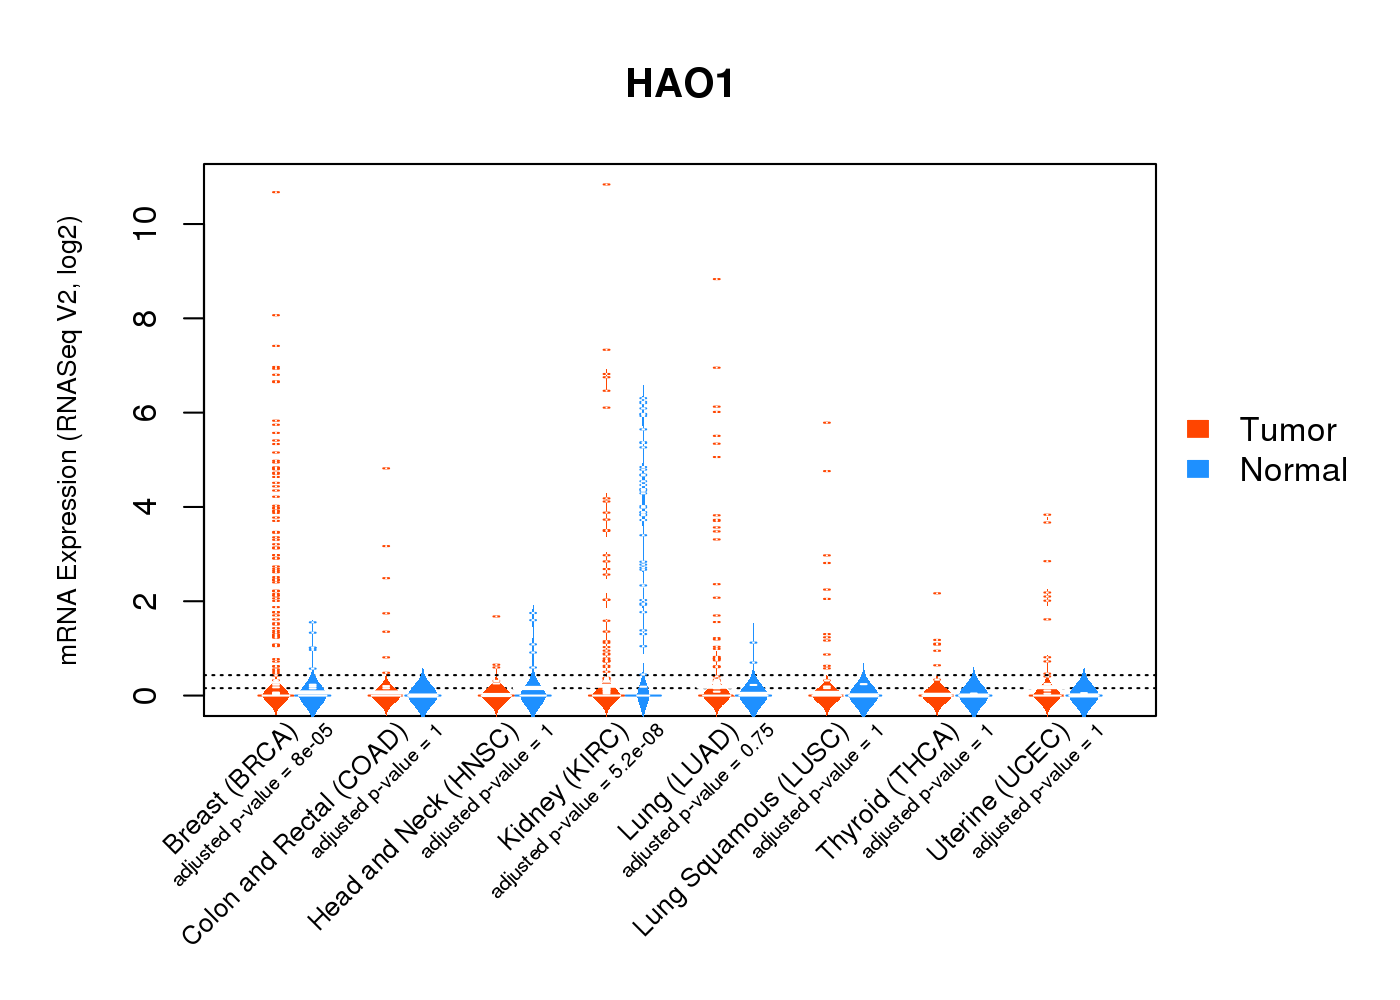 |
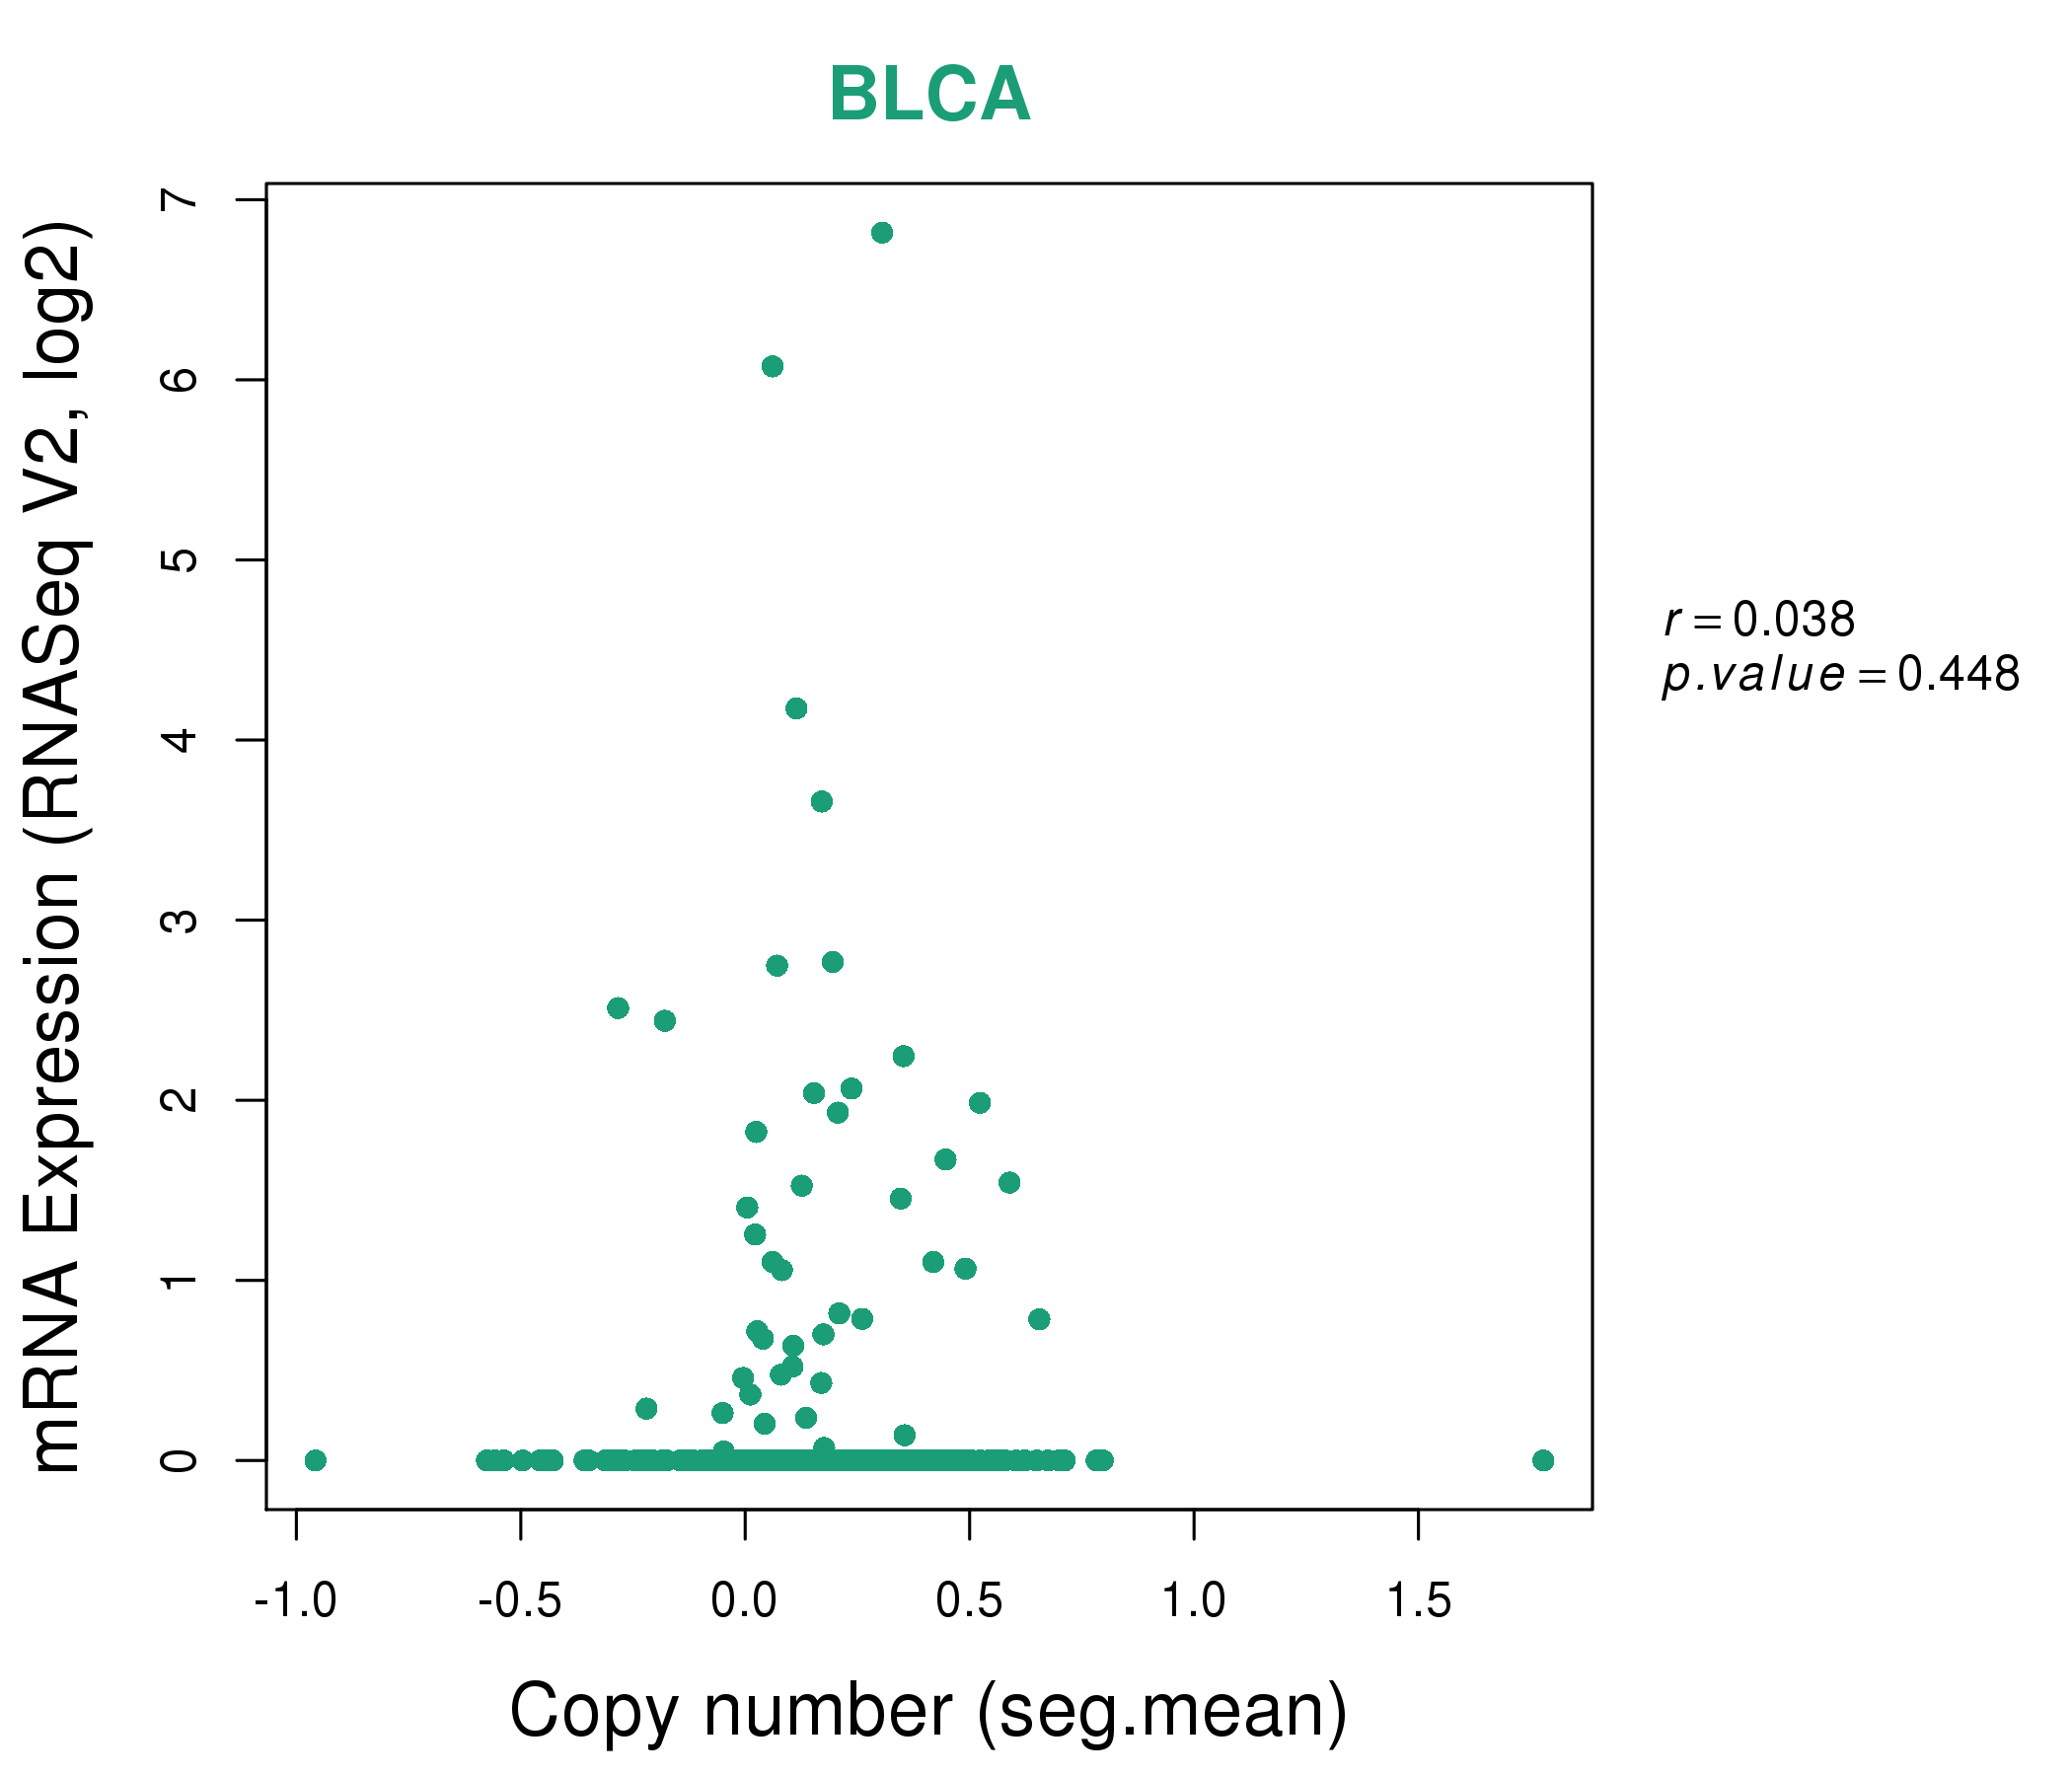
| Top |
| * This plots show the correlation between CNV and gene expression. |
: Open all plots for all cancer types
 |
|
 |
|

| Top |
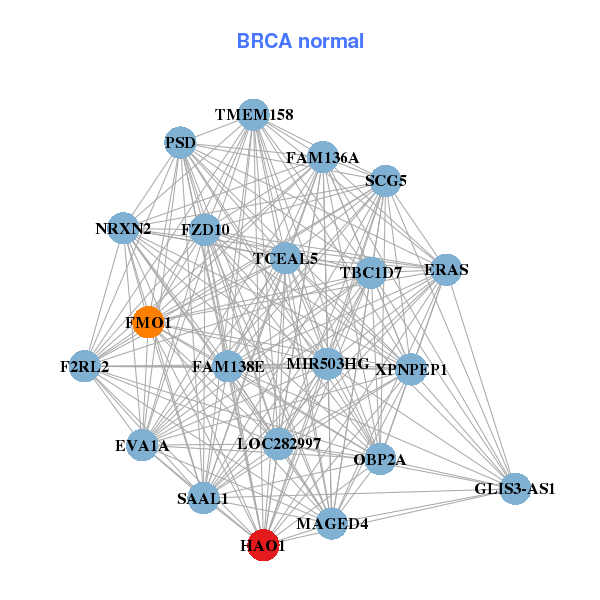
| Gene-Gene Network Information |
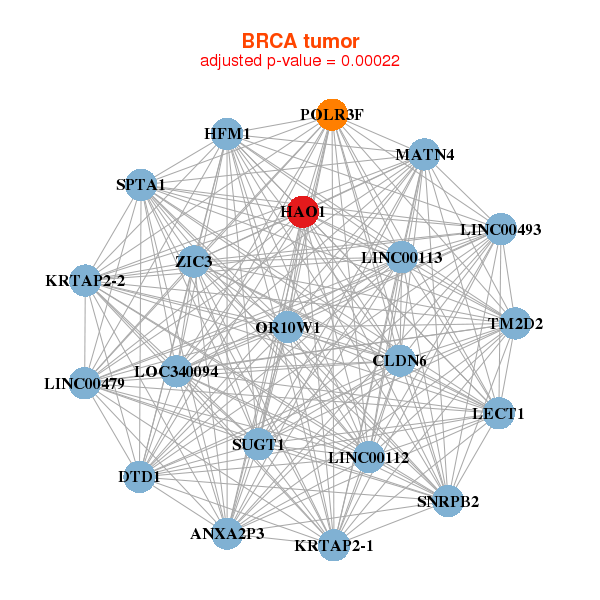
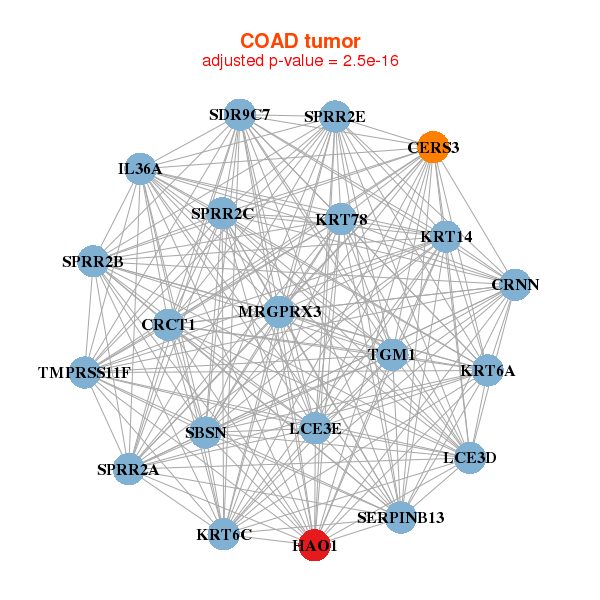
| * Co-Expression network figures were drawn using R package igraph. Only the top 20 genes with the highest correlations were shown. Red circle: input gene, orange circle: cell metabolism gene, sky circle: other gene |
: Open all plots for all cancer types
 |
| ||||
| ANXA2P3,LINC00479,CLDN6,DTD1,HAO1,HFM1,KRTAP2-1, KRTAP2-2,LECT1,LOC340094,LINC00493,MATN4,LINC00112,LINC00113, OR10W1,POLR3F,SNRPB2,SPTA1,SUGT1,TM2D2,ZIC3 | GLIS3-AS1,ERAS,F2RL2,FAM136A,FAM138E,EVA1A,FMO1, FZD10,HAO1,LOC282997,MAGED4,MIR503HG,NRXN2,OBP2A, PSD,SAAL1,SCG5,TBC1D7,TCEAL5,TMEM158,XPNPEP1 | ||||
 |
| ||||
| CRCT1,CRNN,HAO1,IL36A,KRT14,KRT6A,KRT6C, KRT78,CERS3,LCE3D,LCE3E,MRGPRX3,SBSN,SDR9C7, SERPINB13,SPRR2A,SPRR2B,SPRR2C,SPRR2E,TGM1,TMPRSS11F | ALB,APCS,APOA2,C3P1,C8A,CFHR2,CFHR5, CYP4A22,DNAJB8,F13B,F9,FGG,HAO1,KIR3DP1, KRTAP4-11,KRTAP5-3,LECT2,LOC100129935,LINC00160,OR1N1,SLC17A2 |
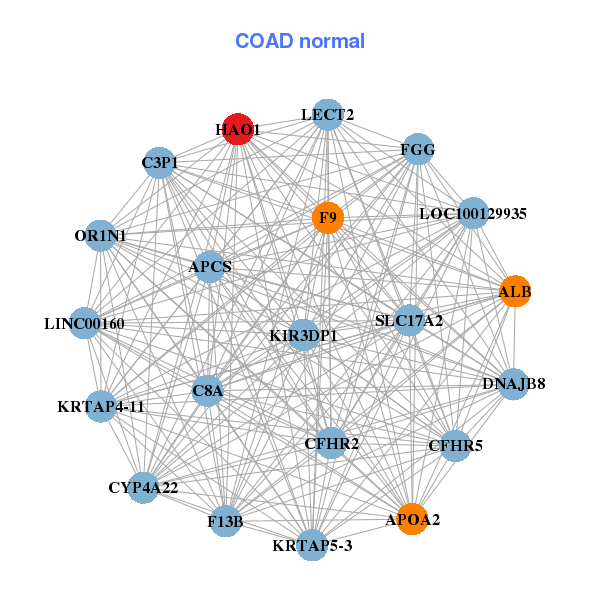
| * Co-Expression network figures were drawn using R package igraph. Only the top 20 genes with the highest correlations were shown. Red circle: input gene, orange circle: cell metabolism gene, sky circle: other gene |
: Open all plots for all cancer types
| Top |
: Open all interacting genes' information including KEGG pathway for all interacting genes from DAVID
| Top |
| Pharmacological Information for HAO1 |
| DB Category | DB Name | DB's ID and Url link |
| * Gene Centered Interaction Network. |
 |
| * Drug Centered Interaction Network. |
| DrugBank ID | Target Name | Drug Groups | Generic Name | Drug Centered Network | Drug Structure |
| DB02164 | hydroxyacid oxidase (glycolate oxidase) 1 | experimental | N-Sulfo-Flavin Mononucleotide | 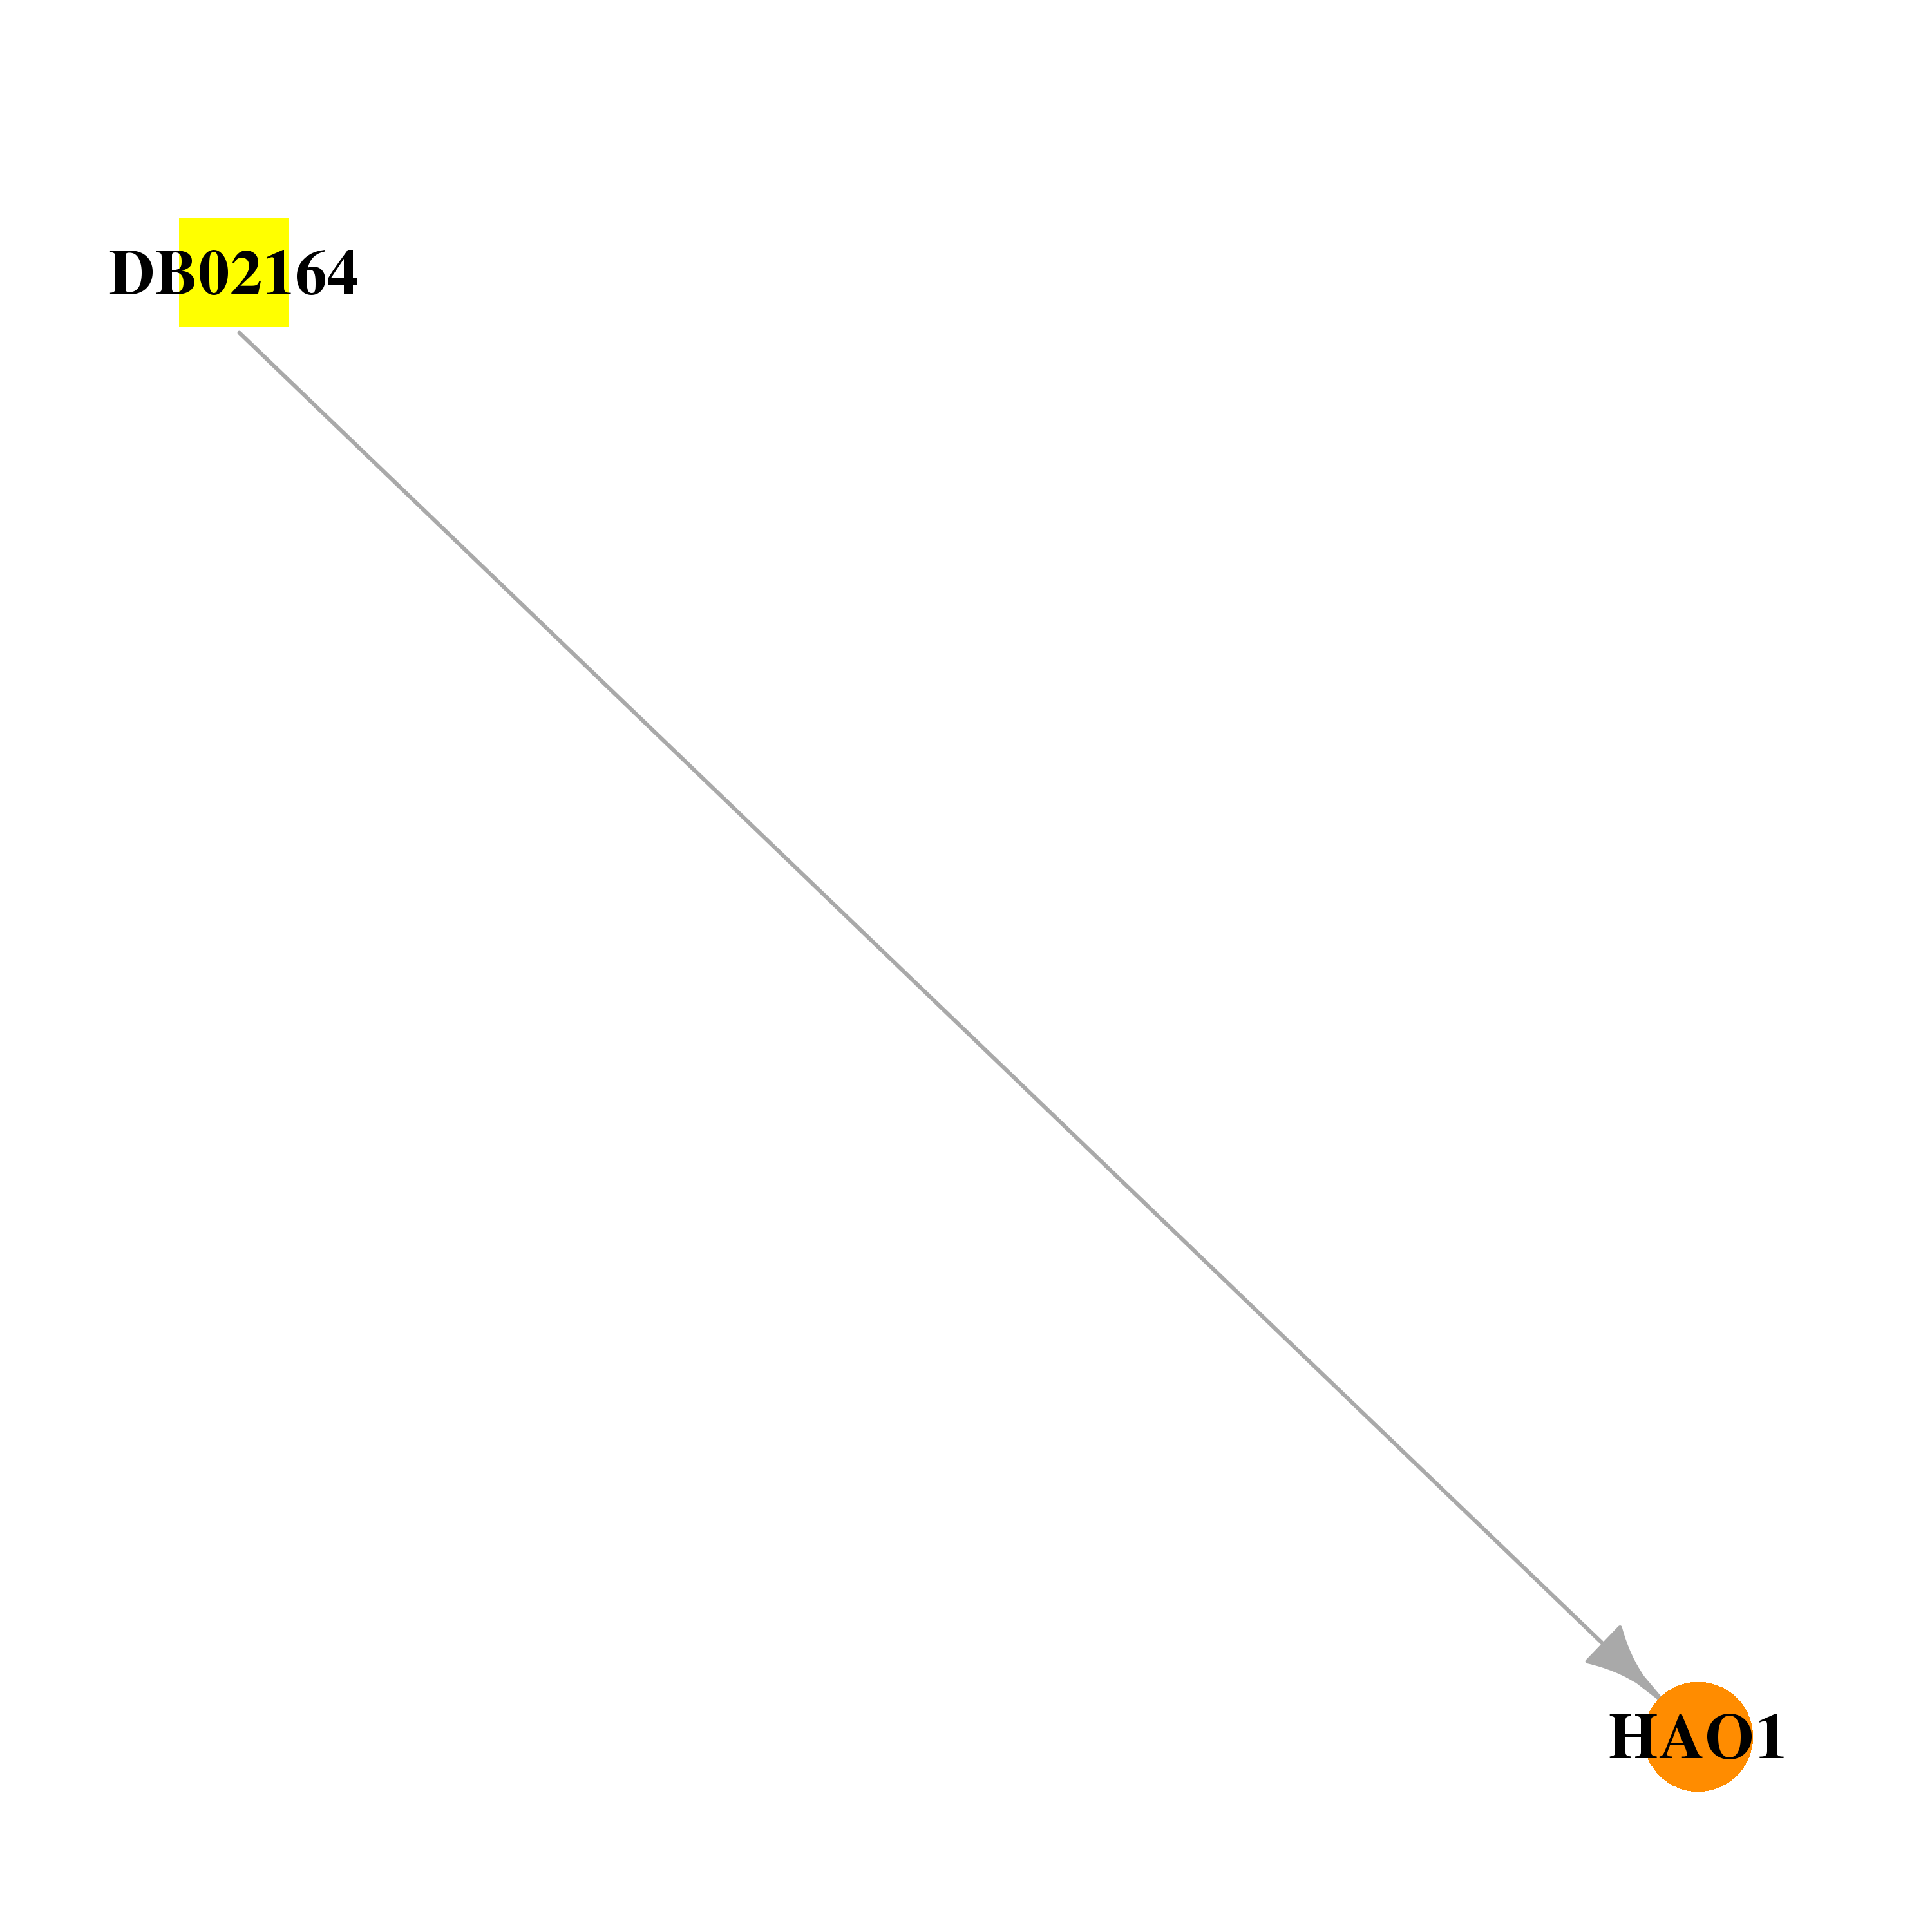 |  |
| DB02279 | hydroxyacid oxidase (glycolate oxidase) 1 | experimental | Benzoylformic Acid |  | 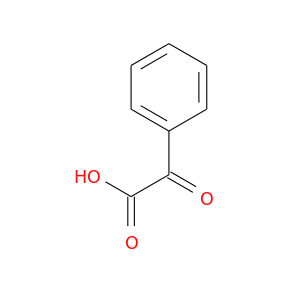 |
| DB03014 | hydroxyacid oxidase (glycolate oxidase) 1 | experimental | Heme | 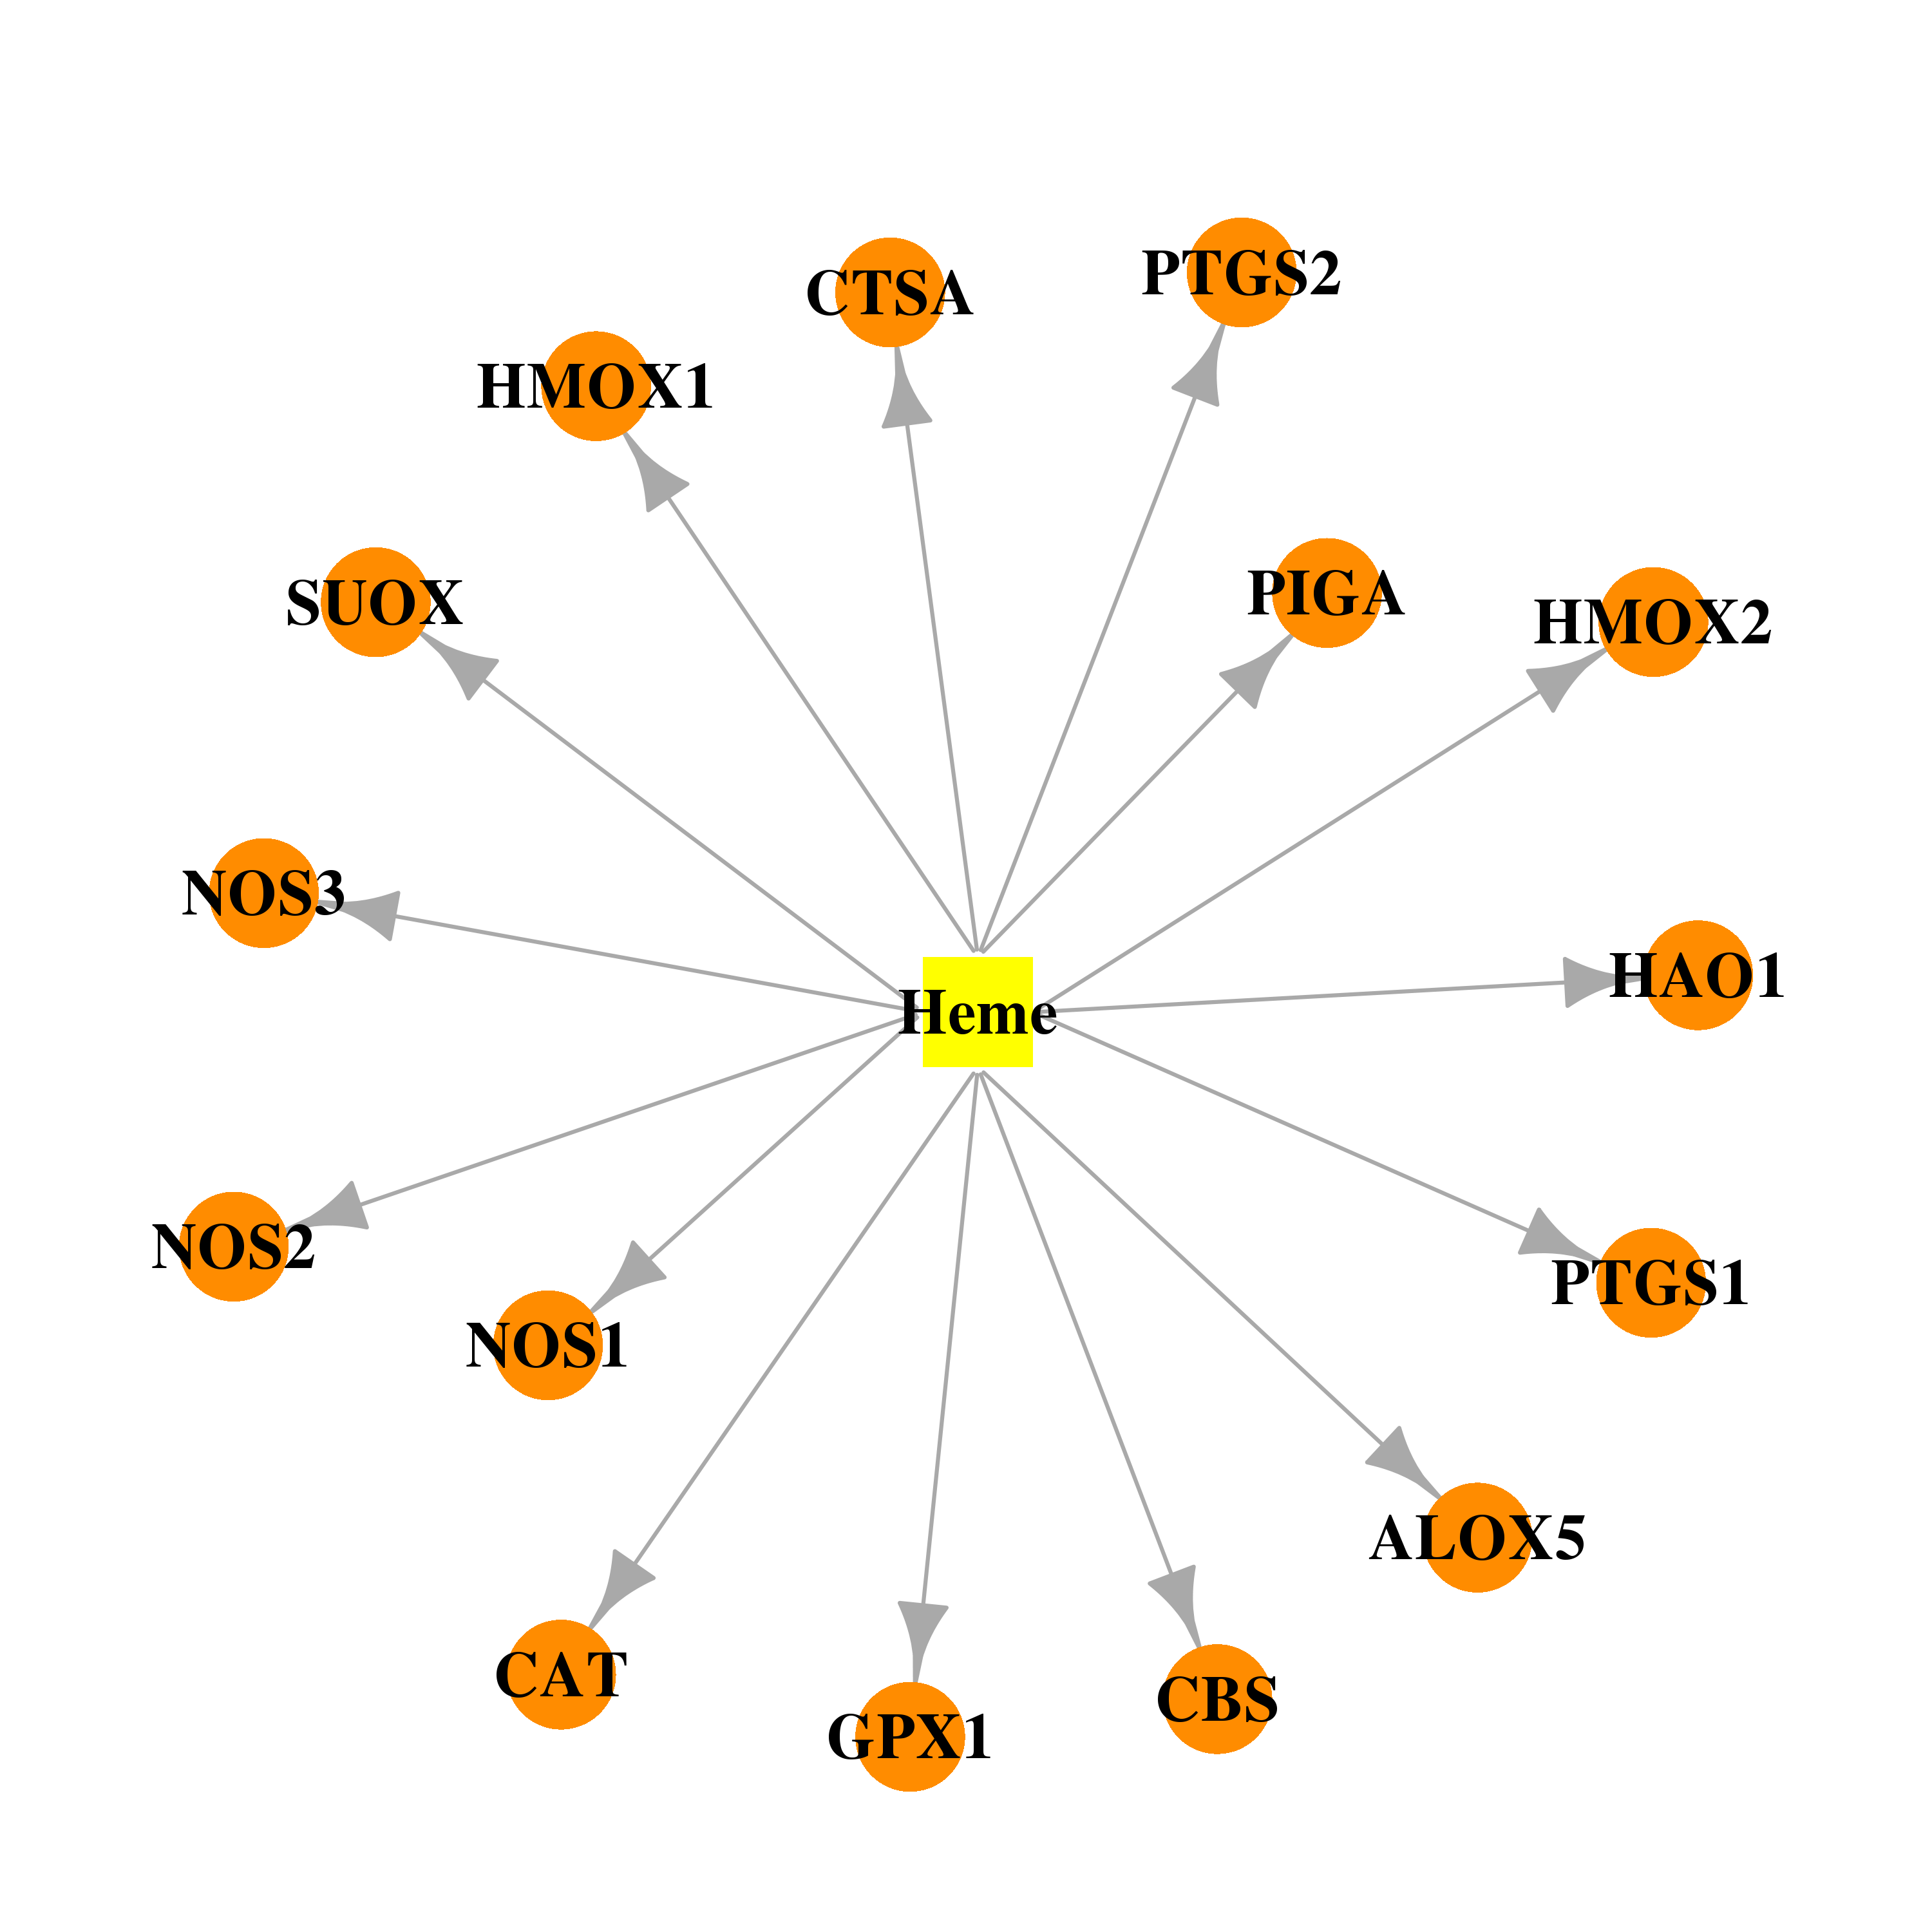 | 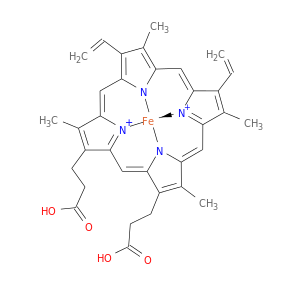 |
| DB03064 | hydroxyacid oxidase (glycolate oxidase) 1 | experimental | 3-Decyl-2,5-Dioxo-4-Hydroxy-3-Pyrroline | 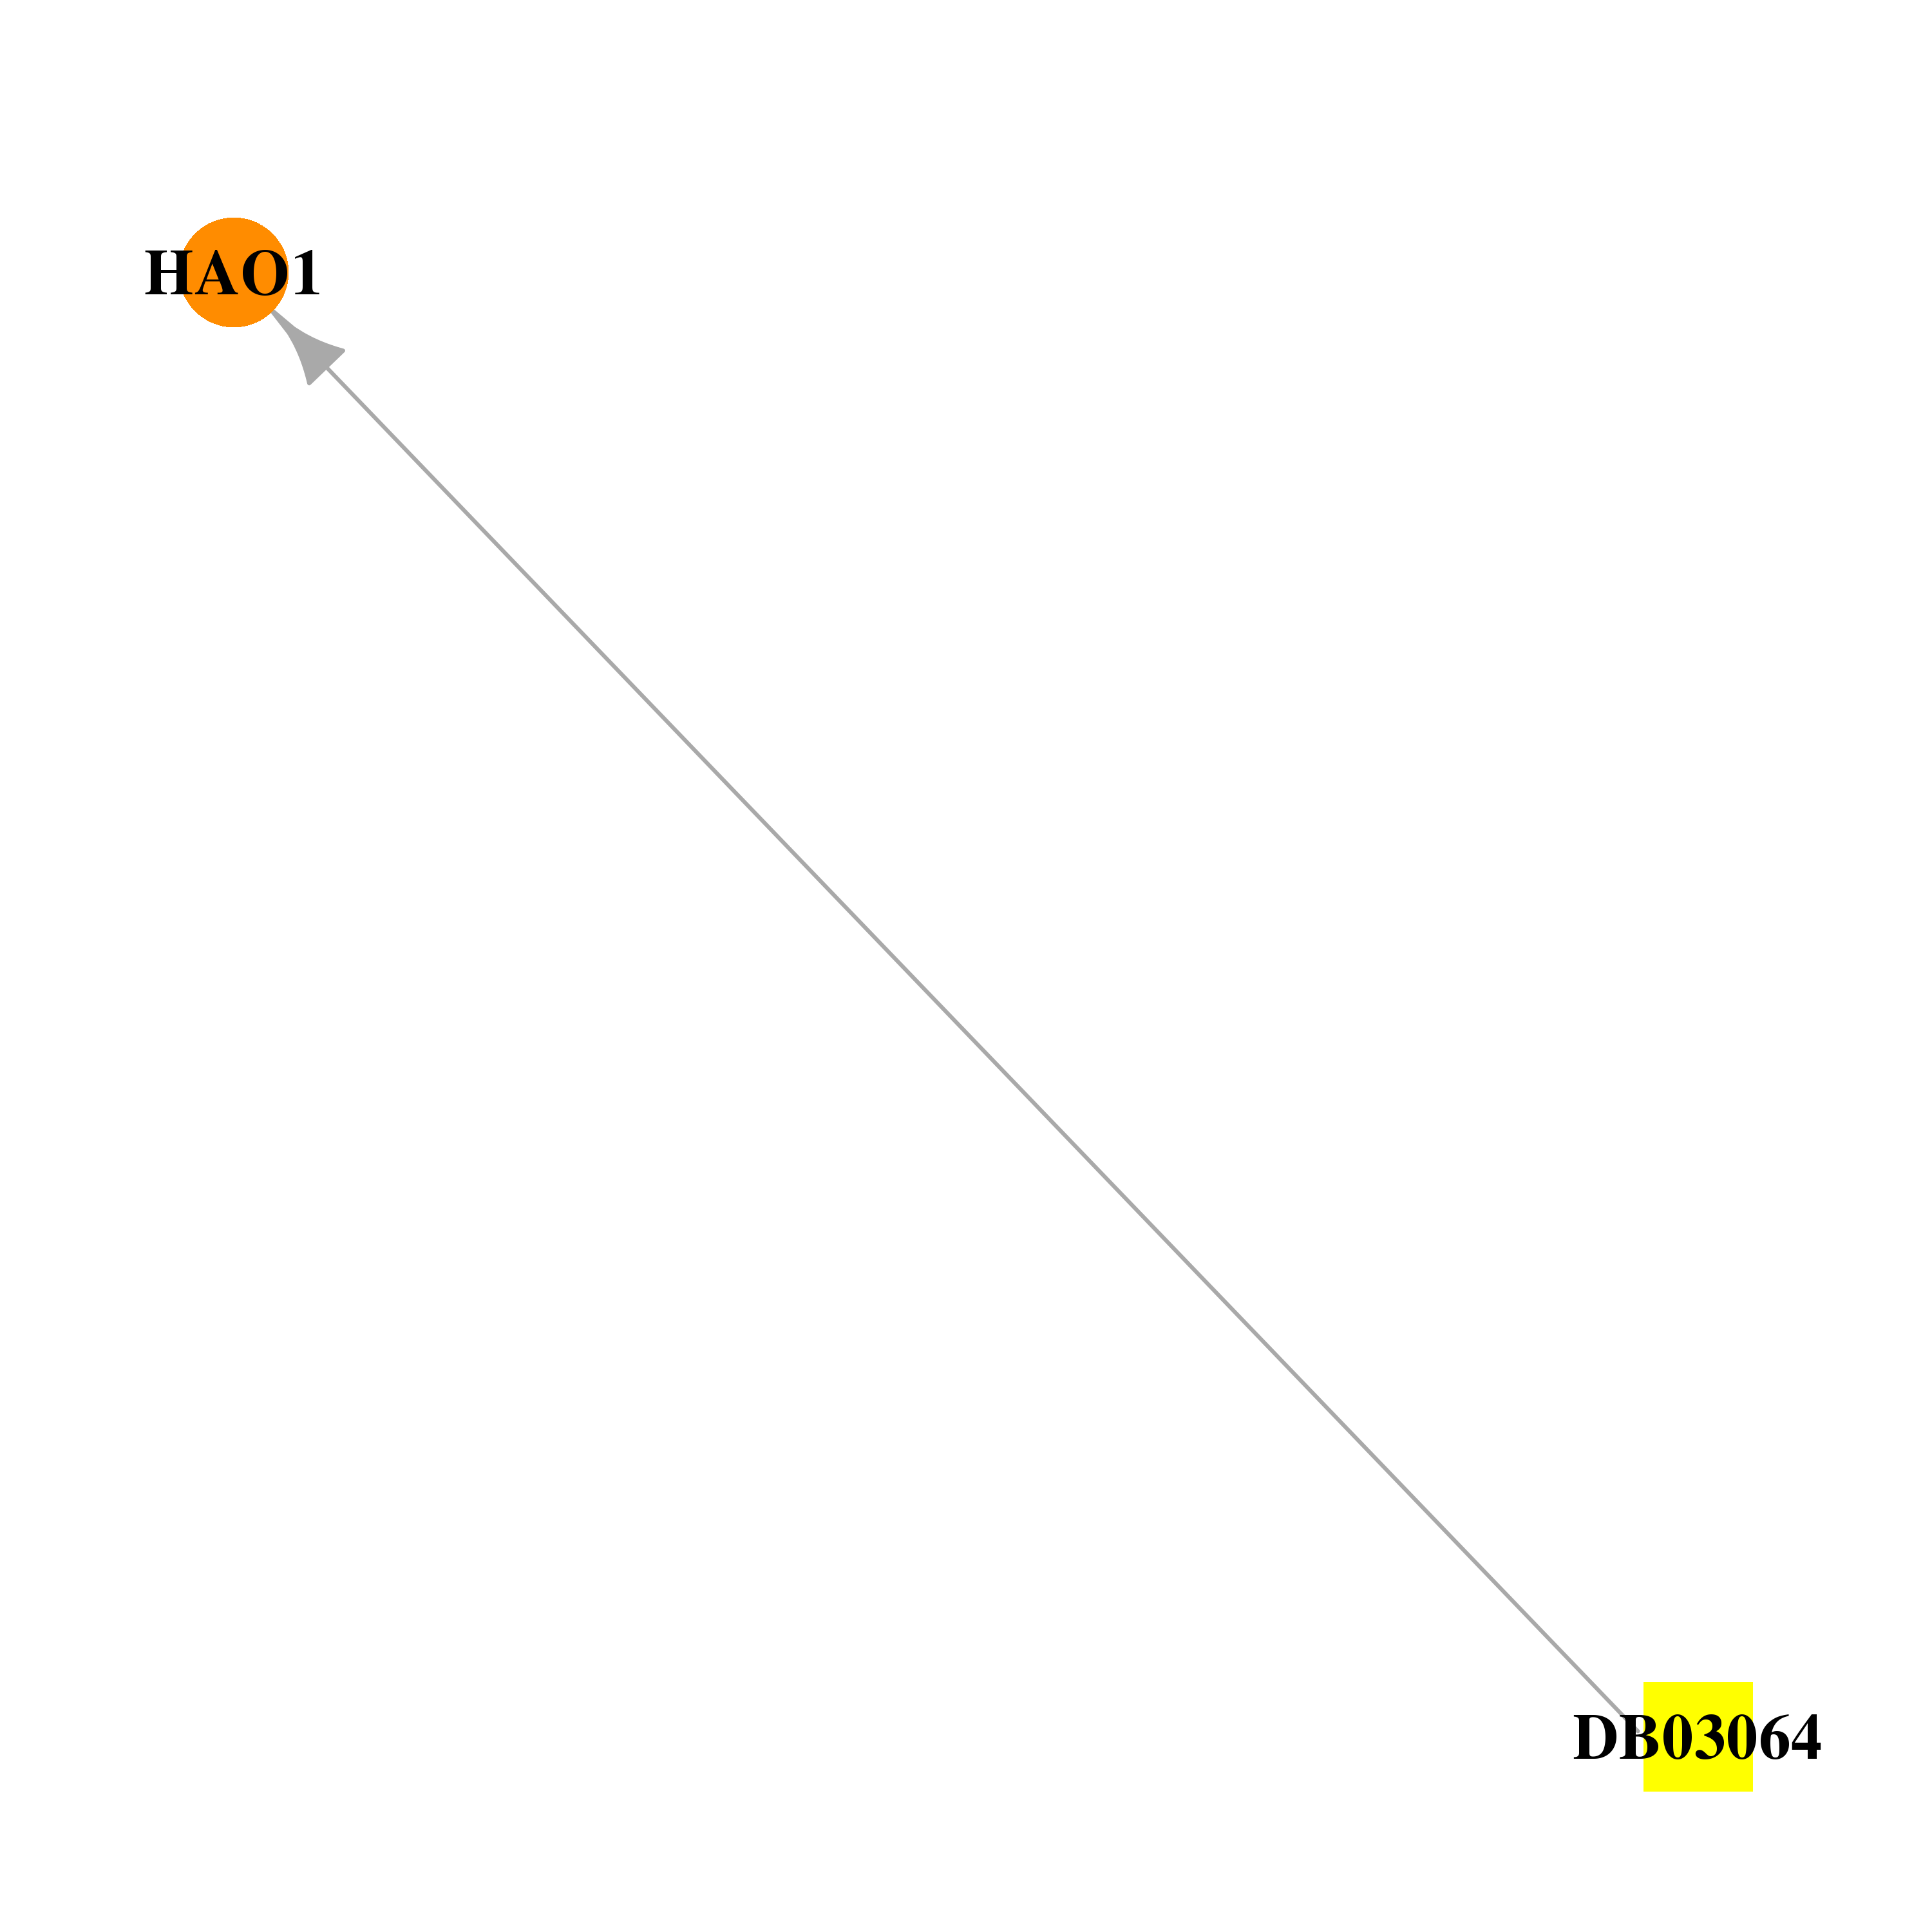 | 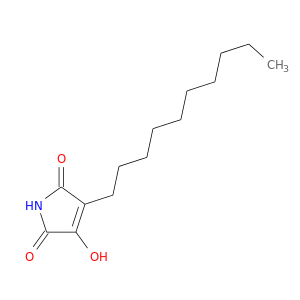 |
| DB03247 | hydroxyacid oxidase (glycolate oxidase) 1 | experimental | Riboflavin Monophosphate |  |  |
| DB03884 | hydroxyacid oxidase (glycolate oxidase) 1 | experimental | 3-Phenylpyruvic Acid | 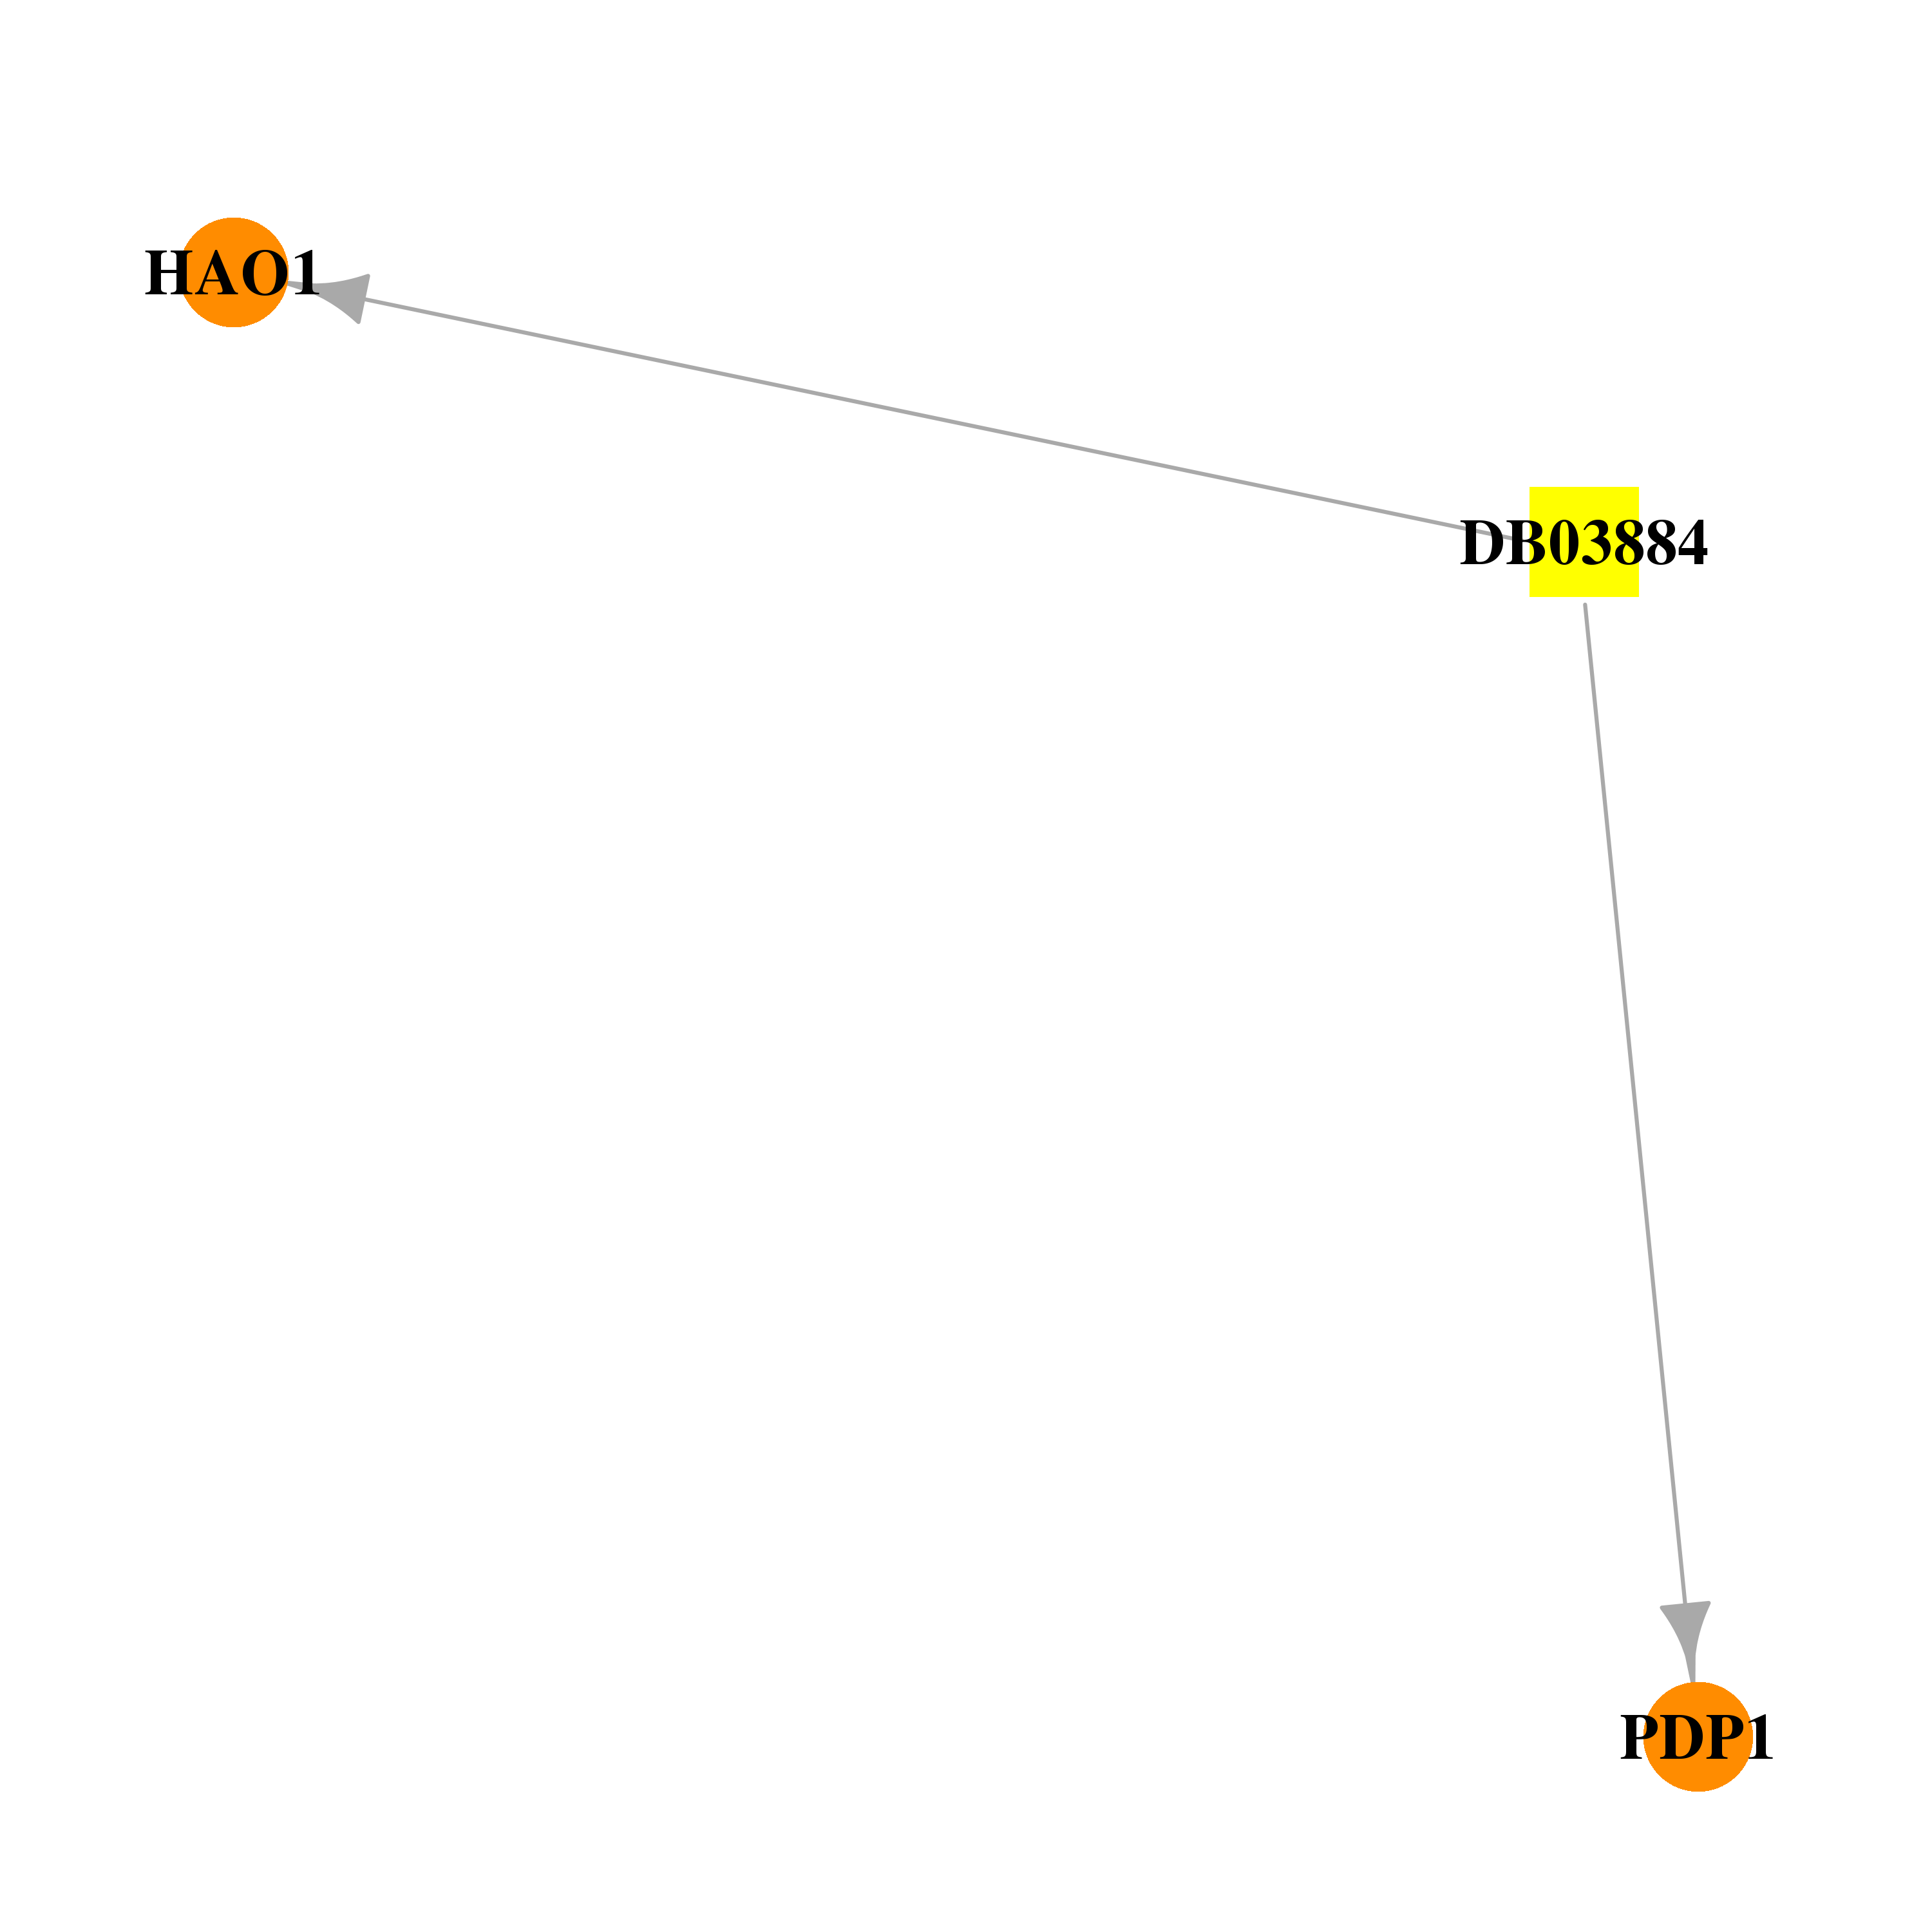 |  |
| DB04374 | hydroxyacid oxidase (glycolate oxidase) 1 | experimental | 4-Carboxy-5-(1-Pentyl)Hexylsulfanyl-1,2,3-Triazole |  |  |
| DB06979 | hydroxyacid oxidase (glycolate oxidase) 1 | experimental | 5-(dodecylthio)-1H-1,2,3-triazole-4-carboxylic acid |  | 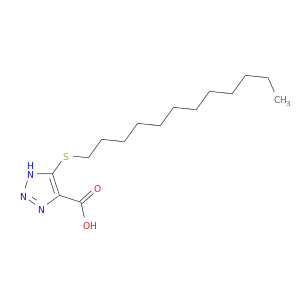 |
| DB07060 | hydroxyacid oxidase (glycolate oxidase) 1 | experimental | 3-(INDOL-3-YL) LACTATE |  | 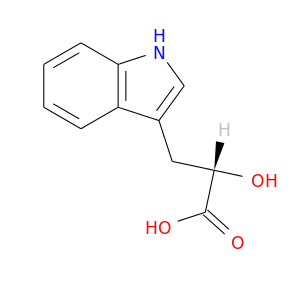 |
| DB07907 | hydroxyacid oxidase (glycolate oxidase) 1 | experimental | (2S)-2-HYDROXYOCTANOIC ACID |  | 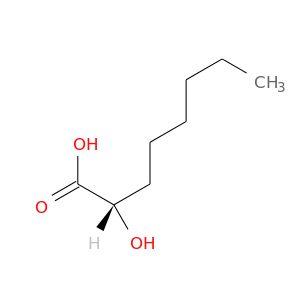 |
| DB00145 | hydroxyacid oxidase (glycolate oxidase) 1 | approved; nutraceutical | Glycine |  |  |
| DB00160 | hydroxyacid oxidase (glycolate oxidase) 1 | approved; nutraceutical | L-Alanine |  |  |
| Top |
| Cross referenced IDs for HAO1 |
| * We obtained these cross-references from Uniprot database. It covers 150 different DBs, 18 categories. http://www.uniprot.org/help/cross_references_section |
: Open all cross reference information
|
Copyright © 2016-Present - The Univsersity of Texas Health Science Center at Houston @ |