|
||||||||||||||||||||||||||||||||||||||||||||||||||||||||||||||||||||||||||||||||||||||||||||||||||||||||||||||||||||||||||||||||||||||||||||||||||||||||||||||||||||||||||||||||||||||||||||||||||||||||||||||||||||||||||||||||||||||||||||||||||||||||||||||||||||||||||||||||||||||||||||||||||||||||||||||||||||||||||
| |
| Phenotypic Information (metabolism pathway, cancer, disease, phenome) |
| |
| |
| Gene-Gene Network Information: Co-Expression Network, Interacting Genes & KEGG |
| |
|


| Gene Summary for UGT2B28 |
| Top |
| Phenotypic Information for UGT2B28(metabolism pathway, cancer, disease, phenome) |
| Cancer | CGAP: UGT2B28 |
| Familial Cancer Database: UGT2B28 | |
| * This gene is included in those cancer gene databases. |
|
|
|
|
|
| . | ||||||||||||||||||||||||||||||||||||||||||||||||||||||||||||||||||||||||||||||||||||||||||||||||||||||||||||||||||||||||||||||||||||||||||||||||||||||||||||||||||||||||||||||||||||||||||||||||||||||||||||||||||||||||||||||||||||||||||||||||||||||||||||||||||||||||||||||||||||||||||||||||||||||||||||||||||||
Oncogene 1 | Significant driver gene in | |||||||||||||||||||||||||||||||||||||||||||||||||||||||||||||||||||||||||||||||||||||||||||||||||||||||||||||||||||||||||||||||||||||||||||||||||||||||||||||||||||||||||||||||||||||||||||||||||||||||||||||||||||||||||||||||||||||||||||||||||||||||||||||||||||||||||||||||||||||||||||||||||||||||||||||||||||||||||
| cf) number; DB name 1 Oncogene; http://nar.oxfordjournals.org/content/35/suppl_1/D721.long, 2 Tumor Suppressor gene; https://bioinfo.uth.edu/TSGene/, 3 Cancer Gene Census; http://www.nature.com/nrc/journal/v4/n3/abs/nrc1299.html, 4 CancerGenes; http://nar.oxfordjournals.org/content/35/suppl_1/D721.long, 5 Network of Cancer Gene; http://ncg.kcl.ac.uk/index.php, 1Therapeutic Vulnerabilities in Cancer; http://cbio.mskcc.org/cancergenomics/statius/ |
| KEGG_ASCORBATE_AND_ALDARATE_METABOLISM KEGG_STARCH_AND_SUCROSE_METABOLISM KEGG_RETINOL_METABOLISM KEGG_PORPHYRIN_AND_CHLOROPHYLL_METABOLISM KEGG_METABOLISM_OF_XENOBIOTICS_BY_CYTOCHROME_P450 KEGG_DRUG_METABOLISM_CYTOCHROME_P450 KEGG_DRUG_METABOLISM_OTHER_ENZYMES | |
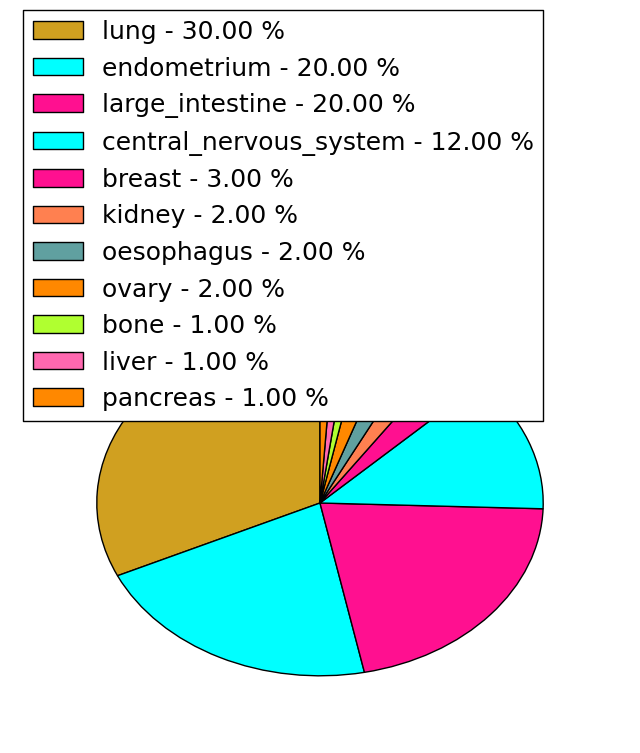
| Mutations for UGT2B28 |
| * Under tables are showing count per each tissue to give us broad intuition about tissue specific mutation patterns.You can go to the detailed page for each mutation database's web site. |
| There's no structural variation information in COSMIC data for this gene. |
| * From mRNA Sanger sequences, Chitars2.0 arranged chimeric transcripts. This table shows UGT2B28 related fusion information. |
| ID | Head Gene | Tail Gene | Accession | Gene_a | qStart_a | qEnd_a | Chromosome_a | tStart_a | tEnd_a | Gene_a | qStart_a | qEnd_a | Chromosome_a | tStart_a | tEnd_a |
| Top |
| Mutation type/ Tissue ID | brca | cns | cerv | endome | haematopo | kidn | Lintest | liver | lung | ns | ovary | pancre | prost | skin | stoma | thyro | urina | |||
| Total # sample | 1 | |||||||||||||||||||
| GAIN (# sample) | ||||||||||||||||||||
| LOSS (# sample) | 1 |
| cf) Tissue ID; Tissue type (1; Breast, 2; Central_nervous_system, 3; Cervix, 4; Endometrium, 5; Haematopoietic_and_lymphoid_tissue, 6; Kidney, 7; Large_intestine, 8; Liver, 9; Lung, 10; NS, 11; Ovary, 12; Pancreas, 13; Prostate, 14; Skin, 15; Stomach, 16; Thyroid, 17; Urinary_tract) |
| Top |
|
 |
| Top |
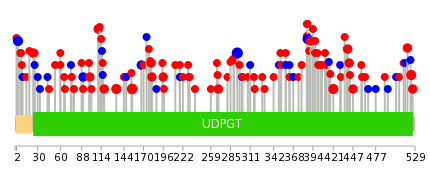
| Stat. for Non-Synonymous SNVs (# total SNVs=78) | (# total SNVs=26) |
 |  |
(# total SNVs=0) | (# total SNVs=0) |
| Top |
| * When you move the cursor on each content, you can see more deailed mutation information on the Tooltip. Those are primary_site,primary_histology,mutation(aa),pubmedID. |
| GRCh37 position | Mutation(aa) | Unique sampleID count |
| chr4:70152481-70152481 | p.E294E | 5 |
| chr4:70146681-70146681 | p.P155S | 4 |
| chr4:70146620-70146620 | p.K134N | 3 |
| chr4:70148376-70148376 | p.P289H | 3 |
| chr4:70160509-70160509 | p.K524N | 3 |
| chr4:70156380-70156380 | p.G387G | 3 |
| chr4:70146230-70146230 | p.K4K | 3 |
| chr4:70156481-70156481 | p.S421L | 3 |
| chr4:70160312-70160312 | p.R459* | 2 |
| chr4:70146513-70146513 | p.D99N | 2 |
| Top |
|
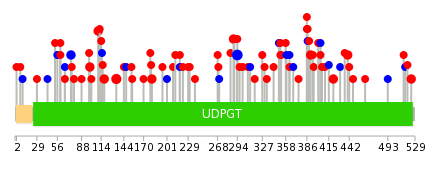 |
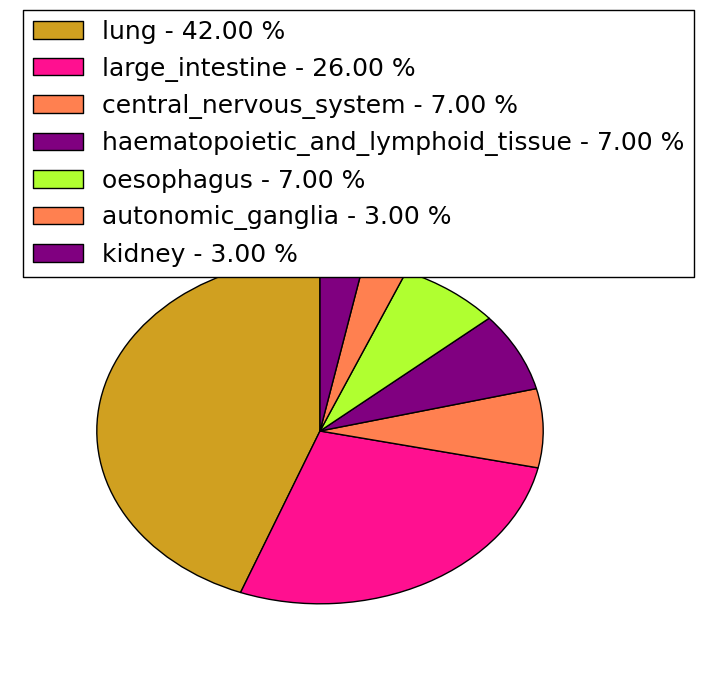
| Point Mutation/ Tissue ID | 1 | 2 | 3 | 4 | 5 | 6 | 7 | 8 | 9 | 10 | 11 | 12 | 13 | 14 | 15 | 16 | 17 | 18 | 19 | 20 |
| # sample | 2 | 1 | 9 | 6 | 3 | 3 | 16 | 6 | 33 | 9 | 1 | 11 | ||||||||
| # mutation | 2 | 1 | 11 | 5 | 3 | 3 | 17 | 6 | 32 | 8 | 1 | 11 | ||||||||
| nonsynonymous SNV | 2 | 1 | 9 | 4 | 1 | 2 | 12 | 4 | 23 | 6 | 11 | |||||||||
| synonymous SNV | 2 | 1 | 2 | 1 | 5 | 2 | 9 | 2 | 1 |
| cf) Tissue ID; Tissue type (1; BLCA[Bladder Urothelial Carcinoma], 2; BRCA[Breast invasive carcinoma], 3; CESC[Cervical squamous cell carcinoma and endocervical adenocarcinoma], 4; COAD[Colon adenocarcinoma], 5; GBM[Glioblastoma multiforme], 6; Glioma Low Grade, 7; HNSC[Head and Neck squamous cell carcinoma], 8; KICH[Kidney Chromophobe], 9; KIRC[Kidney renal clear cell carcinoma], 10; KIRP[Kidney renal papillary cell carcinoma], 11; LAML[Acute Myeloid Leukemia], 12; LUAD[Lung adenocarcinoma], 13; LUSC[Lung squamous cell carcinoma], 14; OV[Ovarian serous cystadenocarcinoma ], 15; PAAD[Pancreatic adenocarcinoma], 16; PRAD[Prostate adenocarcinoma], 17; SKCM[Skin Cutaneous Melanoma], 18:STAD[Stomach adenocarcinoma], 19:THCA[Thyroid carcinoma], 20:UCEC[Uterine Corpus Endometrial Carcinoma]) |
| Top |
| * We represented just top 10 SNVs. When you move the cursor on each content, you can see more deailed mutation information on the Tooltip. Those are primary_site, primary_histology, mutation(aa), pubmedID. |
| Genomic Position | Mutation(aa) | Unique sampleID count |
| chr4:70152481 | p.E294E,UGT2B28 | 4 |
| chr4:70146620 | p.K134N,UGT2B28 | 3 |
| chr4:70148376 | p.E118K,UGT2B28 | 2 |
| chr4:70156375 | p.A60T,UGT2B28 | 2 |
| chr4:70146513 | p.V391A | 2 |
| chr4:70146547 | p.L74L,UGT2B28 | 2 |
| chr4:70156481 | p.K524N | 2 |
| chr4:70155432 | p.T351I | 2 |
| chr4:70160509 | p.P289H,UGT2B28 | 2 |
| chr4:70146396 | p.D99N,UGT2B28 | 2 |
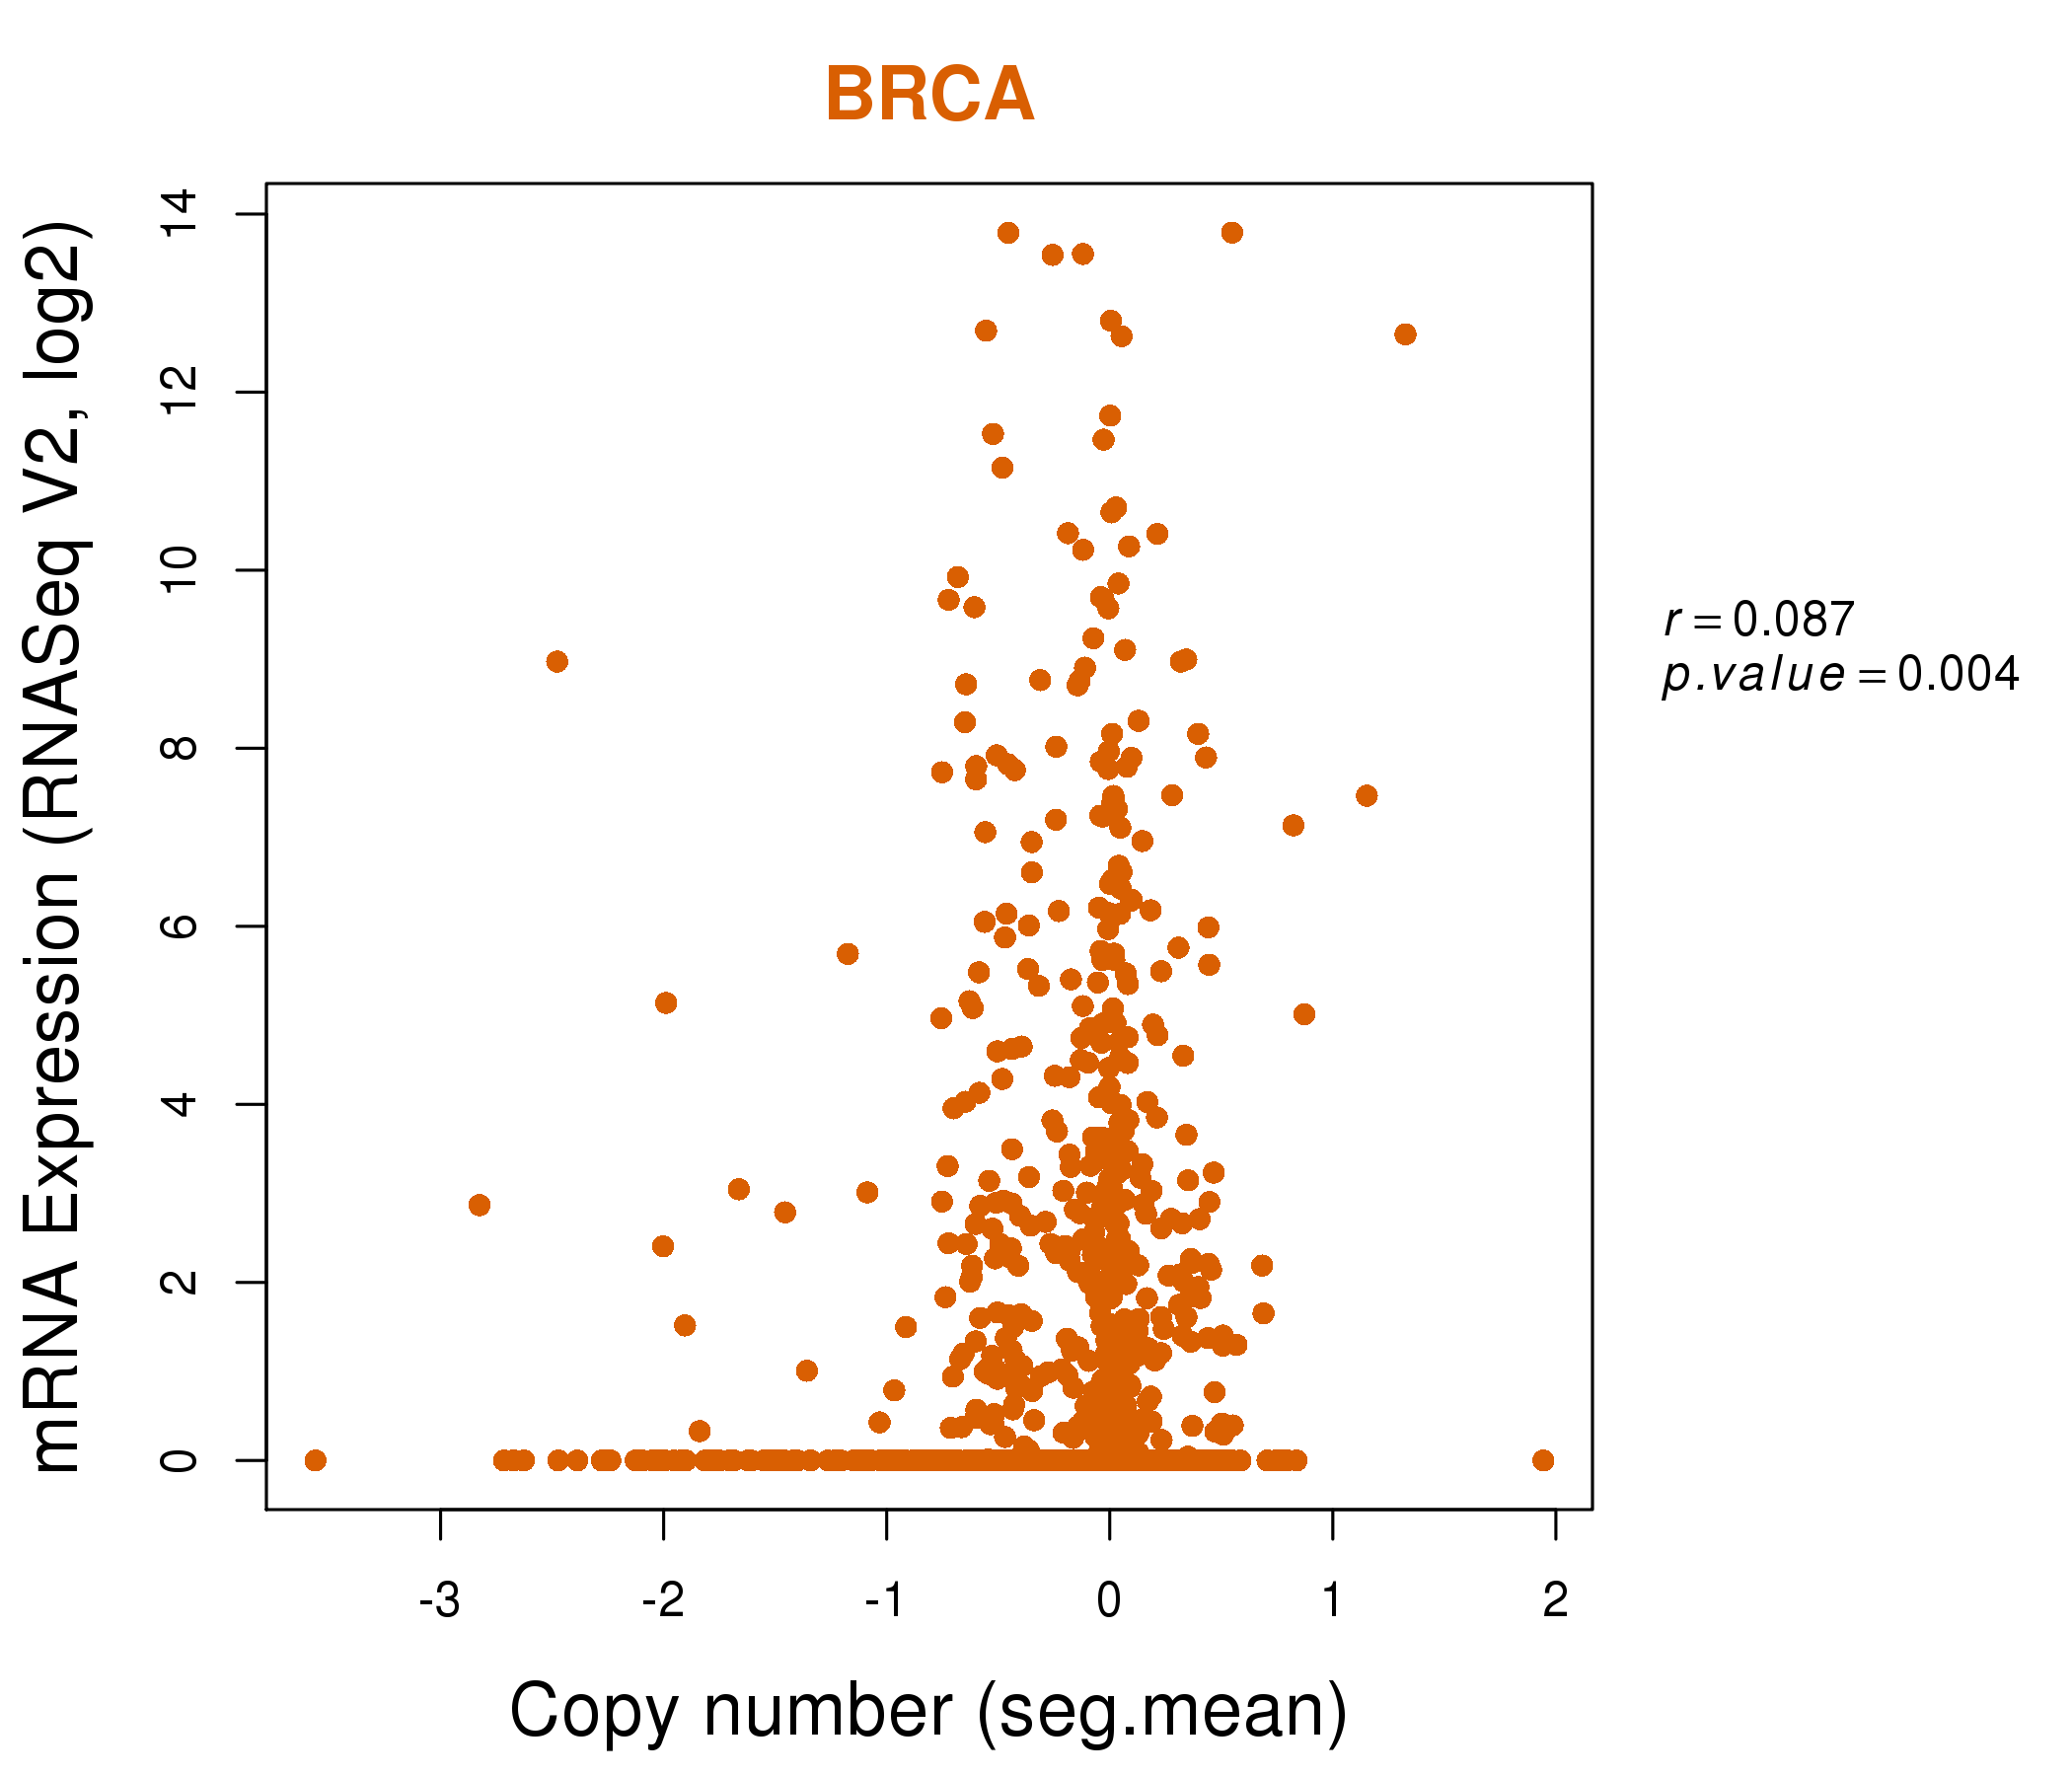
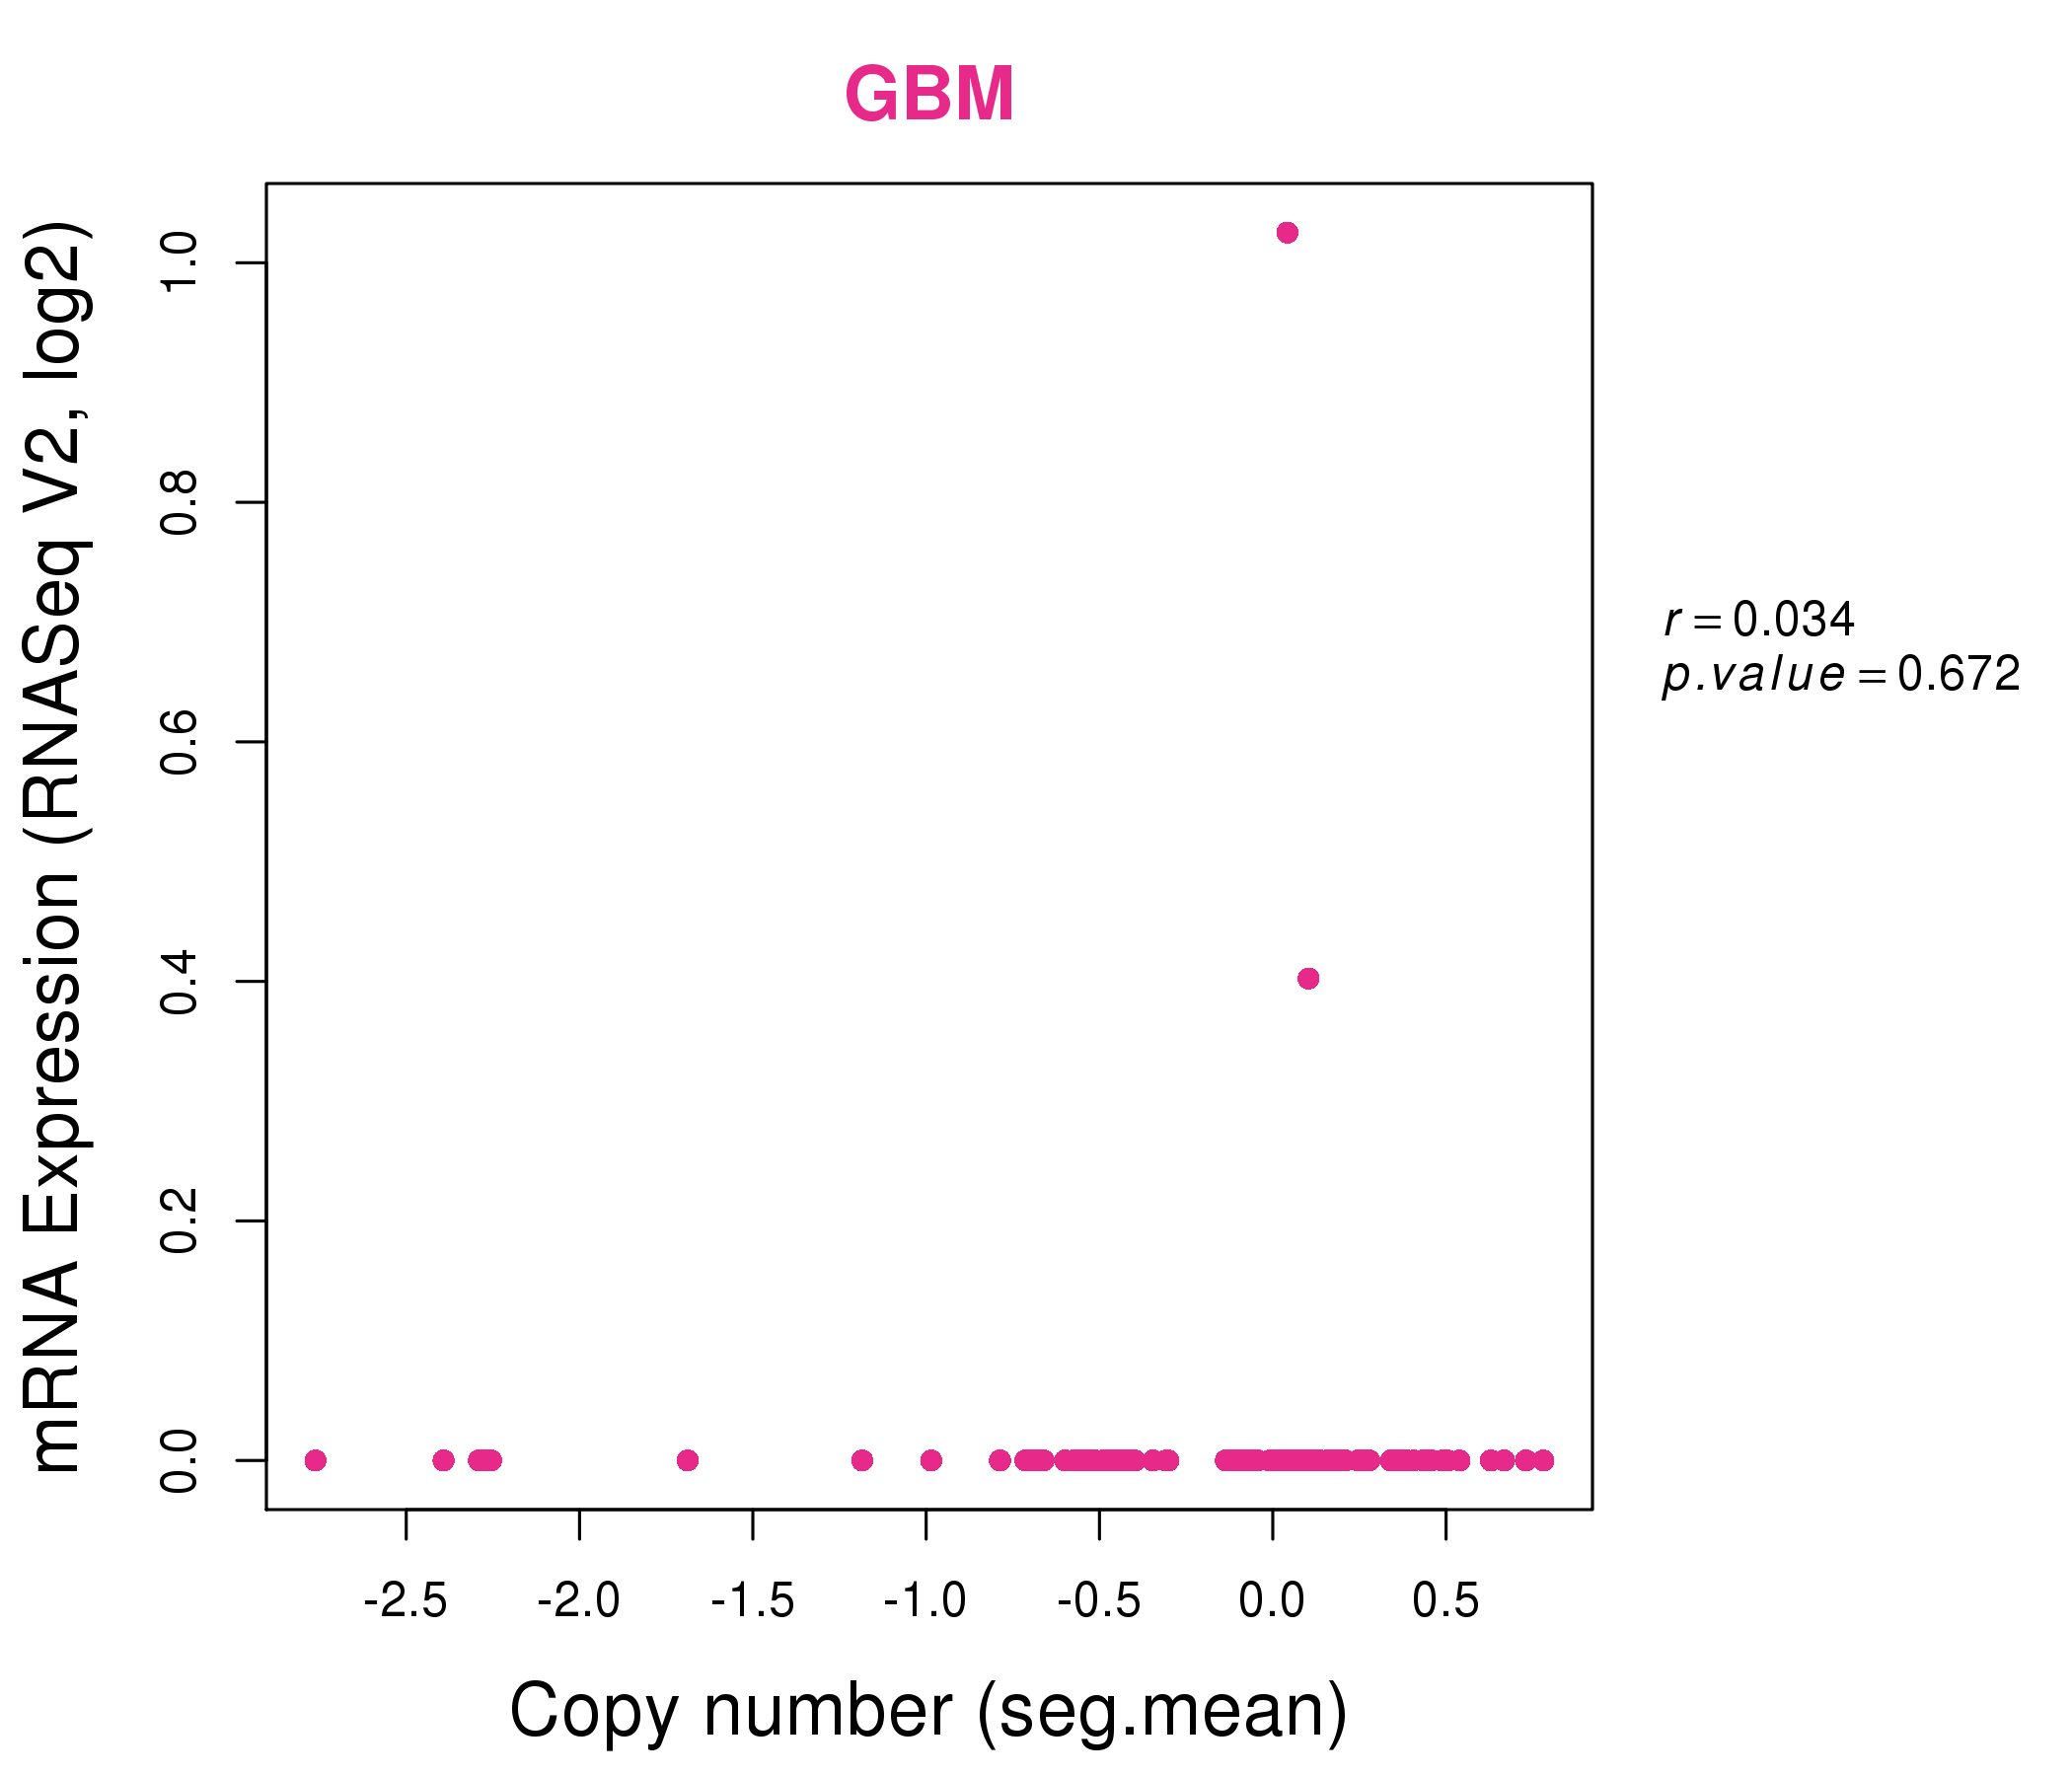
| * Copy number data were extracted from TCGA using R package TCGA-Assembler. The URLs of all public data files on TCGA DCC data server were gathered on Jan-05-2015. Function ProcessCNAData in TCGA-Assembler package was used to obtain gene-level copy number value which is calculated as the average copy number of the genomic region of a gene. |
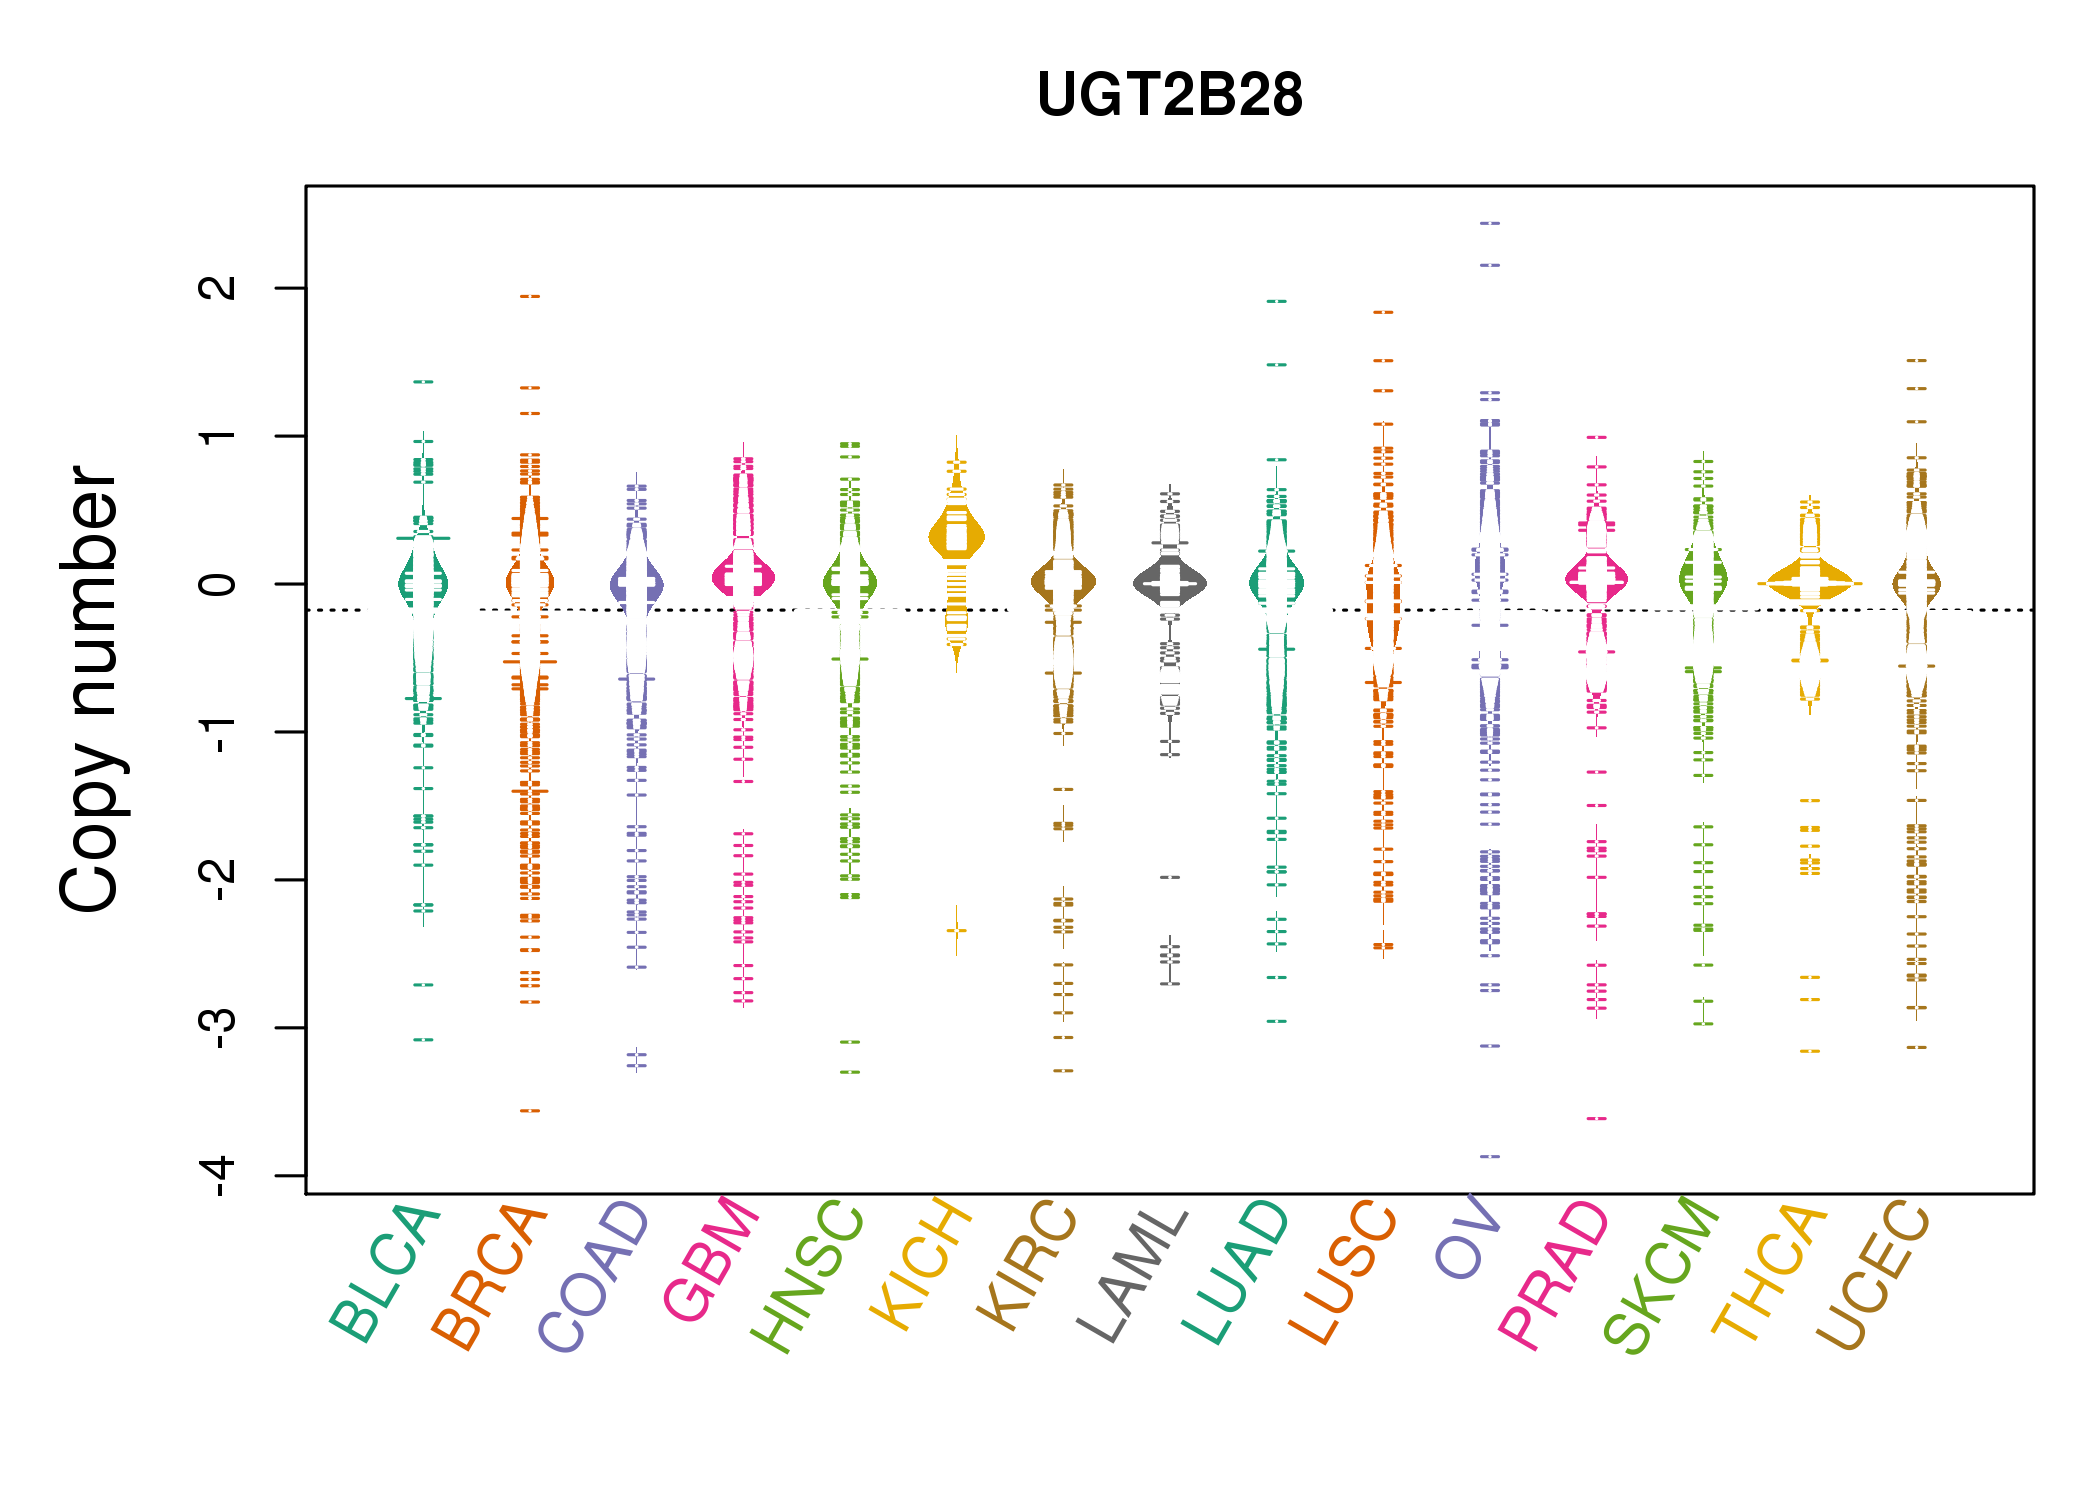 |
| cf) Tissue ID[Tissue type]: BLCA[Bladder Urothelial Carcinoma], BRCA[Breast invasive carcinoma], CESC[Cervical squamous cell carcinoma and endocervical adenocarcinoma], COAD[Colon adenocarcinoma], GBM[Glioblastoma multiforme], Glioma Low Grade, HNSC[Head and Neck squamous cell carcinoma], KICH[Kidney Chromophobe], KIRC[Kidney renal clear cell carcinoma], KIRP[Kidney renal papillary cell carcinoma], LAML[Acute Myeloid Leukemia], LUAD[Lung adenocarcinoma], LUSC[Lung squamous cell carcinoma], OV[Ovarian serous cystadenocarcinoma ], PAAD[Pancreatic adenocarcinoma], PRAD[Prostate adenocarcinoma], SKCM[Skin Cutaneous Melanoma], STAD[Stomach adenocarcinoma], THCA[Thyroid carcinoma], UCEC[Uterine Corpus Endometrial Carcinoma] |
| Top |
| Gene Expression for UGT2B28 |
| * CCLE gene expression data were extracted from CCLE_Expression_Entrez_2012-10-18.res: Gene-centric RMA-normalized mRNA expression data. |
 |
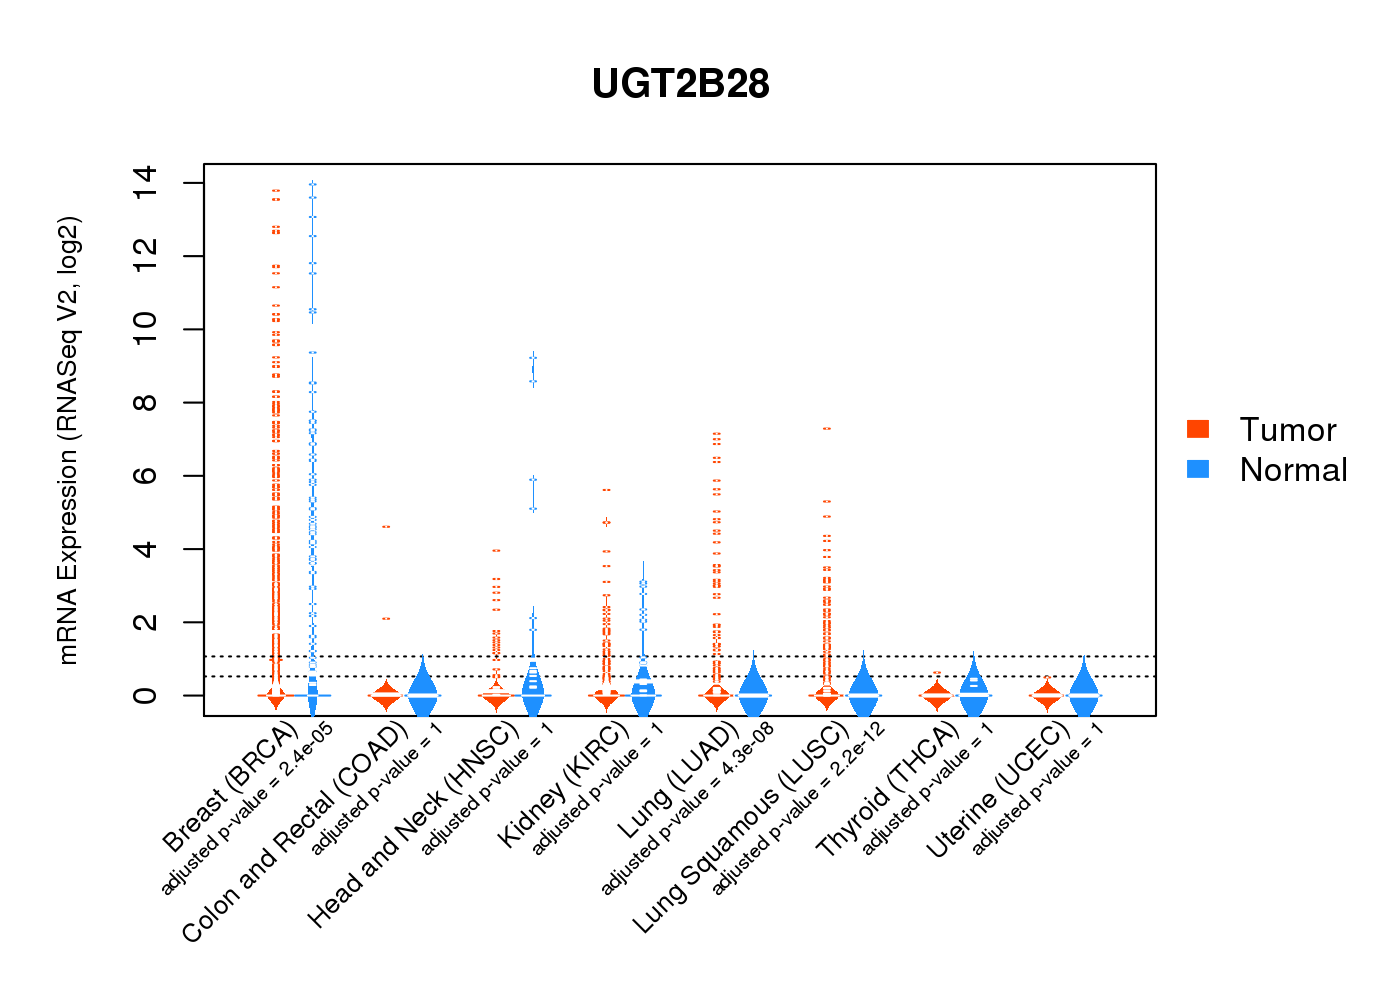
| * Normalized gene expression data of RNASeqV2 was extracted from TCGA using R package TCGA-Assembler. The URLs of all public data files on TCGA DCC data server were gathered at Jan-05-2015. Only eight cancer types have enough normal control samples for differential expression analysis. (t test, adjusted p<0.05 (using Benjamini-Hochberg FDR)) |
 |
| Top |
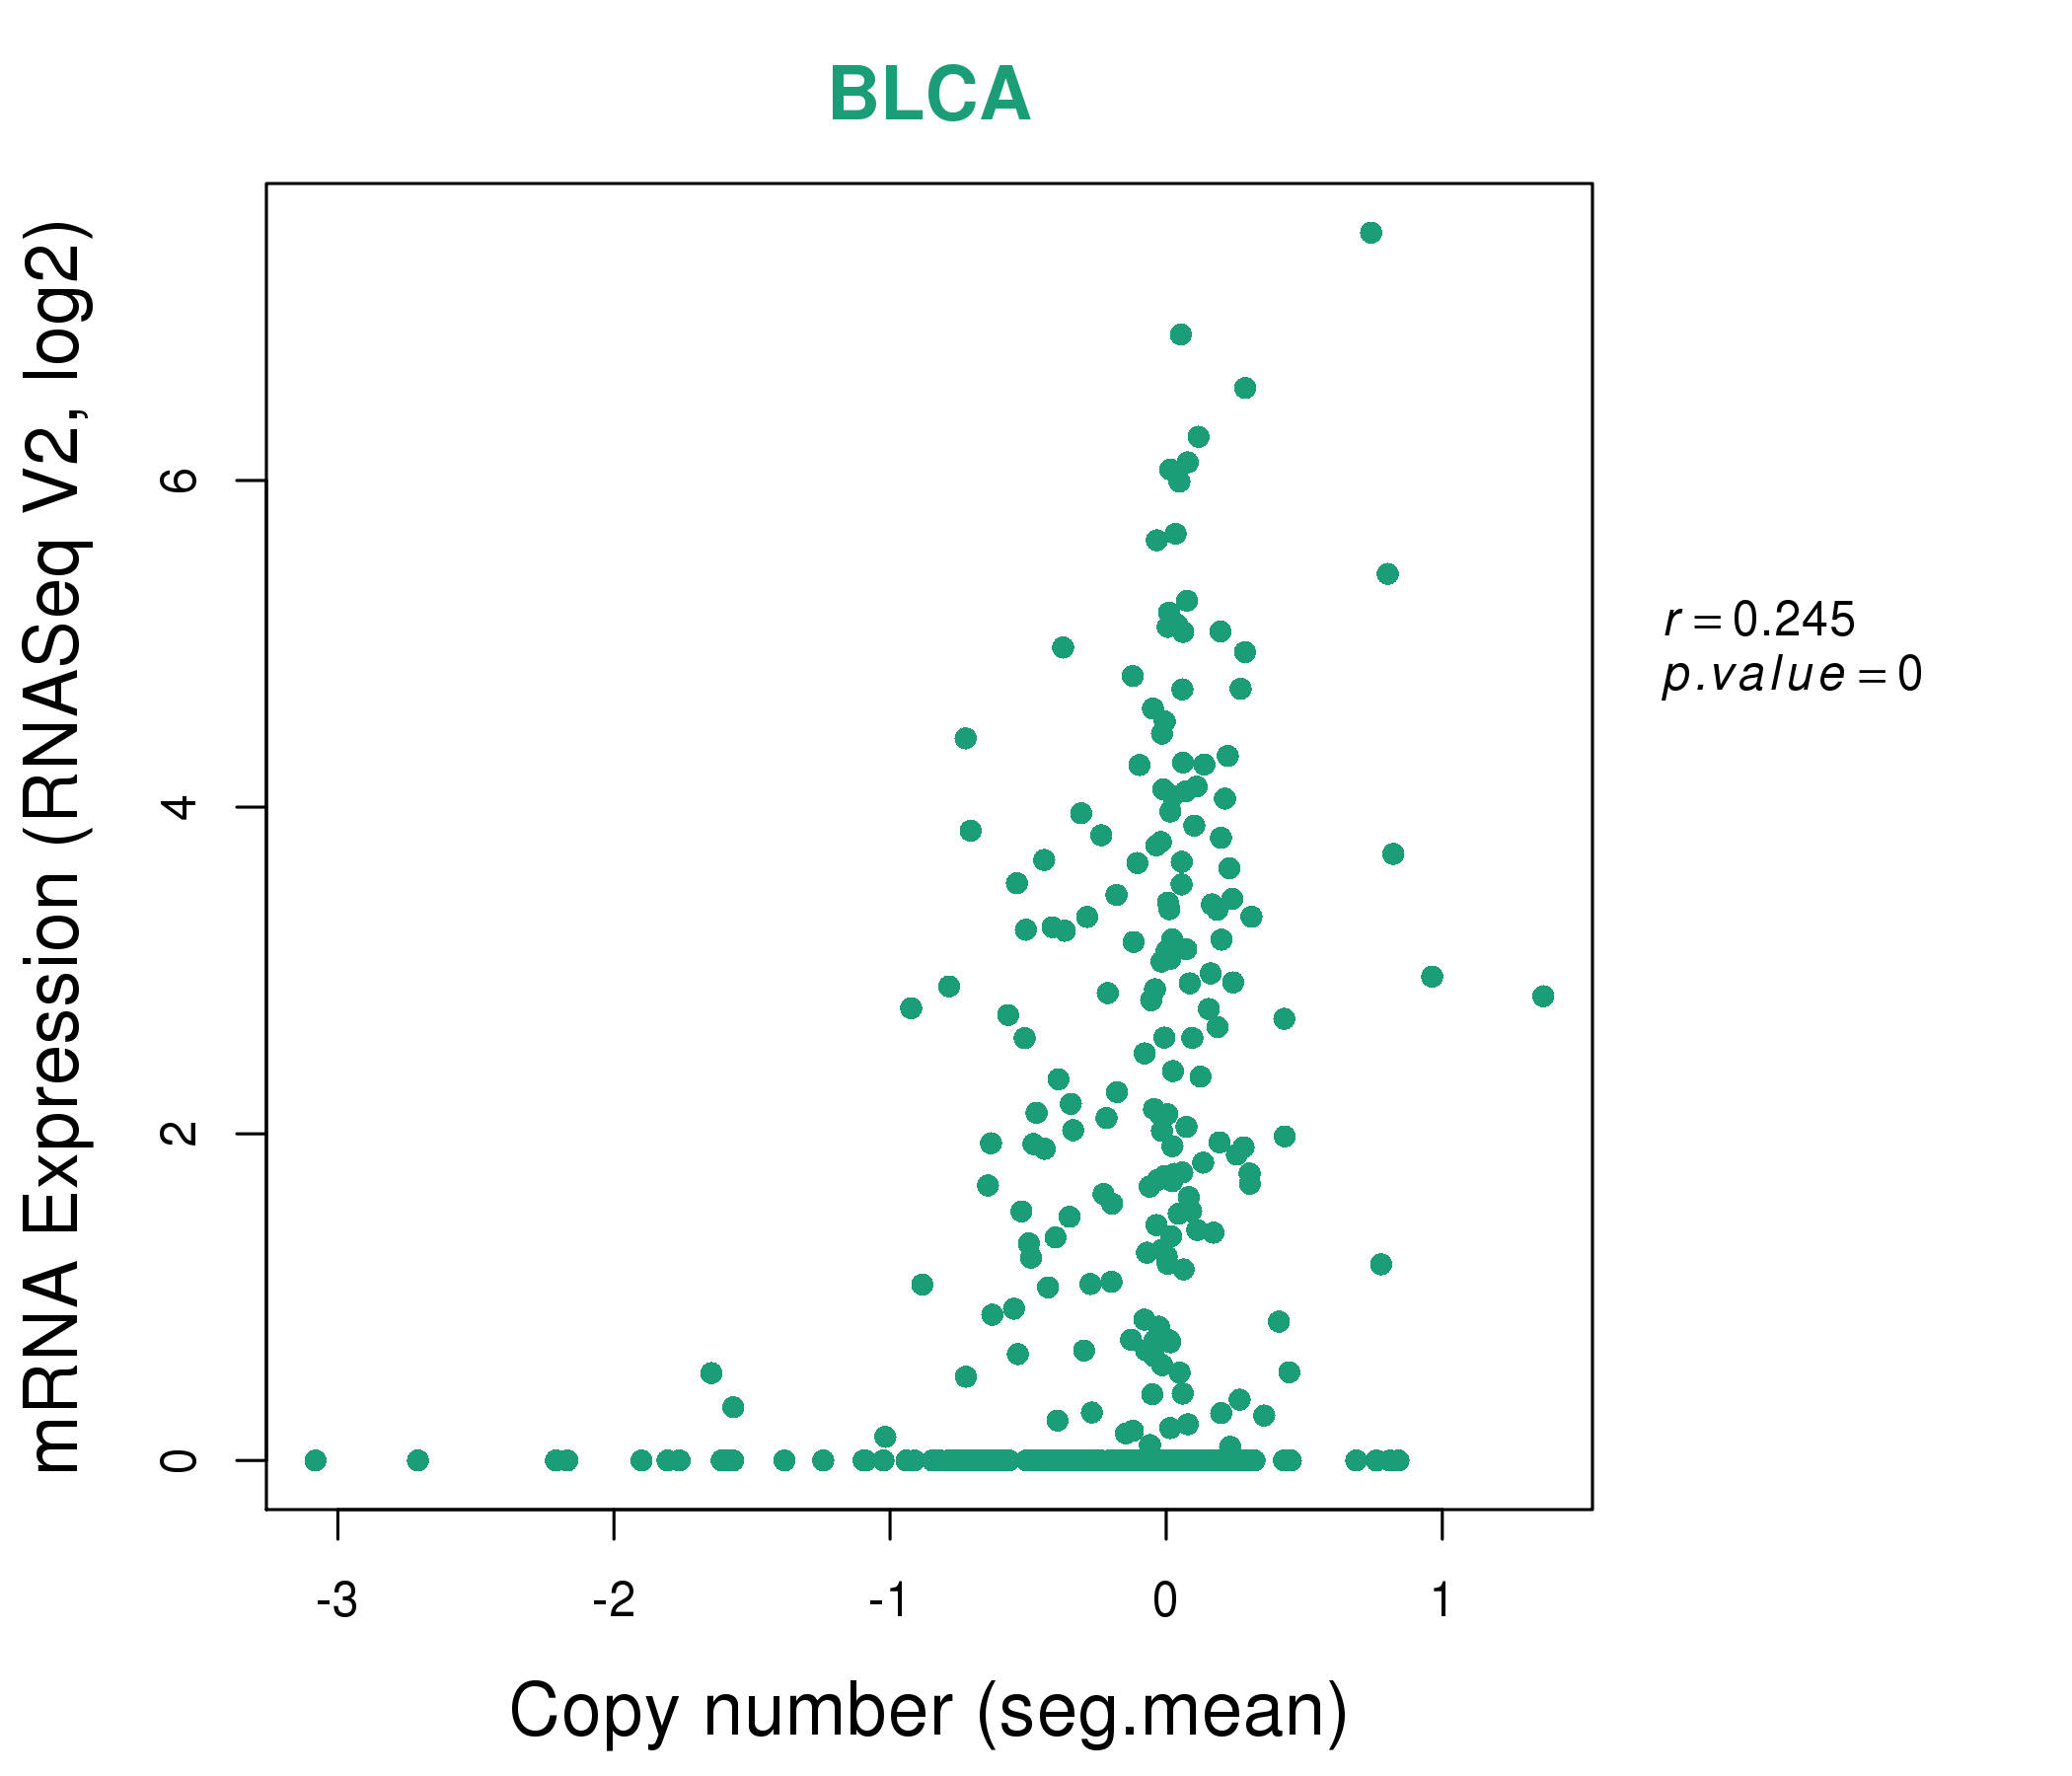
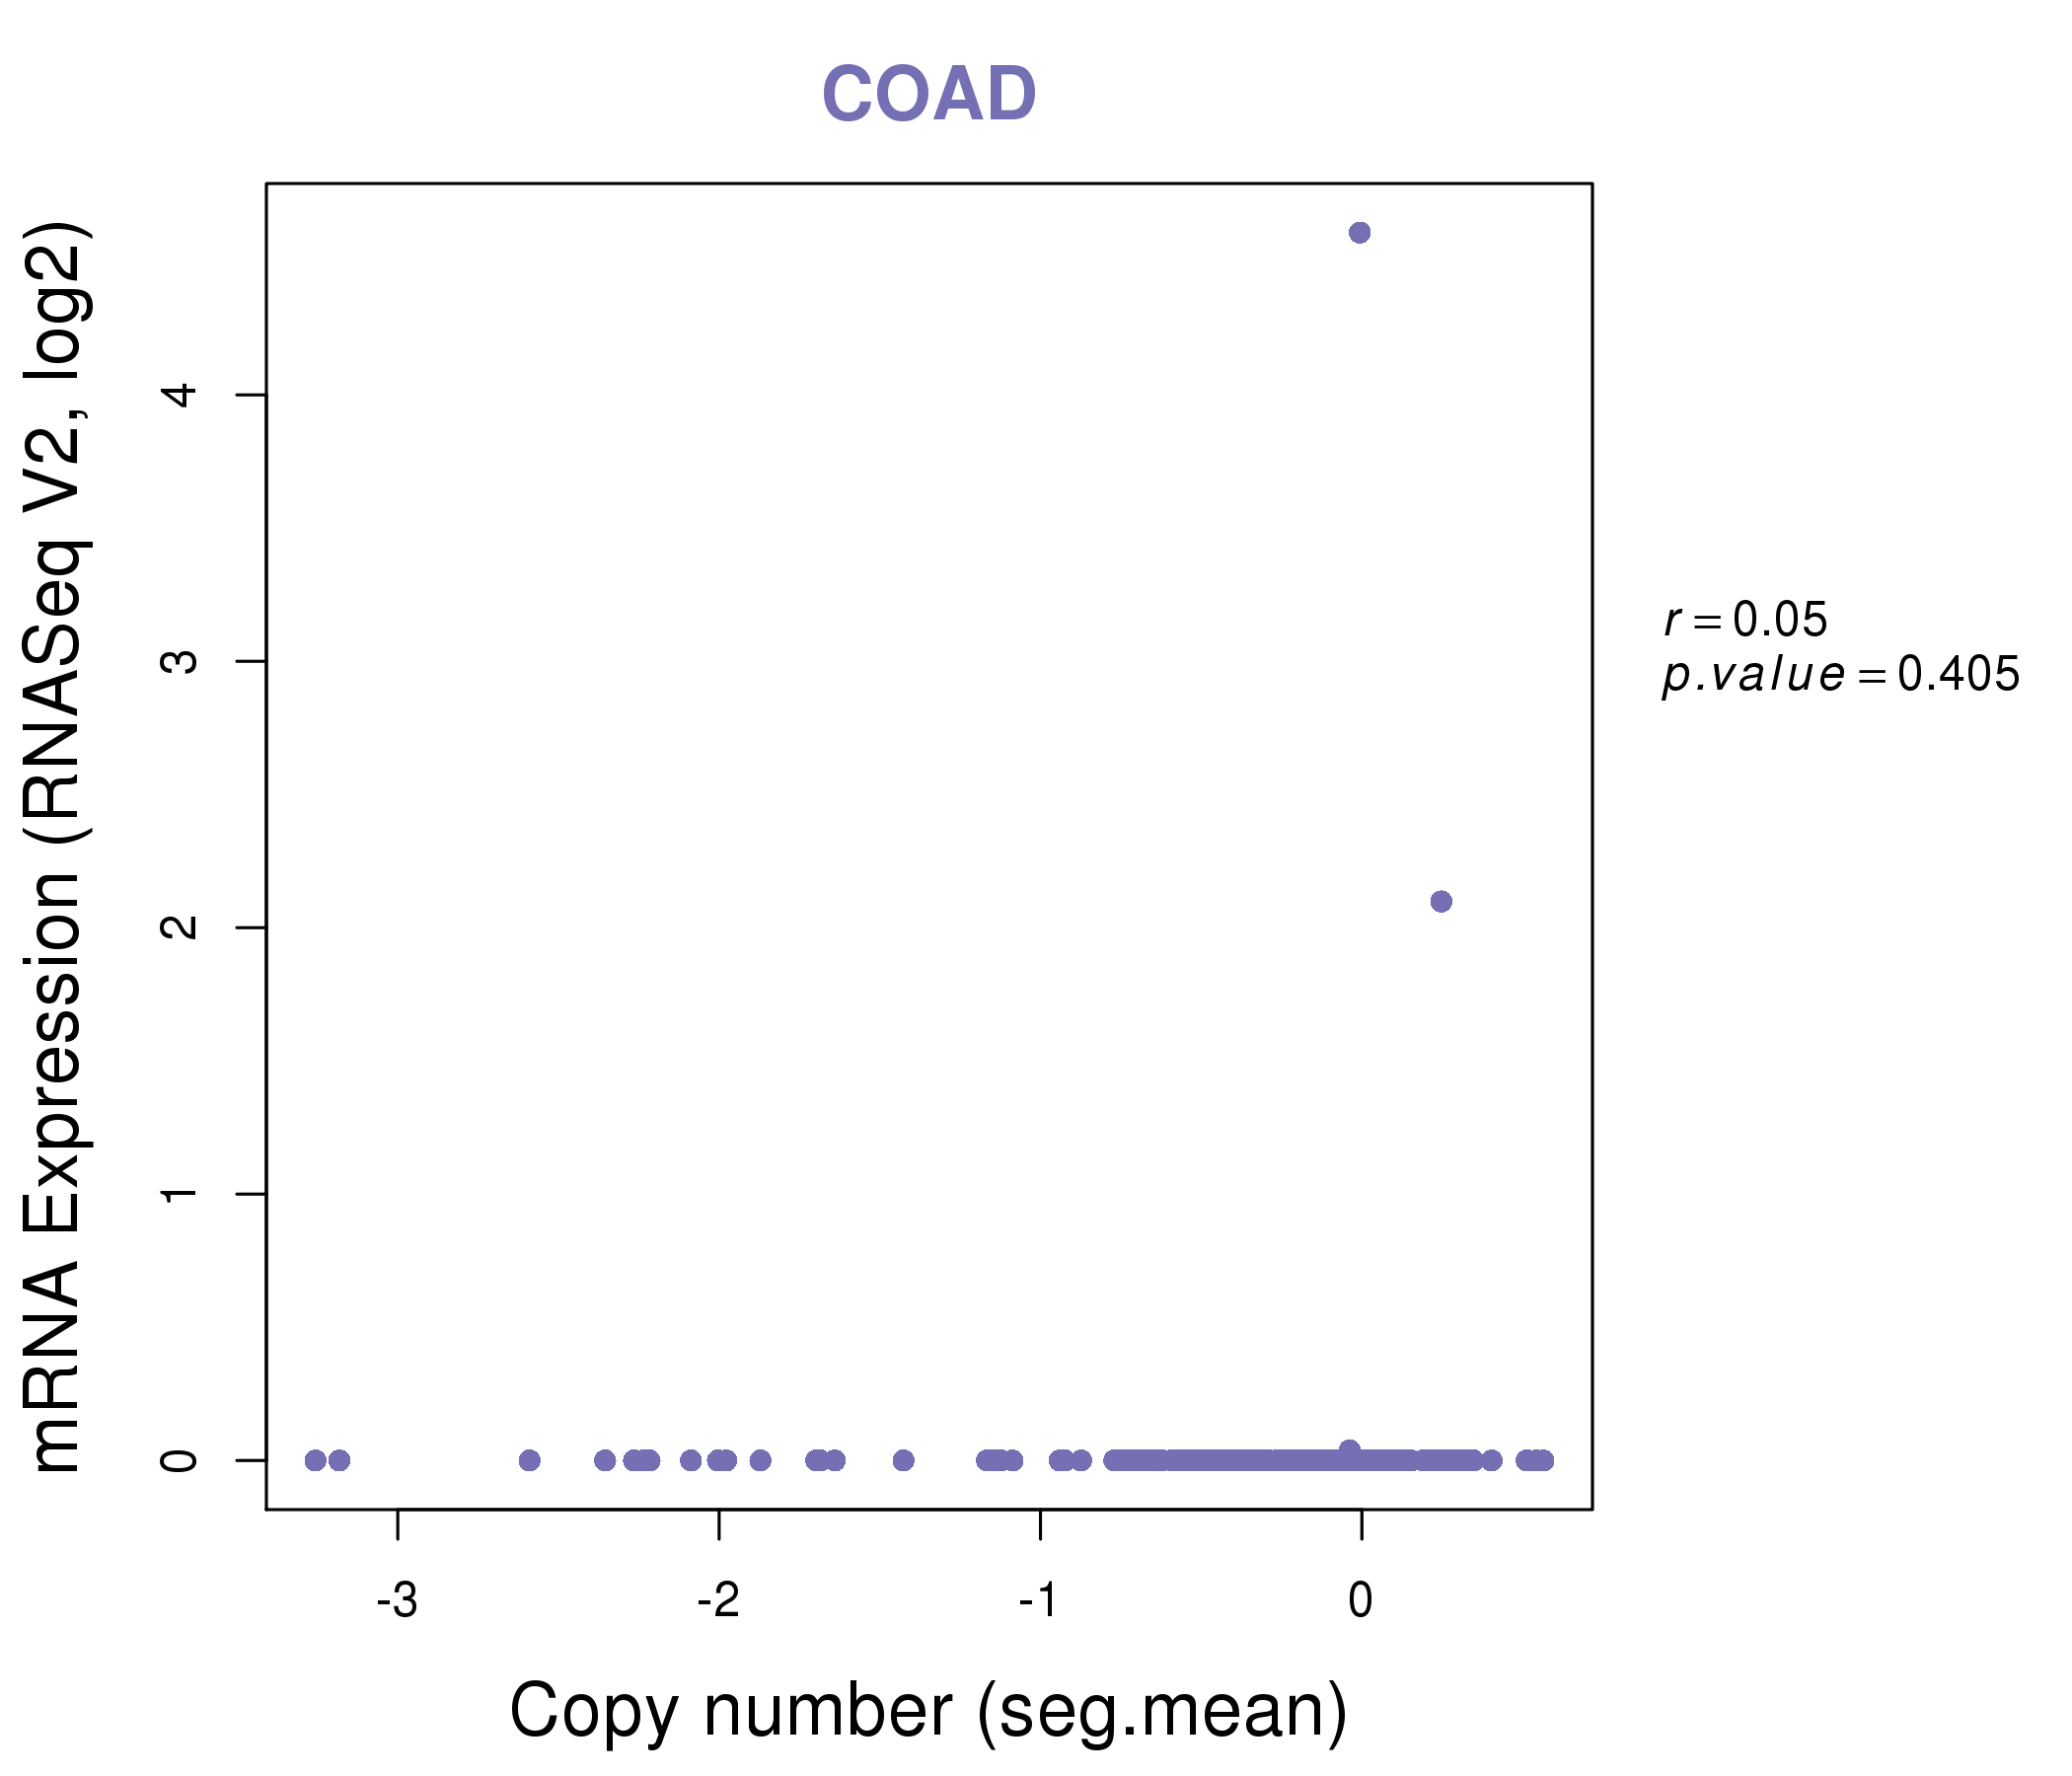
| * This plots show the correlation between CNV and gene expression. |
: Open all plots for all cancer types
 |
|
 |
|
| Top |
| Gene-Gene Network Information |
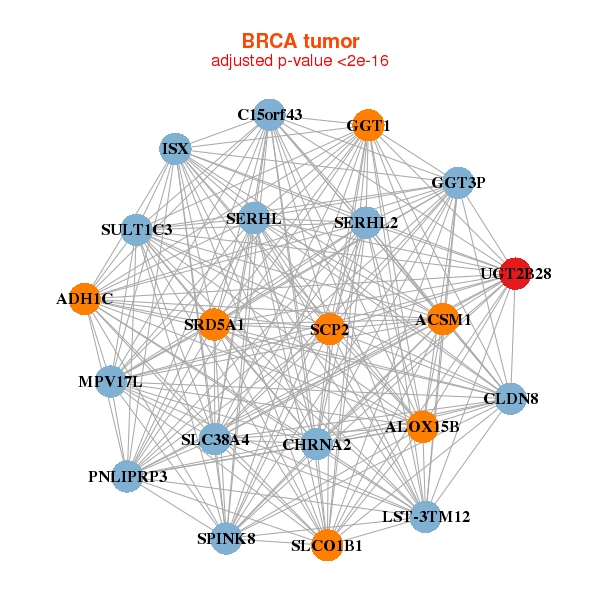
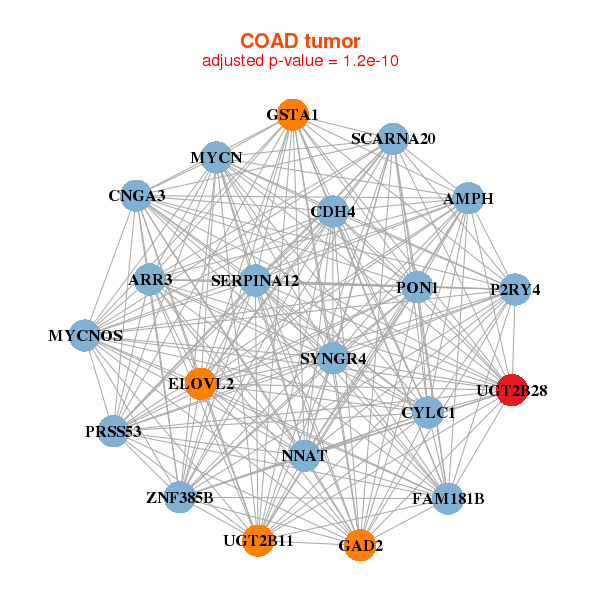
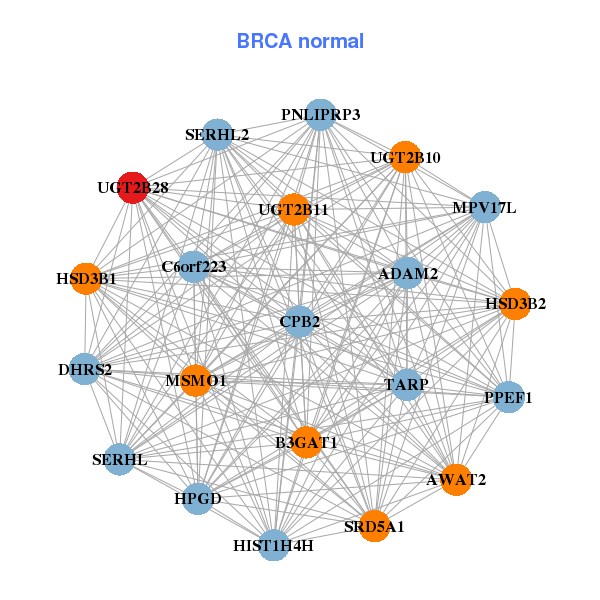
| * Co-Expression network figures were drawn using R package igraph. Only the top 20 genes with the highest correlations were shown. Red circle: input gene, orange circle: cell metabolism gene, sky circle: other gene |
: Open all plots for all cancer types
 |
|
| ACSM1,ADH1C,ALOX15B,C15orf43,CHRNA2,CLDN8,GGT1, GGT3P,ISX,LST-3TM12,MPV17L,PNLIPRP3,SCP2,SERHL2, SERHL,SLC38A4,SLCO1B1,SPINK8,SRD5A1,SULT1C3,UGT2B28 | ADAM2,AWAT2,B3GAT1,C6orf223,CPB2,DHRS2,HIST1H4H, HPGD,HSD3B1,HSD3B2,MPV17L,PNLIPRP3,PPEF1,MSMO1, SERHL2,SERHL,SRD5A1,TARP,UGT2B10,UGT2B11,UGT2B28 |
 |
|
| AMPH,ARR3,CDH4,CNGA3,CYLC1,ELOVL2,FAM181B, GAD2,GSTA1,MYCN,MYCNOS,NNAT,P2RY4,PON1, PRSS53,SCARNA20,SERPINA12,SYNGR4,UGT2B11,UGT2B28,ZNF385B | ACBD4,ACY1,AKR1C3,AKR7A3,BPHL,C11orf80,C5orf47, CCDC17,FAM3B,GLYCTK,HCG9,HSD17B3,LIN7A,MYL5, RBKS,RELL2,SCRN2,SLC16A5,SLC25A34,UCKL1,UGT2B28 |
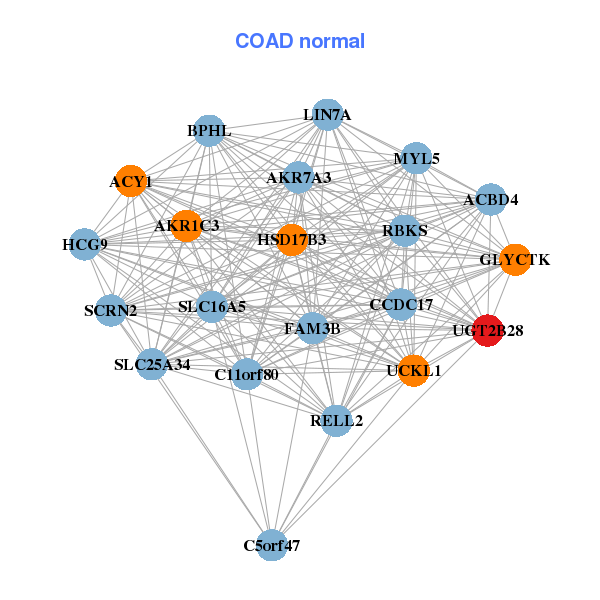
| * Co-Expression network figures were drawn using R package igraph. Only the top 20 genes with the highest correlations were shown. Red circle: input gene, orange circle: cell metabolism gene, sky circle: other gene |
: Open all plots for all cancer types
| Top |
: Open all interacting genes' information including KEGG pathway for all interacting genes from DAVID
| Top |
| Pharmacological Information for UGT2B28 |
| There's no related Drug. |
| Top |
| Cross referenced IDs for UGT2B28 |
| * We obtained these cross-references from Uniprot database. It covers 150 different DBs, 18 categories. http://www.uniprot.org/help/cross_references_section |
: Open all cross reference information
|
Copyright © 2016-Present - The Univsersity of Texas Health Science Center at Houston @ |