|
|||||||||||||||||||||||||||||||||||||||||||||||||||||||||||||||||||||||||||||||||||||||||||||||||||||||||||||||||||||||||||||||||||||||||||||||||||||||||||||||||||||||||||||||||||||||||||||||||||||||||||||||||||||||||||||||||||||||||||||||||||||||||||||||||||||||||||||||||||||||||||||||||||||||||||||||||||||||||||||||||||||||||||||||||||||||||||||||||||||||||||||||||||||||||||||||||||||||||||||||||||||||||||||||||||||||
| |
| Phenotypic Information (metabolism pathway, cancer, disease, phenome) |
| |
| |
| Gene-Gene Network Information: Co-Expression Network, Interacting Genes & KEGG |
| |
|


| Gene Summary for UGT1A3 |
| Basic gene info. | Gene symbol | UGT1A3 |
| Gene name | UDP glucuronosyltransferase 1 family, polypeptide A3 | |
| Synonyms | UDPGT|UDPGT 1-3|UGT-1C|UGT1-03|UGT1.3|UGT1C | |
| Cytomap | UCSC genome browser: 2q37 | |
| Genomic location | chr2 :234637772-234681945 | |
| Type of gene | protein-coding | |
| RefGenes | NM_019093.2, | |
| Ensembl id | ENSG00000243135 | |
| Description | UDP glycosyltransferase 1 family, polypeptide A3UDP-glucuronosyltransferase 1-3UDP-glucuronosyltransferase 1-CUDP-glucuronosyltransferase 1A3UGT1*3 | |
| Modification date | 20141211 | |
| dbXrefs | MIM : 606428 | |
| HGNC : HGNC | ||
| Ensembl : ENSG00000243135 | ||
| HPRD : 07566 | ||
| Vega : OTTHUMG00000059118 | ||
| Protein | UniProt: go to UniProt's Cross Reference DB Table | |
| Expression | CleanEX: HS_UGT1A3 | |
| BioGPS: 54659 | ||
| Gene Expression Atlas: ENSG00000243135 | ||
| The Human Protein Atlas: ENSG00000243135 | ||
| Pathway | NCI Pathway Interaction Database: UGT1A3 | |
| KEGG: UGT1A3 | ||
| REACTOME: UGT1A3 | ||
| ConsensusPathDB | ||
| Pathway Commons: UGT1A3 | ||
| Metabolism | MetaCyc: UGT1A3 | |
| HUMANCyc: UGT1A3 | ||
| Regulation | Ensembl's Regulation: ENSG00000243135 | |
| miRBase: chr2 :234,637,772-234,681,945 | ||
| TargetScan: NM_019093 | ||
| cisRED: ENSG00000243135 | ||
| Context | iHOP: UGT1A3 | |
| cancer metabolism search in PubMed: UGT1A3 | ||
| UCL Cancer Institute: UGT1A3 | ||
| Assigned class in ccmGDB | C | |
| Top |
| Phenotypic Information for UGT1A3(metabolism pathway, cancer, disease, phenome) |
| Cancer | CGAP: UGT1A3 |
| Familial Cancer Database: UGT1A3 | |
| * This gene is included in those cancer gene databases. |
|
|
|
|
|
|
| |||||||||||||||||||||||||||||||||||||||||||||||||||||||||||||||||||||||||||||||||||||||||||||||||||||||||||||||||||||||||||||||||||||||||||||||||||||||||||||||||||||||||||||||||||||||||||||||||||||||||||||||||||||||||||||||||||||||||||||||||||||||||||||||||||||||||||||||||||||||||||||||||||||||||||||||||||||||||||||||||||||||||||||||||||||||||||||||||||||||||||||||||||||||||||||||||||||||||||||||||||||||||||||||||
Oncogene 1 | Significant driver gene in | ||||||||||||||||||||||||||||||||||||||||||||||||||||||||||||||||||||||||||||||||||||||||||||||||||||||||||||||||||||||||||||||||||||||||||||||||||||||||||||||||||||||||||||||||||||||||||||||||||||||||||||||||||||||||||||||||||||||||||||||||||||||||||||||||||||||||||||||||||||||||||||||||||||||||||||||||||||||||||||||||||||||||||||||||||||||||||||||||||||||||||||||||||||||||||||||||||||||||||||||||||||||||||||||||||||||
| cf) number; DB name 1 Oncogene; http://nar.oxfordjournals.org/content/35/suppl_1/D721.long, 2 Tumor Suppressor gene; https://bioinfo.uth.edu/TSGene/, 3 Cancer Gene Census; http://www.nature.com/nrc/journal/v4/n3/abs/nrc1299.html, 4 CancerGenes; http://nar.oxfordjournals.org/content/35/suppl_1/D721.long, 5 Network of Cancer Gene; http://ncg.kcl.ac.uk/index.php, 1Therapeutic Vulnerabilities in Cancer; http://cbio.mskcc.org/cancergenomics/statius/ |
| KEGG_ASCORBATE_AND_ALDARATE_METABOLISM KEGG_STARCH_AND_SUCROSE_METABOLISM KEGG_RETINOL_METABOLISM KEGG_PORPHYRIN_AND_CHLOROPHYLL_METABOLISM KEGG_METABOLISM_OF_XENOBIOTICS_BY_CYTOCHROME_P450 KEGG_DRUG_METABOLISM_CYTOCHROME_P450 KEGG_DRUG_METABOLISM_OTHER_ENZYMES | |
| OMIM | |
| Orphanet | |
| Disease | KEGG Disease: UGT1A3 |
| MedGen: UGT1A3 (Human Medical Genetics with Condition) | |
| ClinVar: UGT1A3 | |
| Phenotype | MGI: UGT1A3 (International Mouse Phenotyping Consortium) |
| PhenomicDB: UGT1A3 | |
| Mutations for UGT1A3 |
| * Under tables are showing count per each tissue to give us broad intuition about tissue specific mutation patterns.You can go to the detailed page for each mutation database's web site. |
| There's no structural variation information in COSMIC data for this gene. |
| * From mRNA Sanger sequences, Chitars2.0 arranged chimeric transcripts. This table shows UGT1A3 related fusion information. |
| ID | Head Gene | Tail Gene | Accession | Gene_a | qStart_a | qEnd_a | Chromosome_a | tStart_a | tEnd_a | Gene_a | qStart_a | qEnd_a | Chromosome_a | tStart_a | tEnd_a |
| Top |
| Mutation type/ Tissue ID | brca | cns | cerv | endome | haematopo | kidn | Lintest | liver | lung | ns | ovary | pancre | prost | skin | stoma | thyro | urina | |||
| Total # sample | 1 | |||||||||||||||||||
| GAIN (# sample) | ||||||||||||||||||||
| LOSS (# sample) | 1 |
| cf) Tissue ID; Tissue type (1; Breast, 2; Central_nervous_system, 3; Cervix, 4; Endometrium, 5; Haematopoietic_and_lymphoid_tissue, 6; Kidney, 7; Large_intestine, 8; Liver, 9; Lung, 10; NS, 11; Ovary, 12; Pancreas, 13; Prostate, 14; Skin, 15; Stomach, 16; Thyroid, 17; Urinary_tract) |
| Top |
|
 |
| Top |
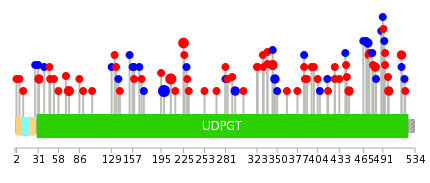
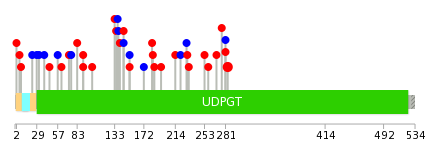
| Stat. for Non-Synonymous SNVs (# total SNVs=61) | (# total SNVs=32) |
 | 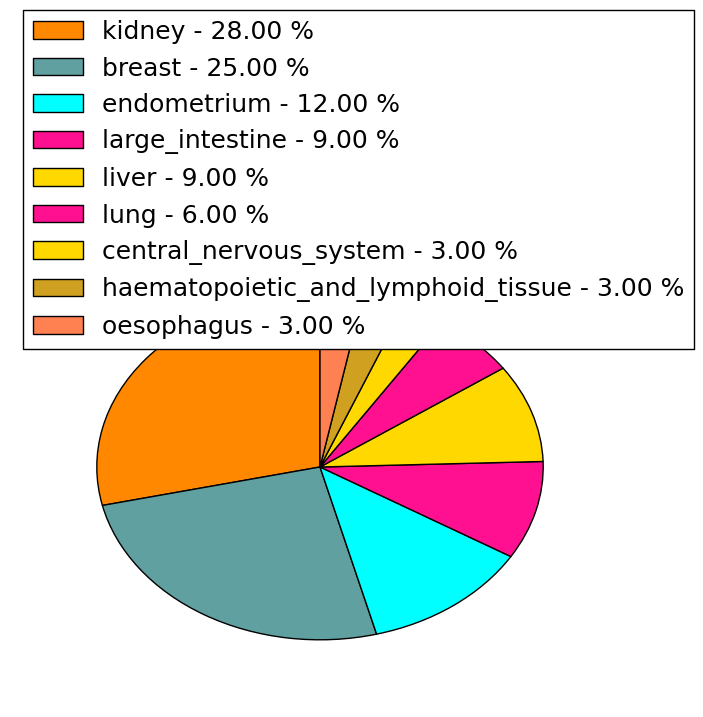 |
(# total SNVs=5) | (# total SNVs=2) |
 |  |
| Top |
| * When you move the cursor on each content, you can see more deailed mutation information on the Tooltip. Those are primary_site,primary_histology,mutation(aa),pubmedID. |
| GRCh37 position | Mutation(aa) | Unique sampleID count |
| chr2:234638369-234638369 | p.T199T | 8 |
| chr2:234638394-234638394 | p.M208L | 5 |
| chr2:234638445-234638445 | p.H225Y | 4 |
| chr2:234638283-234638283 | p.L173fs*1 | 3 |
| chr2:234681161-234681161 | p.K521E | 3 |
| chr2:234676526-234676526 | p.S344L | 3 |
| chr2:234637988-234637988 | p.E72D | 3 |
| chr2:234681146-234681146 | p.R516W | 2 |
| chr2:234681041-234681041 | p.D481N | 2 |
| chr2:234676494-234676494 | p.? | 2 |
| Top |
|
 |
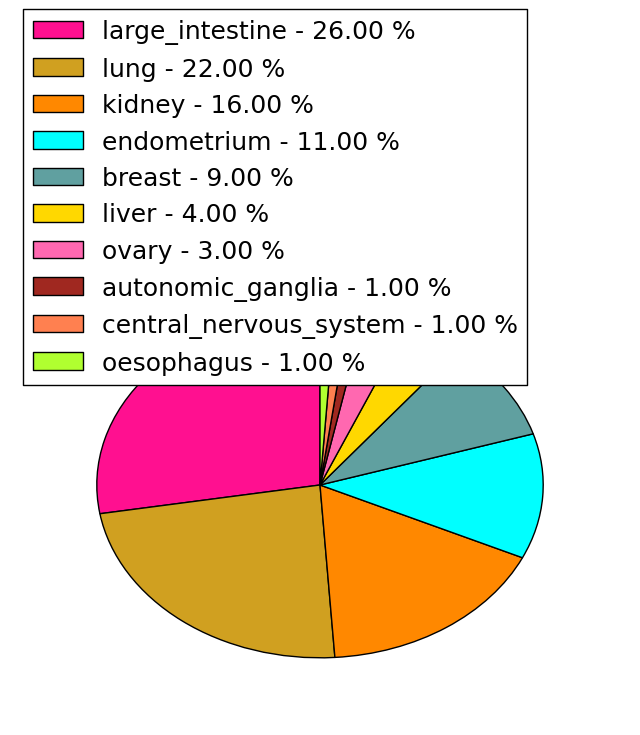
| Point Mutation/ Tissue ID | 1 | 2 | 3 | 4 | 5 | 6 | 7 | 8 | 9 | 10 | 11 | 12 | 13 | 14 | 15 | 16 | 17 | 18 | 19 | 20 |
| # sample | 3 | 2 | 1 | 3 | 1 | 1 | 2 | 5 | 1 | 1 | 15 | 1 | 5 | |||||||
| # mutation | 3 | 2 | 1 | 3 | 2 | 1 | 2 | 5 | 1 | 1 | 15 | 1 | 5 | |||||||
| nonsynonymous SNV | 3 | 1 | 1 | 1 | 1 | 1 | 5 | 1 | 1 | 10 | 1 | 2 | ||||||||
| synonymous SNV | 1 | 2 | 2 | 1 | 5 | 3 |
| cf) Tissue ID; Tissue type (1; BLCA[Bladder Urothelial Carcinoma], 2; BRCA[Breast invasive carcinoma], 3; CESC[Cervical squamous cell carcinoma and endocervical adenocarcinoma], 4; COAD[Colon adenocarcinoma], 5; GBM[Glioblastoma multiforme], 6; Glioma Low Grade, 7; HNSC[Head and Neck squamous cell carcinoma], 8; KICH[Kidney Chromophobe], 9; KIRC[Kidney renal clear cell carcinoma], 10; KIRP[Kidney renal papillary cell carcinoma], 11; LAML[Acute Myeloid Leukemia], 12; LUAD[Lung adenocarcinoma], 13; LUSC[Lung squamous cell carcinoma], 14; OV[Ovarian serous cystadenocarcinoma ], 15; PAAD[Pancreatic adenocarcinoma], 16; PRAD[Prostate adenocarcinoma], 17; SKCM[Skin Cutaneous Melanoma], 18:STAD[Stomach adenocarcinoma], 19:THCA[Thyroid carcinoma], 20:UCEC[Uterine Corpus Endometrial Carcinoma]) |
| Top |
| * We represented just top 10 SNVs. When you move the cursor on each content, you can see more deailed mutation information on the Tooltip. Those are primary_site, primary_histology, mutation(aa), pubmedID. |
| Genomic Position | Mutation(aa) | Unique sampleID count |
| chr2:234638622 | p.R284G | 3 |
| chr2:234638412 | p.S83L | 1 |
| chr2:234637957 | p.Q186R | 1 |
| chr2:234638190 | p.R91C | 1 |
| chr2:234638435 | p.P195S | 1 |
| chr2:234637988 | p.R91H | 1 |
| chr2:234638206 | p.M214L | 1 |
| chr2:234637776 | p.T103A | 1 |
| chr2:234638459 | p.S221S | 1 |
| chr2:234637997 | p.A2T | 1 |
| * Copy number data were extracted from TCGA using R package TCGA-Assembler. The URLs of all public data files on TCGA DCC data server were gathered on Jan-05-2015. Function ProcessCNAData in TCGA-Assembler package was used to obtain gene-level copy number value which is calculated as the average copy number of the genomic region of a gene. |
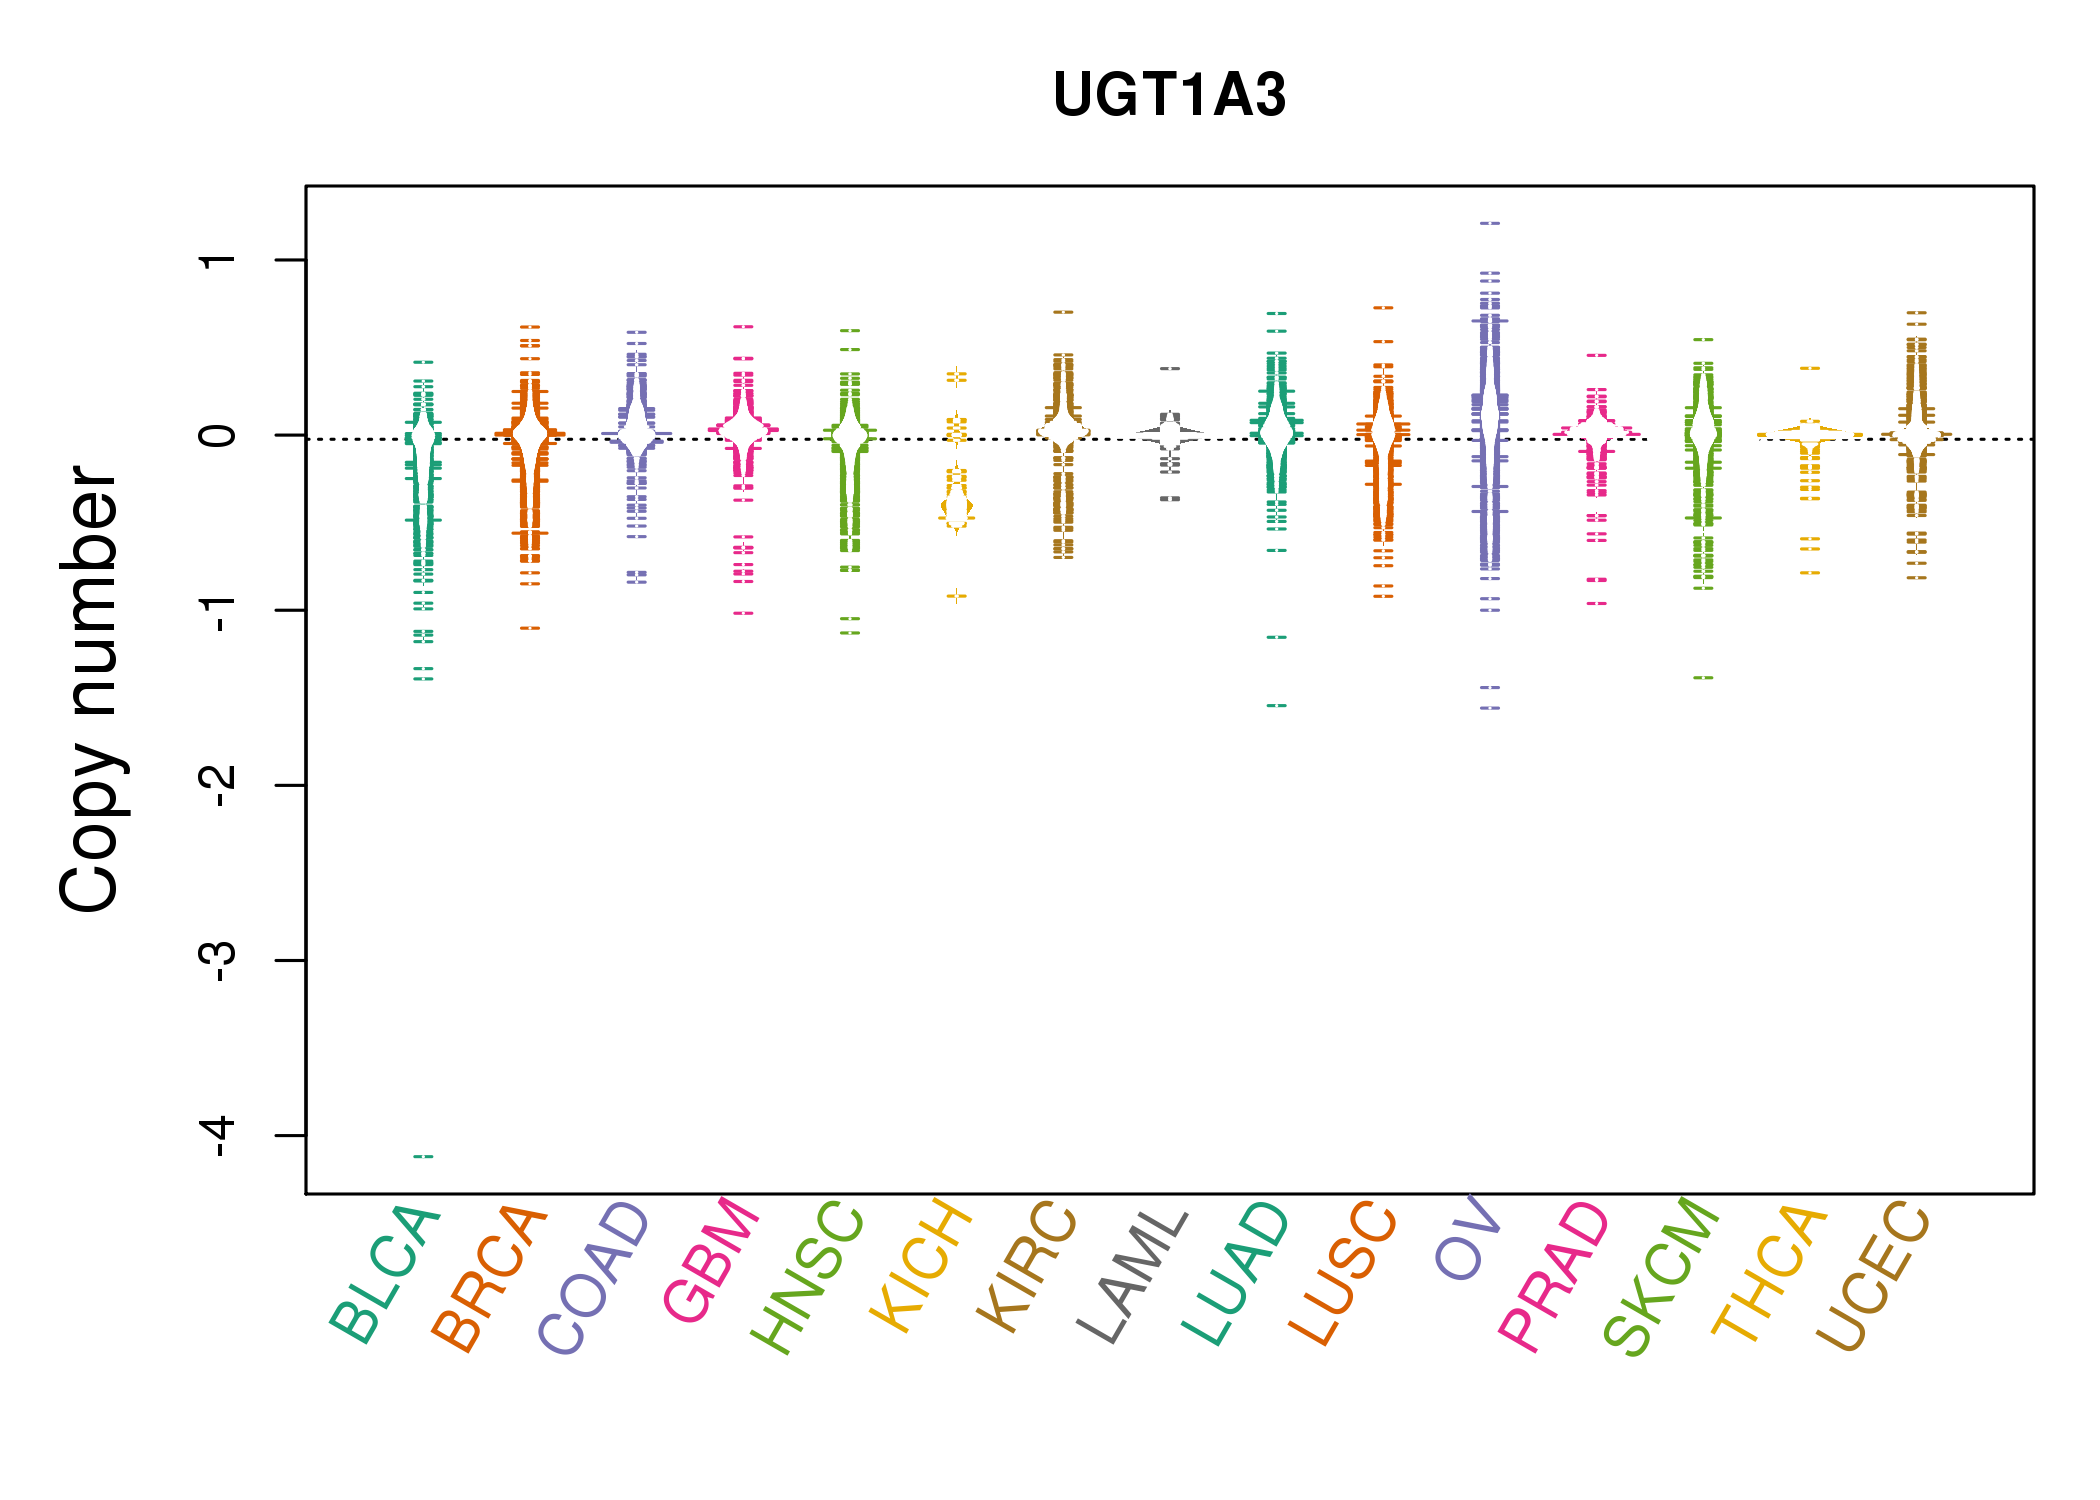 |
| cf) Tissue ID[Tissue type]: BLCA[Bladder Urothelial Carcinoma], BRCA[Breast invasive carcinoma], CESC[Cervical squamous cell carcinoma and endocervical adenocarcinoma], COAD[Colon adenocarcinoma], GBM[Glioblastoma multiforme], Glioma Low Grade, HNSC[Head and Neck squamous cell carcinoma], KICH[Kidney Chromophobe], KIRC[Kidney renal clear cell carcinoma], KIRP[Kidney renal papillary cell carcinoma], LAML[Acute Myeloid Leukemia], LUAD[Lung adenocarcinoma], LUSC[Lung squamous cell carcinoma], OV[Ovarian serous cystadenocarcinoma ], PAAD[Pancreatic adenocarcinoma], PRAD[Prostate adenocarcinoma], SKCM[Skin Cutaneous Melanoma], STAD[Stomach adenocarcinoma], THCA[Thyroid carcinoma], UCEC[Uterine Corpus Endometrial Carcinoma] |
| Top |
| Gene Expression for UGT1A3 |
| * CCLE gene expression data were extracted from CCLE_Expression_Entrez_2012-10-18.res: Gene-centric RMA-normalized mRNA expression data. |
 |
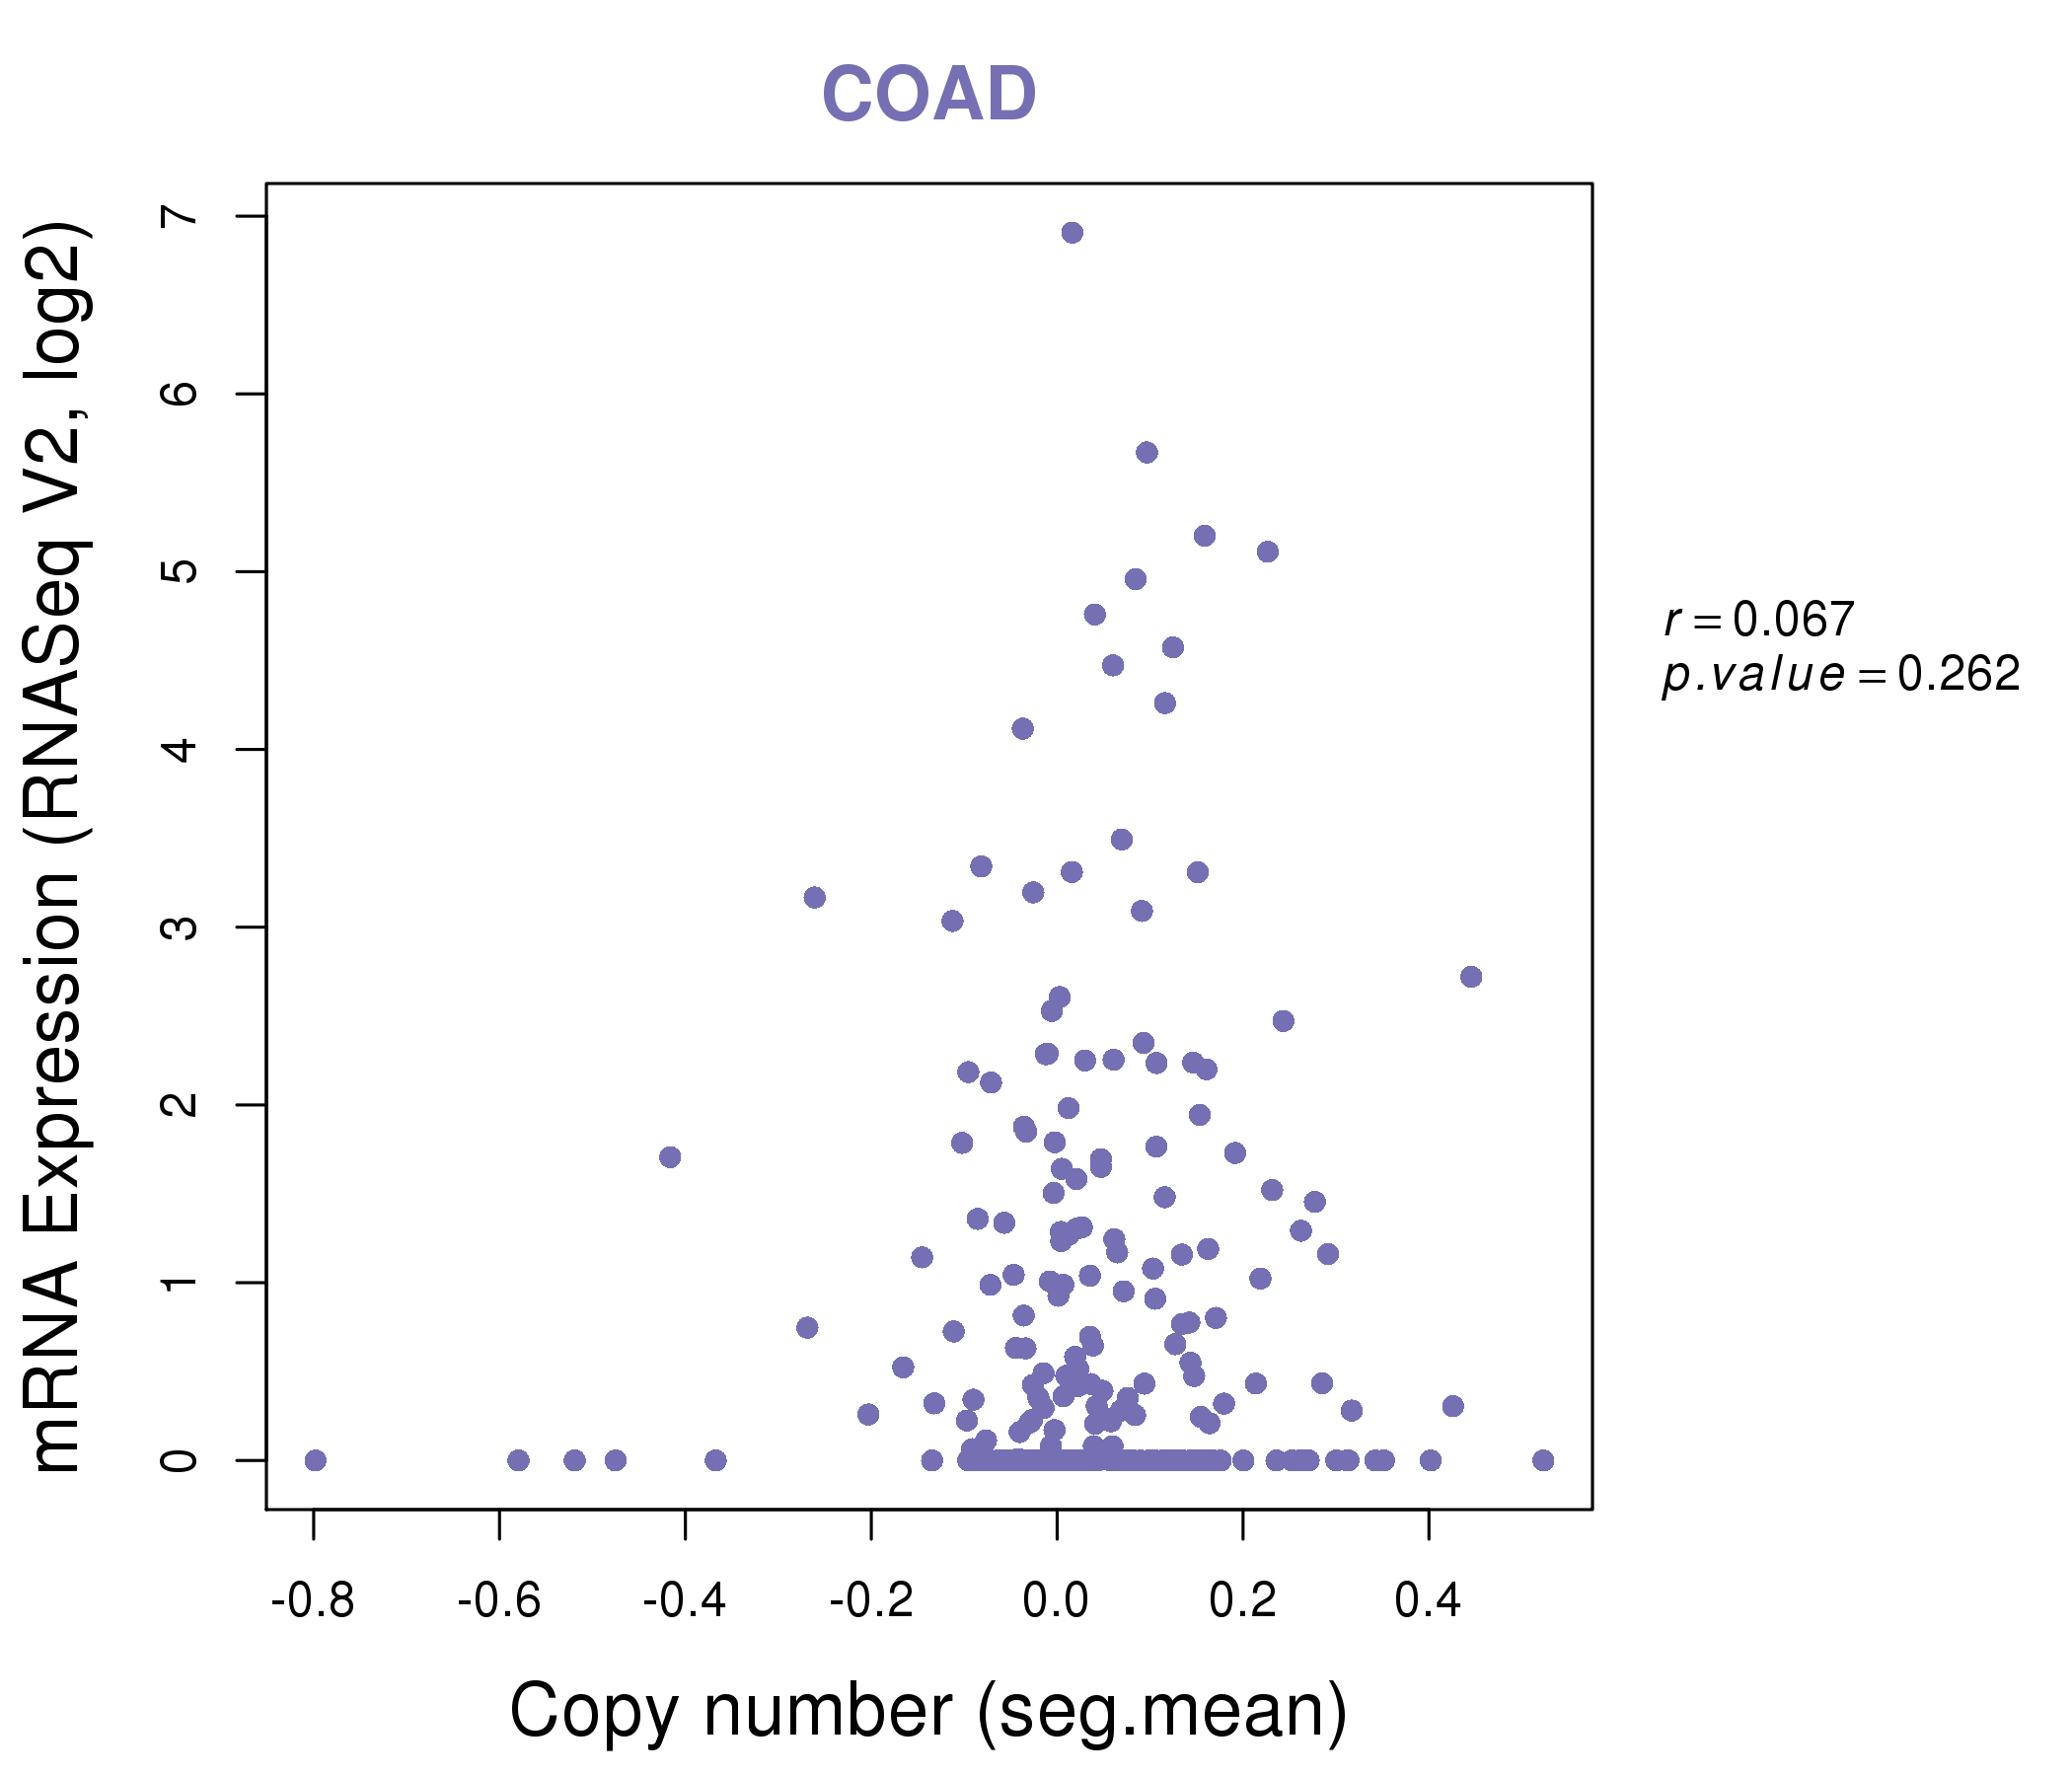
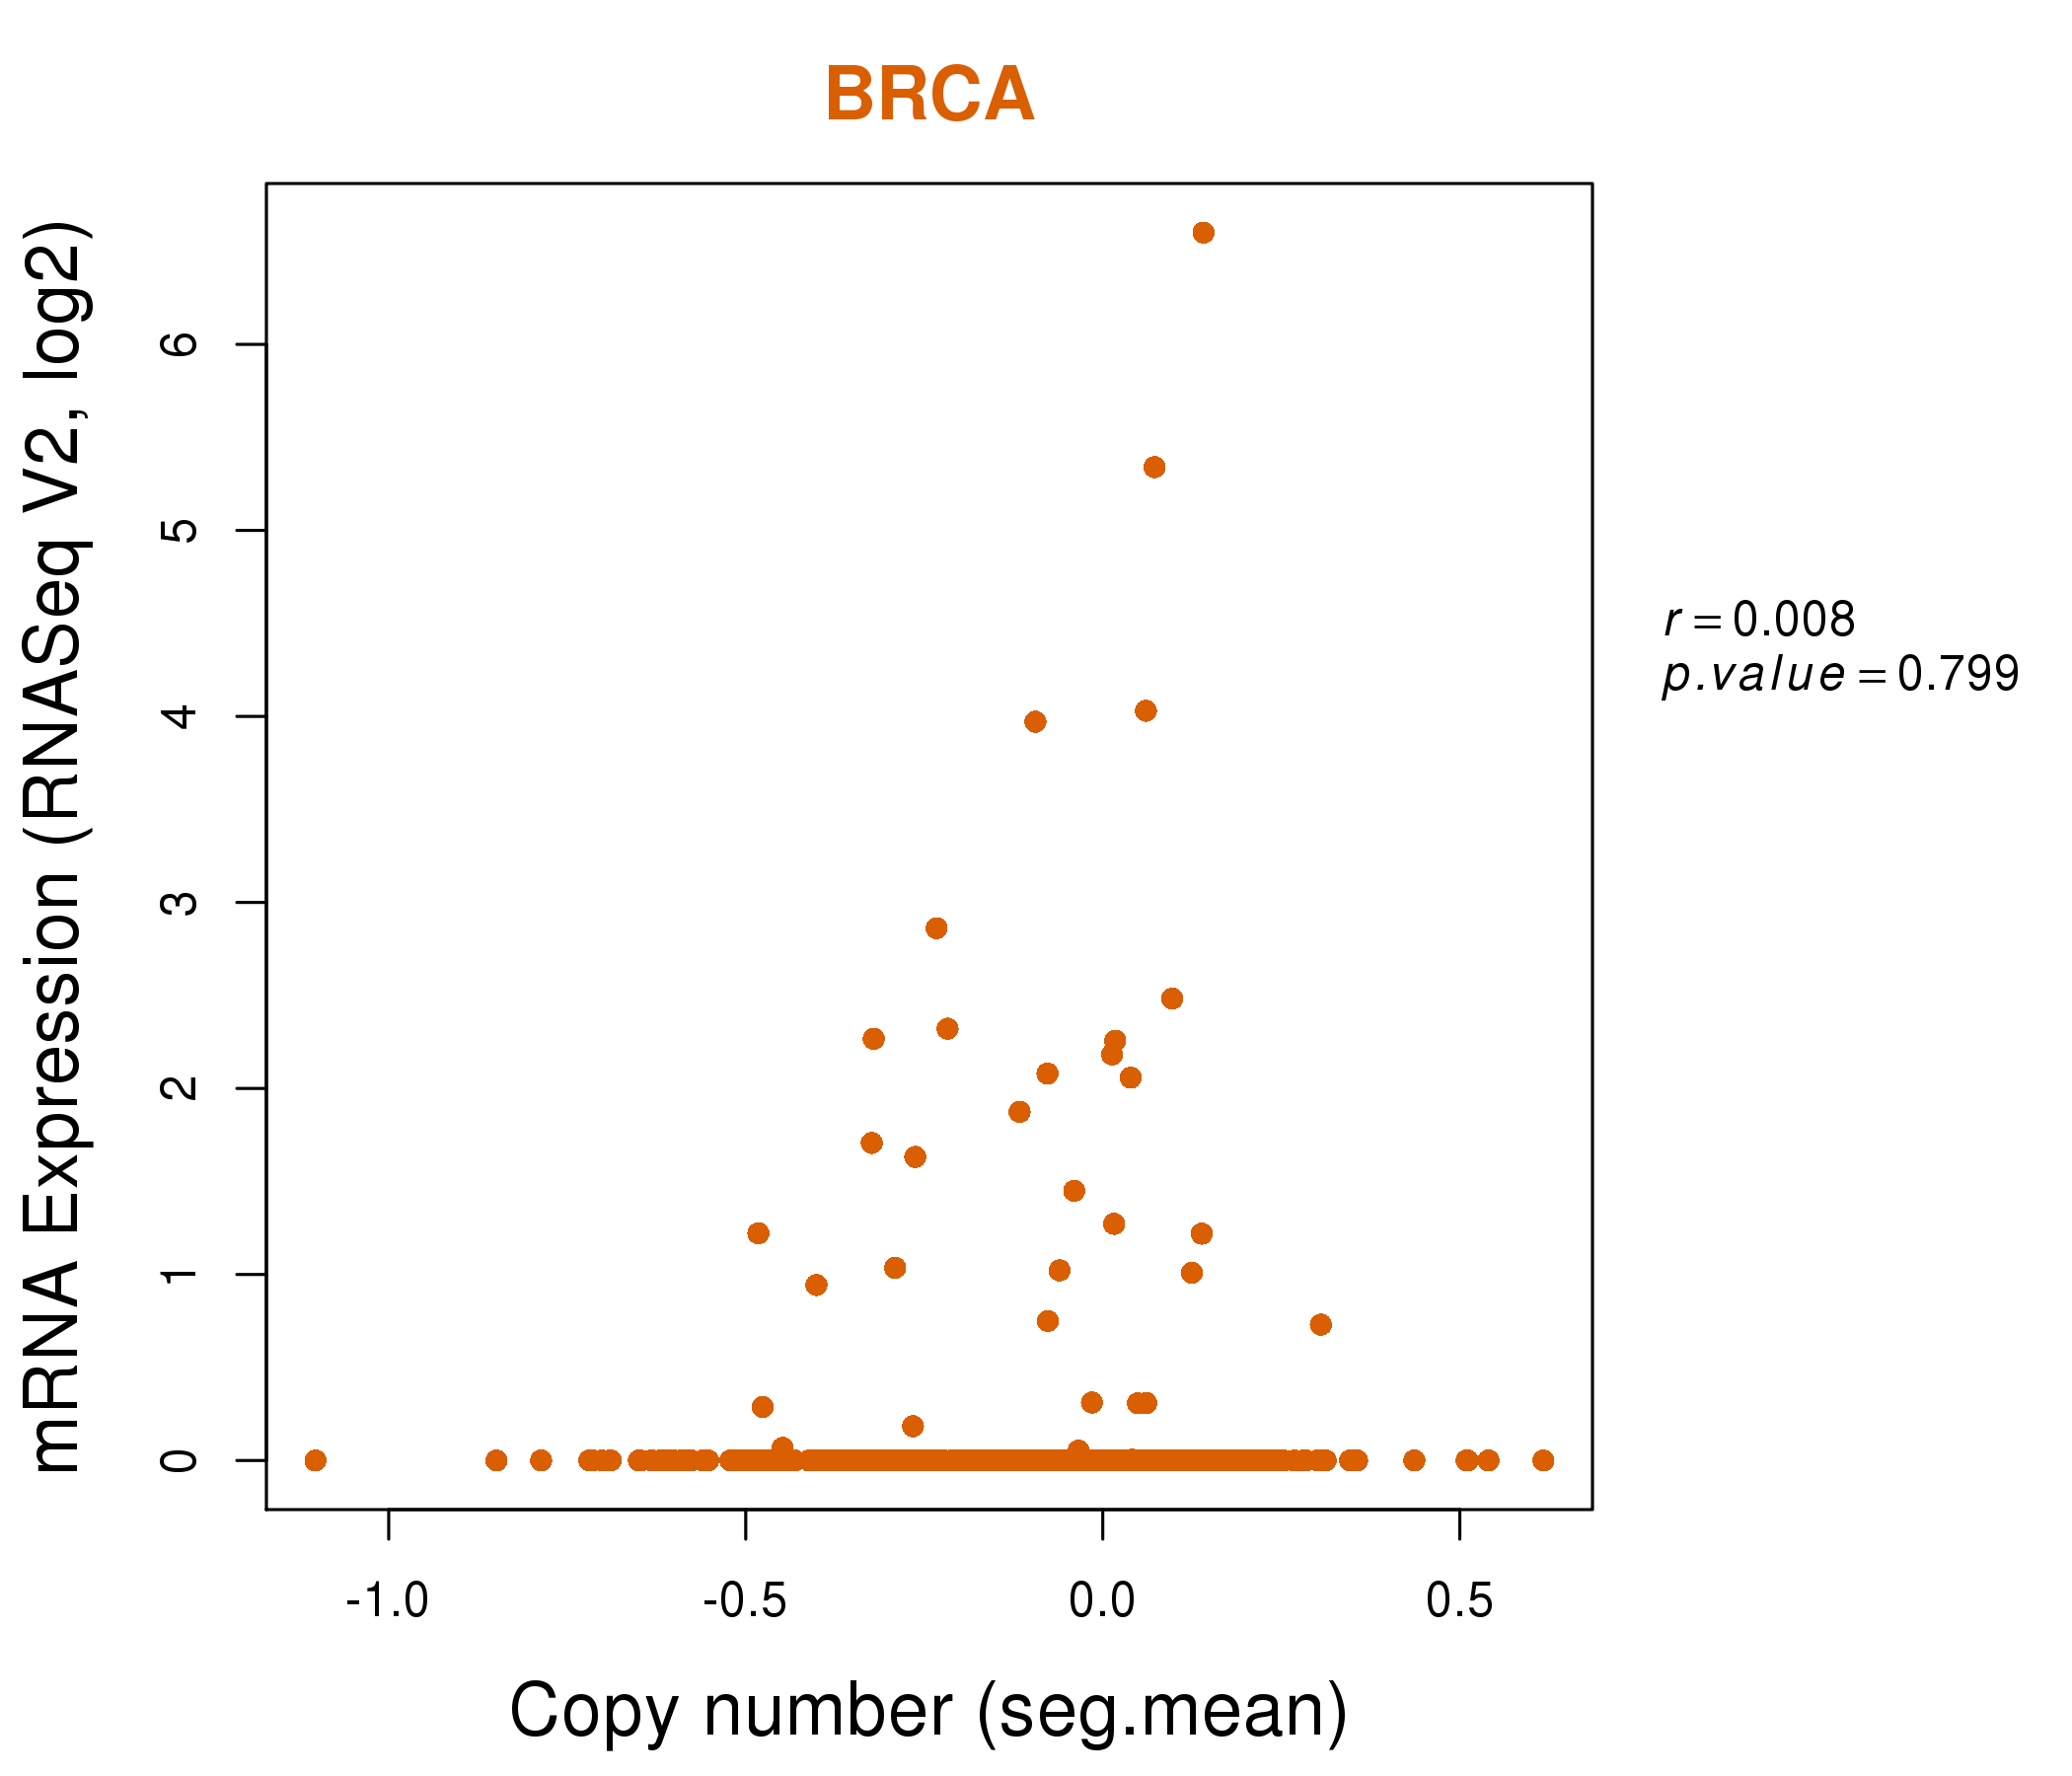
| * Normalized gene expression data of RNASeqV2 was extracted from TCGA using R package TCGA-Assembler. The URLs of all public data files on TCGA DCC data server were gathered at Jan-05-2015. Only eight cancer types have enough normal control samples for differential expression analysis. (t test, adjusted p<0.05 (using Benjamini-Hochberg FDR)) |
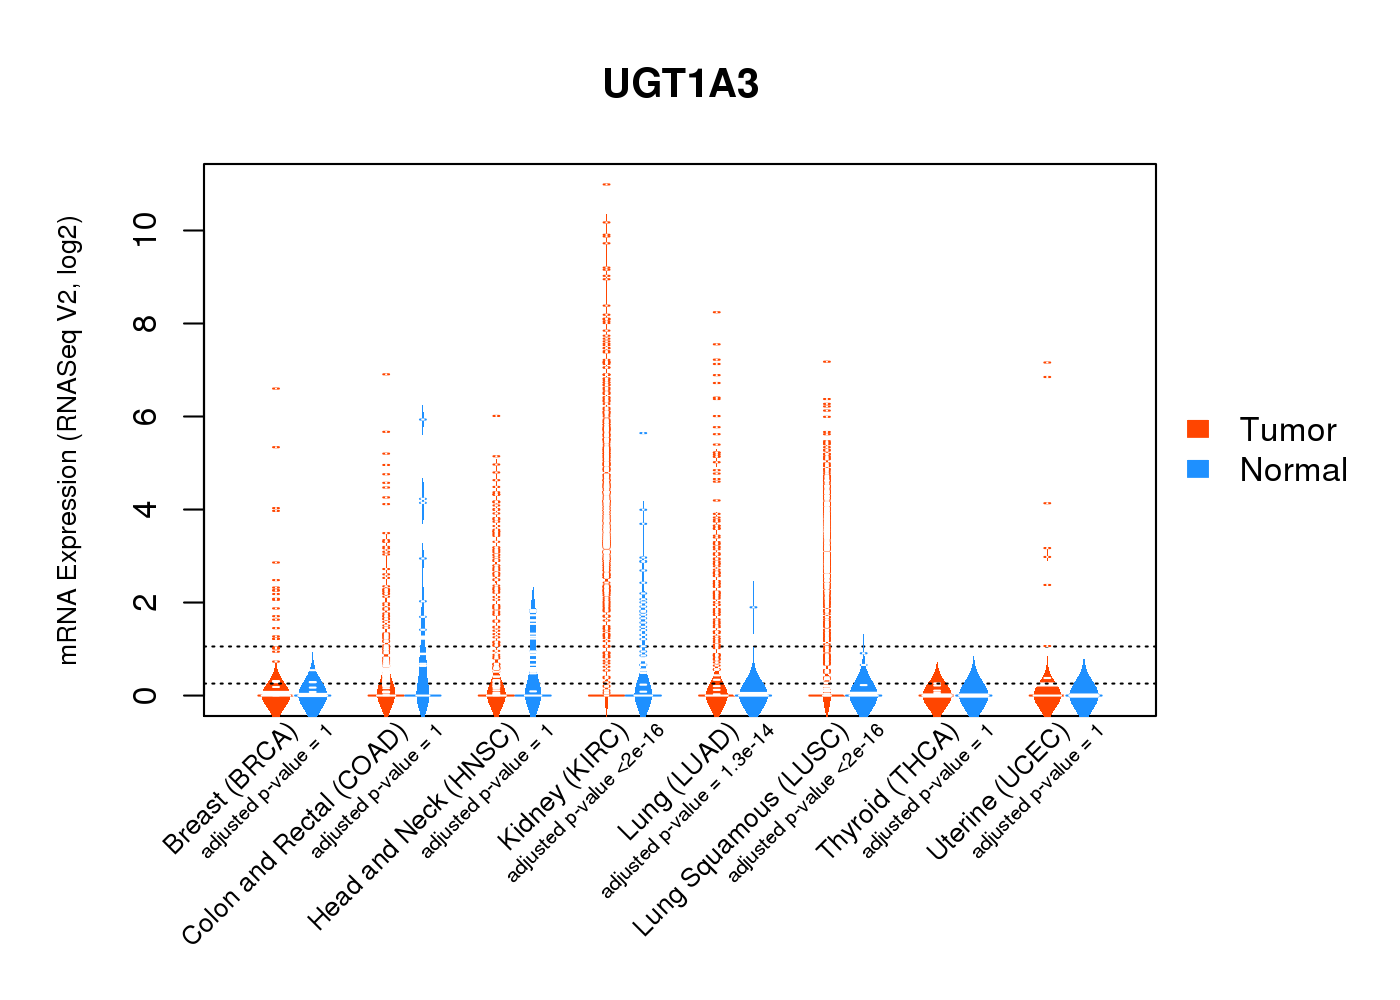 |
| Top |
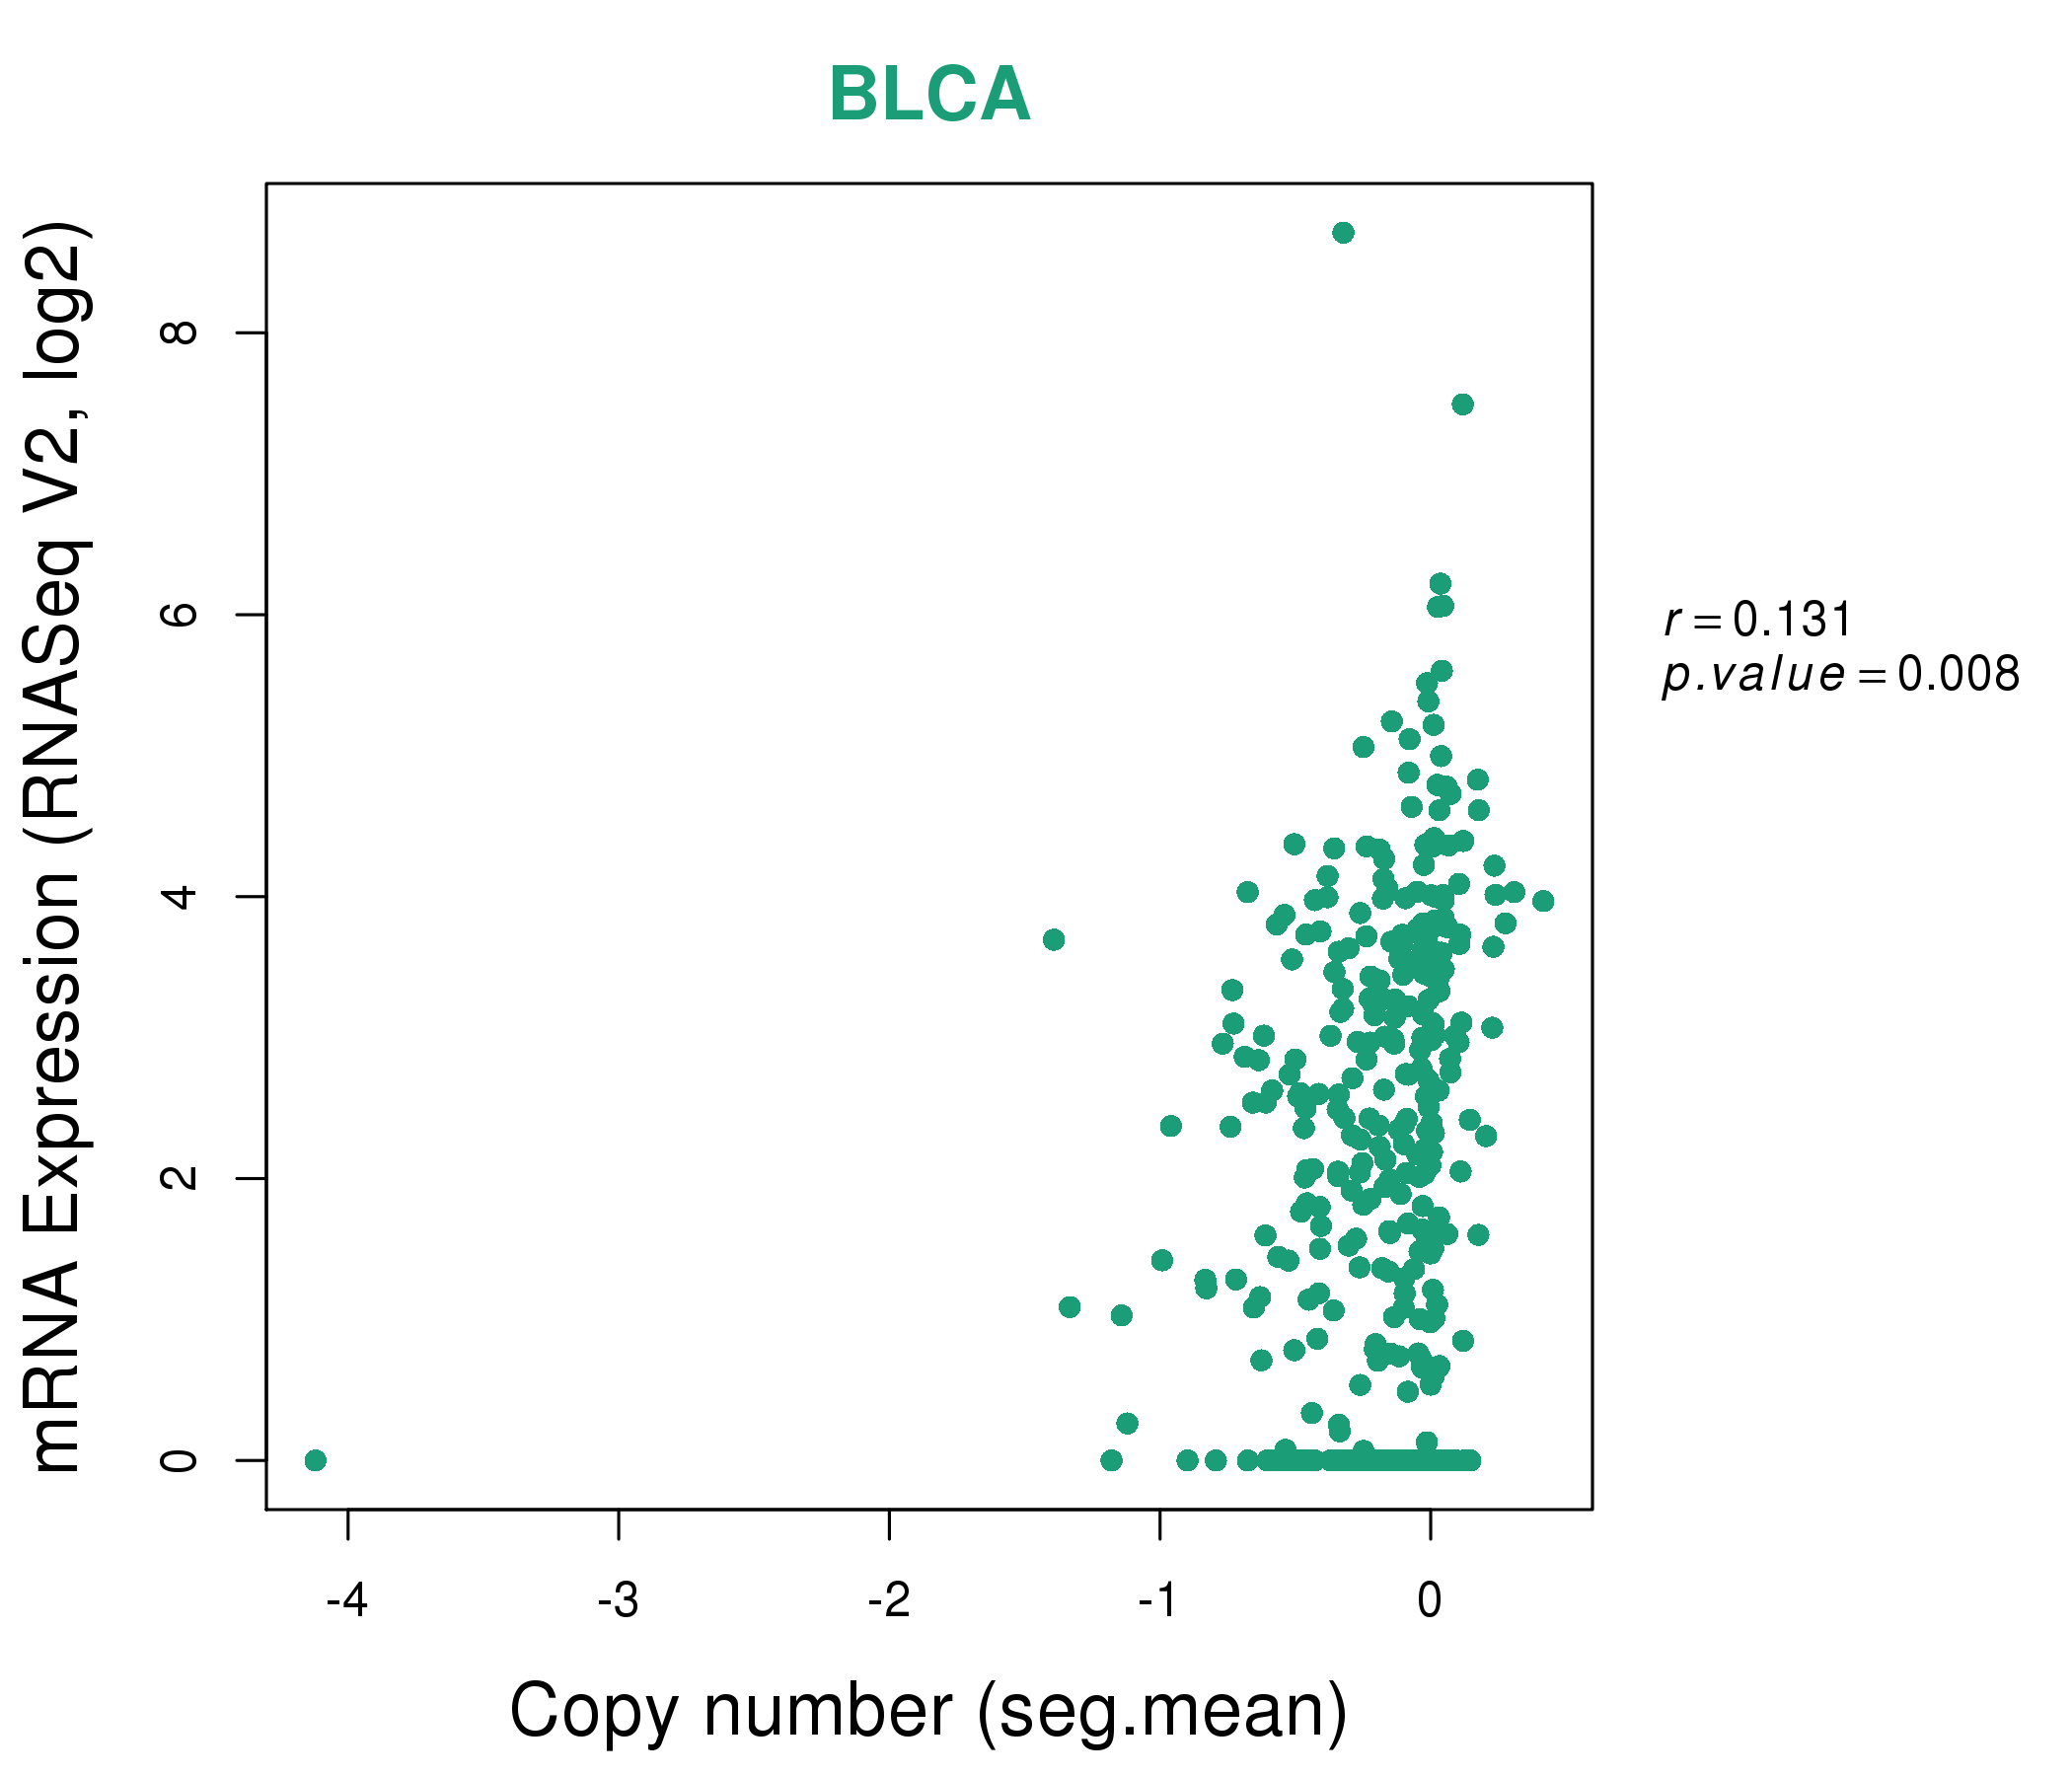
| * This plots show the correlation between CNV and gene expression. |
: Open all plots for all cancer types
 |
|
 |
|

| Top |
| Gene-Gene Network Information |
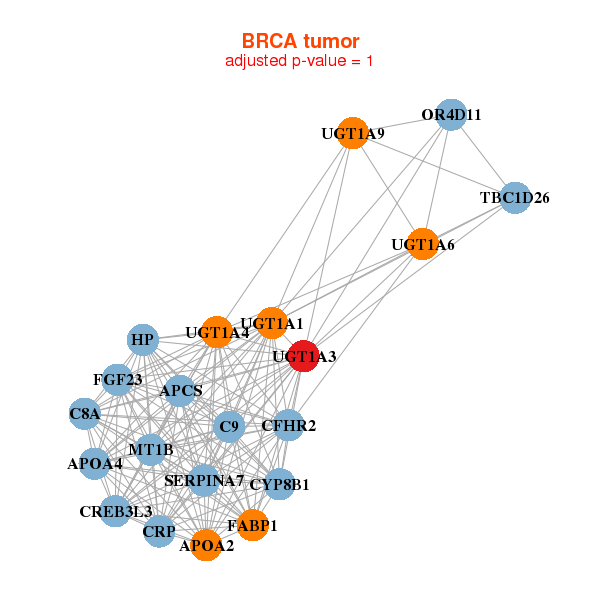
| * Co-Expression network figures were drawn using R package igraph. Only the top 20 genes with the highest correlations were shown. Red circle: input gene, orange circle: cell metabolism gene, sky circle: other gene |
: Open all plots for all cancer types
 |
| ||||
| APCS,APOA2,APOA4,C8A,C9,CFHR2,CREB3L3, CRP,CYP8B1,FABP1,FGF23,HP,MT1B,OR4D11, SERPINA7,TBC1D26,UGT1A1,UGT1A3,UGT1A4,UGT1A6,UGT1A9 | C12orf40,C8orf33,CES1P1,CRH,ELOVL6,GOLGA2P3Y,HMX2, HSD17B1,KRTAP10-10,NKX2-4,PISD,PQLC3,SEL1L2,SLC7A4, SPANXA2,SPANXC,SPANXD,SPATA22,SPZ1,SSTR2,UGT1A3 | ||||
 |
| ||||
| ABCG2,ALPI,C11orf86,LINC00520,C1orf94,CAPN11,CDHR2, CIDEC,CLDN23,DHRS9,FAM25BP,GDPD2,LOC646627,MYPN, NAT8,TRANK1,UGT1A1,UGT1A3,UGT1A4,UGT1A5,VSIG1 | ACE,CHRNA2,CREB3L3,CYP2C9,CYP4F2,DPP4,FGF19, HAPLN4,MEP1B,MGAM,MS4A10,MUC17,NTS,RBP2, SLC10A2,SLC23A1,SLC6A4,TM6SF2,UGT1A3,UGT1A4,UGT1A5 |
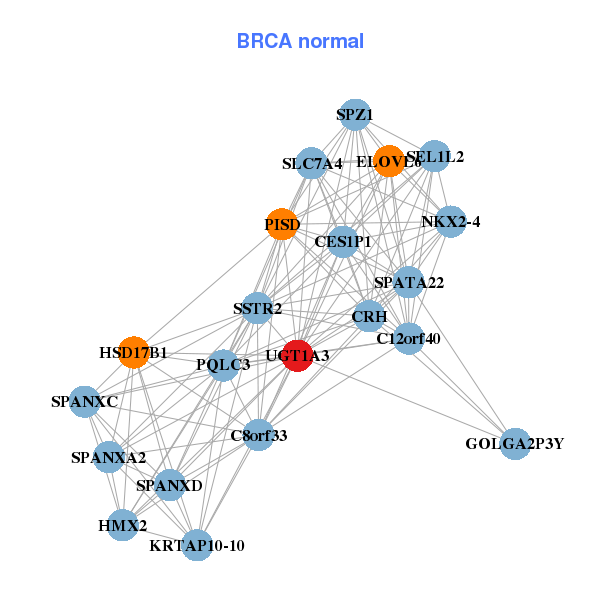

| * Co-Expression network figures were drawn using R package igraph. Only the top 20 genes with the highest correlations were shown. Red circle: input gene, orange circle: cell metabolism gene, sky circle: other gene |
: Open all plots for all cancer types
| Top |
: Open all interacting genes' information including KEGG pathway for all interacting genes from DAVID
| Top |
| Pharmacological Information for UGT1A3 |
| DB Category | DB Name | DB's ID and Url link |
| * Gene Centered Interaction Network. |
 |
| * Drug Centered Interaction Network. |
| DrugBank ID | Target Name | Drug Groups | Generic Name | Drug Centered Network | Drug Structure |
| DB01544 | UDP glucuronosyltransferase 1 family, polypeptide A3 | illicit; approved | Flunitrazepam | 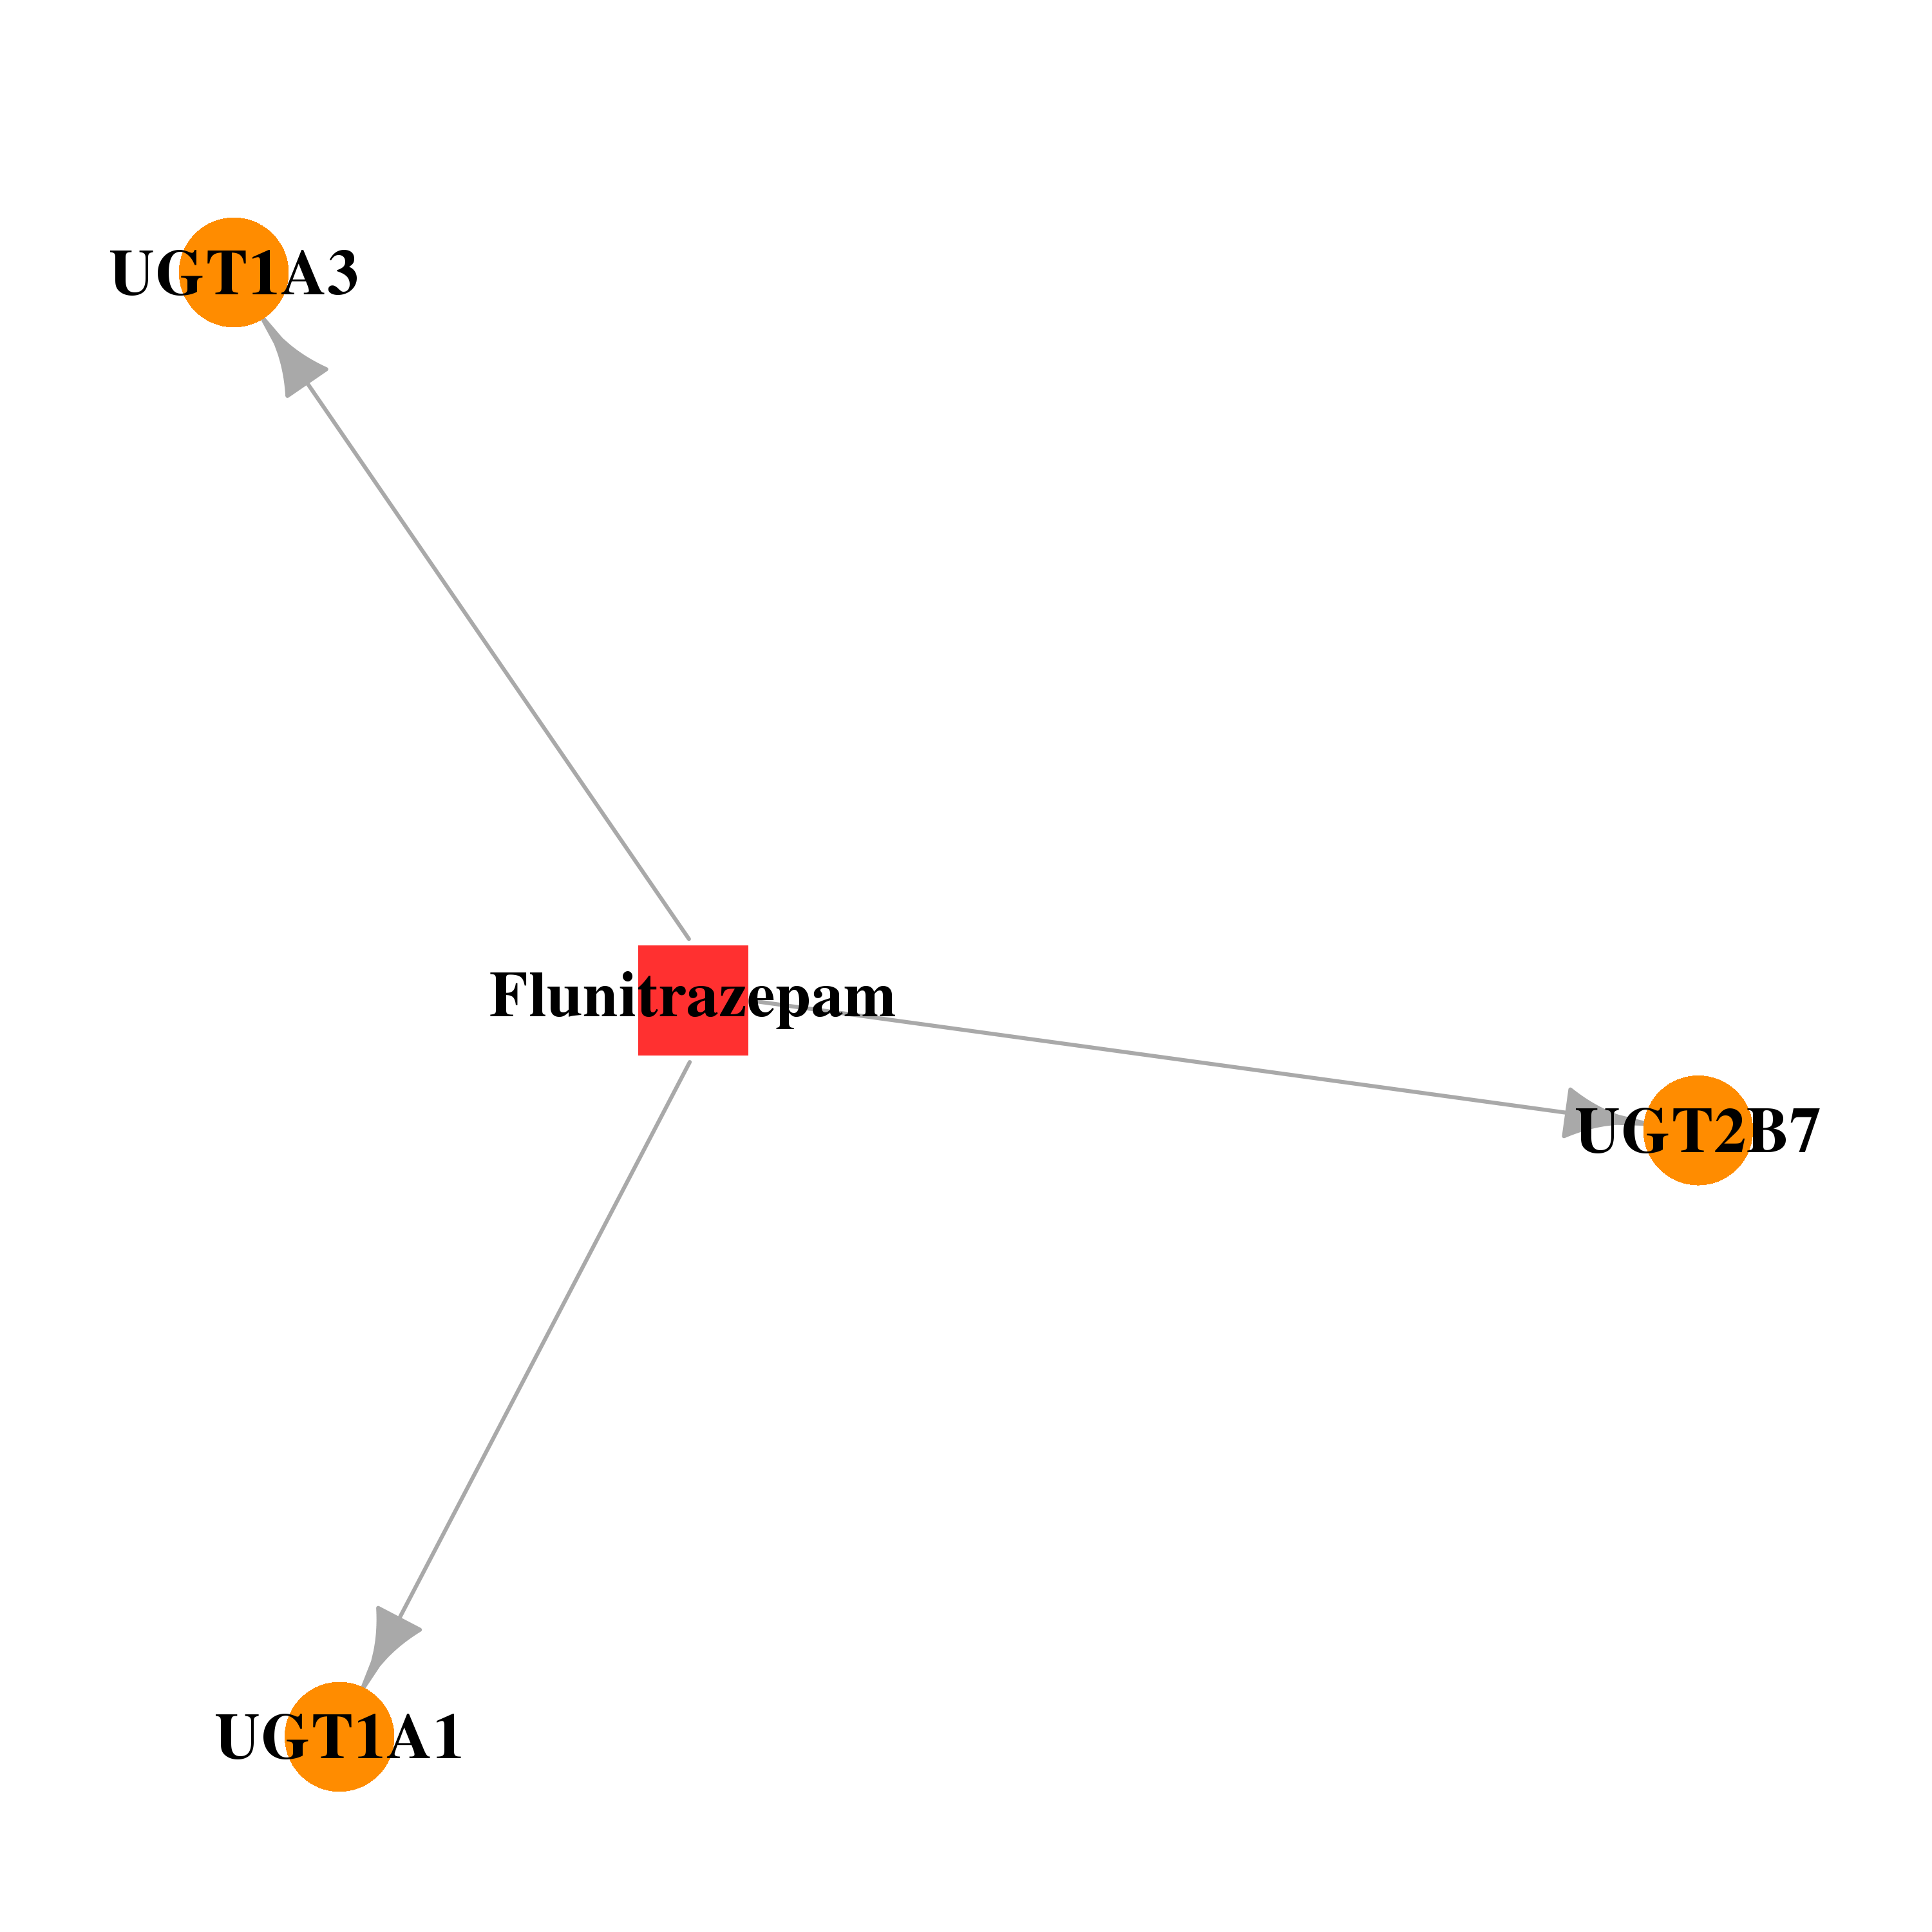 | 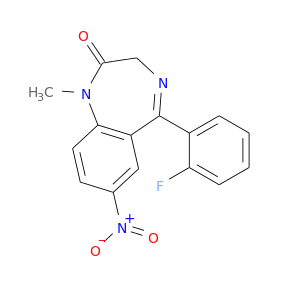 |
| DB00973 | UDP glucuronosyltransferase 1 family, polypeptide A3 | approved | Ezetimibe | 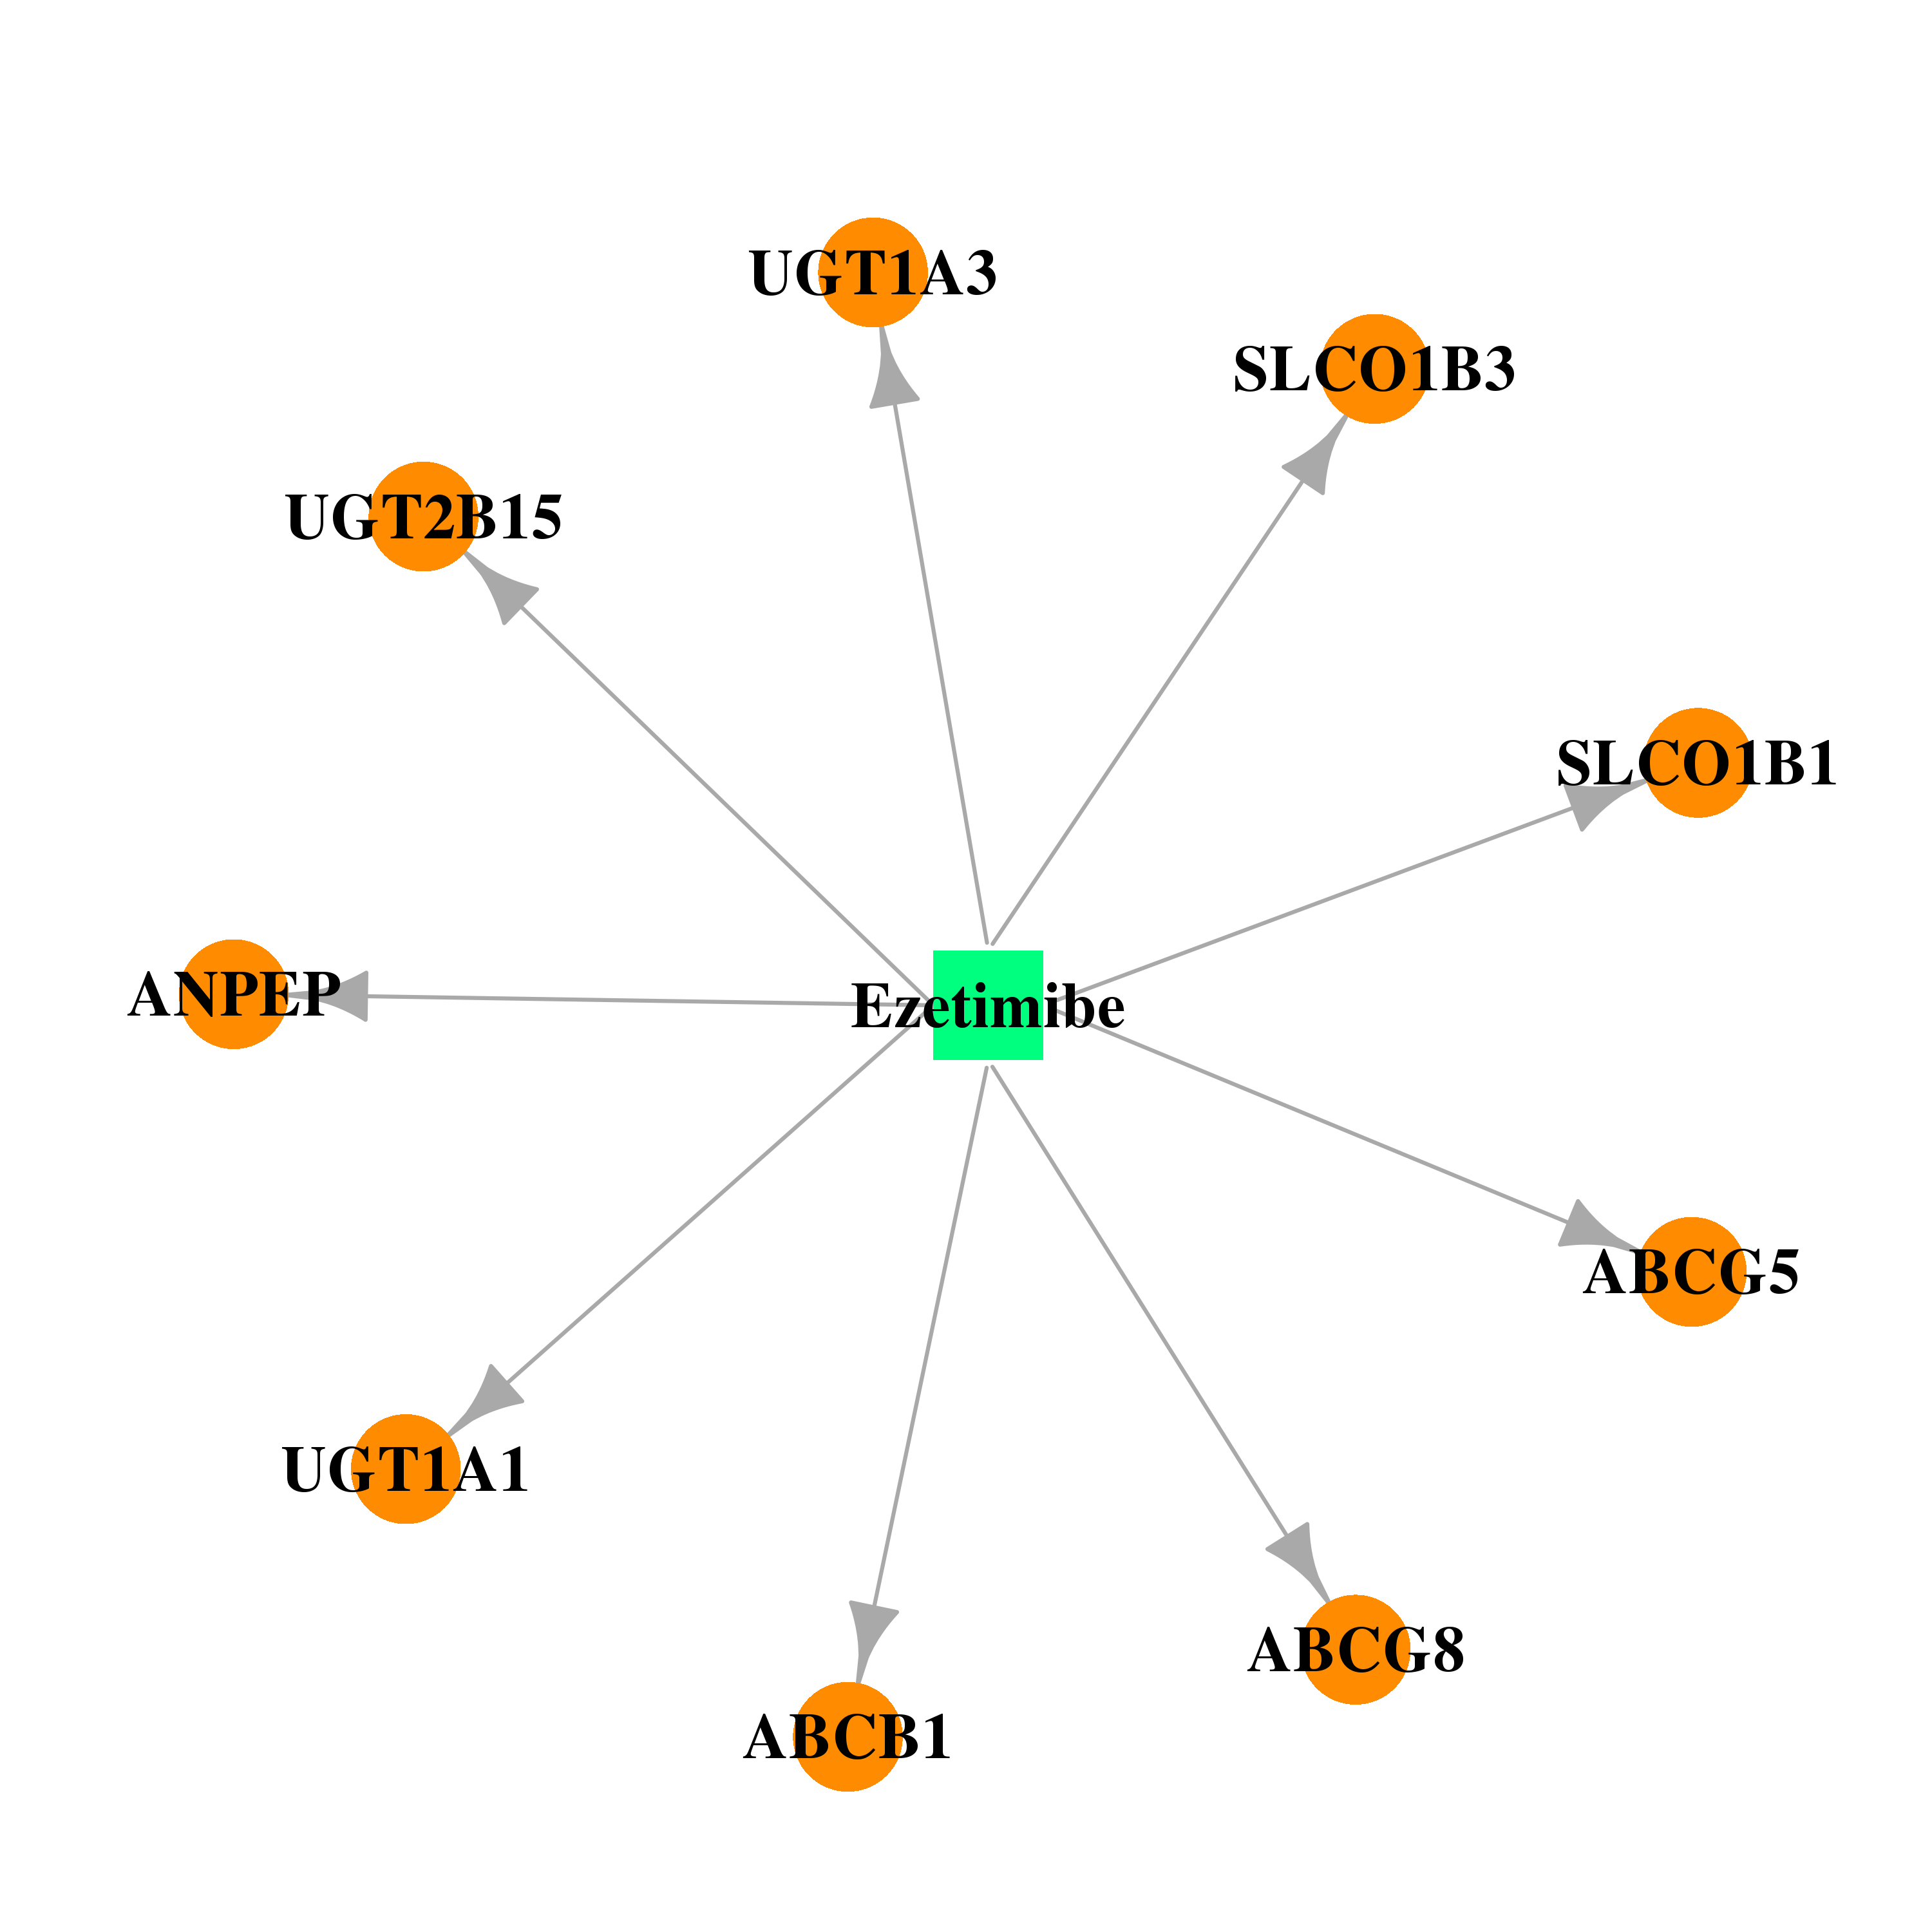 | 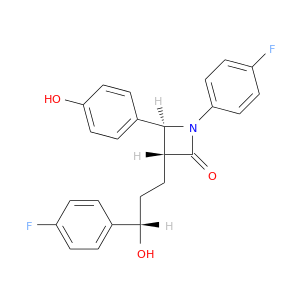 |
| DB00184 | UDP glucuronosyltransferase 1 family, polypeptide A3 | approved | Nicotine |  |  |
| DB01076 | UDP glucuronosyltransferase 1 family, polypeptide A3 | approved | Atorvastatin | 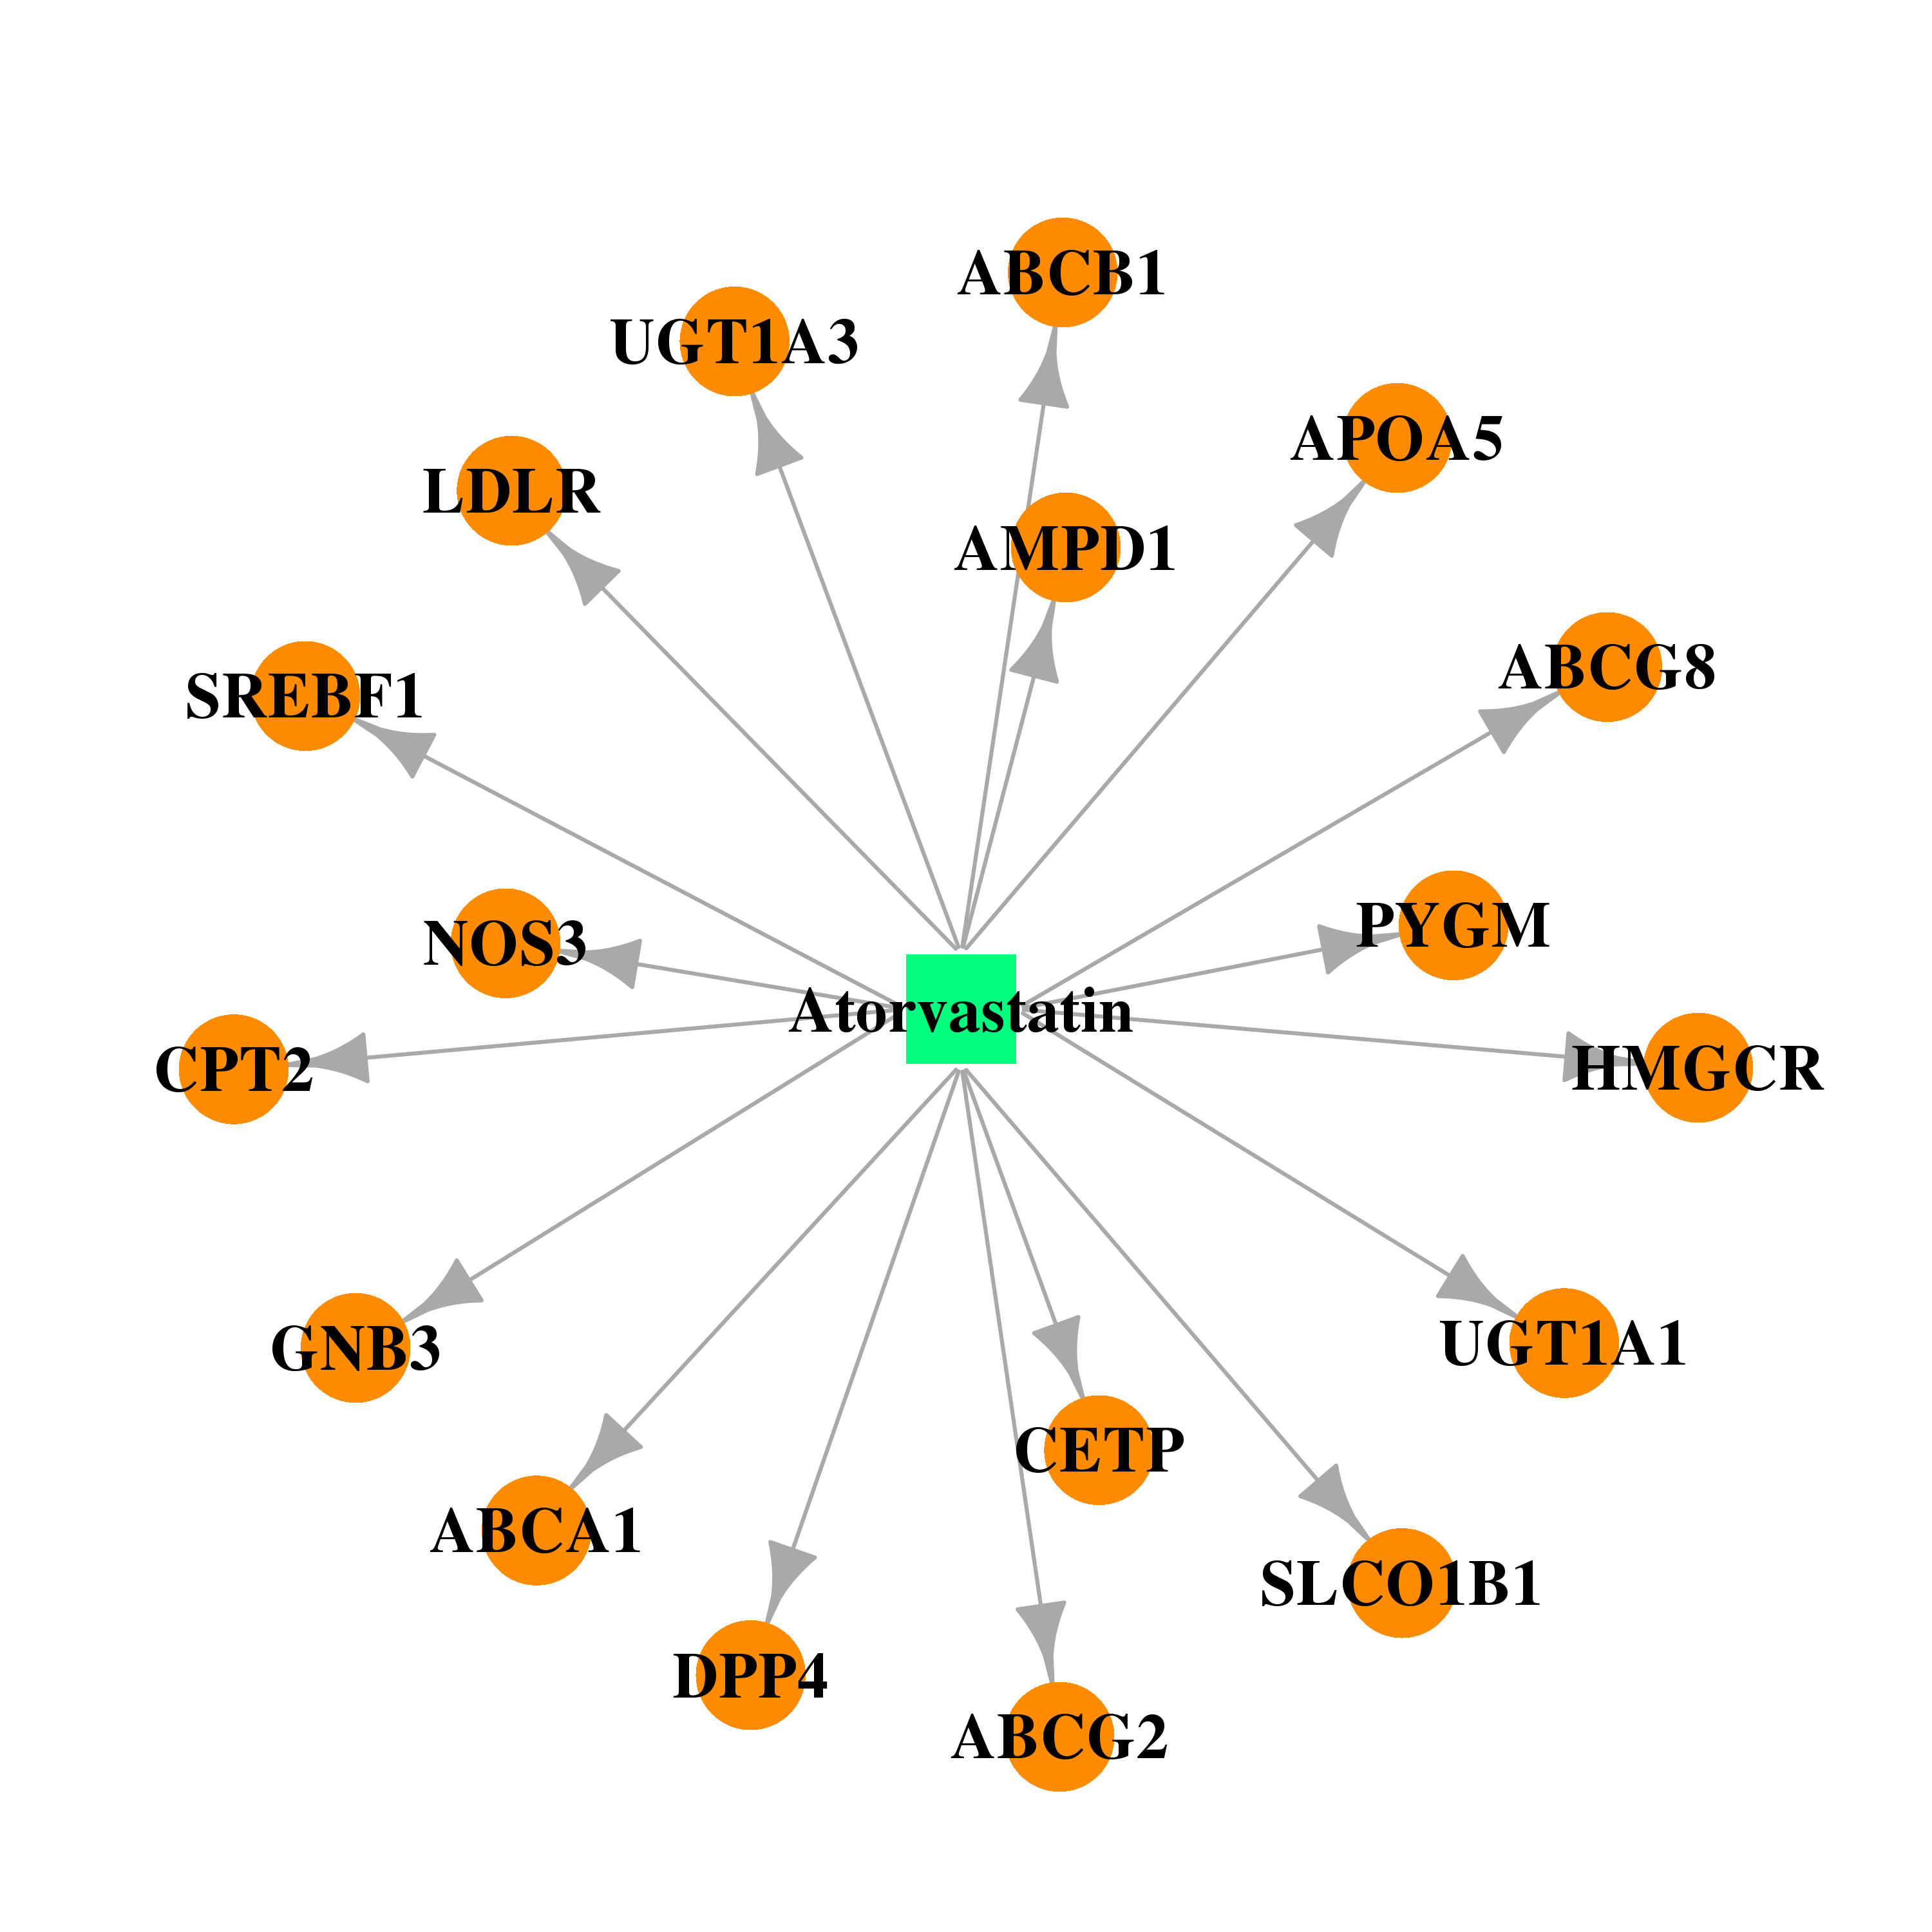 |  |
| DB00762 | UDP glucuronosyltransferase 1 family, polypeptide A3 | approved; investigational | Irinotecan | 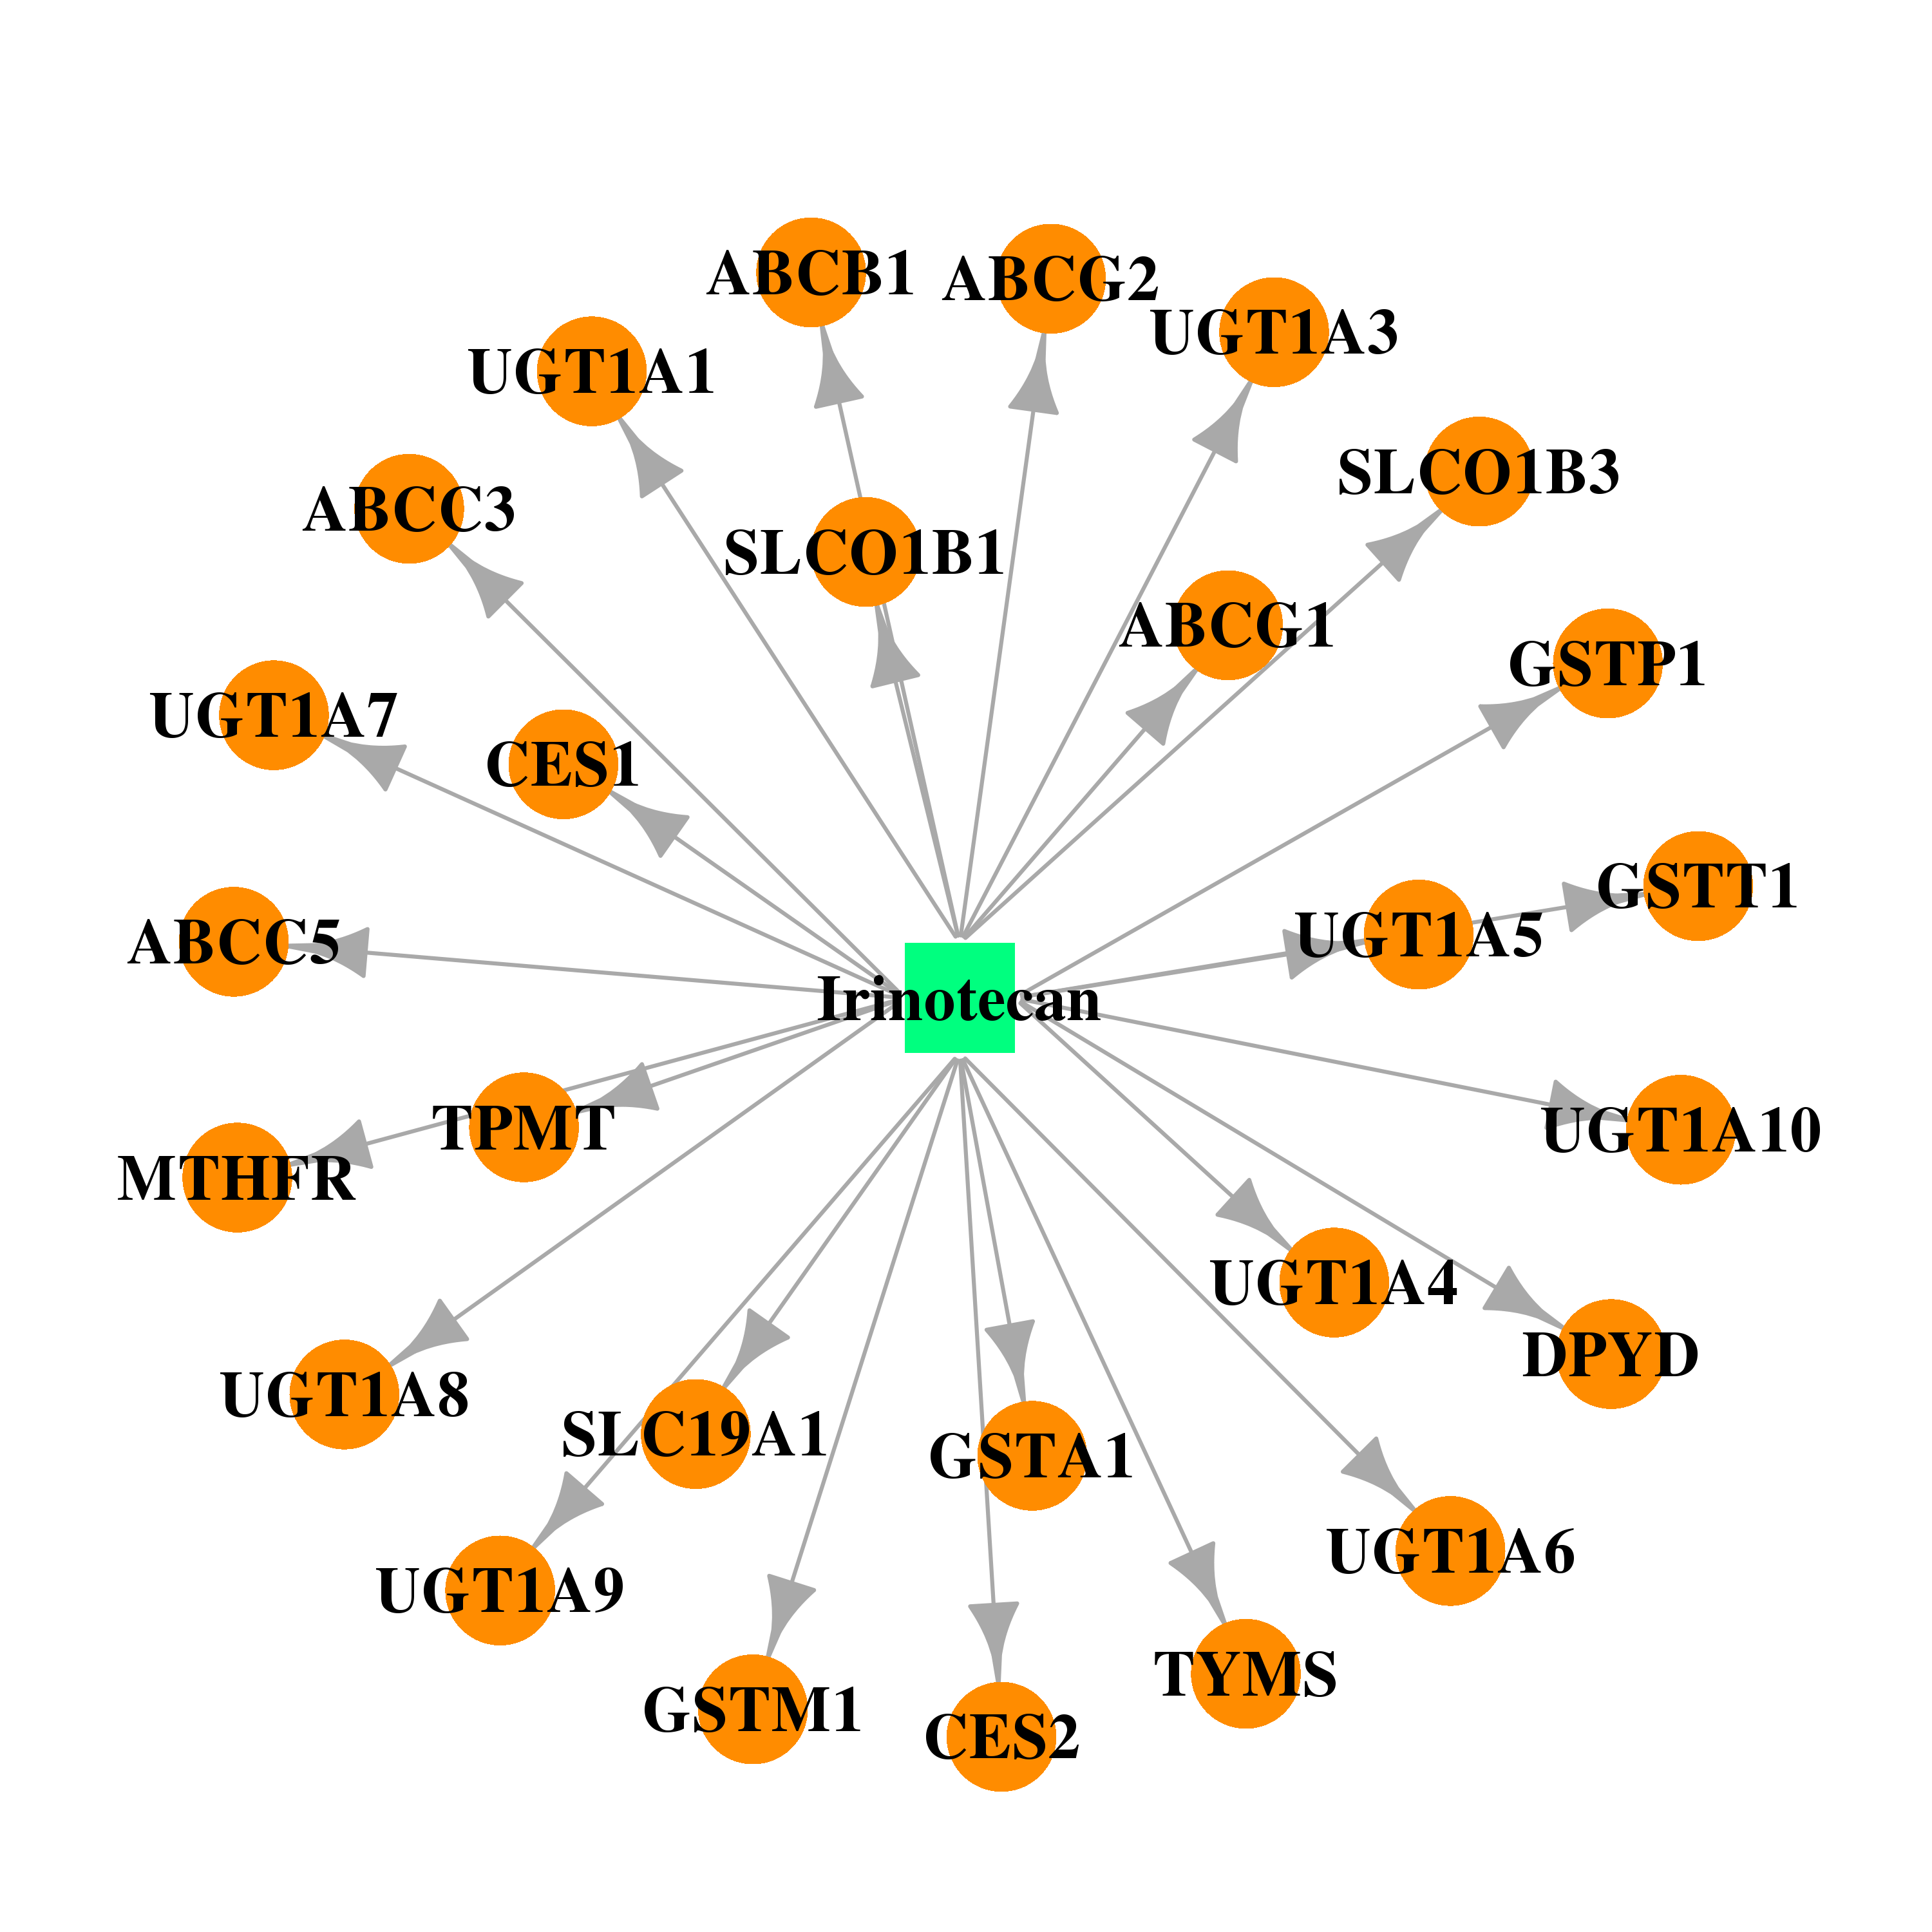 |  |
| DB00783 | UDP glucuronosyltransferase 1 family, polypeptide A3 | approved; investigational | Estradiol | 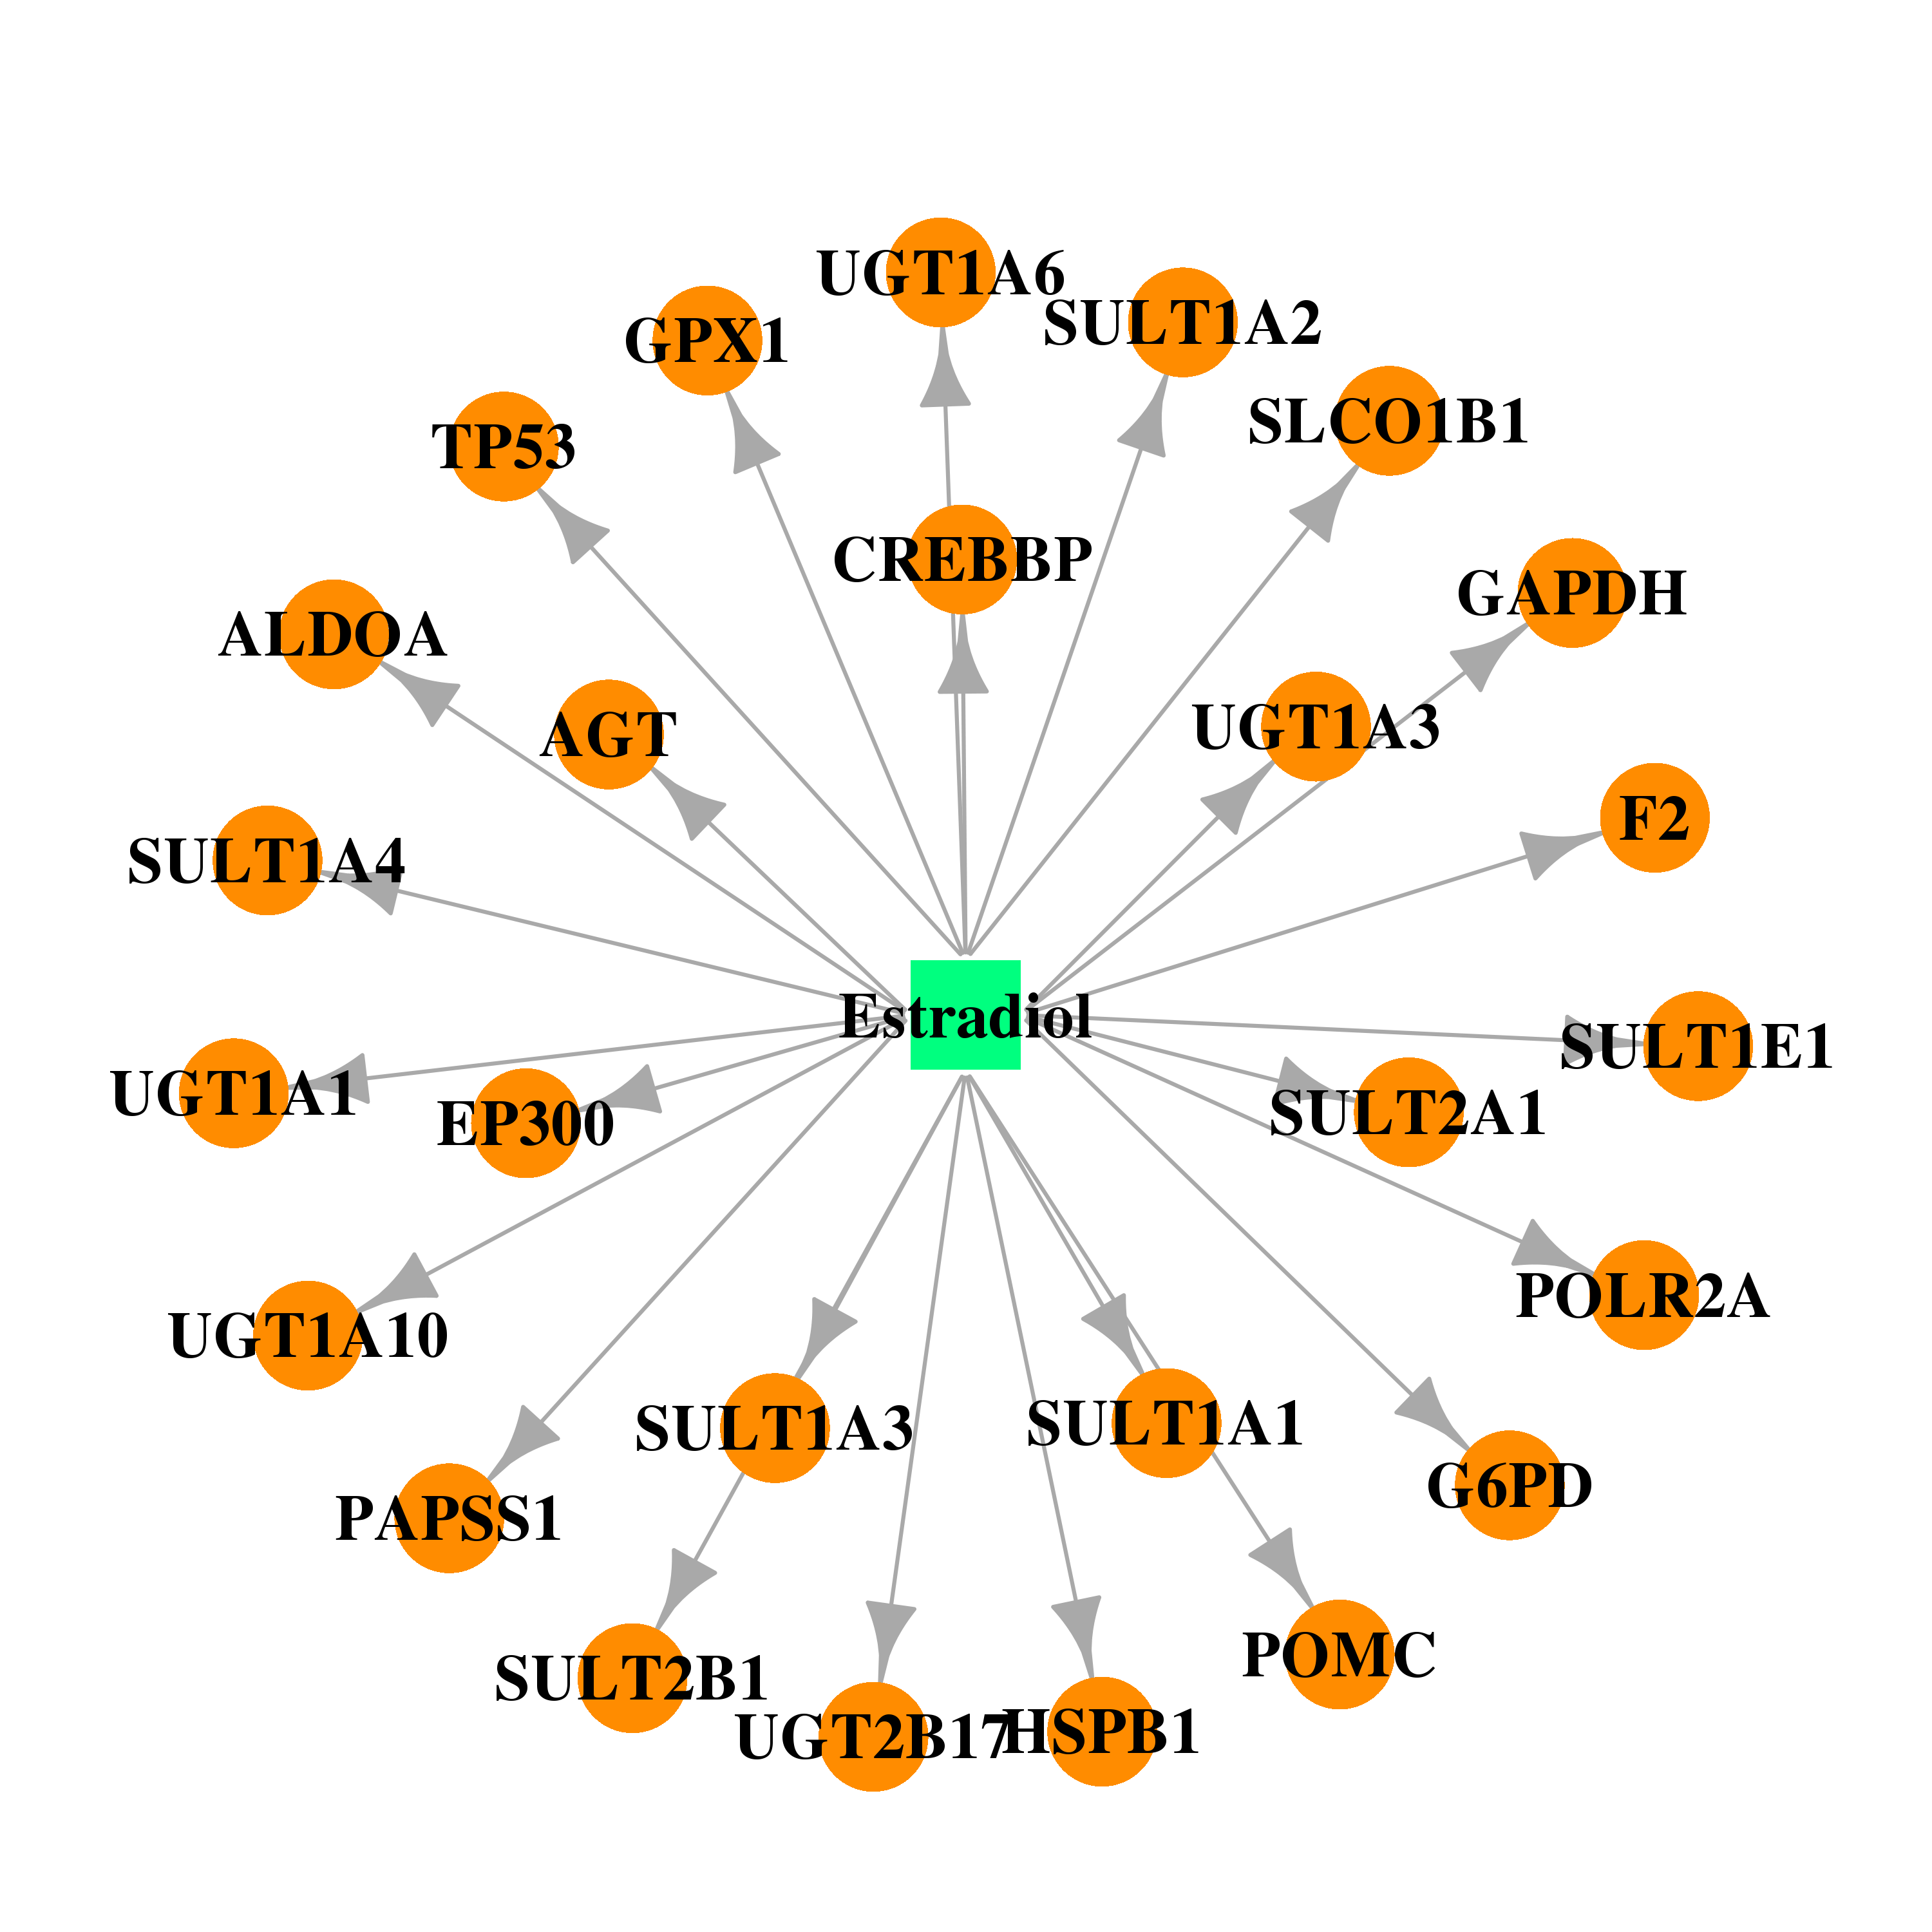 |  |
| DB00921 | UDP glucuronosyltransferase 1 family, polypeptide A3 | illicit; approved; investigational | Buprenorphine | 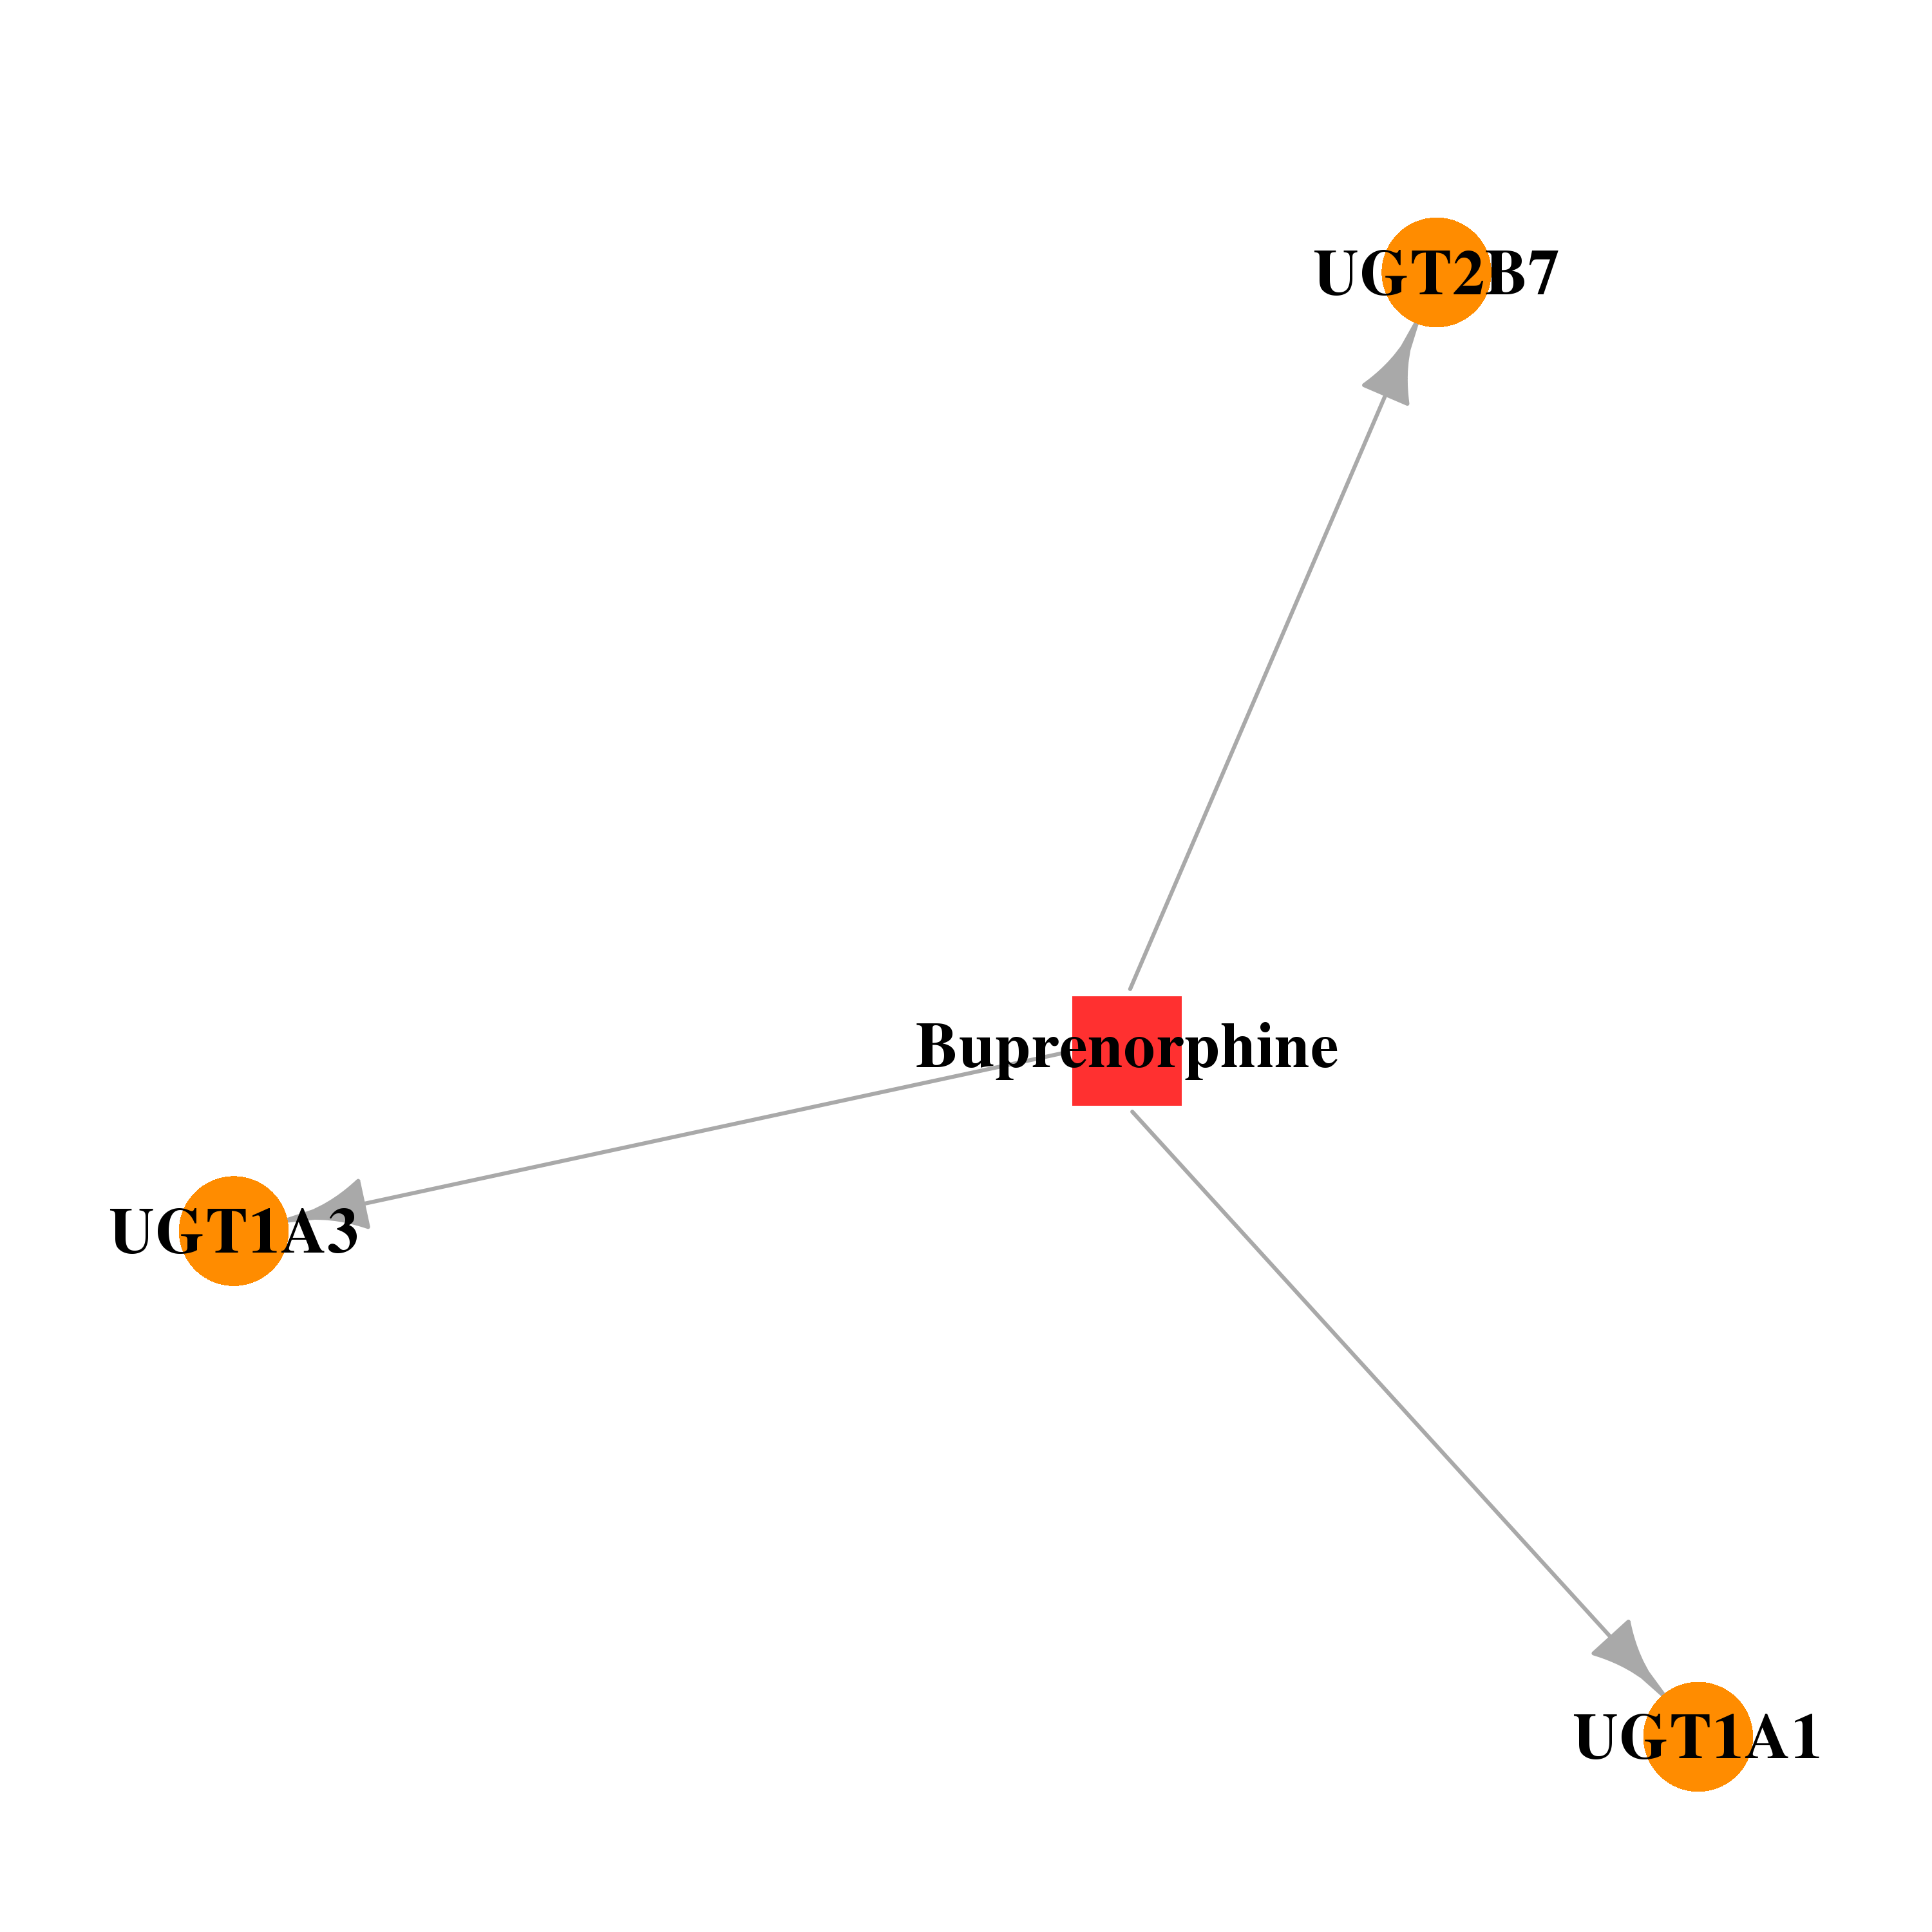 |  |
| DB00363 | UDP glucuronosyltransferase 1 family, polypeptide A3 | approved | Clozapine | 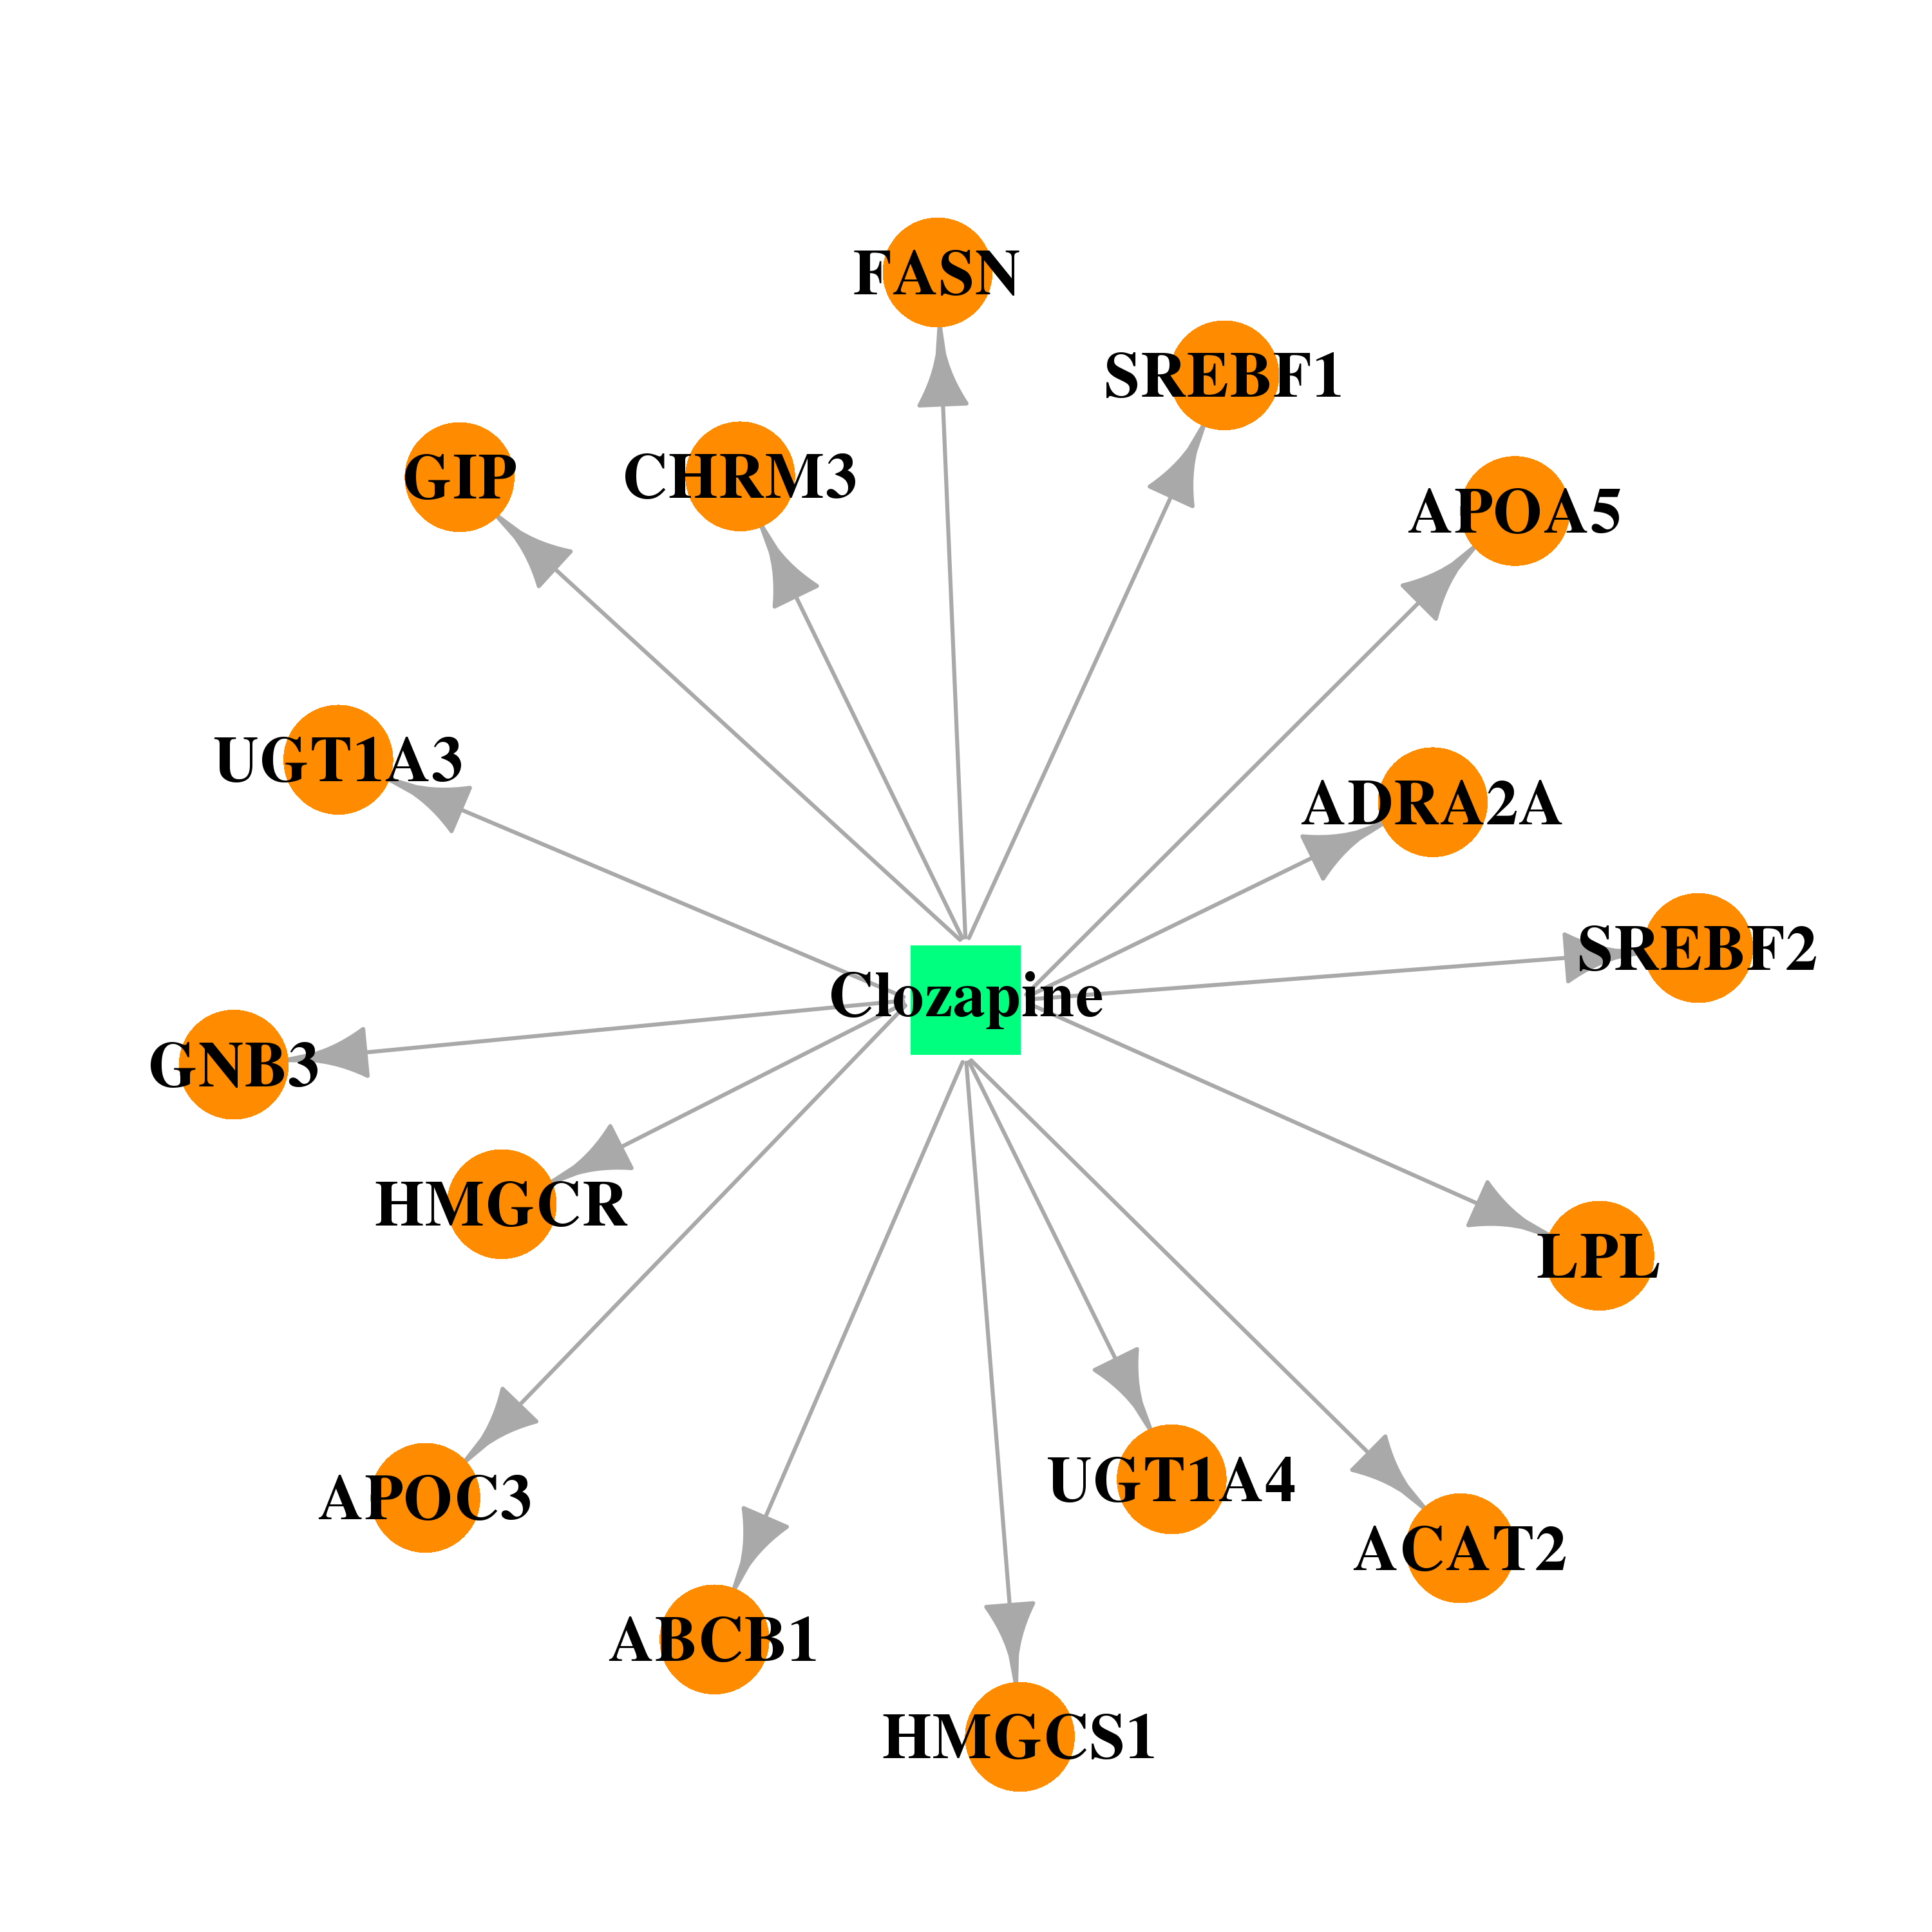 | 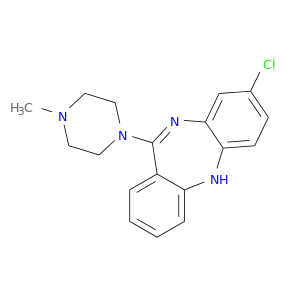 |
| DB00434 | UDP glucuronosyltransferase 1 family, polypeptide A3 | approved | Cyproheptadine | 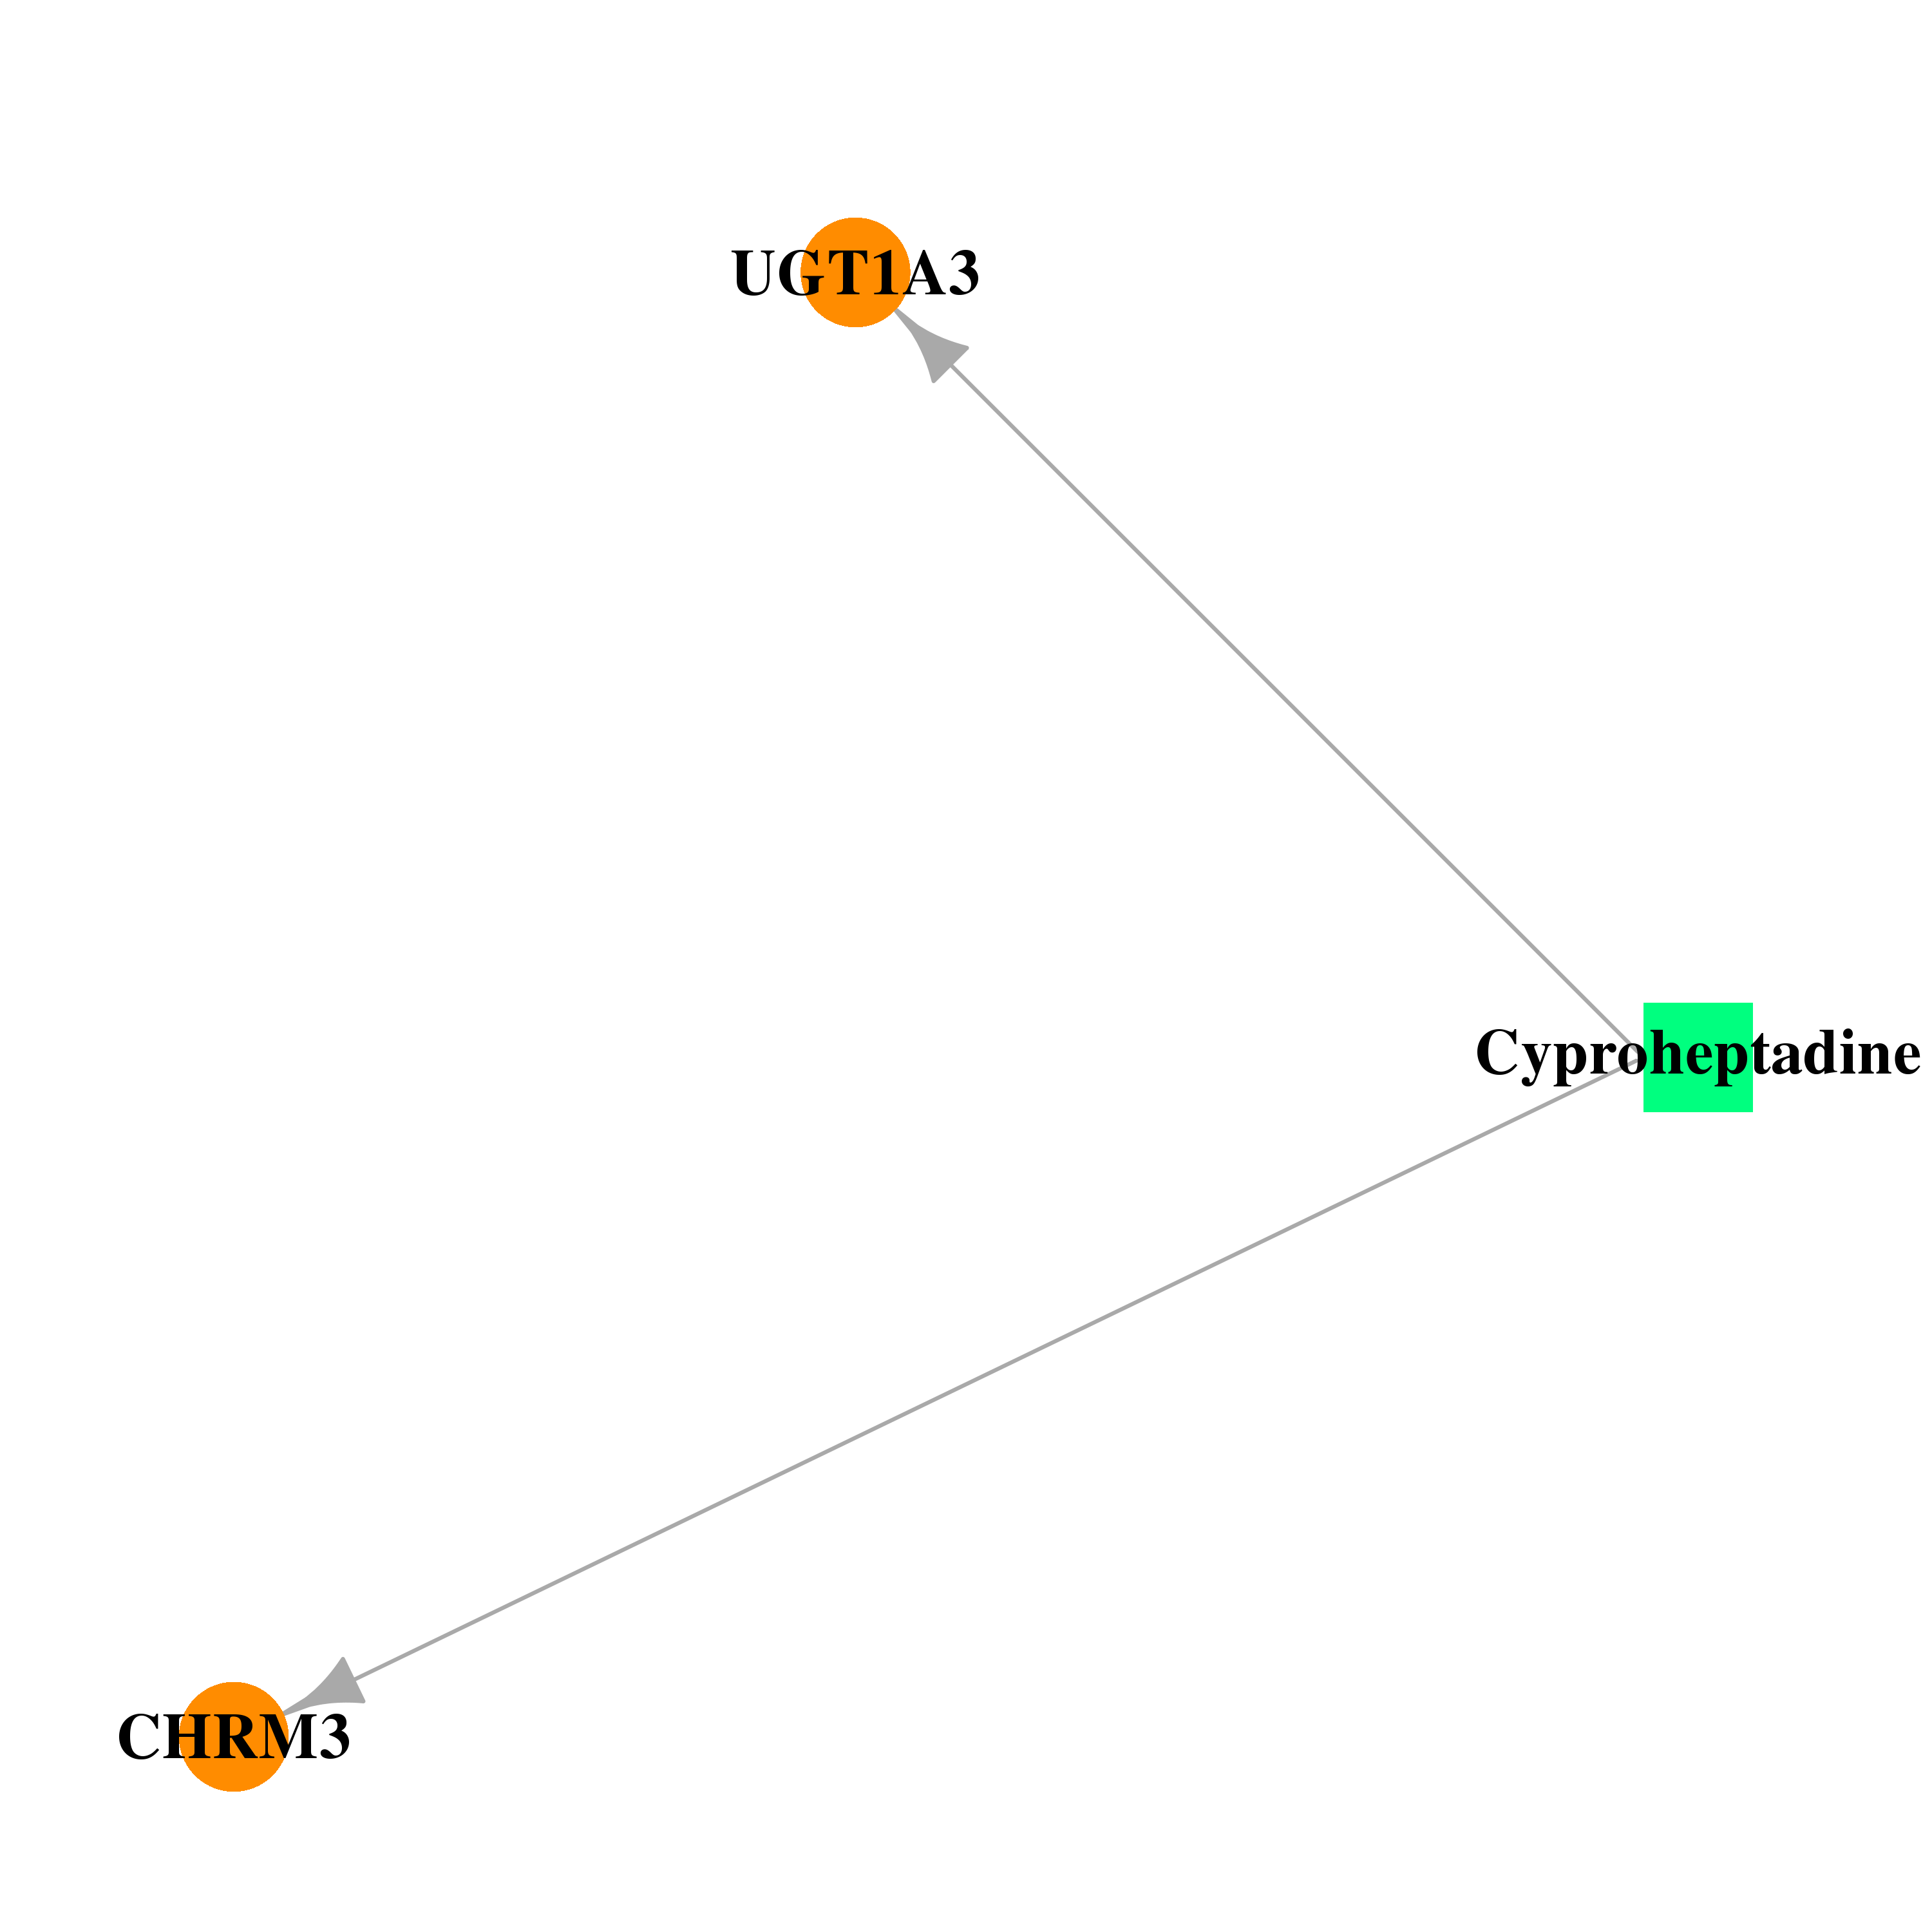 | 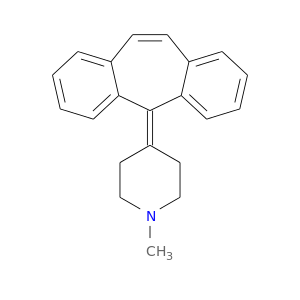 |
| DB01075 | UDP glucuronosyltransferase 1 family, polypeptide A3 | approved | Diphenhydramine |  |  |
| DB00678 | UDP glucuronosyltransferase 1 family, polypeptide A3 | approved | Losartan | 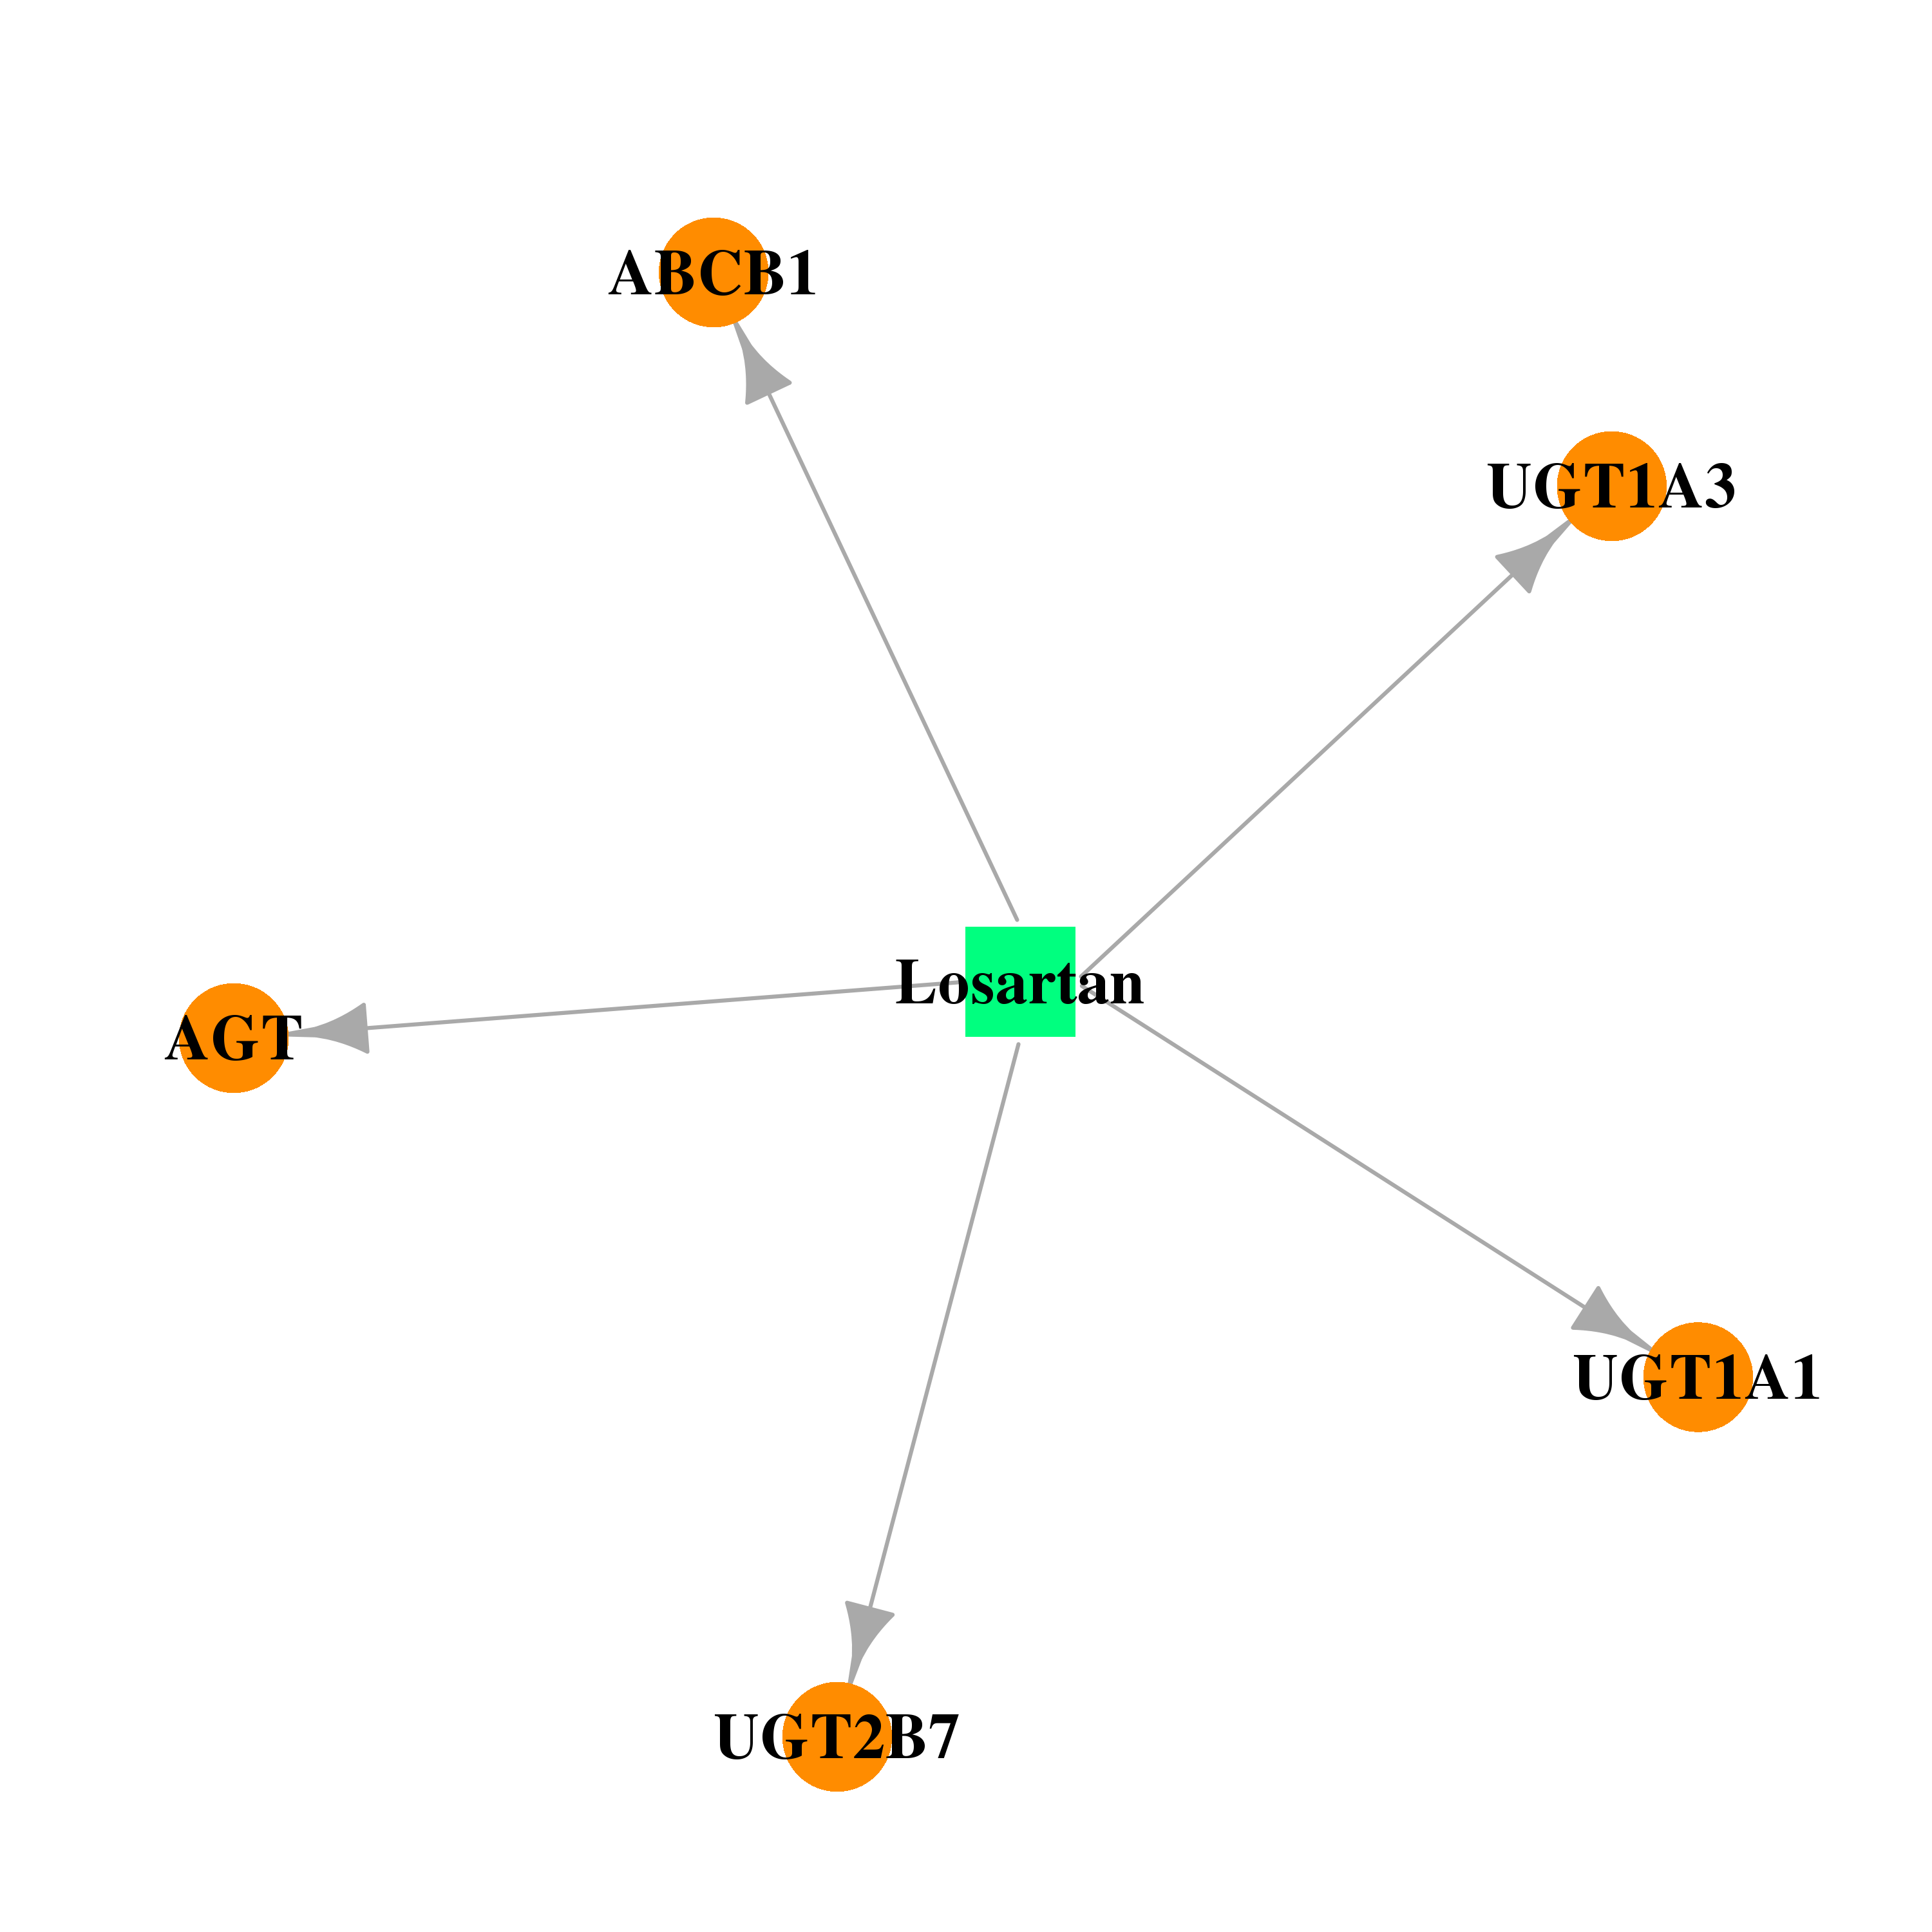 |  |
| DB00313 | UDP glucuronosyltransferase 1 family, polypeptide A3 | approved; investigational | Valproic Acid | 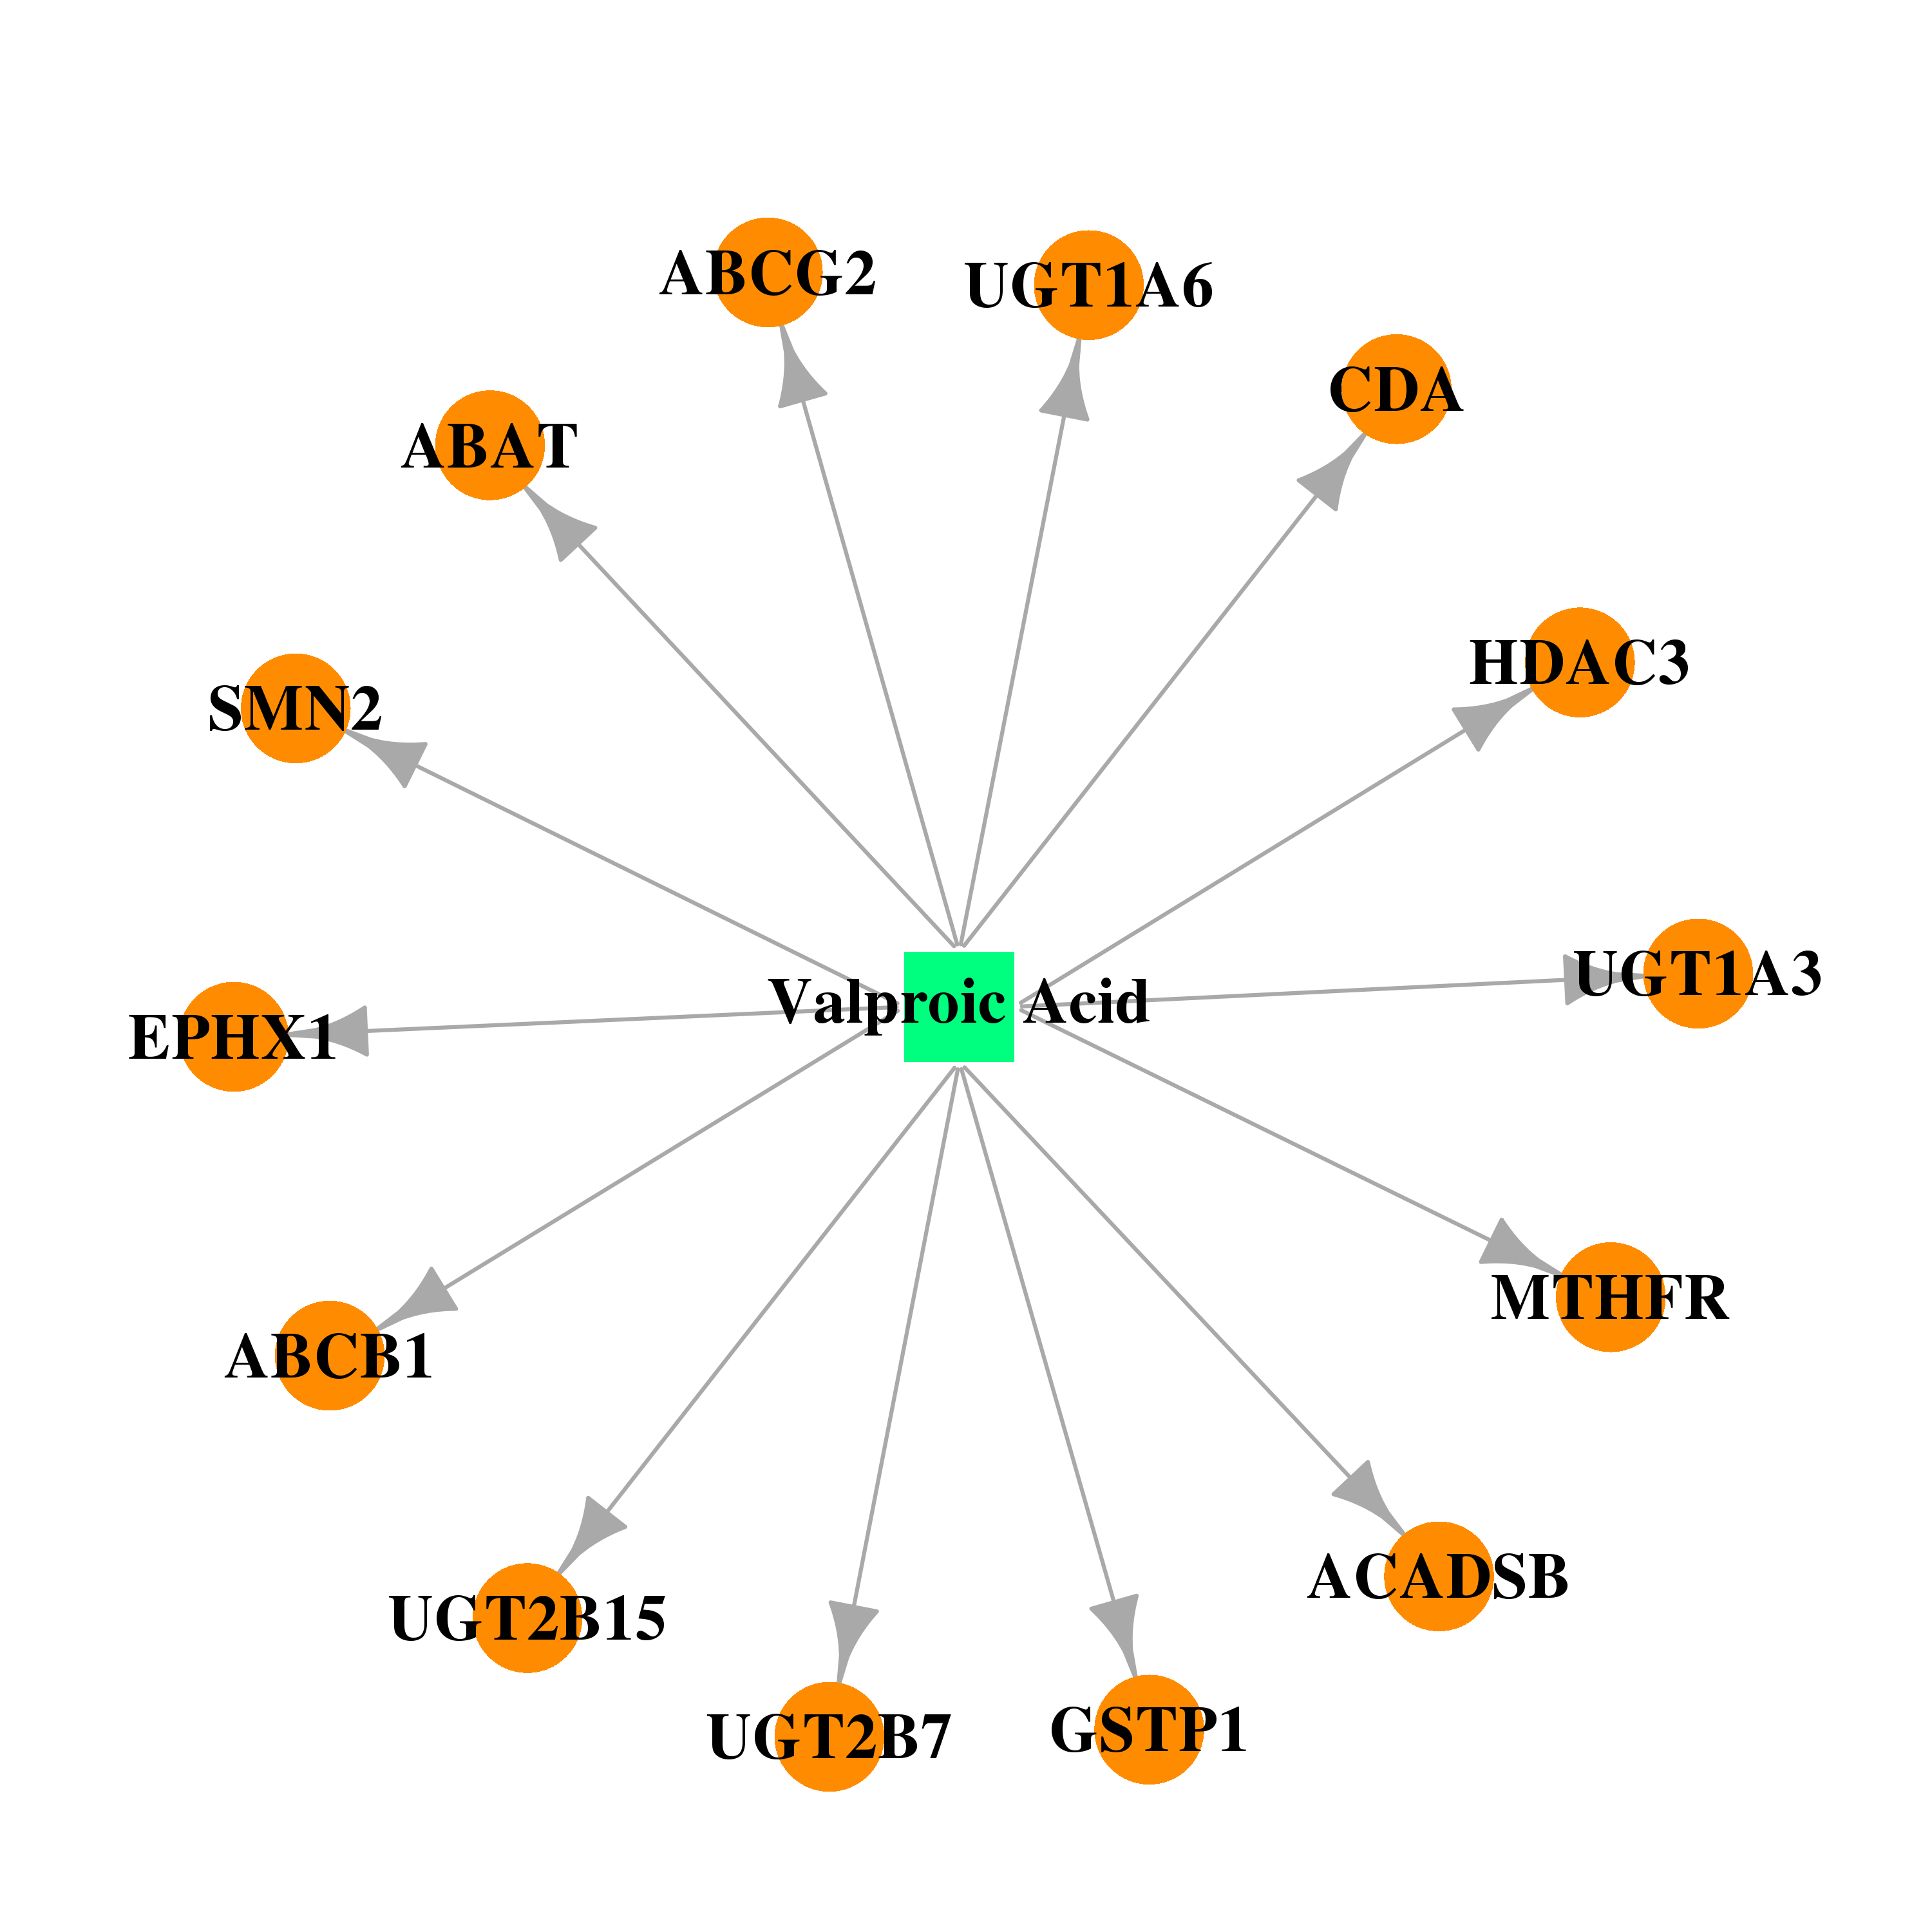 |  |
| DB00655 | UDP glucuronosyltransferase 1 family, polypeptide A3 | approved | Estrone | 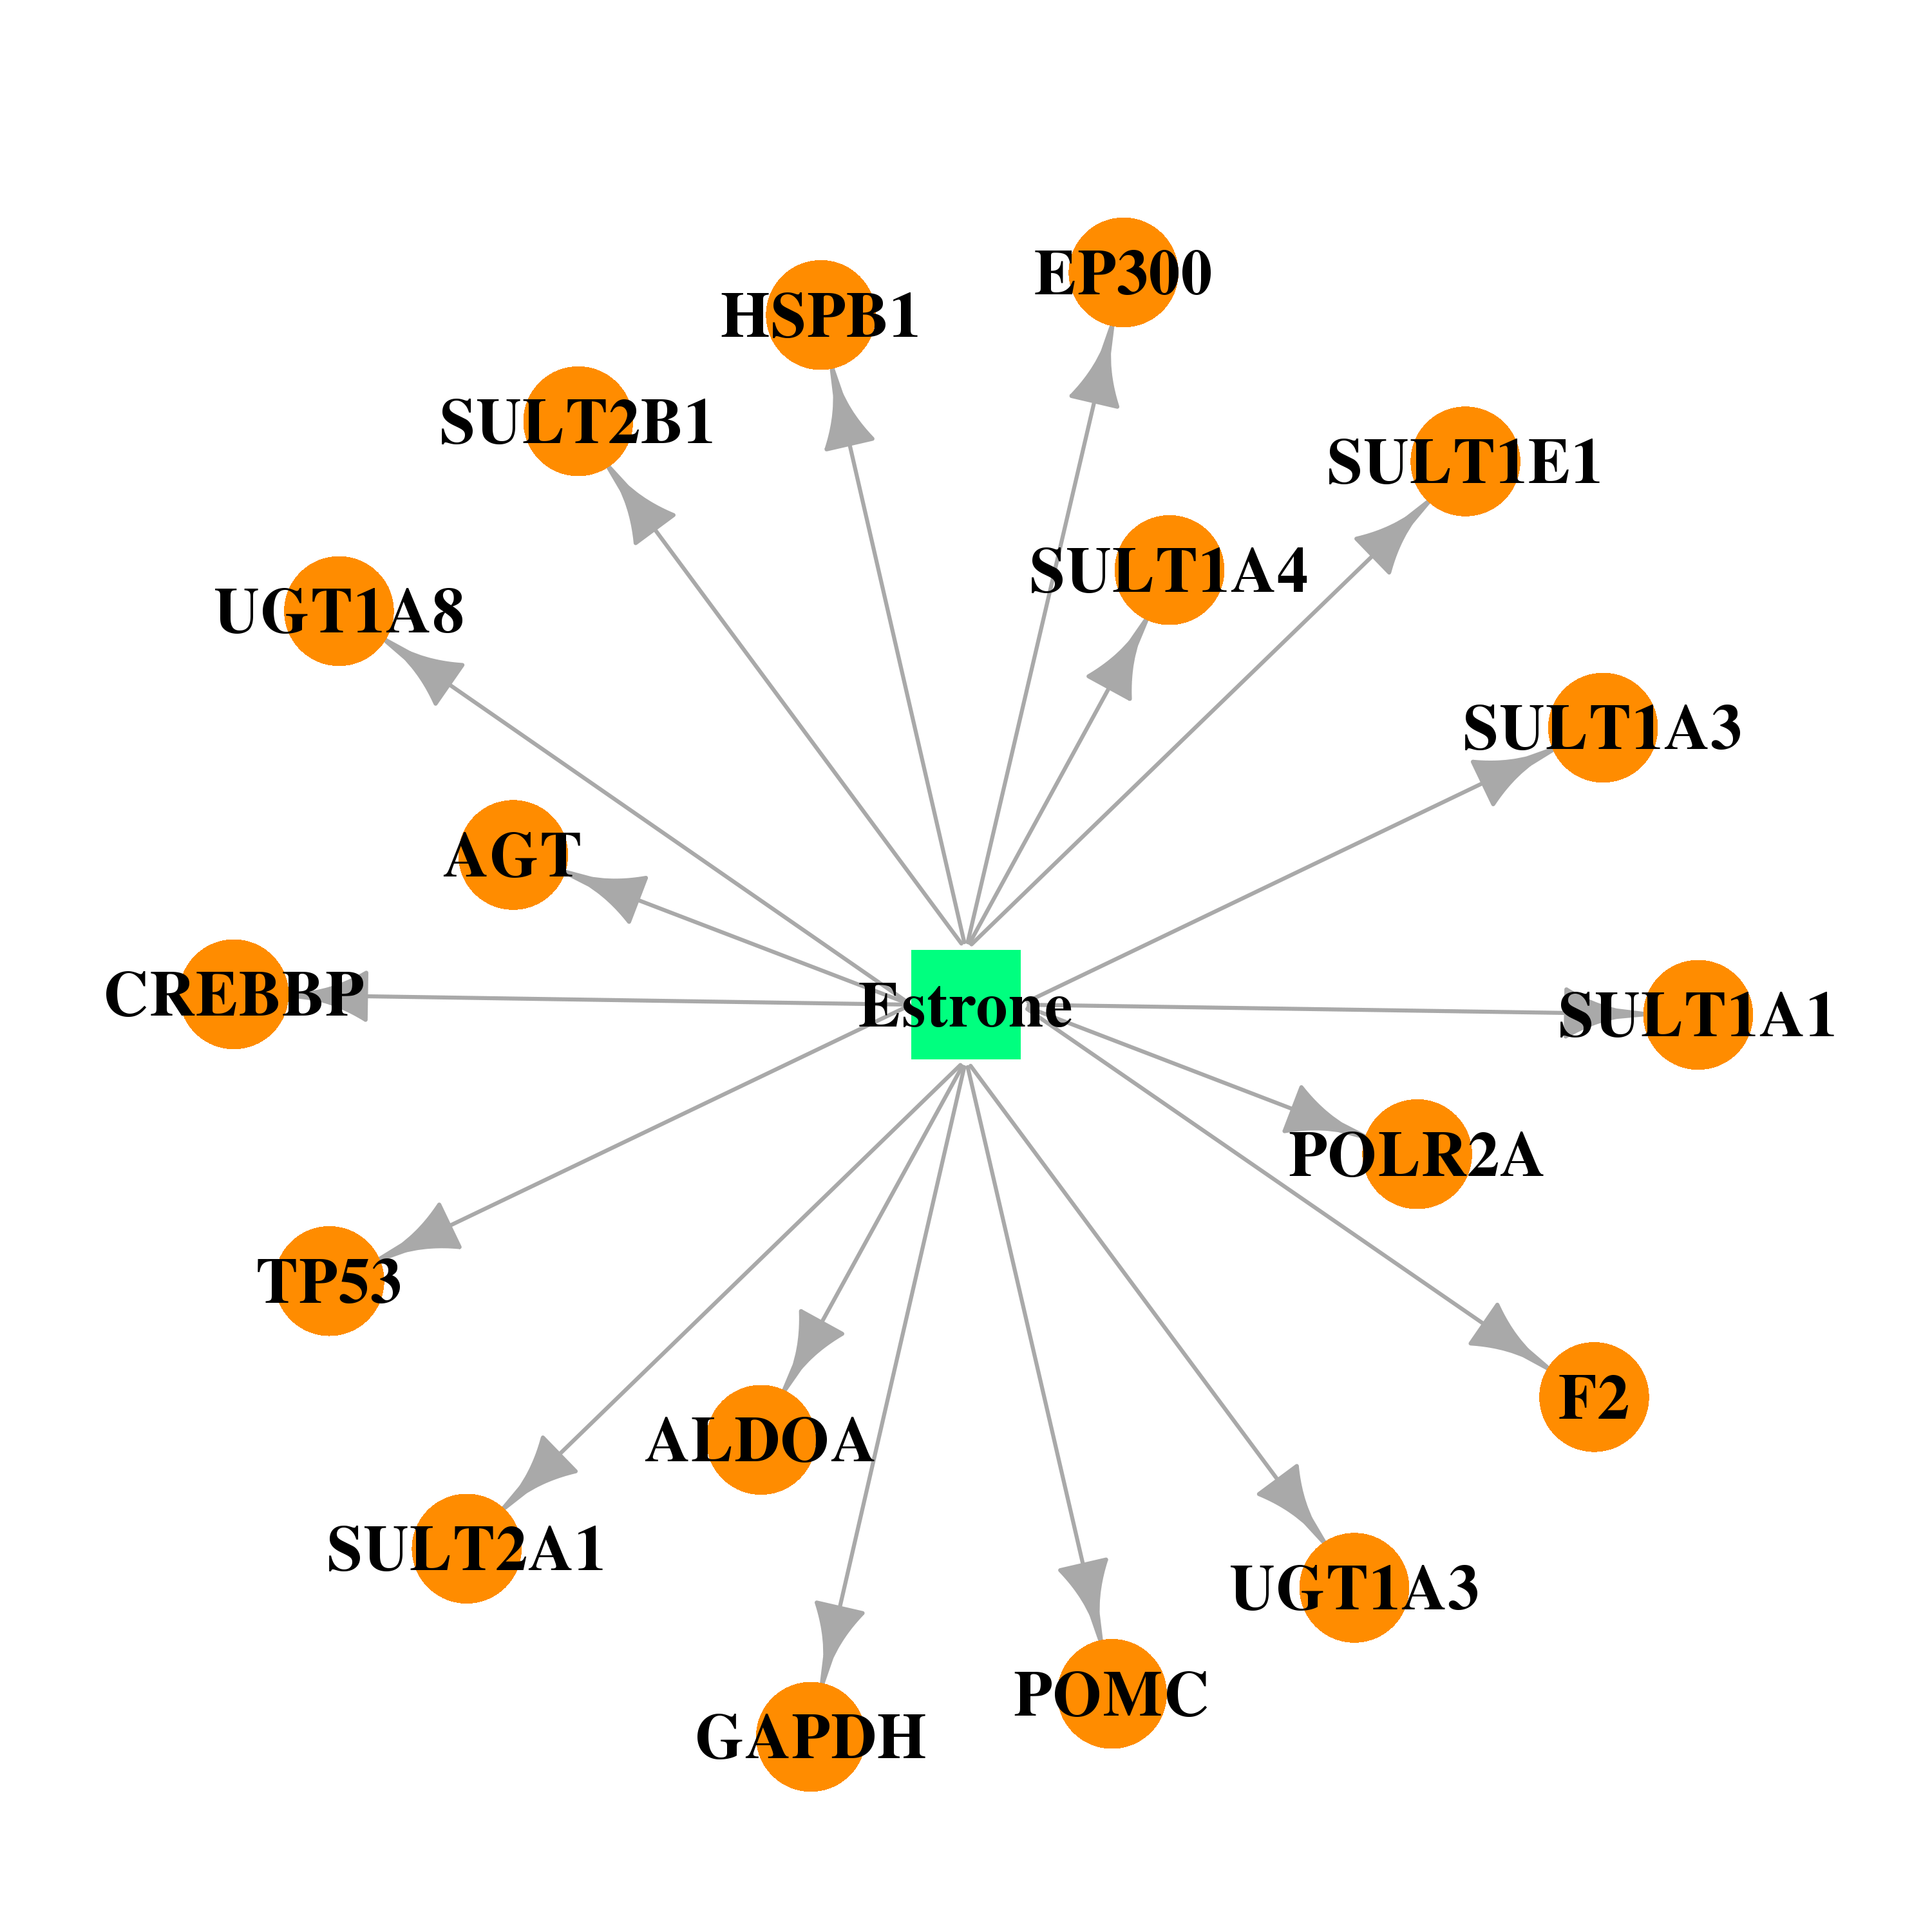 |  |
| DB00712 | UDP glucuronosyltransferase 1 family, polypeptide A3 | approved | Flurbiprofen |  |  |
| DB01050 | UDP glucuronosyltransferase 1 family, polypeptide A3 | approved | Ibuprofen | 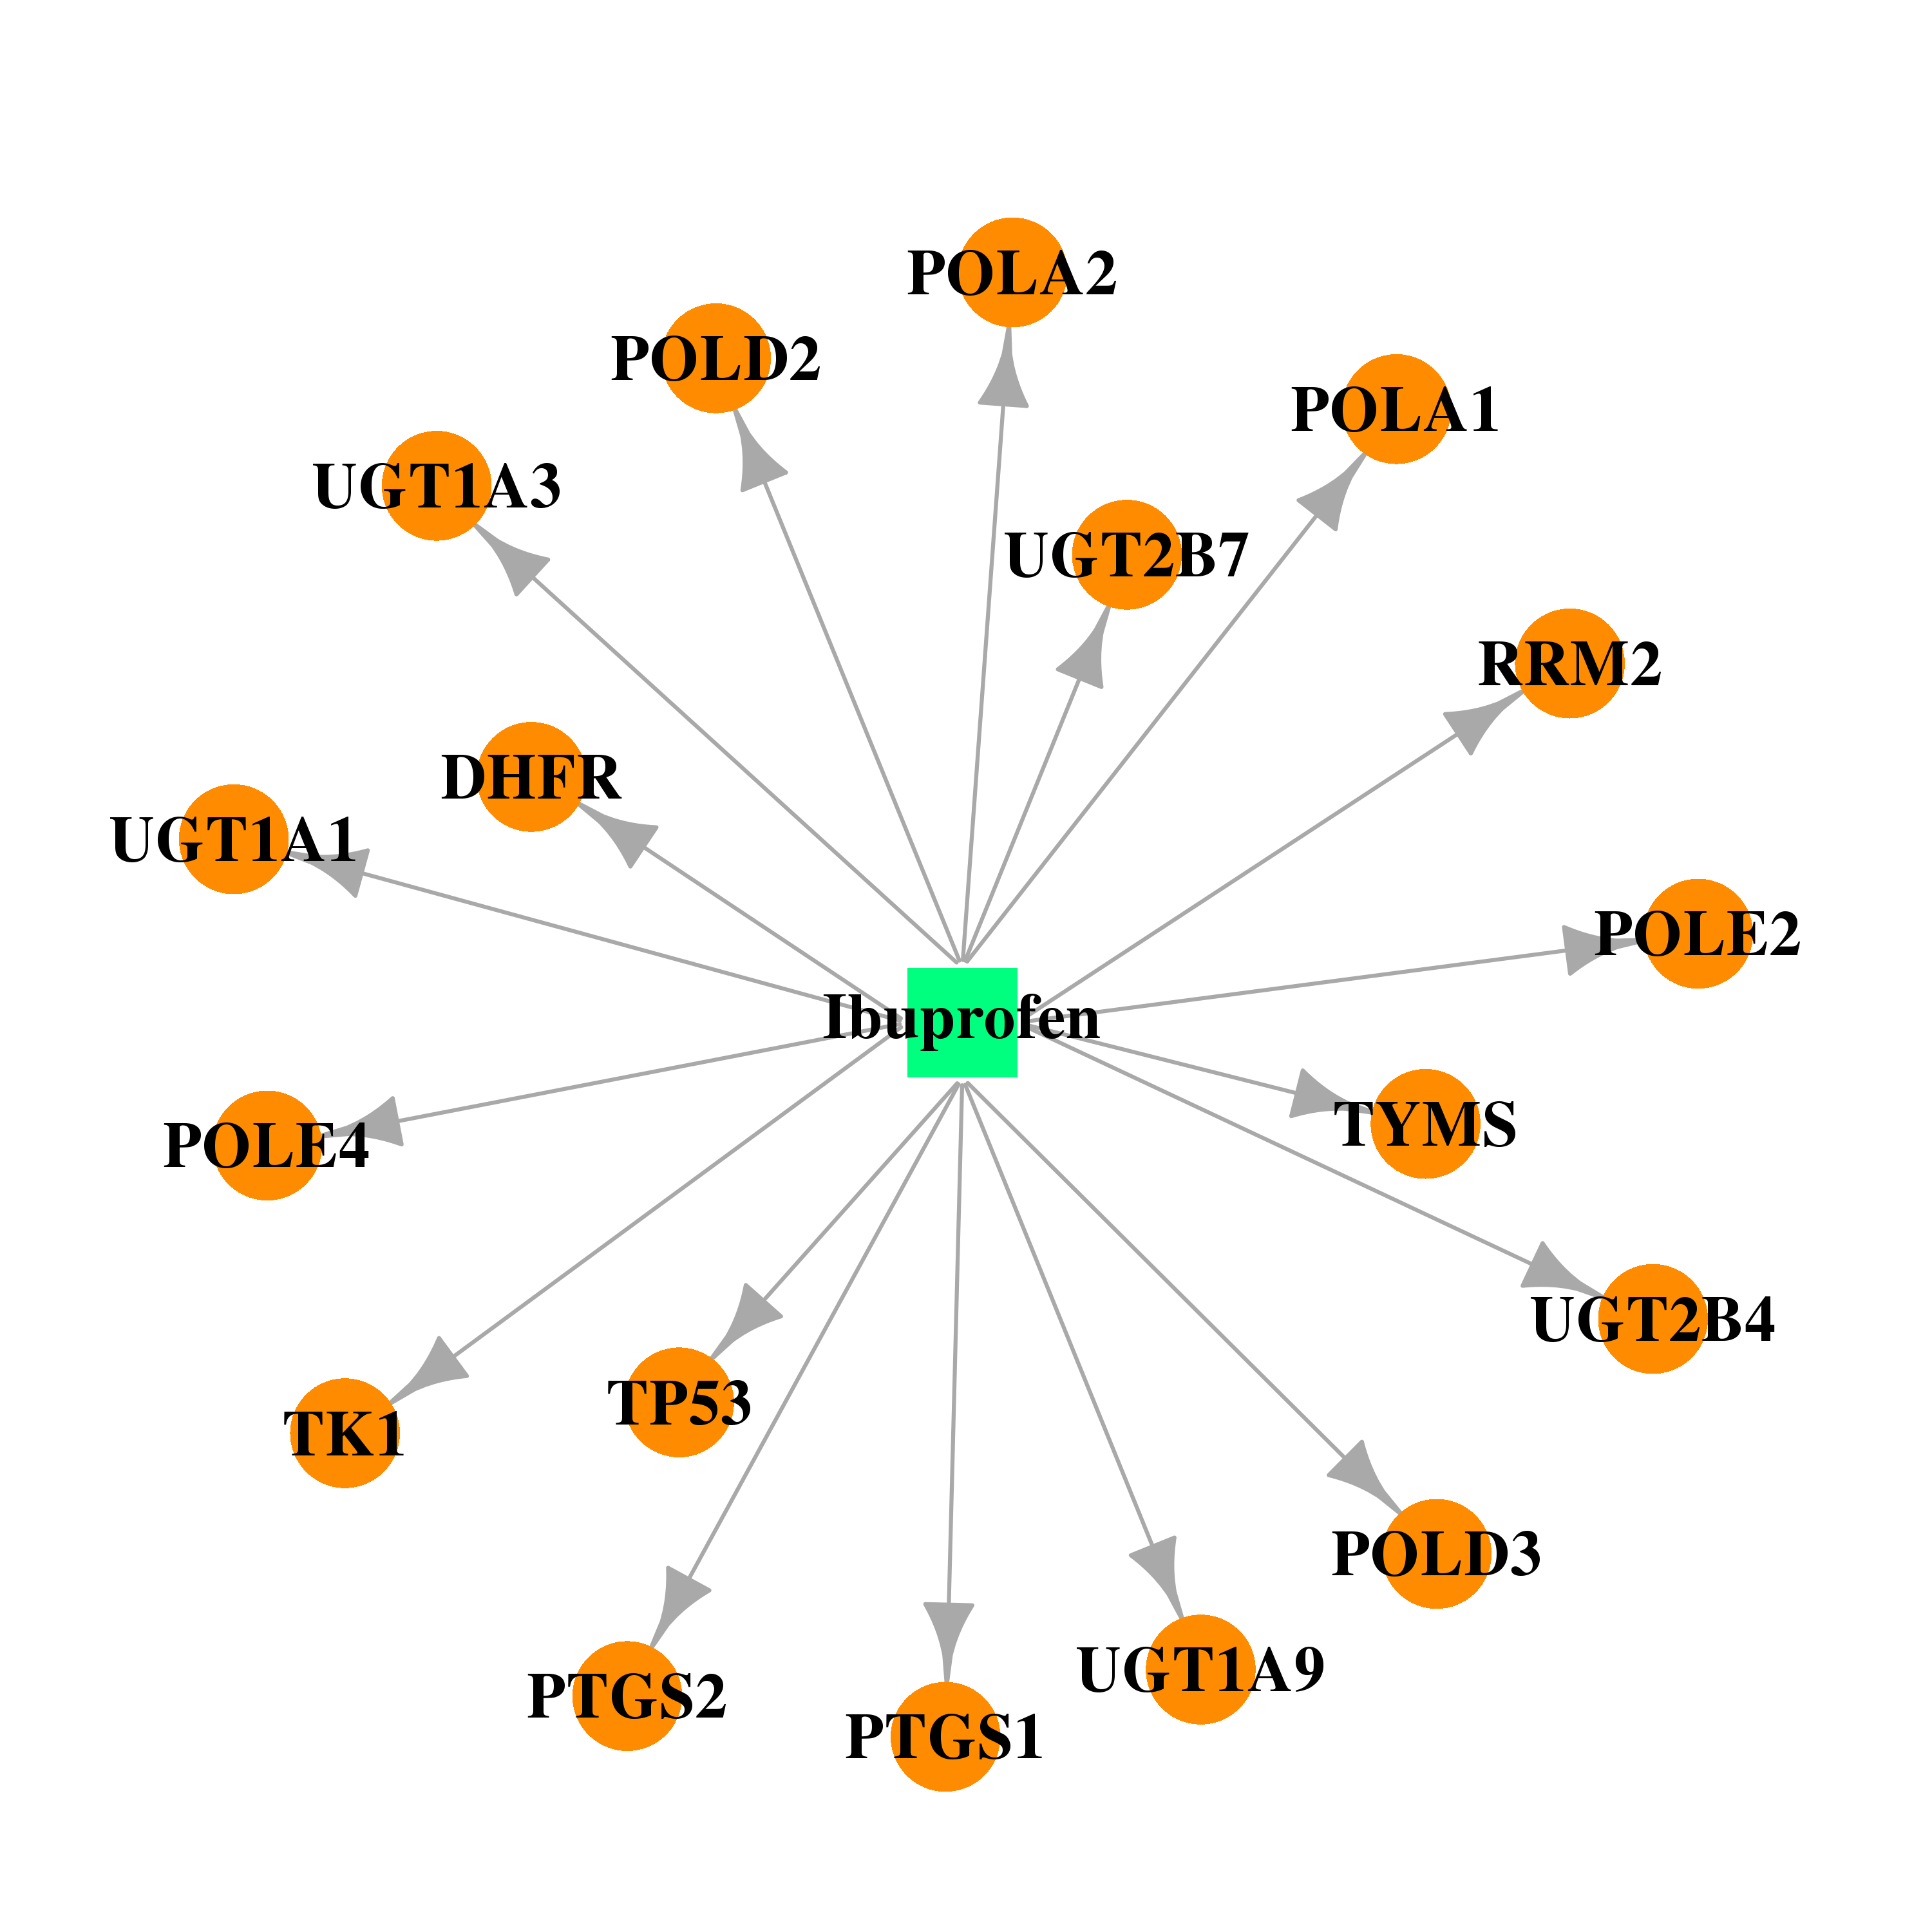 | 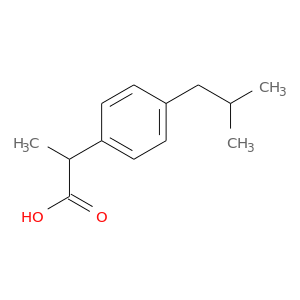 |
| DB01009 | UDP glucuronosyltransferase 1 family, polypeptide A3 | approved | Ketoprofen | 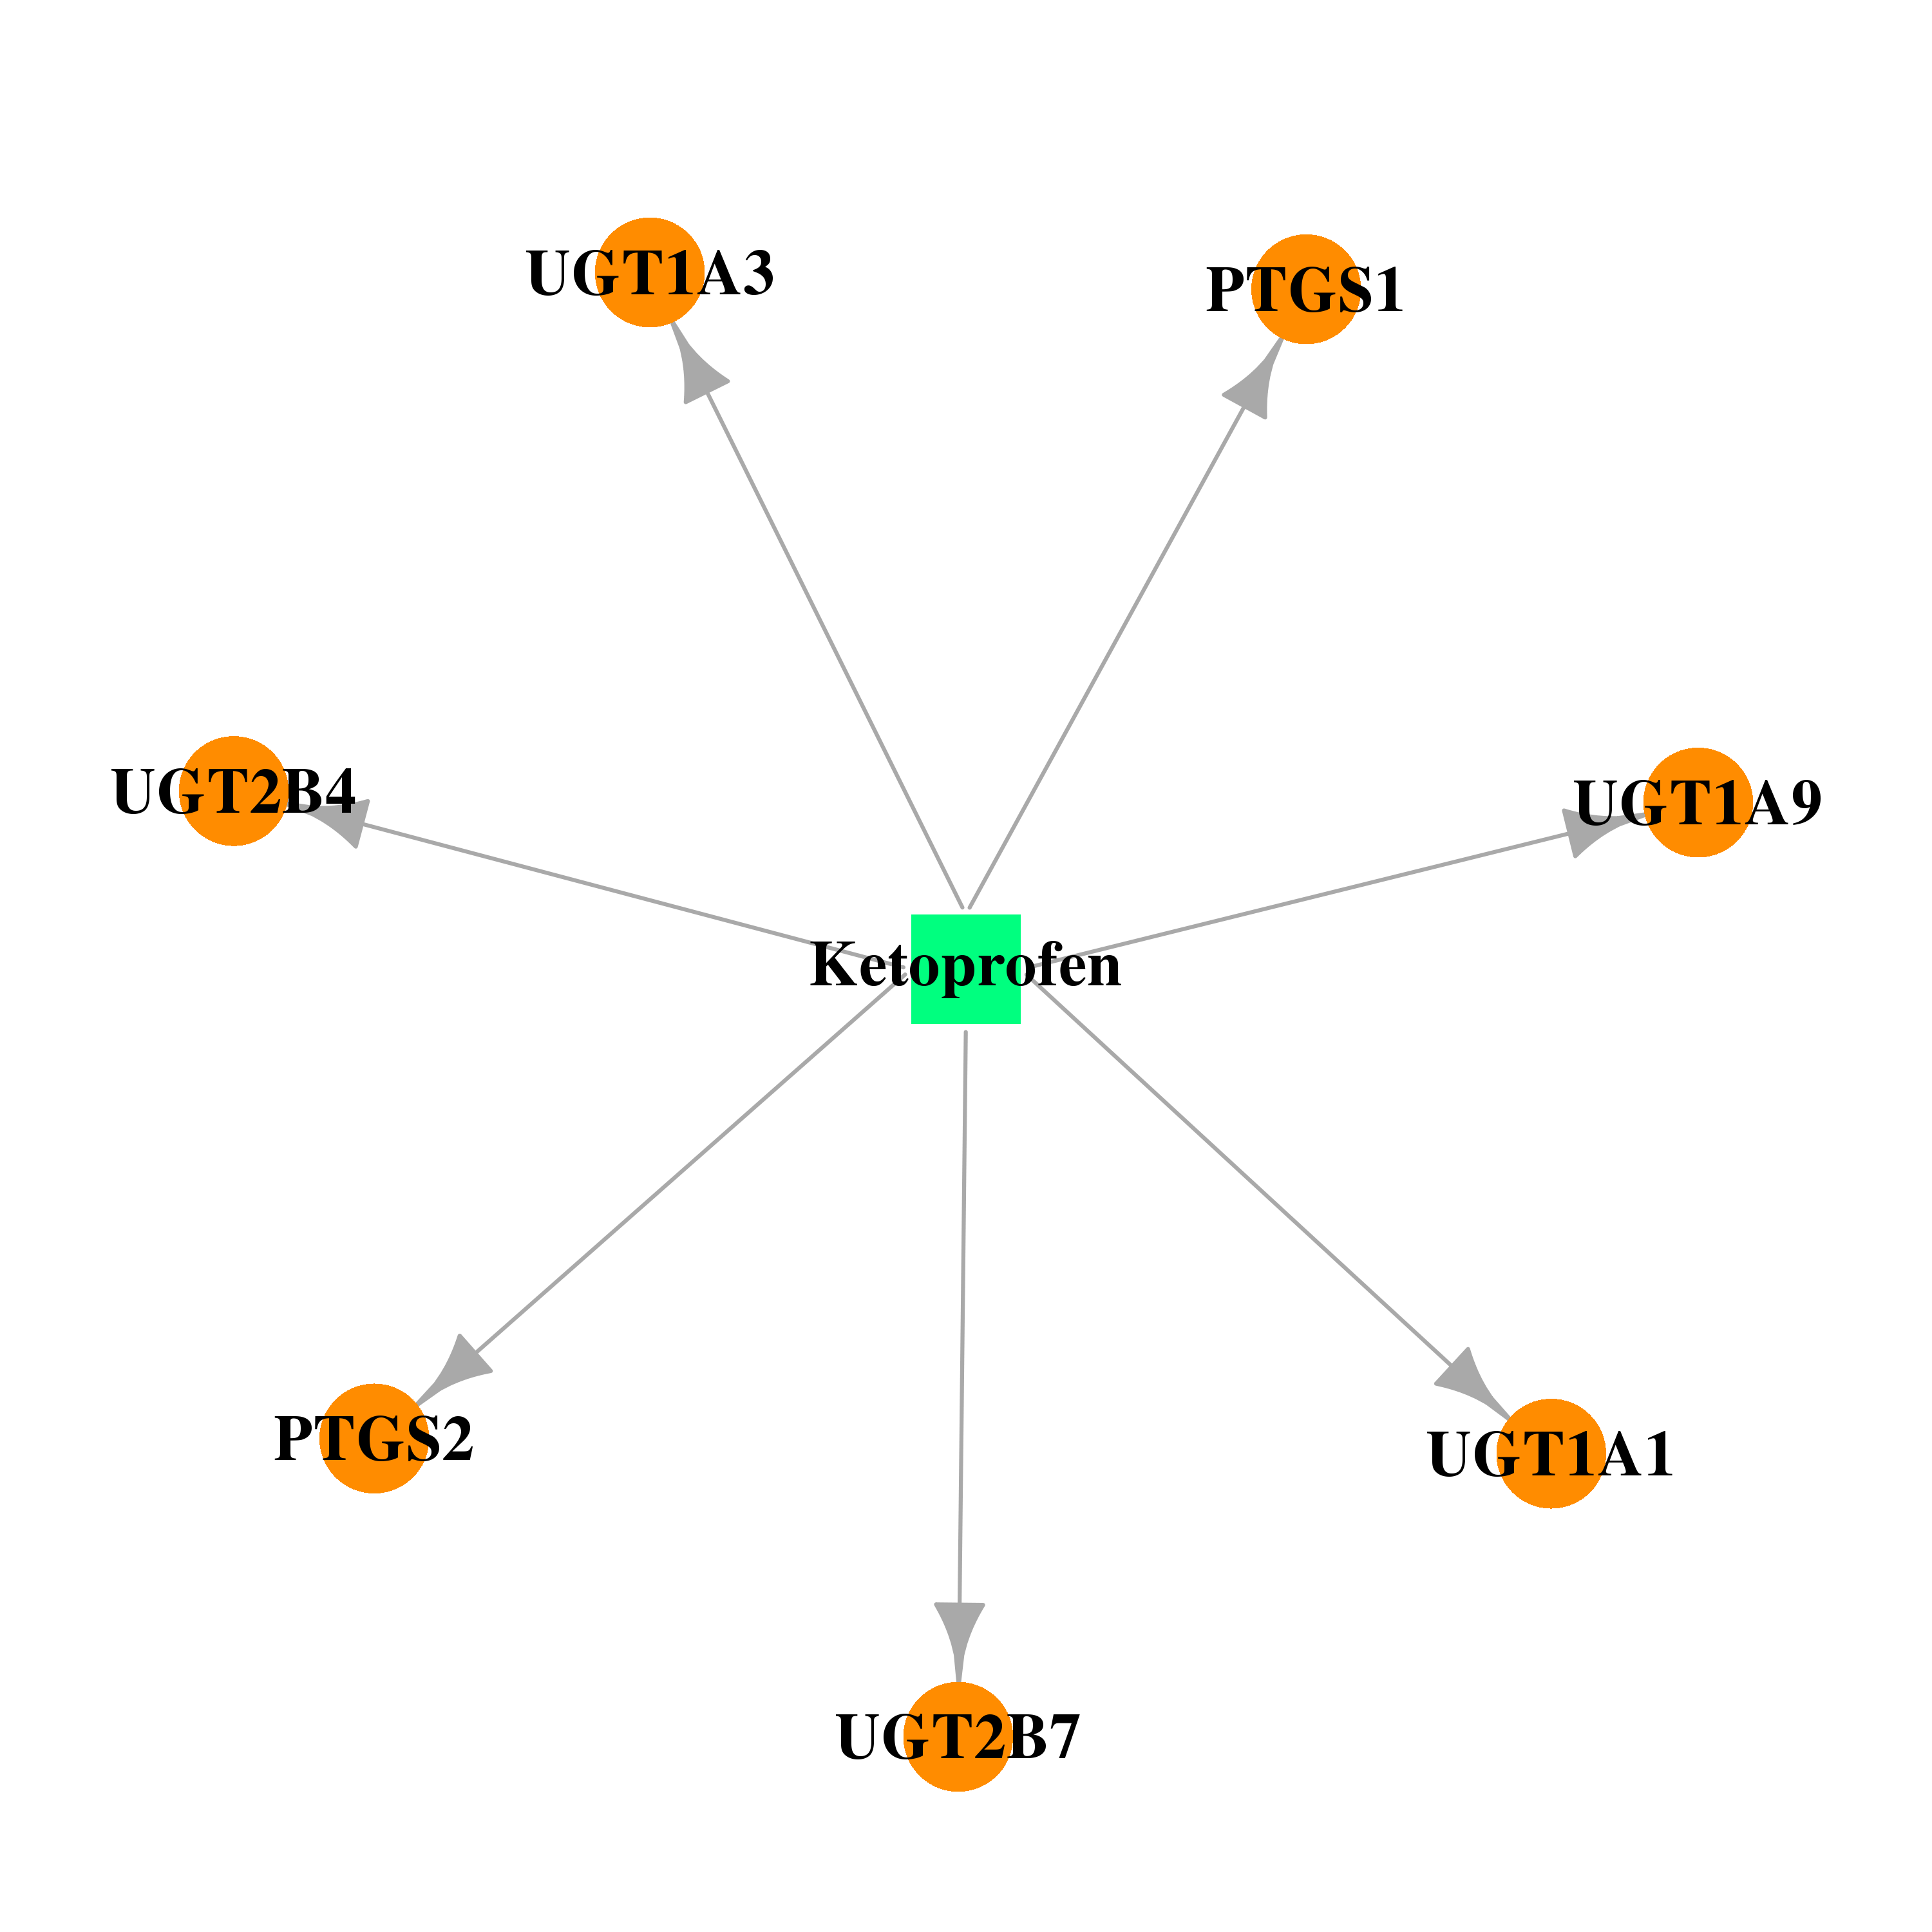 | 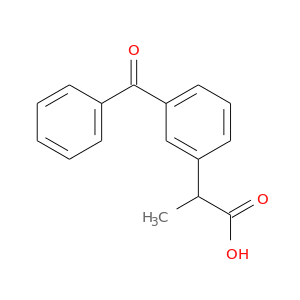 |
| Top |
| Cross referenced IDs for UGT1A3 |
| * We obtained these cross-references from Uniprot database. It covers 150 different DBs, 18 categories. http://www.uniprot.org/help/cross_references_section |
: Open all cross reference information
|
Copyright © 2016-Present - The Univsersity of Texas Health Science Center at Houston @ |