|
||||||||||||||||||||
| |
| Phenotypic Information (metabolism pathway, cancer, disease, phenome) |
| |
| |
| Gene-Gene Network Information: Co-Expression Network, Interacting Genes & KEGG |
| |
|


| Gene Summary for CRLS1 |
| Basic gene info. | Gene symbol | CRLS1 |
| Gene name | cardiolipin synthase 1 | |
| Synonyms | C20orf155|CLS|CLS1|GCD10|dJ967N21.6 | |
| Cytomap | UCSC genome browser: 20p13-p12.3 | |
| Genomic location | chr20 :5987897-6020697 | |
| Type of gene | protein-coding | |
| RefGenes | NM_001127458.1, NM_019095.4, | |
| Ensembl id | ENSG00000088766 | |
| Description | cardiolipin synthase | |
| Modification date | 20141207 | |
| dbXrefs | MIM : 608188 | |
| HGNC : HGNC | ||
| Ensembl : ENSG00000088766 | ||
| HPRD : 12187 | ||
| Vega : OTTHUMG00000031823 | ||
| Protein | UniProt: go to UniProt's Cross Reference DB Table | |
| Expression | CleanEX: HS_CRLS1 | |
| BioGPS: 54675 | ||
| Gene Expression Atlas: ENSG00000088766 | ||
| The Human Protein Atlas: ENSG00000088766 | ||
| Pathway | NCI Pathway Interaction Database: CRLS1 | |
| KEGG: CRLS1 | ||
| REACTOME: CRLS1 | ||
| ConsensusPathDB | ||
| Pathway Commons: CRLS1 | ||
| Metabolism | MetaCyc: CRLS1 | |
| HUMANCyc: CRLS1 | ||
| Regulation | Ensembl's Regulation: ENSG00000088766 | |
| miRBase: chr20 :5,987,897-6,020,697 | ||
| TargetScan: NM_001127458 | ||
| cisRED: ENSG00000088766 | ||
| Context | iHOP: CRLS1 | |
| cancer metabolism search in PubMed: CRLS1 | ||
| UCL Cancer Institute: CRLS1 | ||
| Assigned class in ccmGDB | C | |
| Top |
| Phenotypic Information for CRLS1(metabolism pathway, cancer, disease, phenome) |
| Cancer | CGAP: CRLS1 |
| Familial Cancer Database: CRLS1 | |
| * This gene is included in those cancer gene databases. |
|
|
|
|
|
| . | ||||||||||||||
Oncogene 1 | Significant driver gene in | |||||||||||||||||||
| cf) number; DB name 1 Oncogene; http://nar.oxfordjournals.org/content/35/suppl_1/D721.long, 2 Tumor Suppressor gene; https://bioinfo.uth.edu/TSGene/, 3 Cancer Gene Census; http://www.nature.com/nrc/journal/v4/n3/abs/nrc1299.html, 4 CancerGenes; http://nar.oxfordjournals.org/content/35/suppl_1/D721.long, 5 Network of Cancer Gene; http://ncg.kcl.ac.uk/index.php, 1Therapeutic Vulnerabilities in Cancer; http://cbio.mskcc.org/cancergenomics/statius/ |
| KEGG_GLYCEROPHOSPHOLIPID_METABOLISM REACTOME_PHOSPHOLIPID_METABOLISM REACTOME_METABOLISM_OF_LIPIDS_AND_LIPOPROTEINS | |
| OMIM | |
| Orphanet | |
| Disease | KEGG Disease: CRLS1 |
| MedGen: CRLS1 (Human Medical Genetics with Condition) | |
| ClinVar: CRLS1 | |
| Phenotype | MGI: CRLS1 (International Mouse Phenotyping Consortium) |
| PhenomicDB: CRLS1 | |
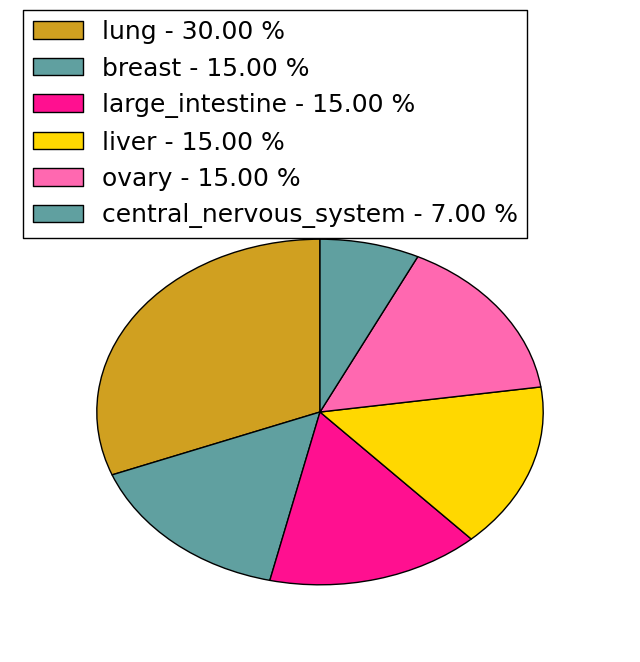
| Mutations for CRLS1 |
| * Under tables are showing count per each tissue to give us broad intuition about tissue specific mutation patterns.You can go to the detailed page for each mutation database's web site. |
| - Statistics for Tissue and Mutation type | Top |
 |
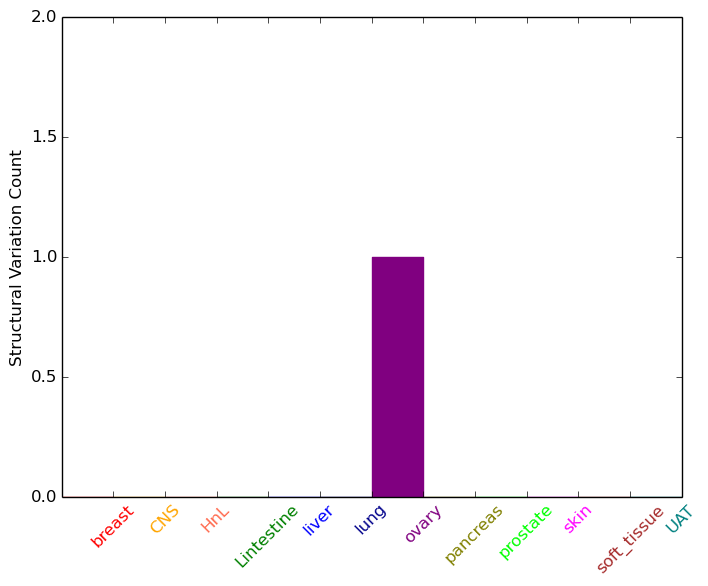
| - For Inter-chromosomal Variations |
| * Inter-chromosomal variantions includes 'interchromosomal amplicon to amplicon', 'interchromosomal amplicon to non-amplified dna', 'interchromosomal insertion', 'Interchromosomal unknown type'. |
 |
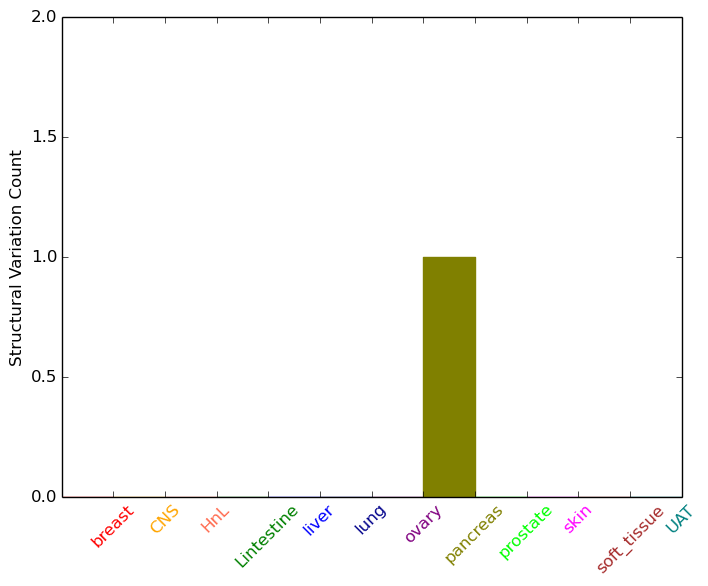
| - For Intra-chromosomal Variations |
| * Intra-chromosomal variantions includes 'intrachromosomal amplicon to amplicon', 'intrachromosomal amplicon to non-amplified dna', 'intrachromosomal deletion', 'intrachromosomal fold-back inversion', 'intrachromosomal inversion', 'intrachromosomal tandem duplication', 'Intrachromosomal unknown type', 'intrachromosomal with inverted orientation', 'intrachromosomal with non-inverted orientation'. |
 |
| Sample | Symbol_a | Chr_a | Start_a | End_a | Symbol_b | Chr_b | Start_b | End_b |
| pancreas | CRLS1 | chr20 | 5998580 | 5998600 | CRLS1 | chr20 | 5999790 | 5999810 |
| cf) Tissue number; Tissue name (1;Breast, 2;Central_nervous_system, 3;Haematopoietic_and_lymphoid_tissue, 4;Large_intestine, 5;Liver, 6;Lung, 7;Ovary, 8;Pancreas, 9;Prostate, 10;Skin, 11;Soft_tissue, 12;Upper_aerodigestive_tract) |
| * From mRNA Sanger sequences, Chitars2.0 arranged chimeric transcripts. This table shows CRLS1 related fusion information. |
| ID | Head Gene | Tail Gene | Accession | Gene_a | qStart_a | qEnd_a | Chromosome_a | tStart_a | tEnd_a | Gene_a | qStart_a | qEnd_a | Chromosome_a | tStart_a | tEnd_a |
| CB163082 | ABCA11P | 31 | 374 | 4 | 420803 | 431791 | CRLS1 | 373 | 636 | 20 | 5989428 | 5989691 | |
| AK129562 | CRLS1 | 1 | 1544 | 20 | 6008431 | 6009972 | TEX9 | 1545 | 1810 | 15 | 56721007 | 56721272 | |
| Top |
| There's no copy number variation information in COSMIC data for this gene. |
| Top |
|
 |
| Top |
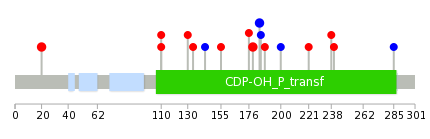
| Stat. for Non-Synonymous SNVs (# total SNVs=13) | (# total SNVs=4) |
 |  |
(# total SNVs=1) | (# total SNVs=0) |
 |
| Top |
| * When you move the cursor on each content, you can see more deailed mutation information on the Tooltip. Those are primary_site,primary_histology,mutation(aa),pubmedID. |
| GRCh37 position | Mutation(aa) | Unique sampleID count |
| chr20:5996097-5996097 | p.I179V | 2 |
| chr20:6017787-6017787 | p.Q297* | 2 |
| chr20:5996114-5996114 | p.L184L | 2 |
| chr20:5986950-5986950 | p.A20T | 2 |
| chr20:6012658-6012658 | p.R221G | 2 |
| chr20:6015138-6015149 | p.S256_A259delSLAA | 1 |
| chr20:5996088-5996088 | p.L176I | 1 |
| chr20:6017753-6017753 | p.A285A | 1 |
| chr20:5996117-5996117 | p.T185T | 1 |
| chr20:5990442-5990442 | p.P110S | 1 |
| Top |
|
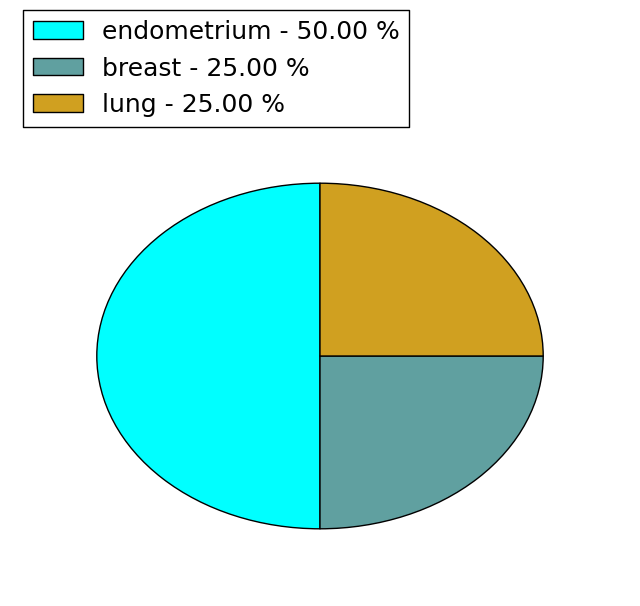
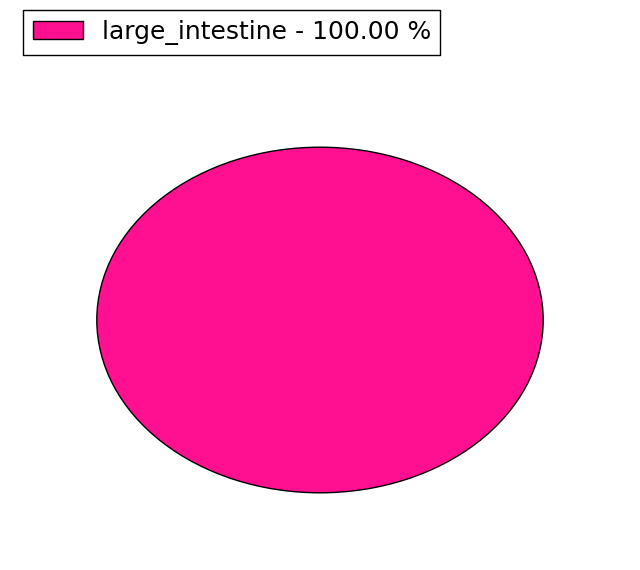
 |
| Point Mutation/ Tissue ID | 1 | 2 | 3 | 4 | 5 | 6 | 7 | 8 | 9 | 10 | 11 | 12 | 13 | 14 | 15 | 16 | 17 | 18 | 19 | 20 |
| # sample | 1 | 1 | 1 | 1 | 1 | 1 | 1 | 2 | ||||||||||||
| # mutation | 1 | 1 | 1 | 1 | 2 | 1 | 1 | 2 | ||||||||||||
| nonsynonymous SNV | 1 | 1 | 1 | 2 | 1 | 1 | ||||||||||||||
| synonymous SNV | 1 | 2 |
| cf) Tissue ID; Tissue type (1; BLCA[Bladder Urothelial Carcinoma], 2; BRCA[Breast invasive carcinoma], 3; CESC[Cervical squamous cell carcinoma and endocervical adenocarcinoma], 4; COAD[Colon adenocarcinoma], 5; GBM[Glioblastoma multiforme], 6; Glioma Low Grade, 7; HNSC[Head and Neck squamous cell carcinoma], 8; KICH[Kidney Chromophobe], 9; KIRC[Kidney renal clear cell carcinoma], 10; KIRP[Kidney renal papillary cell carcinoma], 11; LAML[Acute Myeloid Leukemia], 12; LUAD[Lung adenocarcinoma], 13; LUSC[Lung squamous cell carcinoma], 14; OV[Ovarian serous cystadenocarcinoma ], 15; PAAD[Pancreatic adenocarcinoma], 16; PRAD[Prostate adenocarcinoma], 17; SKCM[Skin Cutaneous Melanoma], 18:STAD[Stomach adenocarcinoma], 19:THCA[Thyroid carcinoma], 20:UCEC[Uterine Corpus Endometrial Carcinoma]) |
| Top |
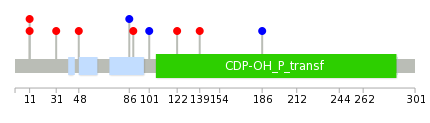
| * We represented just top 10 SNVs. When you move the cursor on each content, you can see more deailed mutation information on the Tooltip. Those are primary_site, primary_histology, mutation(aa), pubmedID. |
| Genomic Position | Mutation(aa) | Unique sampleID count |
| chr20:6012710 | p.P11S,CRLS1 | 1 |
| chr20:6017753 | p.P11L,CRLS1 | 1 |
| chr20:5990442 | p.E31Q,CRLS1 | 1 |
| chr20:5990443 | p.D48H,CRLS1 | 1 |
| chr20:5990502 | p.T86T,CRLS1 | 1 |
| chr20:5990553 | p.D89Y,CRLS1 | 1 |
| chr20:5996117 | p.S101S,CRLS1 | 1 |
| chr20:5996124 | p.R122G,CRLS1 | 1 |
| chr20:6011956 | p.P139Q,CRLS1 | 1 |
| chr20:6012658 | p.A186A,CRLS1 | 1 |
| * Copy number data were extracted from TCGA using R package TCGA-Assembler. The URLs of all public data files on TCGA DCC data server were gathered on Jan-05-2015. Function ProcessCNAData in TCGA-Assembler package was used to obtain gene-level copy number value which is calculated as the average copy number of the genomic region of a gene. |
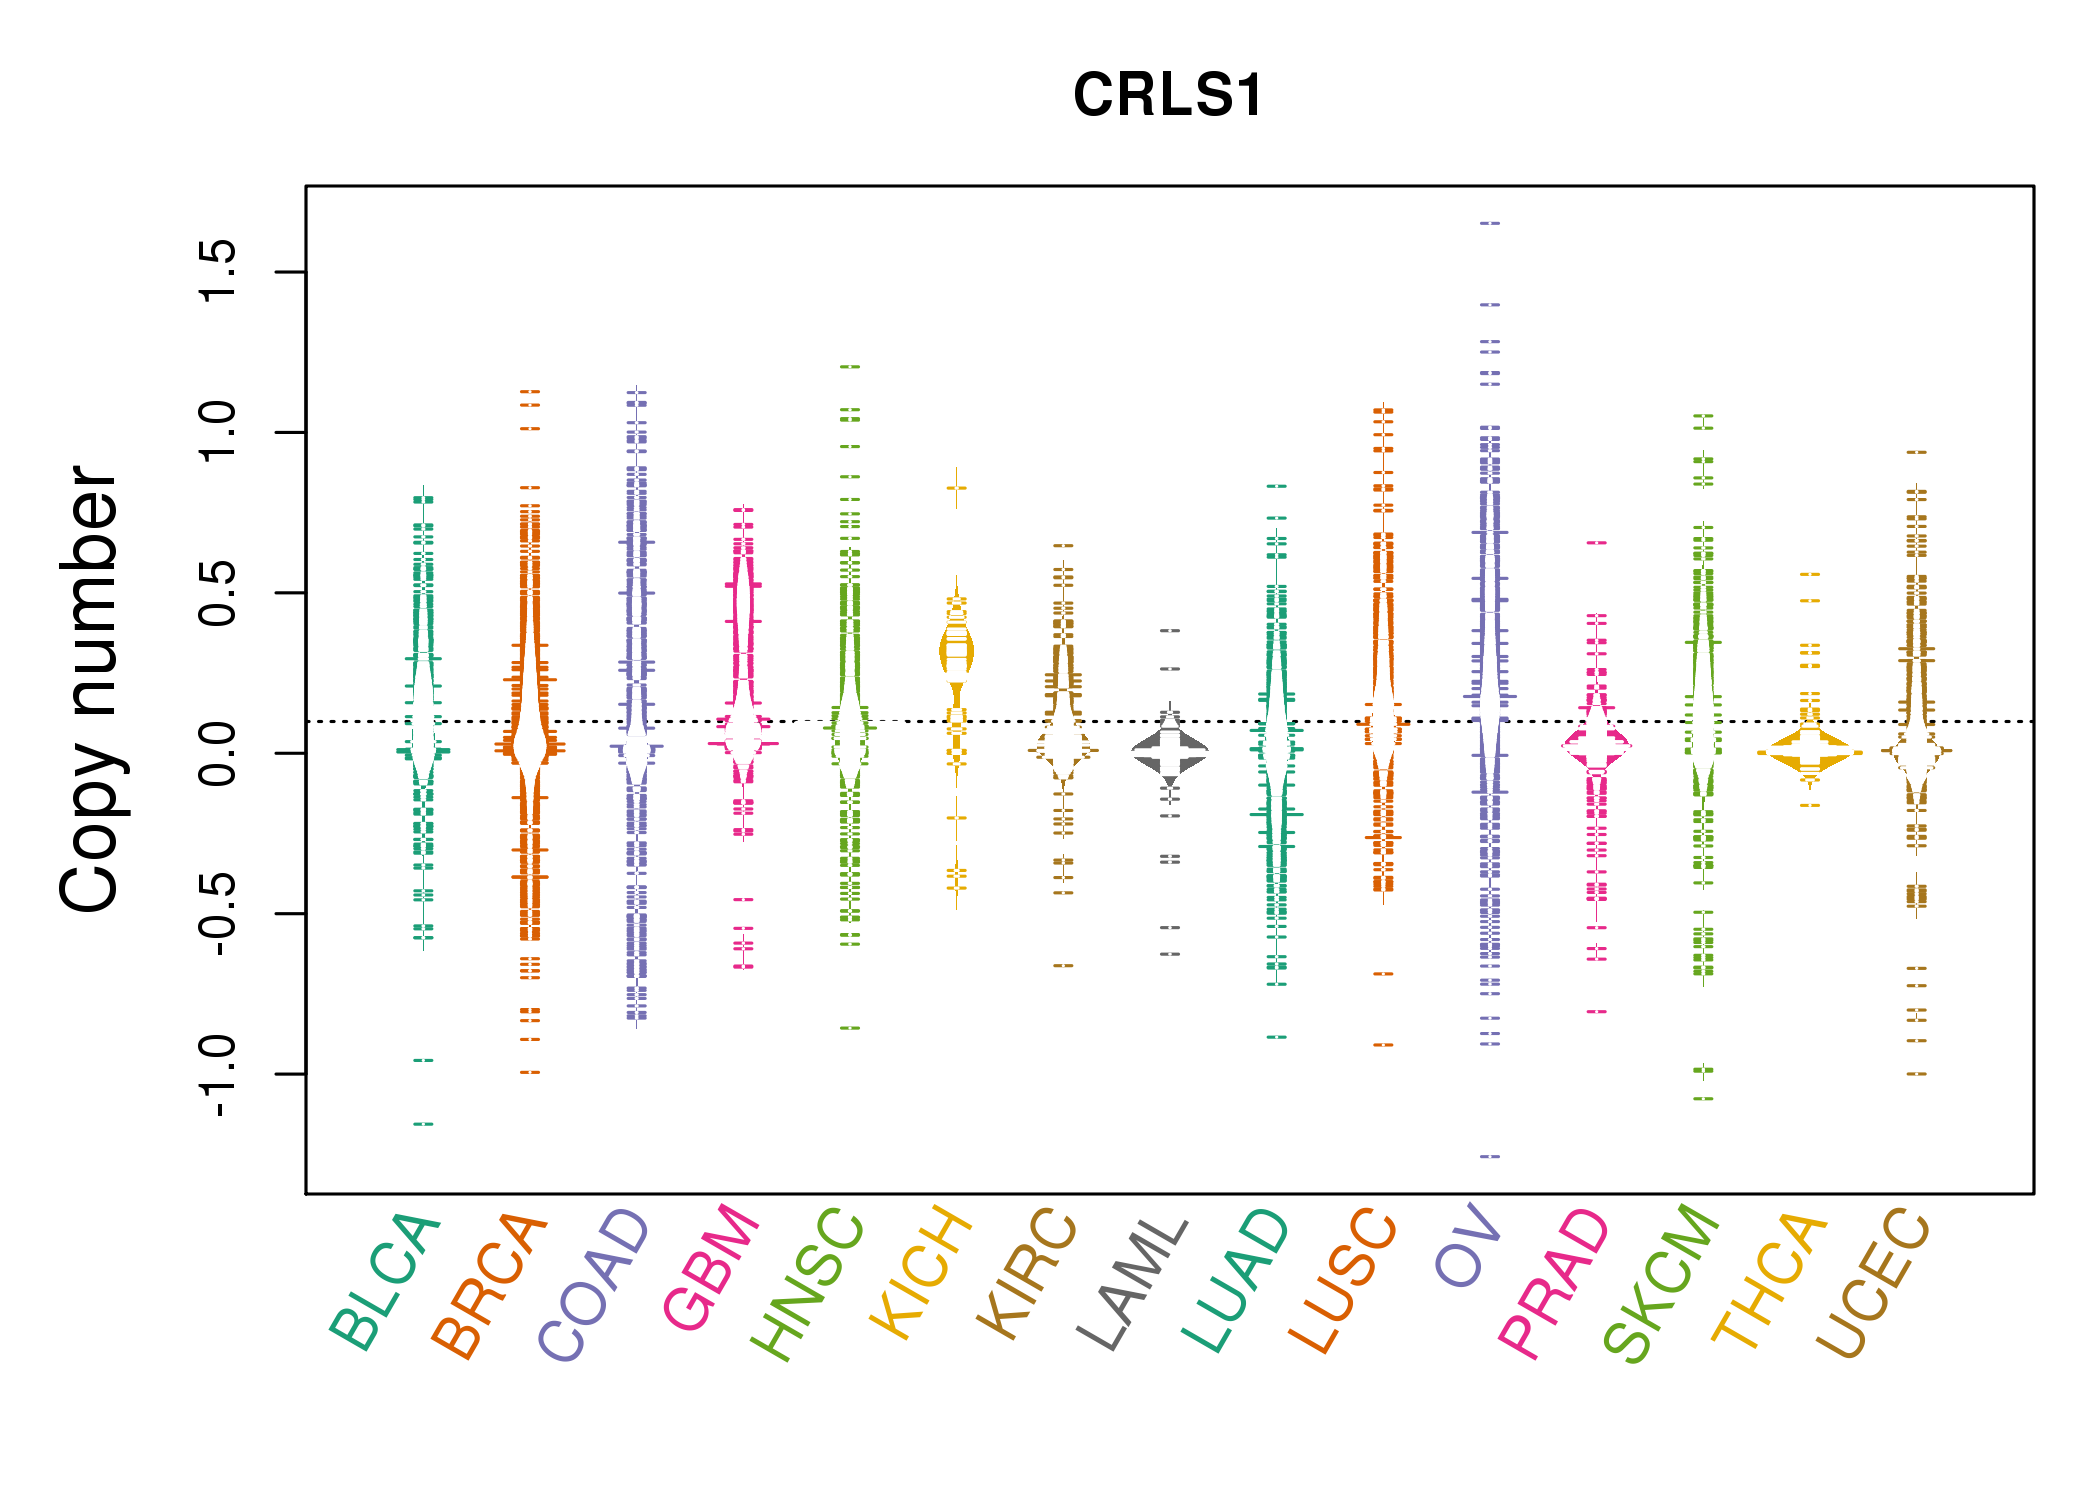 |
| cf) Tissue ID[Tissue type]: BLCA[Bladder Urothelial Carcinoma], BRCA[Breast invasive carcinoma], CESC[Cervical squamous cell carcinoma and endocervical adenocarcinoma], COAD[Colon adenocarcinoma], GBM[Glioblastoma multiforme], Glioma Low Grade, HNSC[Head and Neck squamous cell carcinoma], KICH[Kidney Chromophobe], KIRC[Kidney renal clear cell carcinoma], KIRP[Kidney renal papillary cell carcinoma], LAML[Acute Myeloid Leukemia], LUAD[Lung adenocarcinoma], LUSC[Lung squamous cell carcinoma], OV[Ovarian serous cystadenocarcinoma ], PAAD[Pancreatic adenocarcinoma], PRAD[Prostate adenocarcinoma], SKCM[Skin Cutaneous Melanoma], STAD[Stomach adenocarcinoma], THCA[Thyroid carcinoma], UCEC[Uterine Corpus Endometrial Carcinoma] |
| Top |
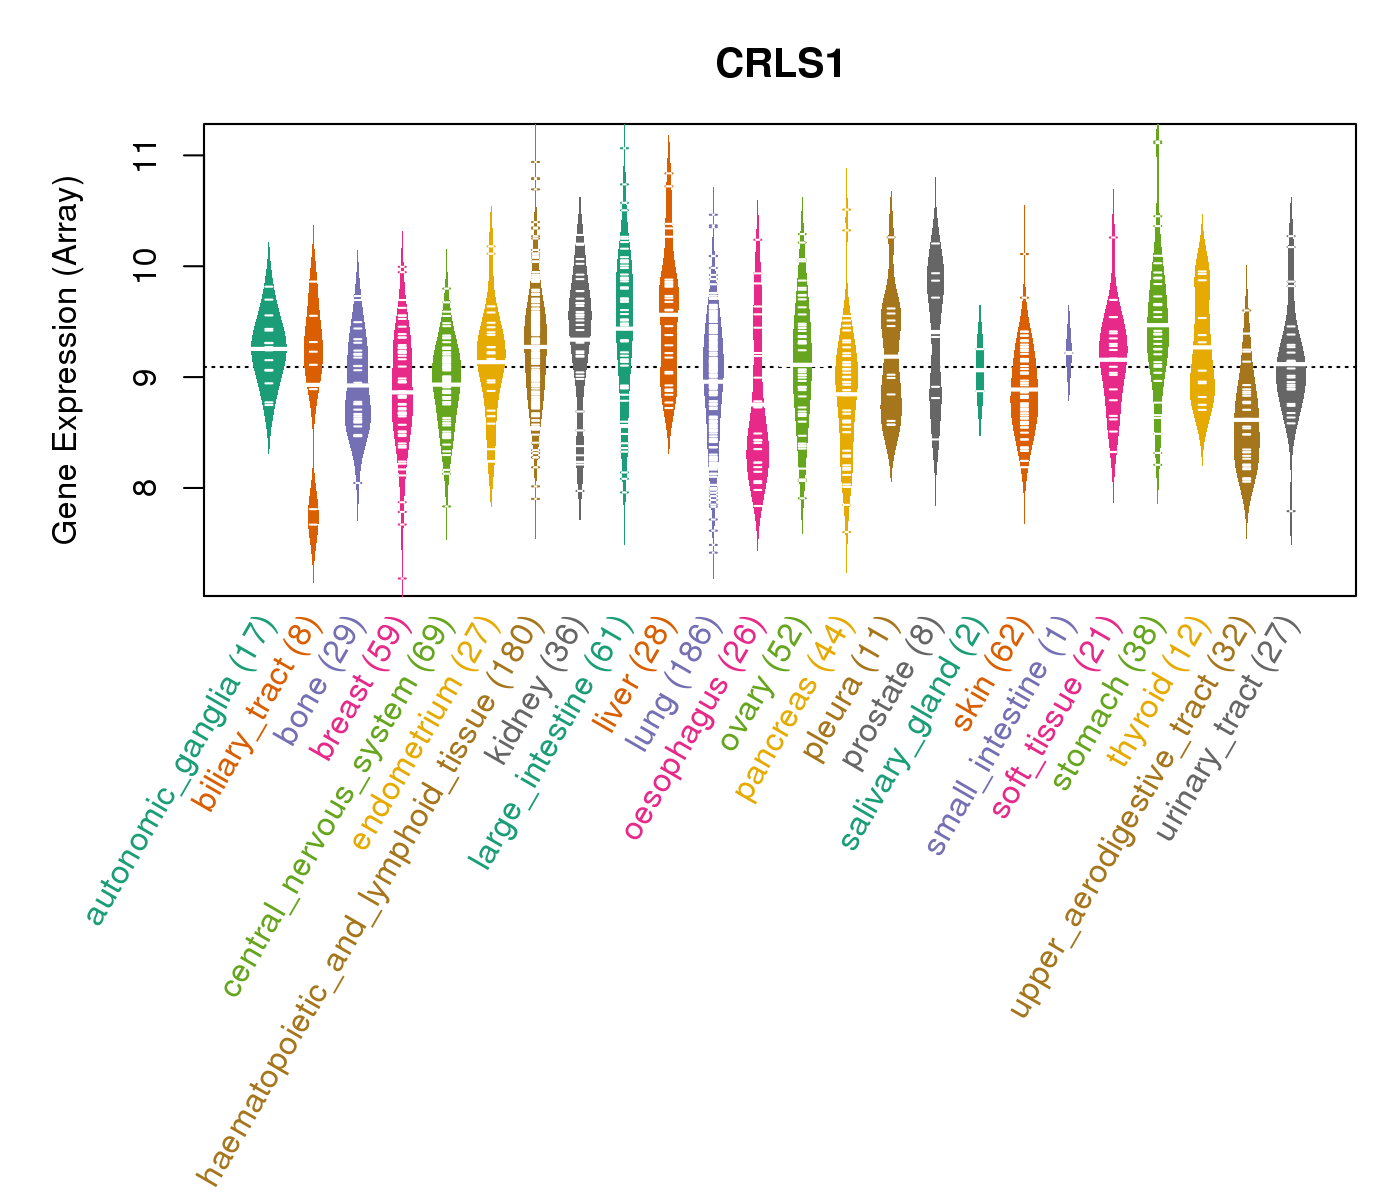
| Gene Expression for CRLS1 |
| * CCLE gene expression data were extracted from CCLE_Expression_Entrez_2012-10-18.res: Gene-centric RMA-normalized mRNA expression data. |
 |
| * Normalized gene expression data of RNASeqV2 was extracted from TCGA using R package TCGA-Assembler. The URLs of all public data files on TCGA DCC data server were gathered at Jan-05-2015. Only eight cancer types have enough normal control samples for differential expression analysis. (t test, adjusted p<0.05 (using Benjamini-Hochberg FDR)) |
 |
| Top |
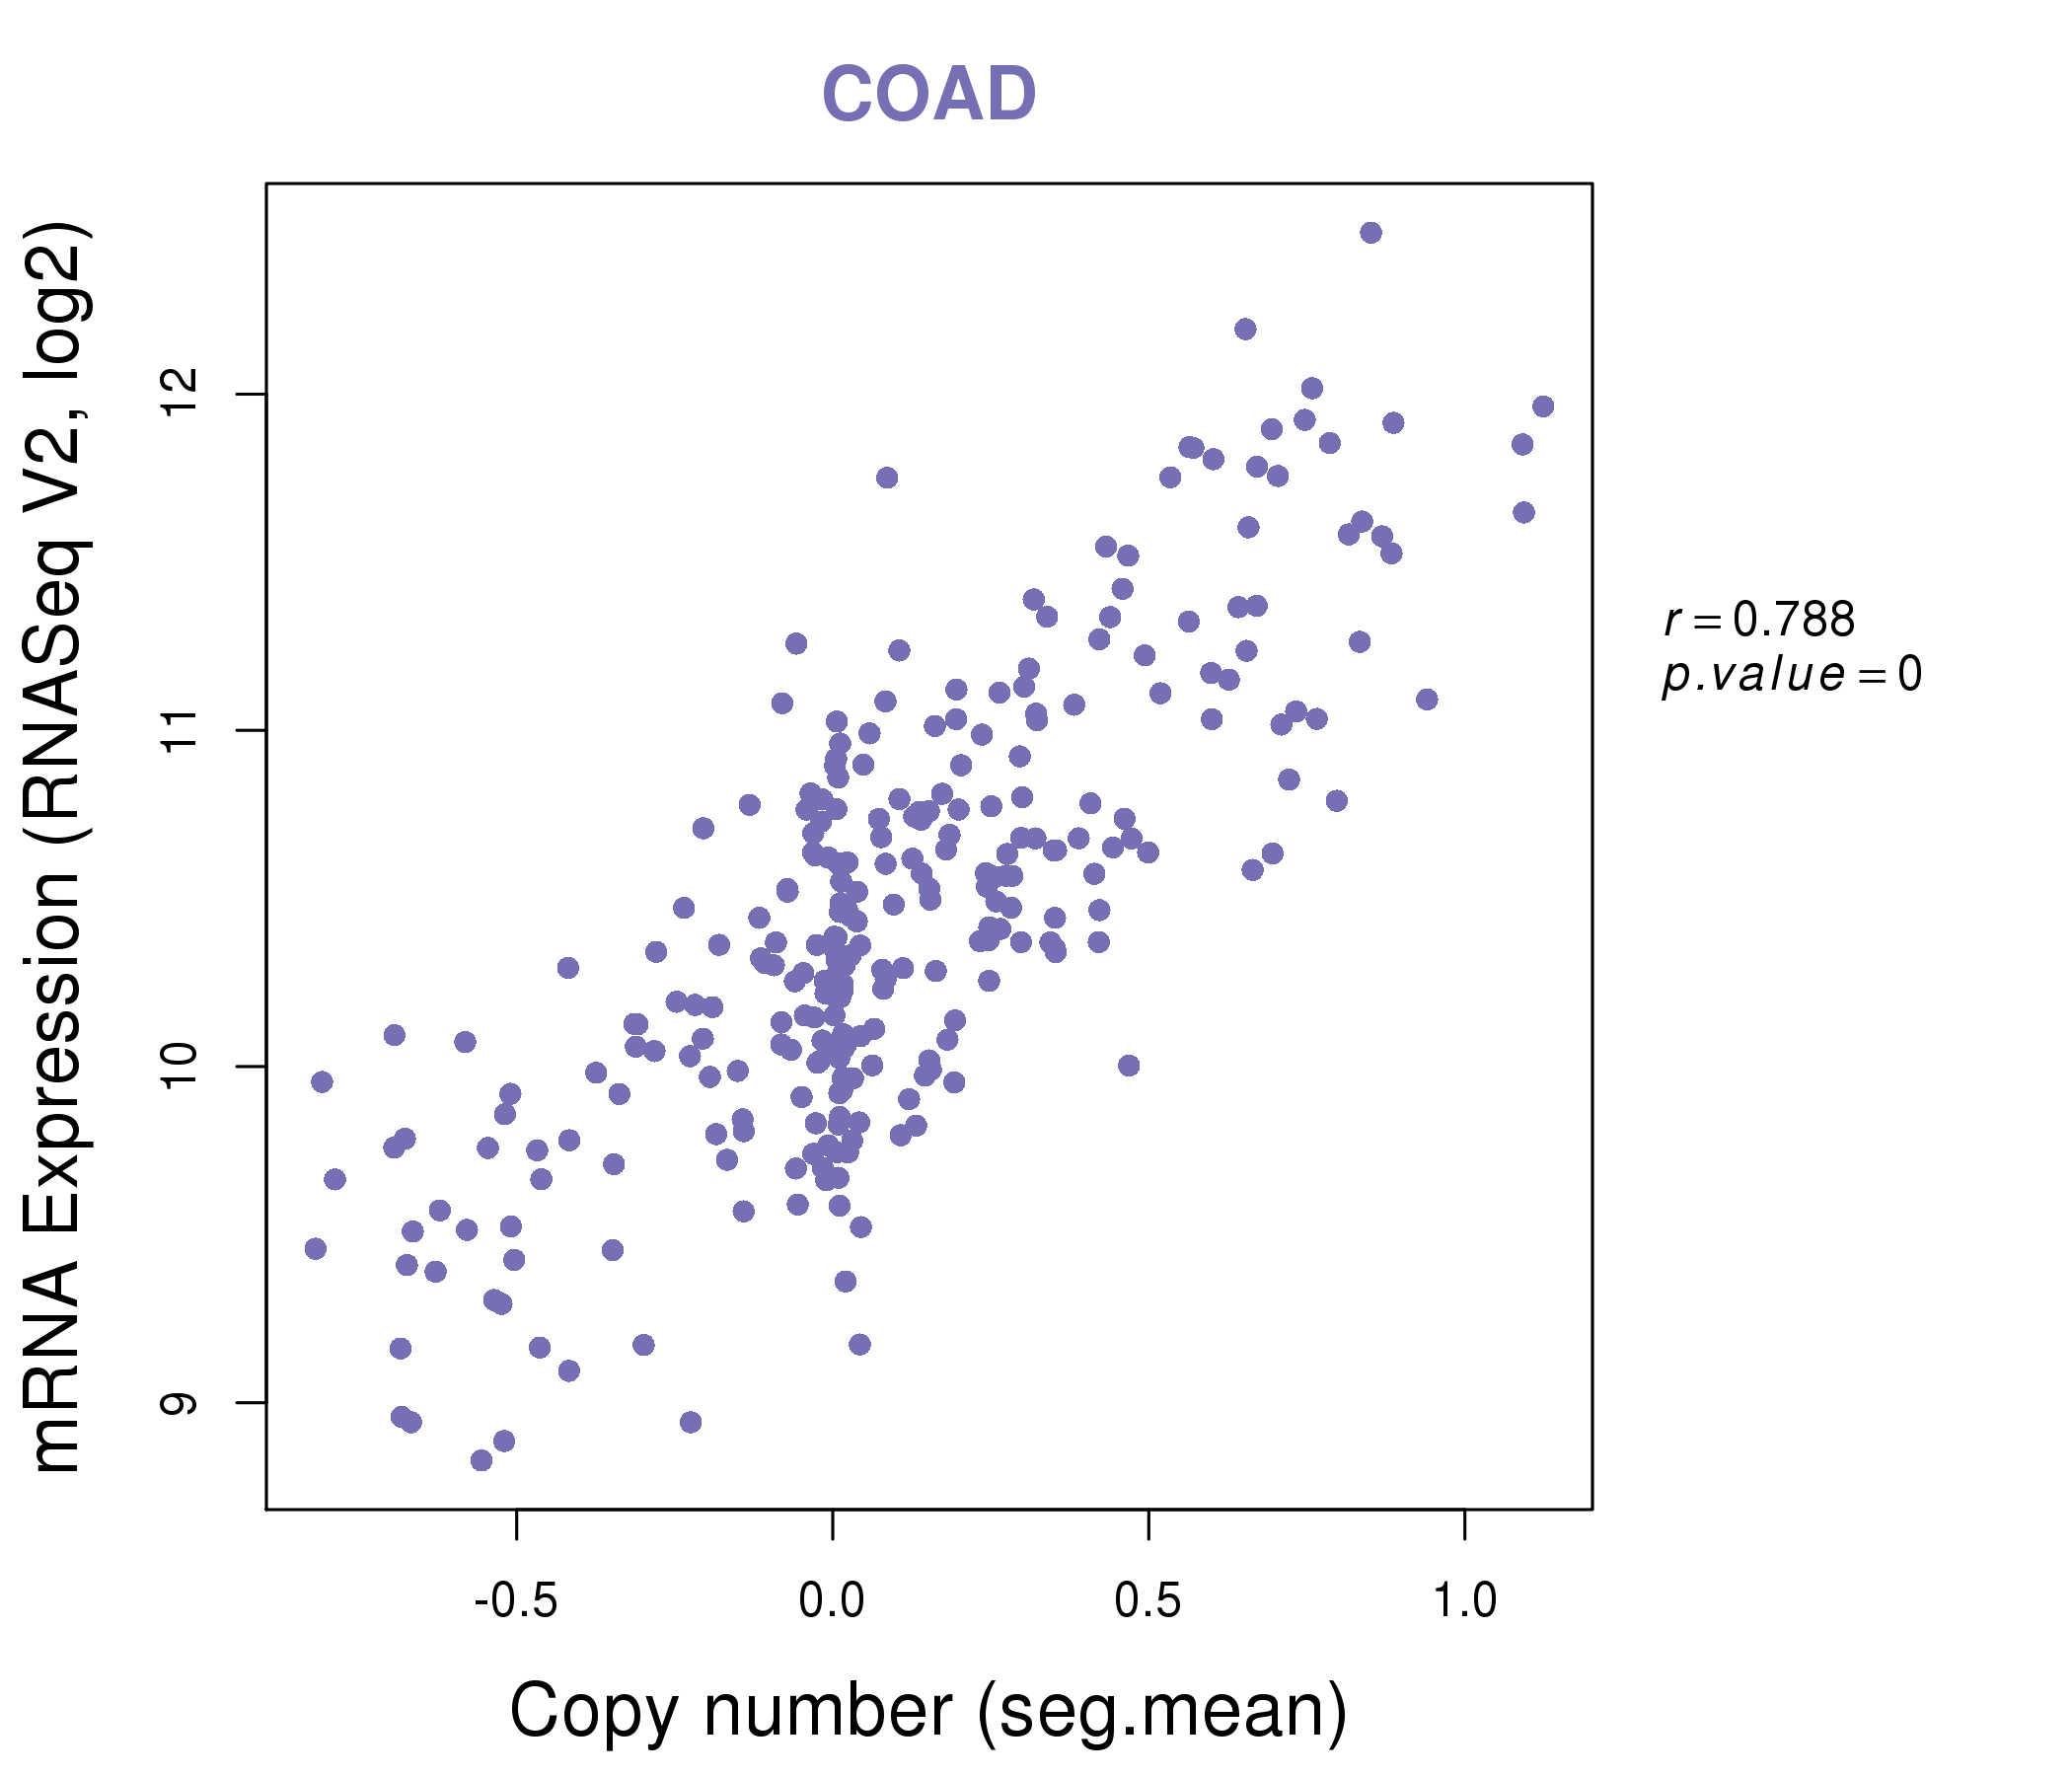
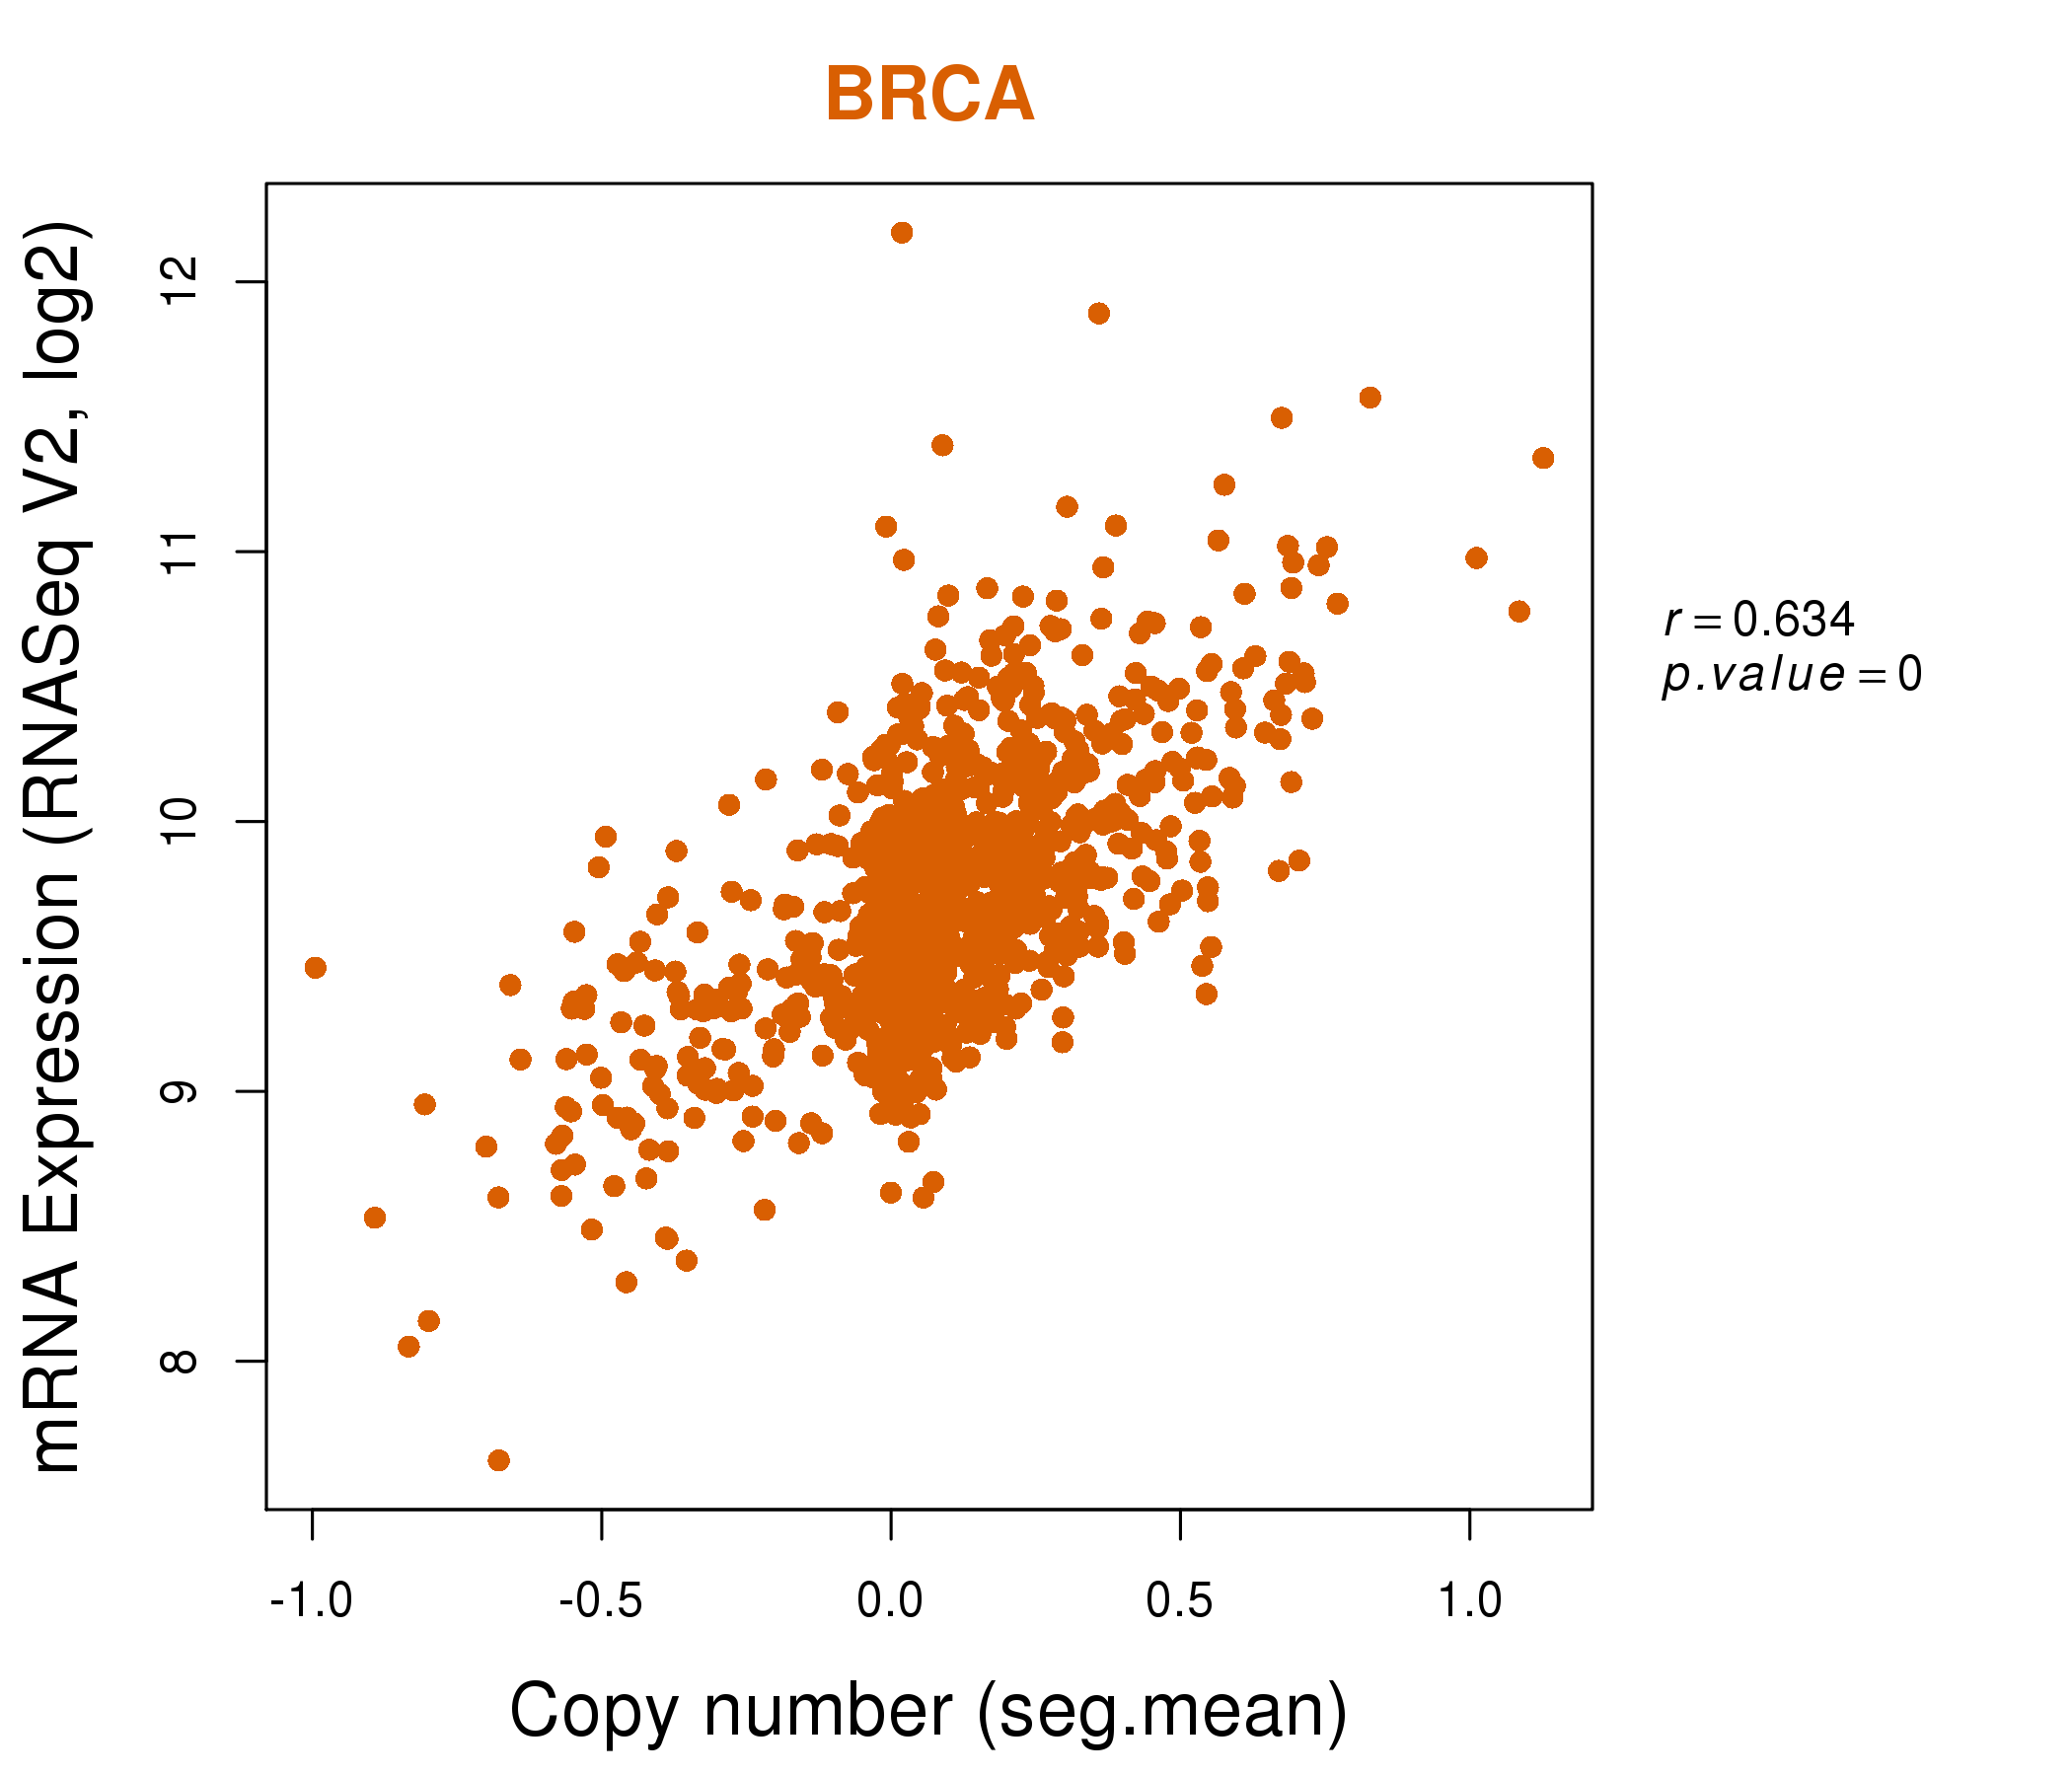
| * This plots show the correlation between CNV and gene expression. |
: Open all plots for all cancer types
 |
|
 |
|

| Top |
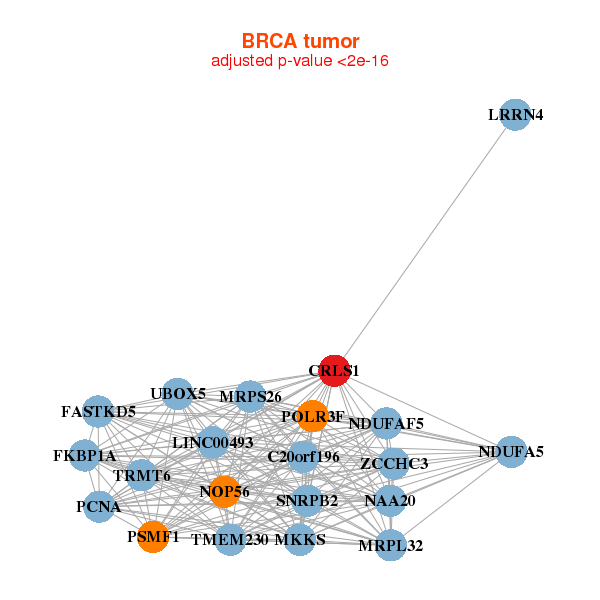
| Gene-Gene Network Information |
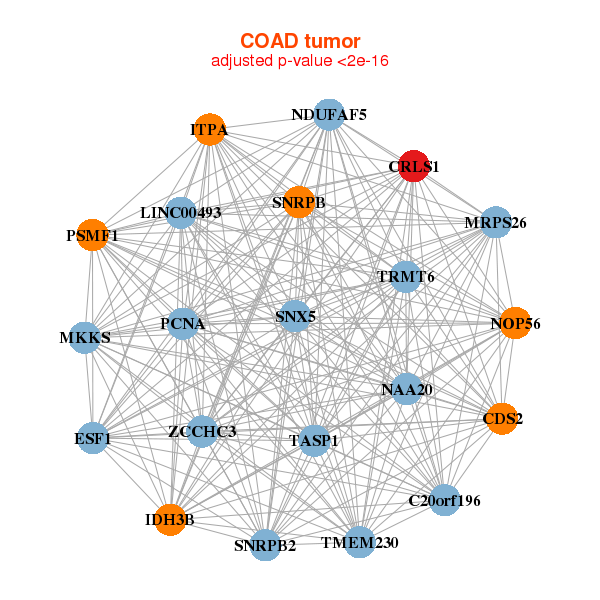
| * Co-Expression network figures were drawn using R package igraph. Only the top 20 genes with the highest correlations were shown. Red circle: input gene, orange circle: cell metabolism gene, sky circle: other gene |
: Open all plots for all cancer types
 |
|
| C20orf196,TMEM230,NDUFAF5,CRLS1,FASTKD5,FKBP1A,LINC00493, LRRN4,MKKS,MRPL32,MRPS26,NAA20,NDUFA5,NOP56, PCNA,POLR3F,PSMF1,SNRPB2,TRMT6,UBOX5,ZCCHC3 | ACVR1C,ADH1B,AQPEP,AZI2,RHOV___CHP1,CRLS1,CTNNAL1, DNAH9,DRAM2,EIF4EBP2,GHR,GNAI1,HADH,HRSP12, NFU1,PECR,PPP3R1,PRDX6,SLC19A3,ST3GAL6,TMEM55A |
 |
|
| C20orf196,TMEM230,NDUFAF5,CDS2,CRLS1,ESF1,IDH3B, ITPA,LINC00493,MKKS,MRPS26,NAA20,NOP56,PCNA, PSMF1,SNRPB2,SNRPB,SNX5,TASP1,TRMT6,ZCCHC3 | ACP1,ARV1,ATF1,DNAAF2,C1orf131,CNOT8,CRLS1, DUSP11,EBAG9,FAM60A,FAM96A,MTFMT,NUDT6,NXT2, SVIP,TFB2M,TMEM168,TMEM68,TXNDC12,ZNF195,ZNF480 |
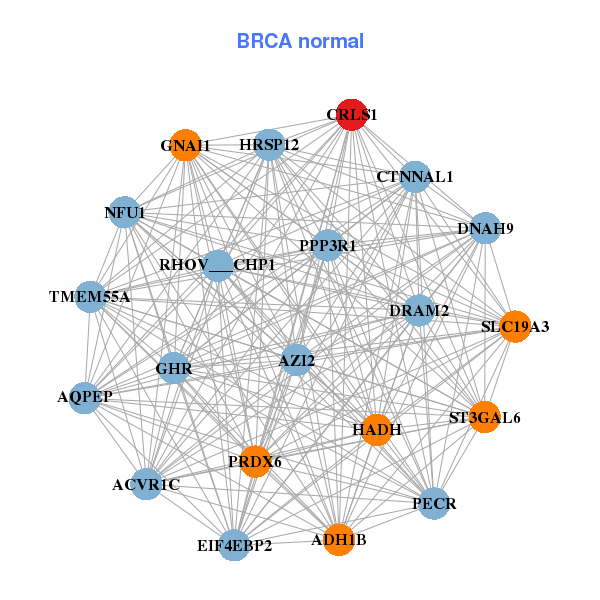
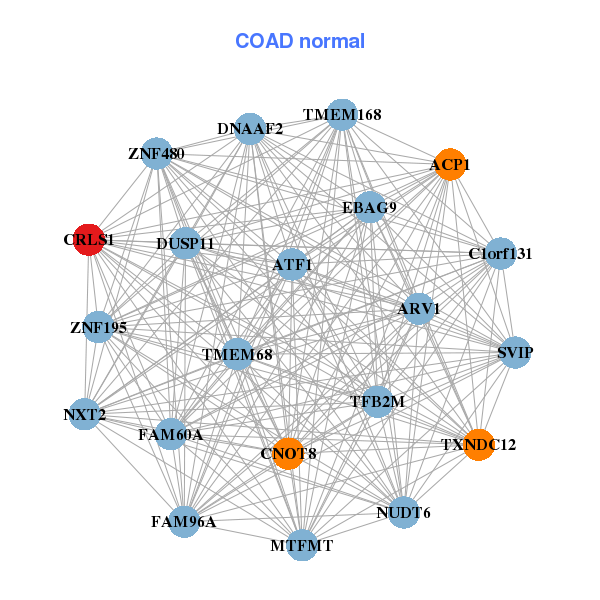
| * Co-Expression network figures were drawn using R package igraph. Only the top 20 genes with the highest correlations were shown. Red circle: input gene, orange circle: cell metabolism gene, sky circle: other gene |
: Open all plots for all cancer types
| Top |
: Open all interacting genes' information including KEGG pathway for all interacting genes from DAVID
| Top |
| Pharmacological Information for CRLS1 |
| There's no related Drug. |
| Top |
| Cross referenced IDs for CRLS1 |
| * We obtained these cross-references from Uniprot database. It covers 150 different DBs, 18 categories. http://www.uniprot.org/help/cross_references_section |
: Open all cross reference information
|
Copyright © 2016-Present - The Univsersity of Texas Health Science Center at Houston @ |