|
||||||||||||||||||||
| |
| Phenotypic Information (metabolism pathway, cancer, disease, phenome) |
| |
| |
| Gene-Gene Network Information: Co-Expression Network, Interacting Genes & KEGG |
| |
|


| Gene Summary for PDP1 |
| Basic gene info. | Gene symbol | PDP1 |
| Gene name | pyruvate dehyrogenase phosphatase catalytic subunit 1 | |
| Synonyms | PDH|PDP|PDPC|PPM2C | |
| Cytomap | UCSC genome browser: 8q22.1 | |
| Genomic location | chr8 :94929991-94938296 | |
| Type of gene | protein-coding | |
| RefGenes | NM_001161779.1, NM_001161780.1,NM_001161781.1,NM_018444.3,NM_001161778.1, | |
| Ensembl id | ENSG00000164951 | |
| Description | PDP 1PDPC 1[Pyruvate dehydrogenase [acetyl-transferring]]-phosphatase 1, mitochondrialprotein phosphatase 2C, magnesium-dependent, catalytic subunitpyruvate dehydrogenase (Lipoamide) phosphatase-phosphatasepyruvate dehydrogenase phosphatase catalytic | |
| Modification date | 20141222 | |
| dbXrefs | MIM : 605993 | |
| HGNC : HGNC | ||
| Ensembl : ENSG00000164951 | ||
| HPRD : 16185 | ||
| Vega : OTTHUMG00000164356 | ||
| Protein | UniProt: go to UniProt's Cross Reference DB Table | |
| Expression | CleanEX: HS_PDP1 | |
| BioGPS: 54704 | ||
| Gene Expression Atlas: ENSG00000164951 | ||
| The Human Protein Atlas: ENSG00000164951 | ||
| Pathway | NCI Pathway Interaction Database: PDP1 | |
| KEGG: PDP1 | ||
| REACTOME: PDP1 | ||
| ConsensusPathDB | ||
| Pathway Commons: PDP1 | ||
| Metabolism | MetaCyc: PDP1 | |
| HUMANCyc: PDP1 | ||
| Regulation | Ensembl's Regulation: ENSG00000164951 | |
| miRBase: chr8 :94,929,991-94,938,296 | ||
| TargetScan: NM_001161779 | ||
| cisRED: ENSG00000164951 | ||
| Context | iHOP: PDP1 | |
| cancer metabolism search in PubMed: PDP1 | ||
| UCL Cancer Institute: PDP1 | ||
| Assigned class in ccmGDB | C | |
| Top |
| Phenotypic Information for PDP1(metabolism pathway, cancer, disease, phenome) |
| Cancer | CGAP: PDP1 |
| Familial Cancer Database: PDP1 | |
| * This gene is included in those cancer gene databases. |
|
|
|
|
|
|
| ||||||||||||||
Oncogene 1 | Significant driver gene in | |||||||||||||||||||
| cf) number; DB name 1 Oncogene; http://nar.oxfordjournals.org/content/35/suppl_1/D721.long, 2 Tumor Suppressor gene; https://bioinfo.uth.edu/TSGene/, 3 Cancer Gene Census; http://www.nature.com/nrc/journal/v4/n3/abs/nrc1299.html, 4 CancerGenes; http://nar.oxfordjournals.org/content/35/suppl_1/D721.long, 5 Network of Cancer Gene; http://ncg.kcl.ac.uk/index.php, 1Therapeutic Vulnerabilities in Cancer; http://cbio.mskcc.org/cancergenomics/statius/ |
| REACTOME_PYRUVATE_METABOLISM_AND_CITRIC_ACID_TCA_CYCLE REACTOME_PYRUVATE_METABOLISM | |
| OMIM | |
| Orphanet | |
| Disease | KEGG Disease: PDP1 |
| MedGen: PDP1 (Human Medical Genetics with Condition) | |
| ClinVar: PDP1 | |
| Phenotype | MGI: PDP1 (International Mouse Phenotyping Consortium) |
| PhenomicDB: PDP1 | |
| Mutations for PDP1 |
| * Under tables are showing count per each tissue to give us broad intuition about tissue specific mutation patterns.You can go to the detailed page for each mutation database's web site. |
| There's no structural variation information in COSMIC data for this gene. |
| * From mRNA Sanger sequences, Chitars2.0 arranged chimeric transcripts. This table shows PDP1 related fusion information. |
| ID | Head Gene | Tail Gene | Accession | Gene_a | qStart_a | qEnd_a | Chromosome_a | tStart_a | tEnd_a | Gene_a | qStart_a | qEnd_a | Chromosome_a | tStart_a | tEnd_a |
| DB075386 | PDP1 | 1 | 486 | 8 | 94929175 | 94934596 | ZNRD1-AS1 | 486 | 558 | 6 | 1309359 | 1309431 | |
| BG776390 | PDP1 | 1 | 97 | 8 | 94930432 | 94930528 | APPL1 | 93 | 681 | 3 | 57306893 | 57307480 | |
| Top |
| There's no copy number variation information in COSMIC data for this gene. |
| Top |
|
 |
| Top |
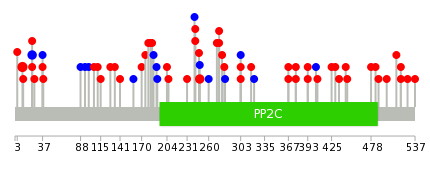
| Stat. for Non-Synonymous SNVs (# total SNVs=50) | (# total SNVs=11) |
 |  |
(# total SNVs=1) | (# total SNVs=1) |
 |  |
| Top |
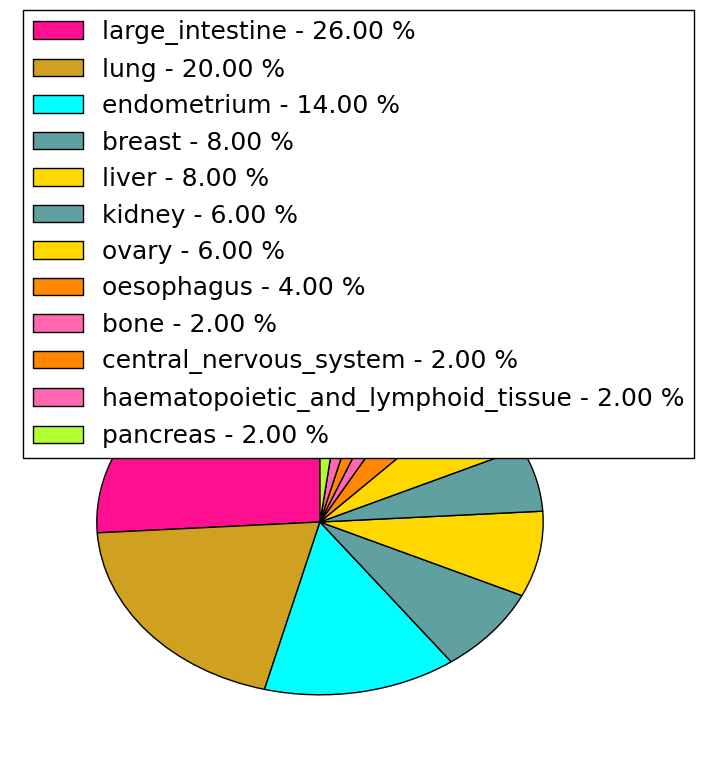
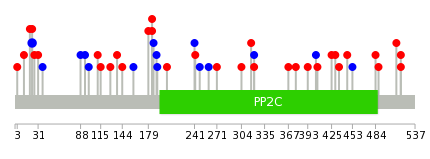
| * When you move the cursor on each content, you can see more deailed mutation information on the Tooltip. Those are primary_site,primary_histology,mutation(aa),pubmedID. |
| GRCh37 position | Mutation(aa) | Unique sampleID count |
| chr8:94934315-94934315 | p.P10S | 3 |
| chr8:94934356-94934356 | p.T23T | 2 |
| chr8:94935030-94935030 | p.S248F | 2 |
| chr8:94934858-94934858 | p.Q191* | 1 |
| chr8:94935465-94935465 | p.P393L | 1 |
| chr8:94934399-94934399 | p.Y38H | 1 |
| chr8:94935067-94935067 | p.L260L | 1 |
| chr8:94935750-94935750 | p.G488D | 1 |
| chr8:94934689-94934689 | p.Q134H | 1 |
| chr8:94935236-94935236 | p.Q317* | 1 |
| Top |
|
 |
| Point Mutation/ Tissue ID | 1 | 2 | 3 | 4 | 5 | 6 | 7 | 8 | 9 | 10 | 11 | 12 | 13 | 14 | 15 | 16 | 17 | 18 | 19 | 20 |
| # sample | 2 | 13 | 1 | 1 | 1 | 3 | 4 | 3 | 1 | 5 | 3 | 1 | 8 | |||||||
| # mutation | 2 | 12 | 1 | 1 | 1 | 3 | 4 | 3 | 1 | 5 | 3 | 1 | 10 | |||||||
| nonsynonymous SNV | 2 | 8 | 1 | 1 | 1 | 1 | 4 | 3 | 1 | 3 | 7 | |||||||||
| synonymous SNV | 4 | 2 | 2 | 3 | 1 | 3 |
| cf) Tissue ID; Tissue type (1; BLCA[Bladder Urothelial Carcinoma], 2; BRCA[Breast invasive carcinoma], 3; CESC[Cervical squamous cell carcinoma and endocervical adenocarcinoma], 4; COAD[Colon adenocarcinoma], 5; GBM[Glioblastoma multiforme], 6; Glioma Low Grade, 7; HNSC[Head and Neck squamous cell carcinoma], 8; KICH[Kidney Chromophobe], 9; KIRC[Kidney renal clear cell carcinoma], 10; KIRP[Kidney renal papillary cell carcinoma], 11; LAML[Acute Myeloid Leukemia], 12; LUAD[Lung adenocarcinoma], 13; LUSC[Lung squamous cell carcinoma], 14; OV[Ovarian serous cystadenocarcinoma ], 15; PAAD[Pancreatic adenocarcinoma], 16; PRAD[Prostate adenocarcinoma], 17; SKCM[Skin Cutaneous Melanoma], 18:STAD[Stomach adenocarcinoma], 19:THCA[Thyroid carcinoma], 20:UCEC[Uterine Corpus Endometrial Carcinoma]) |
| Top |
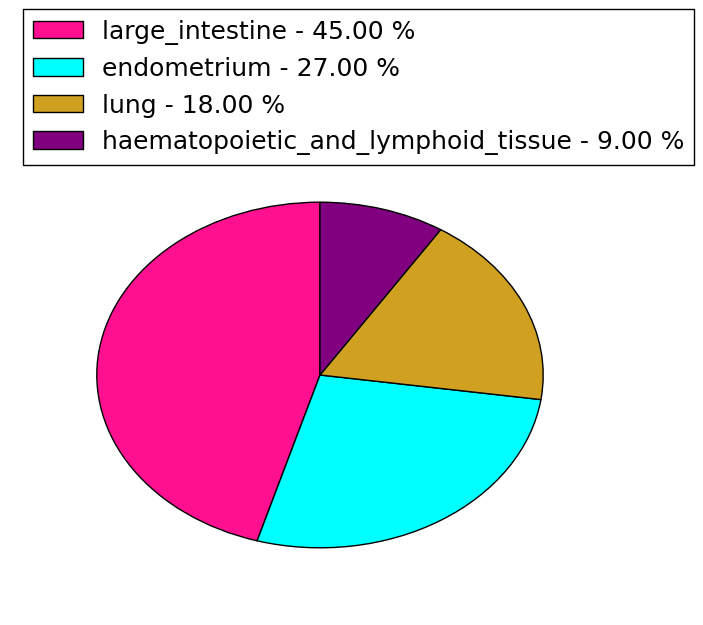
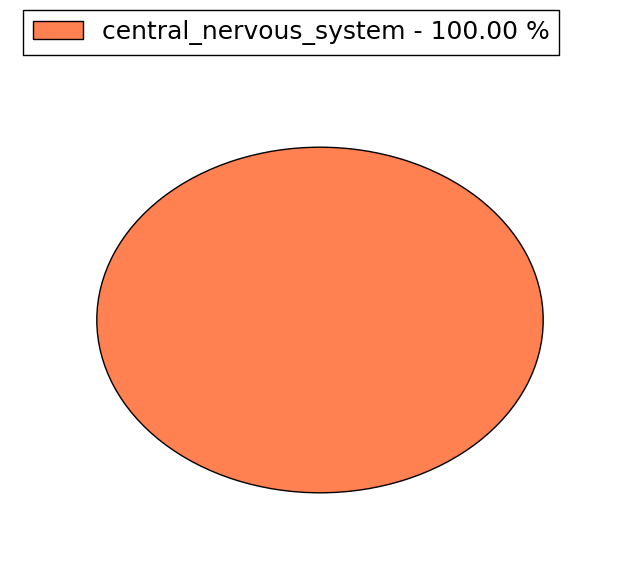
| * We represented just top 10 SNVs. When you move the cursor on each content, you can see more deailed mutation information on the Tooltip. Those are primary_site, primary_histology, mutation(aa), pubmedID. |
| Genomic Position | Mutation(aa) | Unique sampleID count |
| chr8:94934356 | p.T23T,PDP1 | 2 |
| chr8:94935238 | p.S128R,PDP1 | 1 |
| chr8:94934569 | p.S304L,PDP1 | 1 |
| chr8:94935625 | p.R512Q,PDP1 | 1 |
| chr8:94934845 | p.G137W,PDP1 | 1 |
| chr8:94935248 | p.Q317H,PDP1 | 1 |
| chr8:94934584 | p.I518V,PDP1 | 1 |
| chr8:94935646 | p.D144H,PDP1 | 1 |
| chr8:94934857 | p.E321K,PDP1 | 1 |
| chr8:94934247 | p.I518S,PDP1 | 1 |
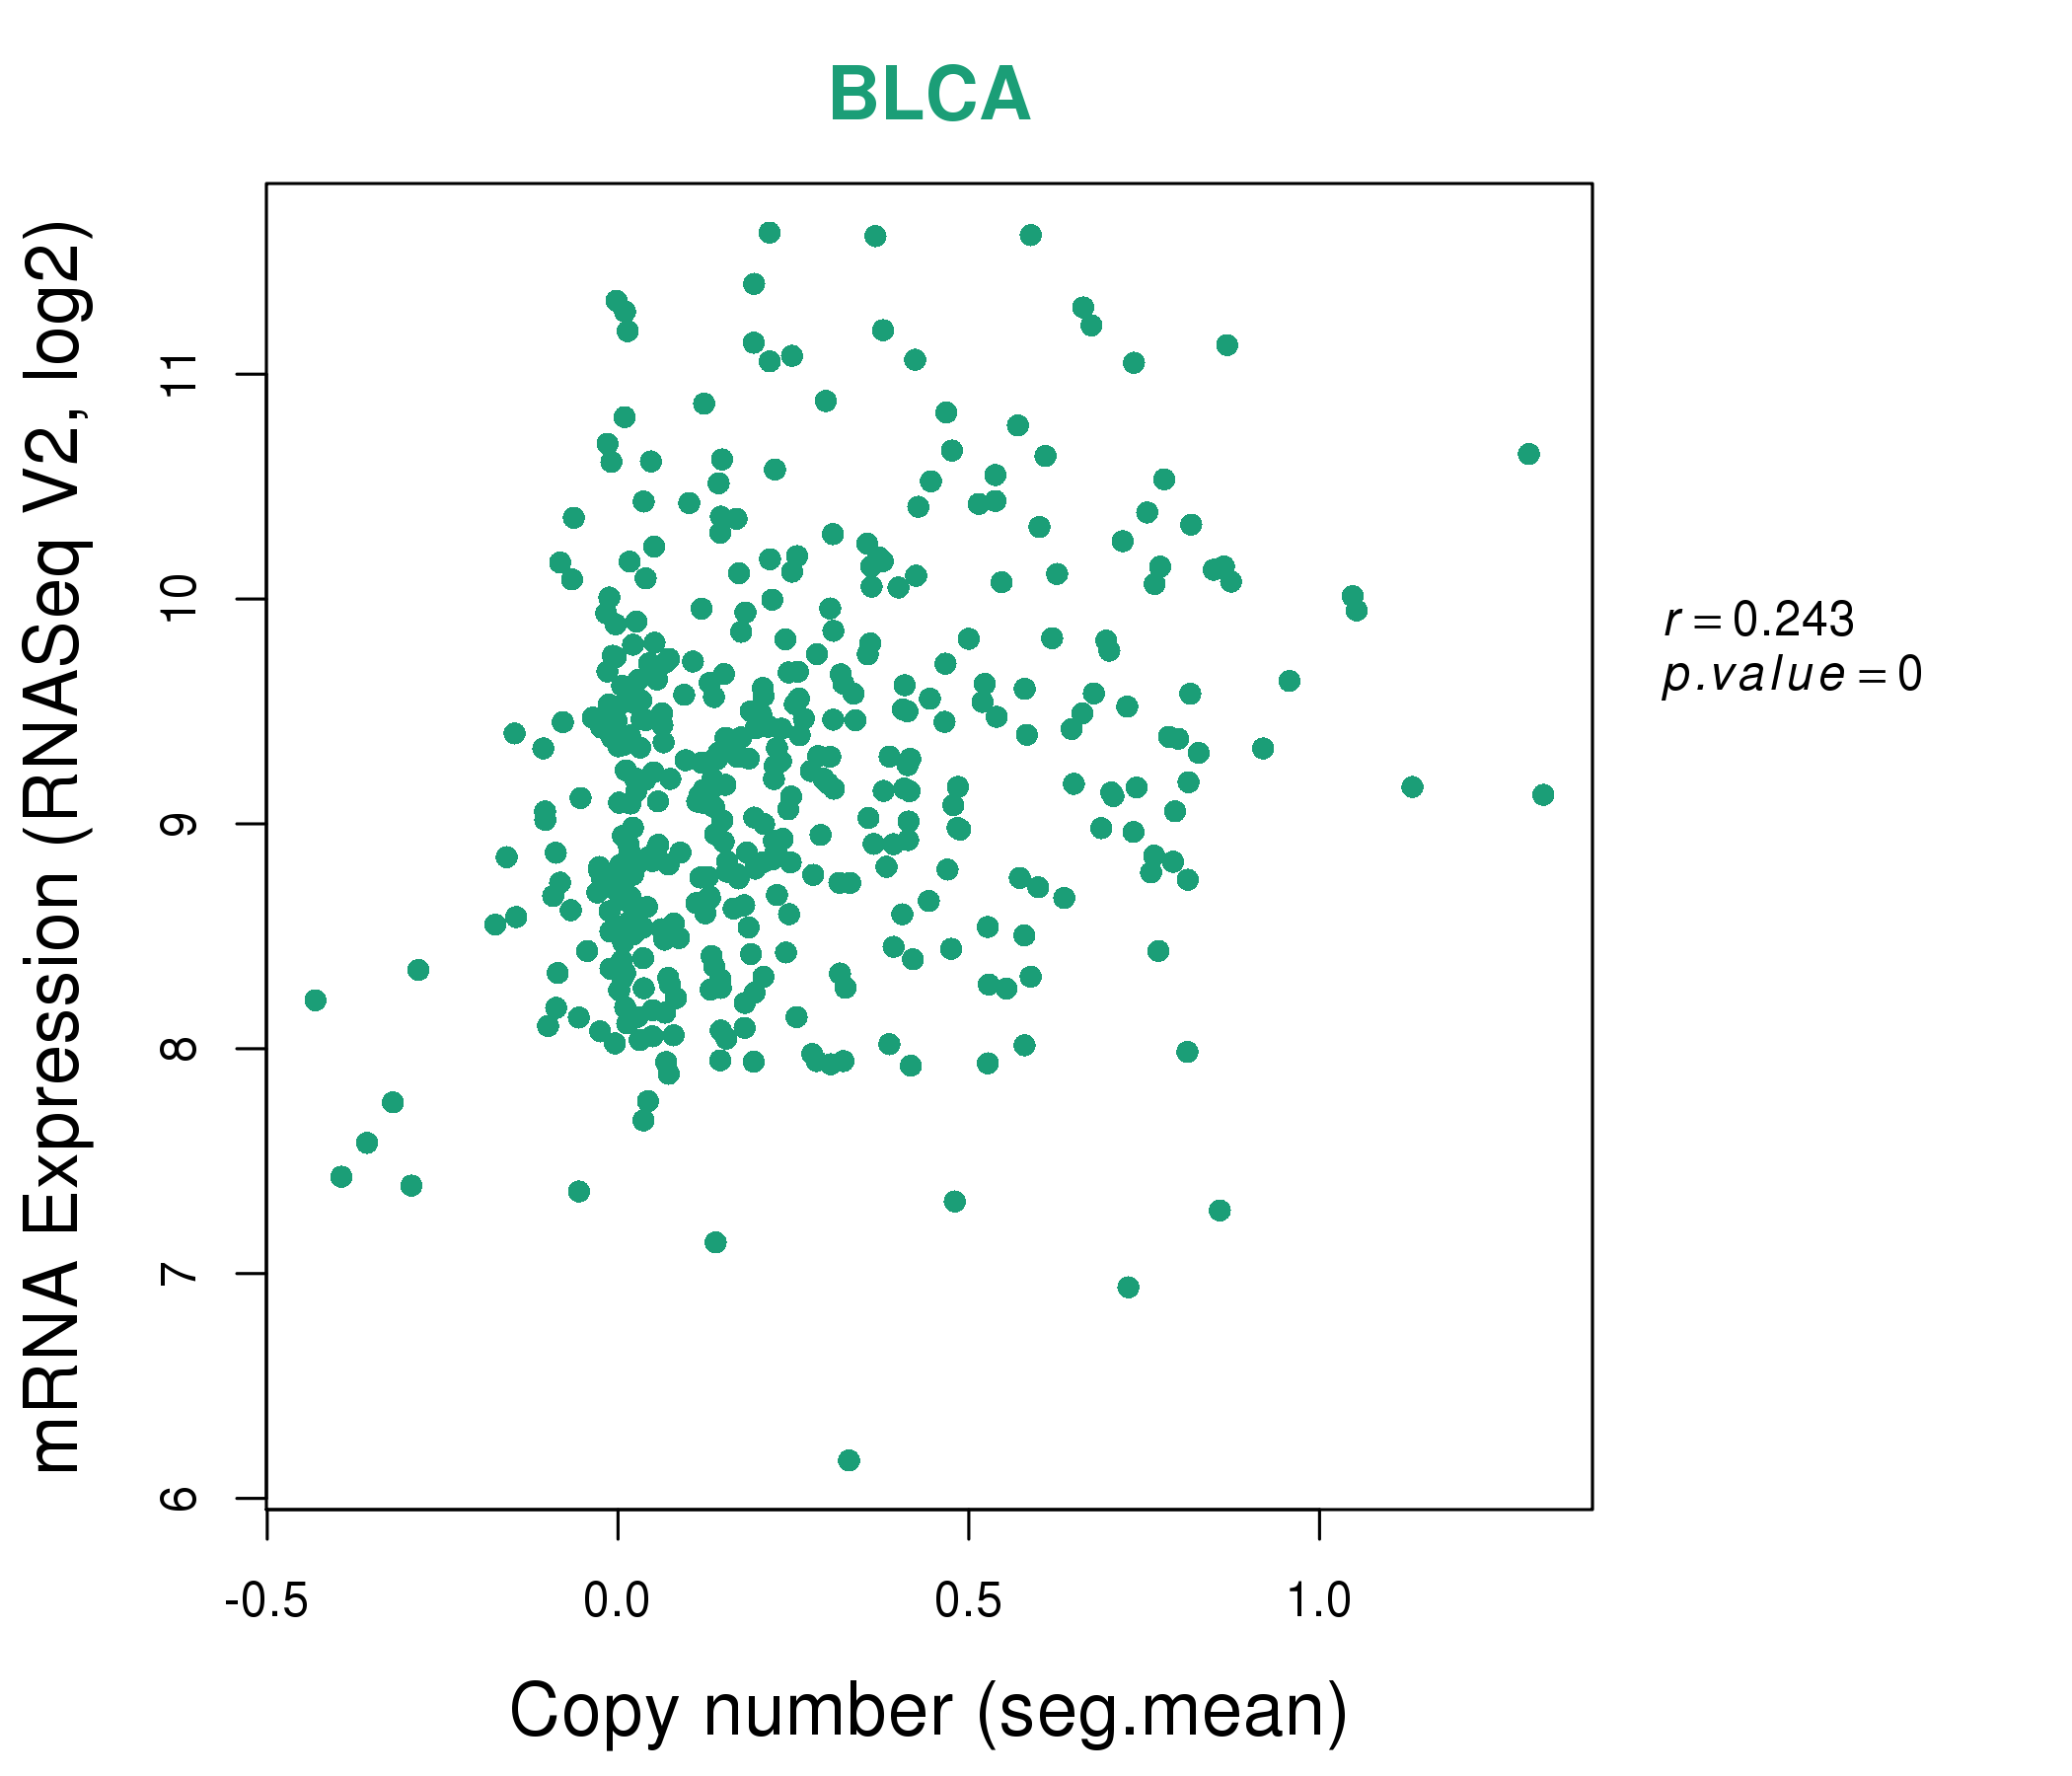
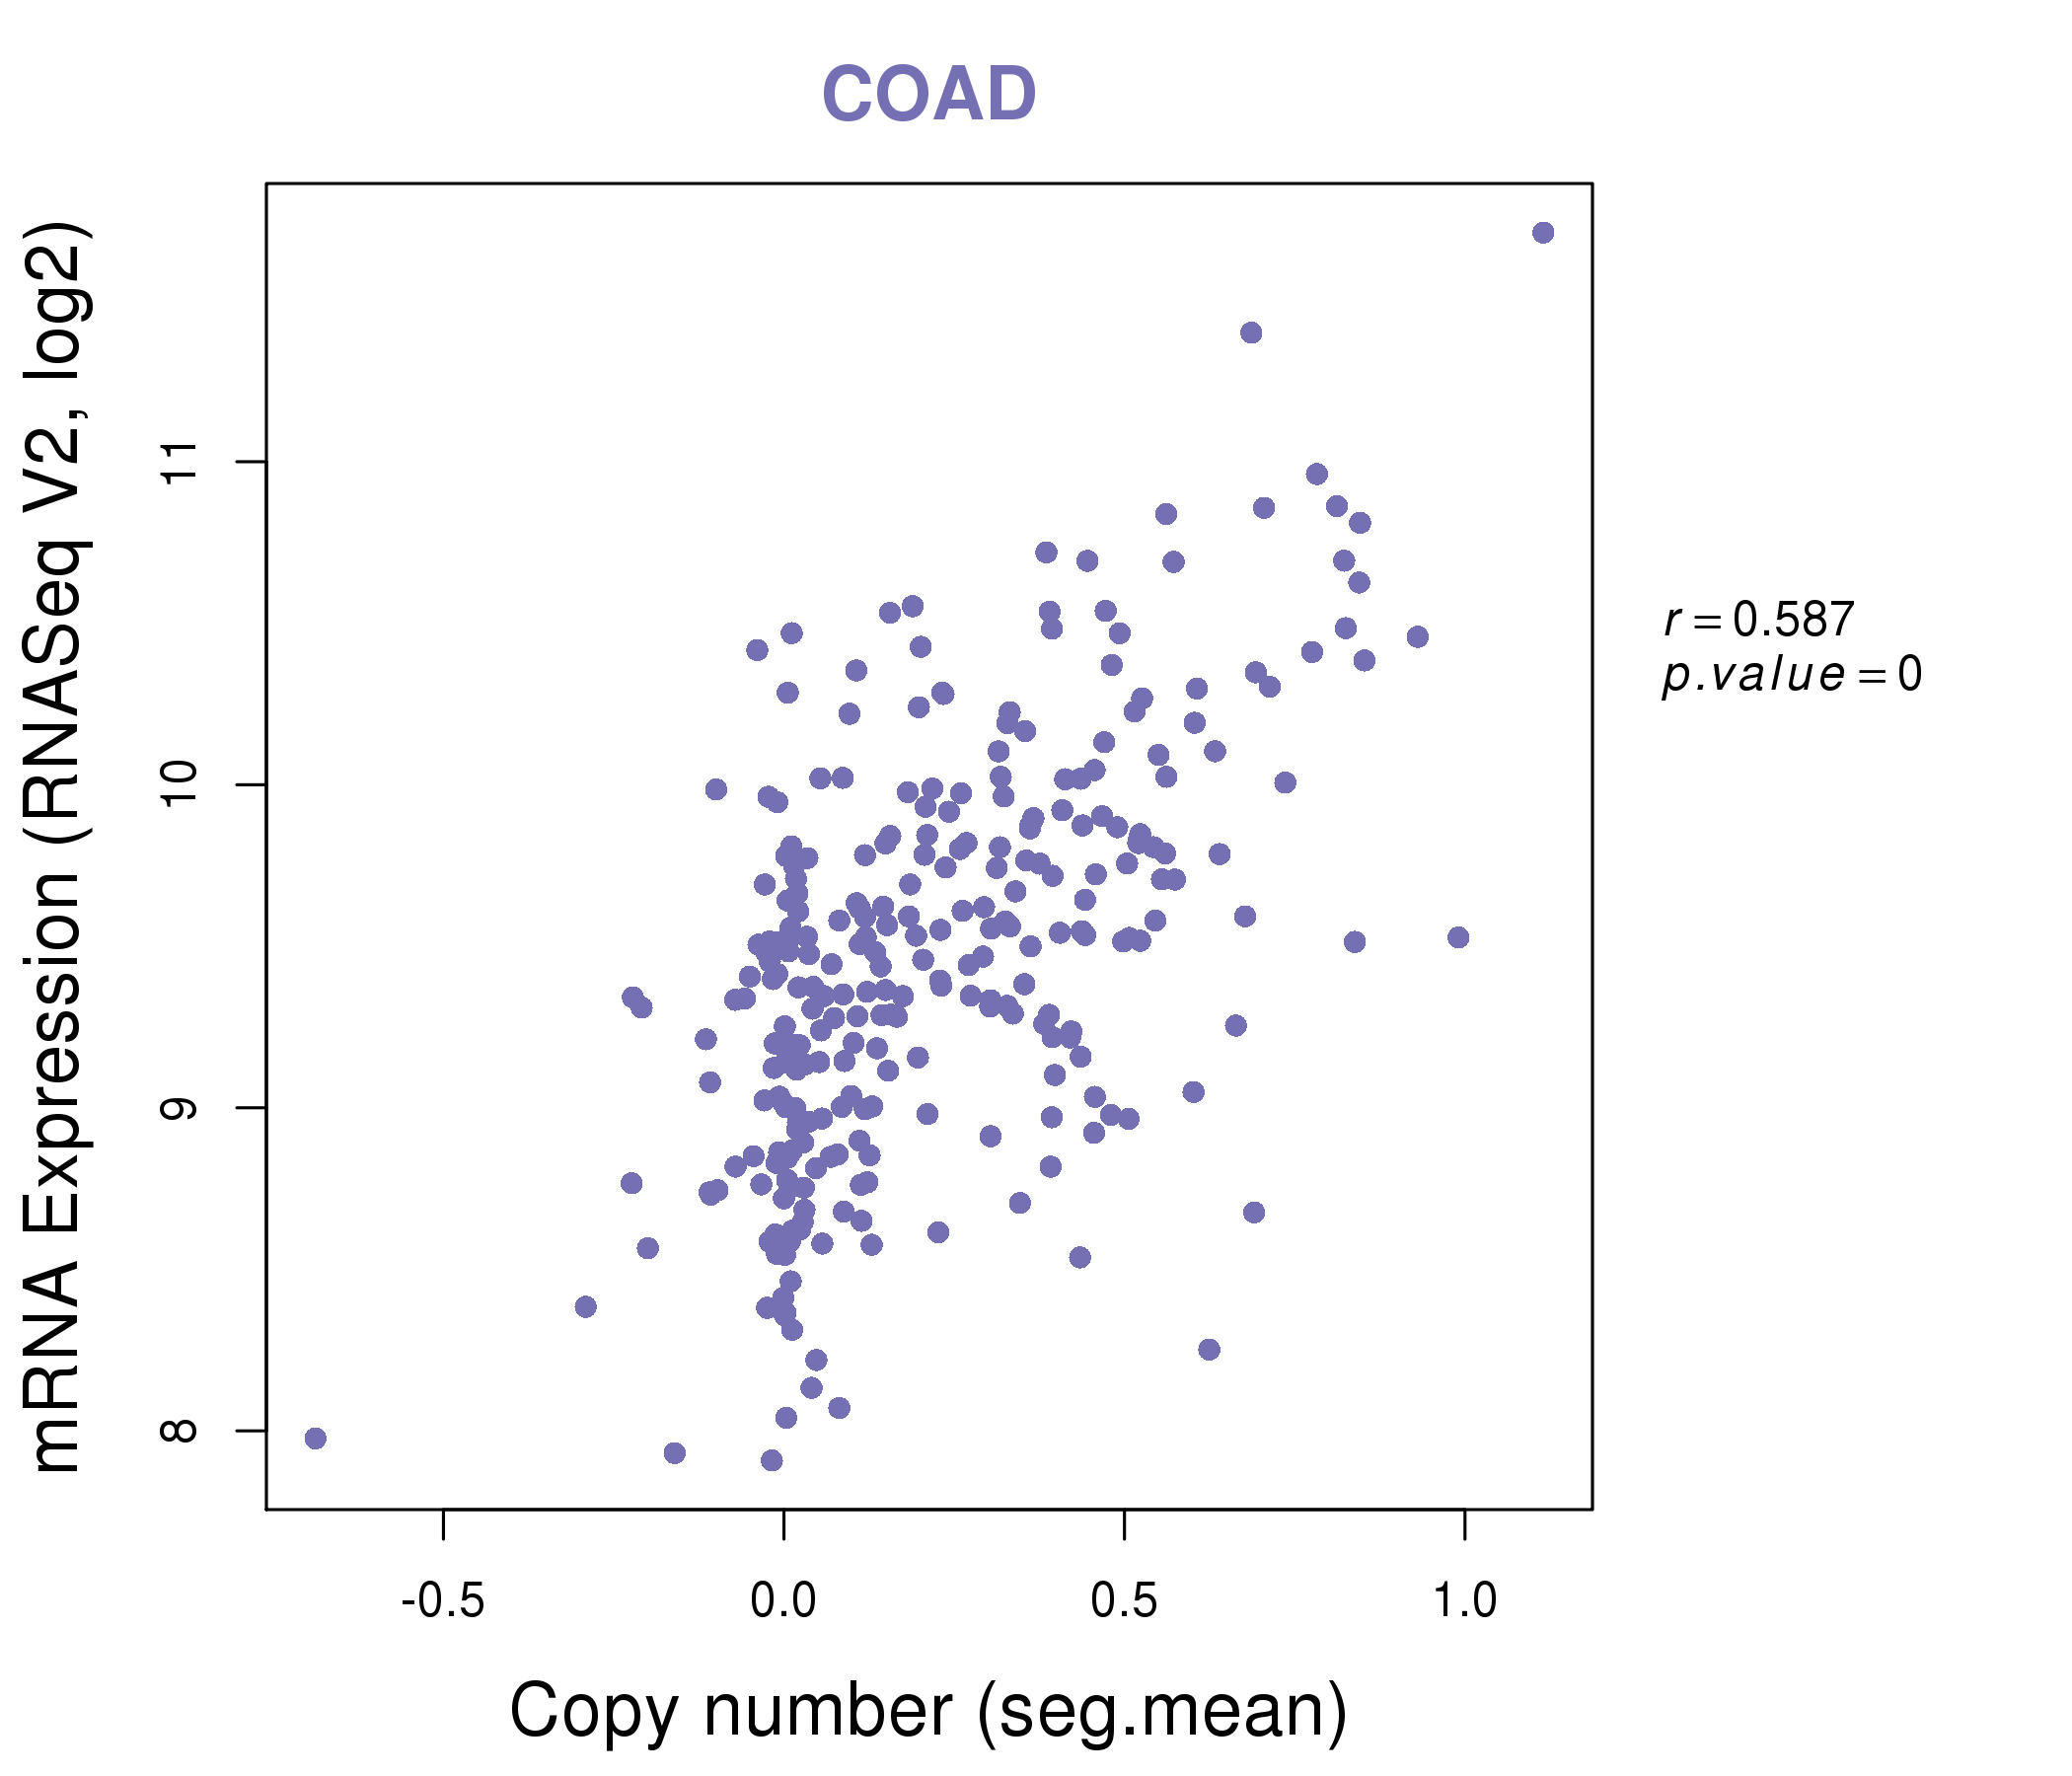
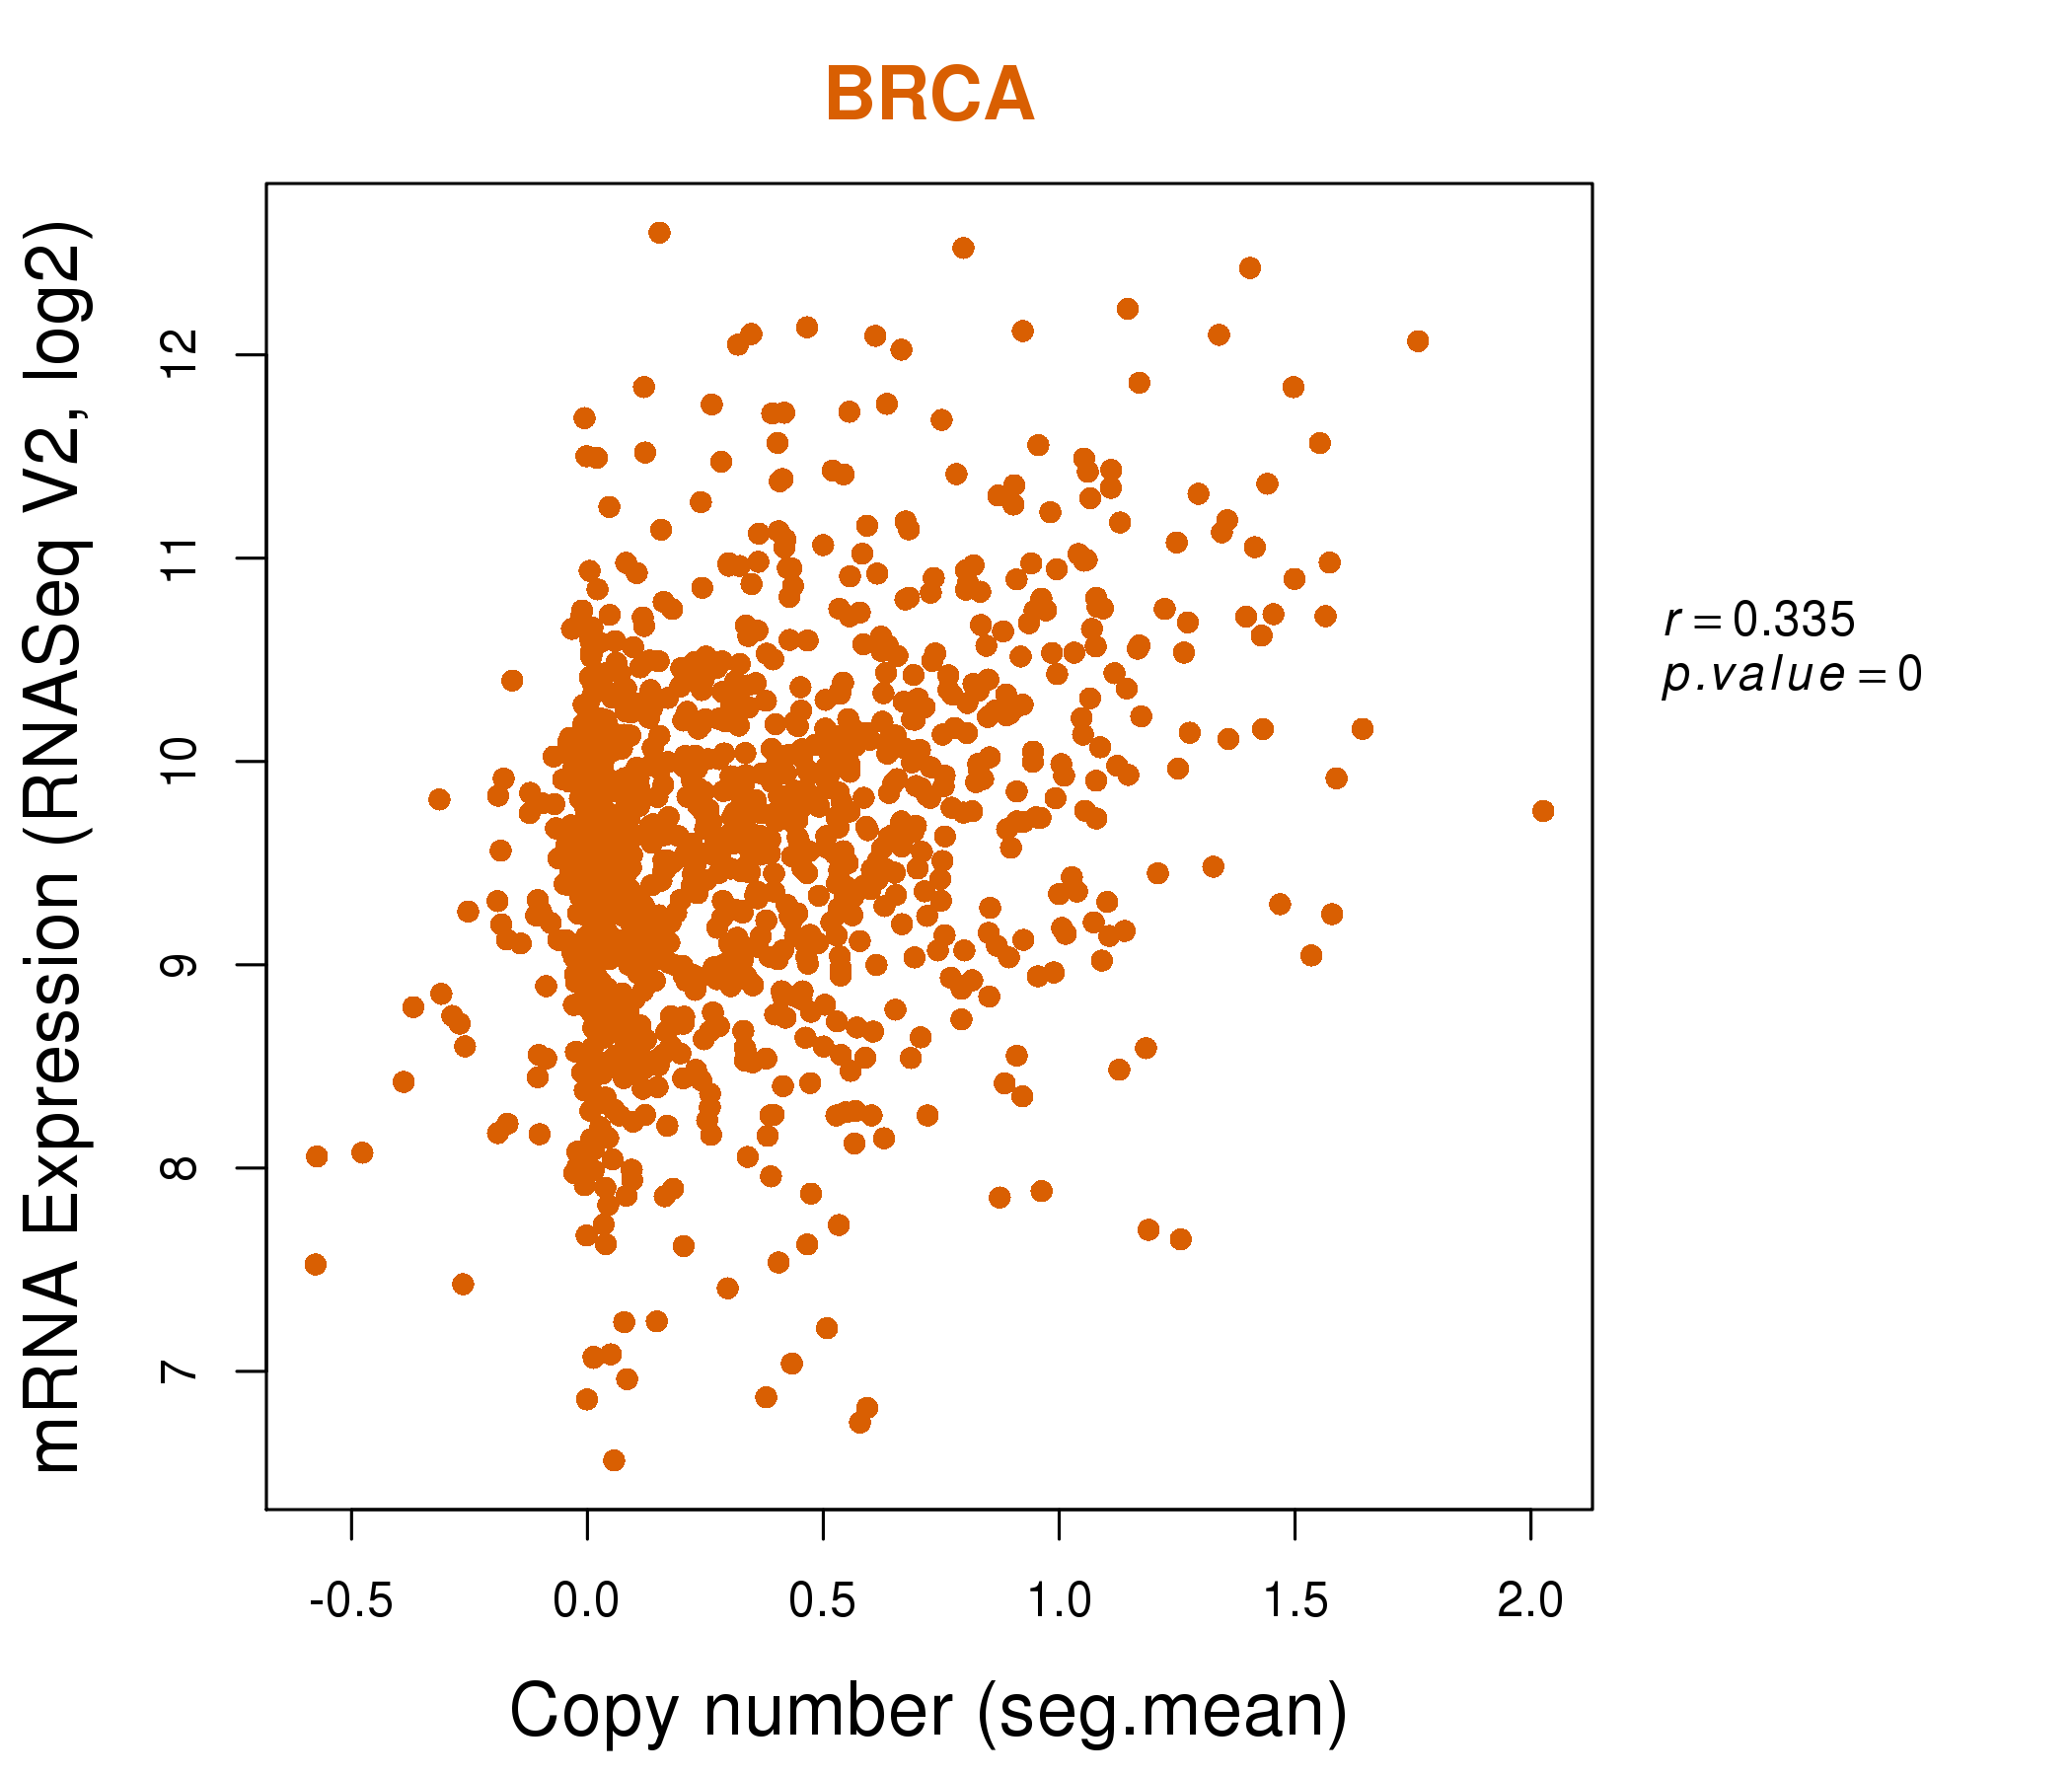
| * Copy number data were extracted from TCGA using R package TCGA-Assembler. The URLs of all public data files on TCGA DCC data server were gathered on Jan-05-2015. Function ProcessCNAData in TCGA-Assembler package was used to obtain gene-level copy number value which is calculated as the average copy number of the genomic region of a gene. |
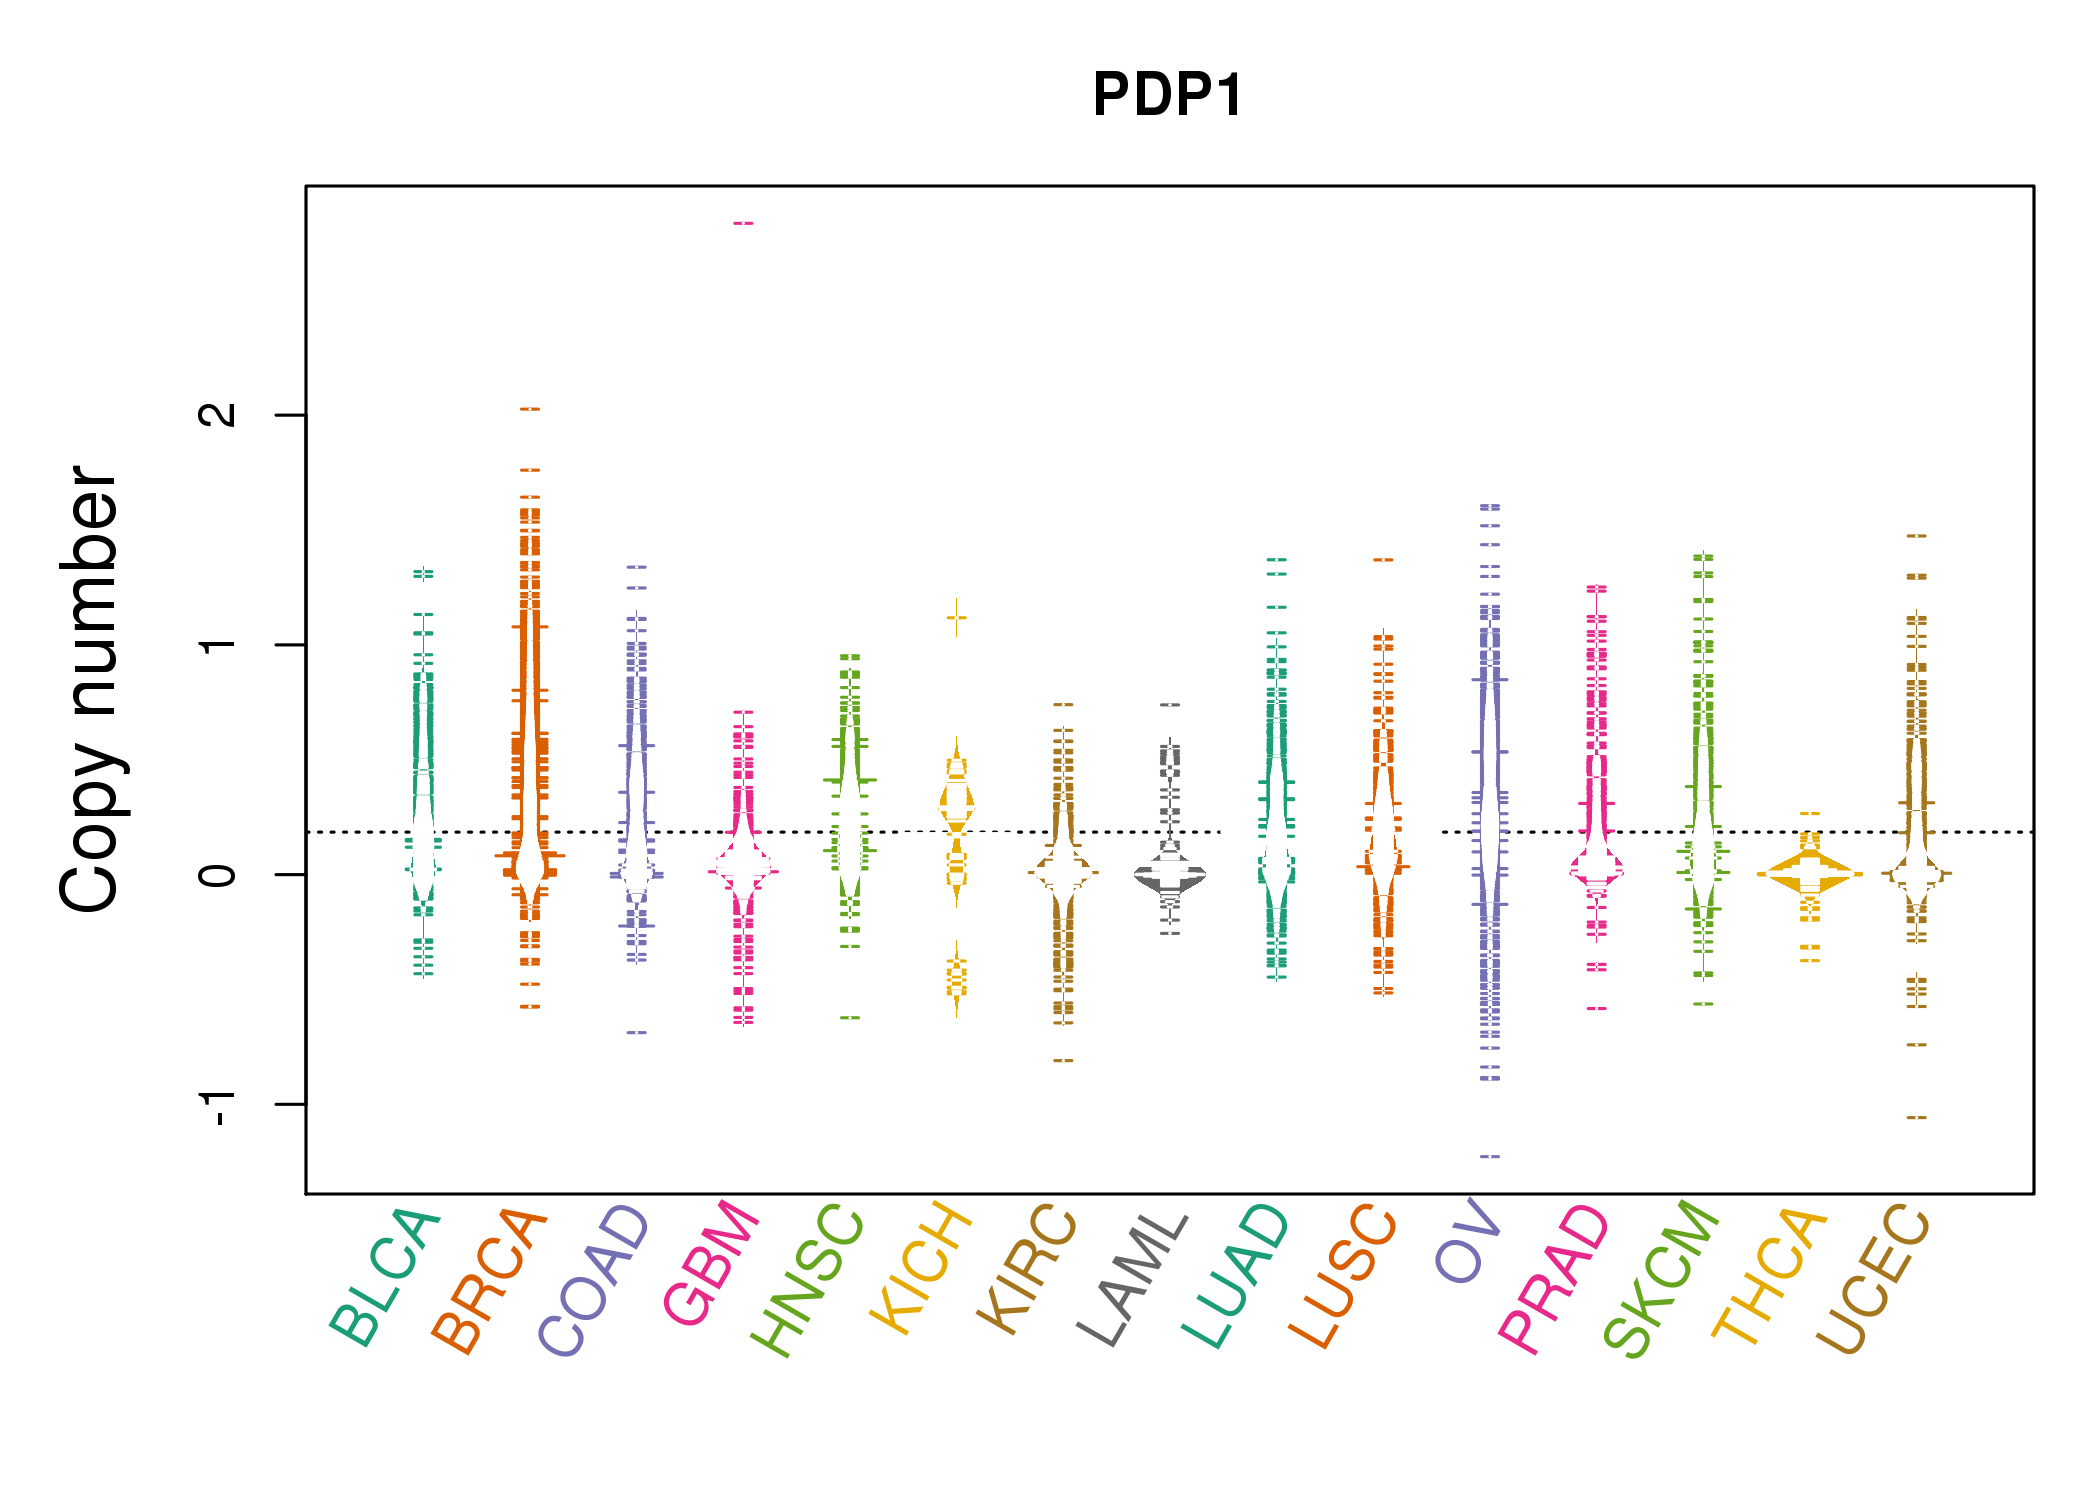 |
| cf) Tissue ID[Tissue type]: BLCA[Bladder Urothelial Carcinoma], BRCA[Breast invasive carcinoma], CESC[Cervical squamous cell carcinoma and endocervical adenocarcinoma], COAD[Colon adenocarcinoma], GBM[Glioblastoma multiforme], Glioma Low Grade, HNSC[Head and Neck squamous cell carcinoma], KICH[Kidney Chromophobe], KIRC[Kidney renal clear cell carcinoma], KIRP[Kidney renal papillary cell carcinoma], LAML[Acute Myeloid Leukemia], LUAD[Lung adenocarcinoma], LUSC[Lung squamous cell carcinoma], OV[Ovarian serous cystadenocarcinoma ], PAAD[Pancreatic adenocarcinoma], PRAD[Prostate adenocarcinoma], SKCM[Skin Cutaneous Melanoma], STAD[Stomach adenocarcinoma], THCA[Thyroid carcinoma], UCEC[Uterine Corpus Endometrial Carcinoma] |
| Top |
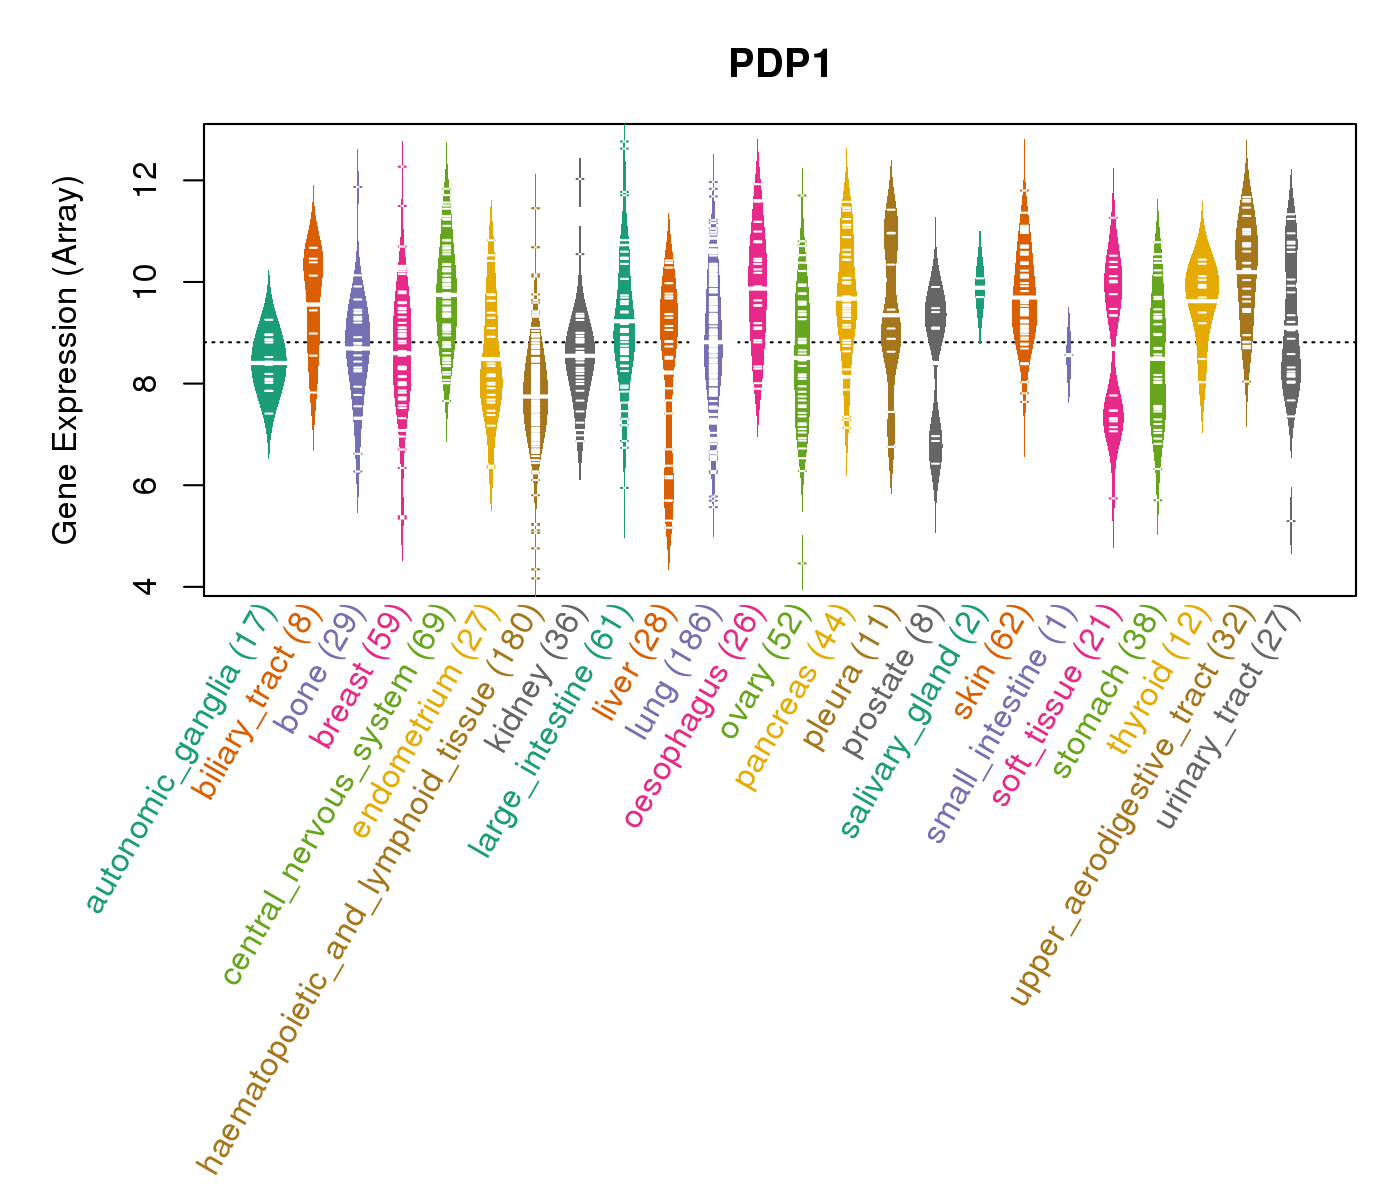
| Gene Expression for PDP1 |
| * CCLE gene expression data were extracted from CCLE_Expression_Entrez_2012-10-18.res: Gene-centric RMA-normalized mRNA expression data. |
 |
| * Normalized gene expression data of RNASeqV2 was extracted from TCGA using R package TCGA-Assembler. The URLs of all public data files on TCGA DCC data server were gathered at Jan-05-2015. Only eight cancer types have enough normal control samples for differential expression analysis. (t test, adjusted p<0.05 (using Benjamini-Hochberg FDR)) |
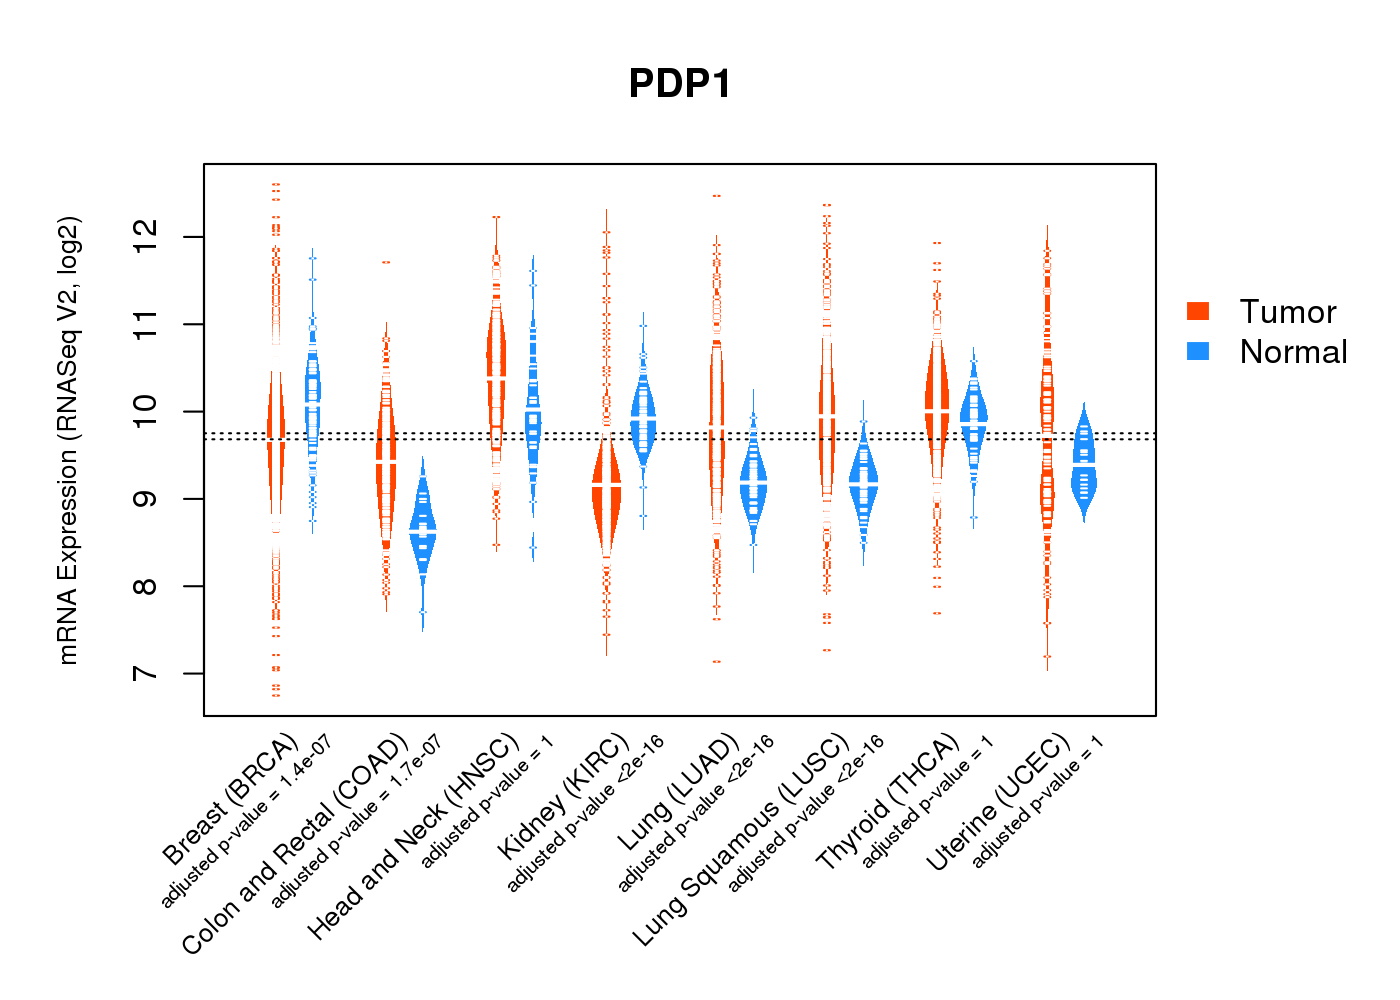 |
| Top |
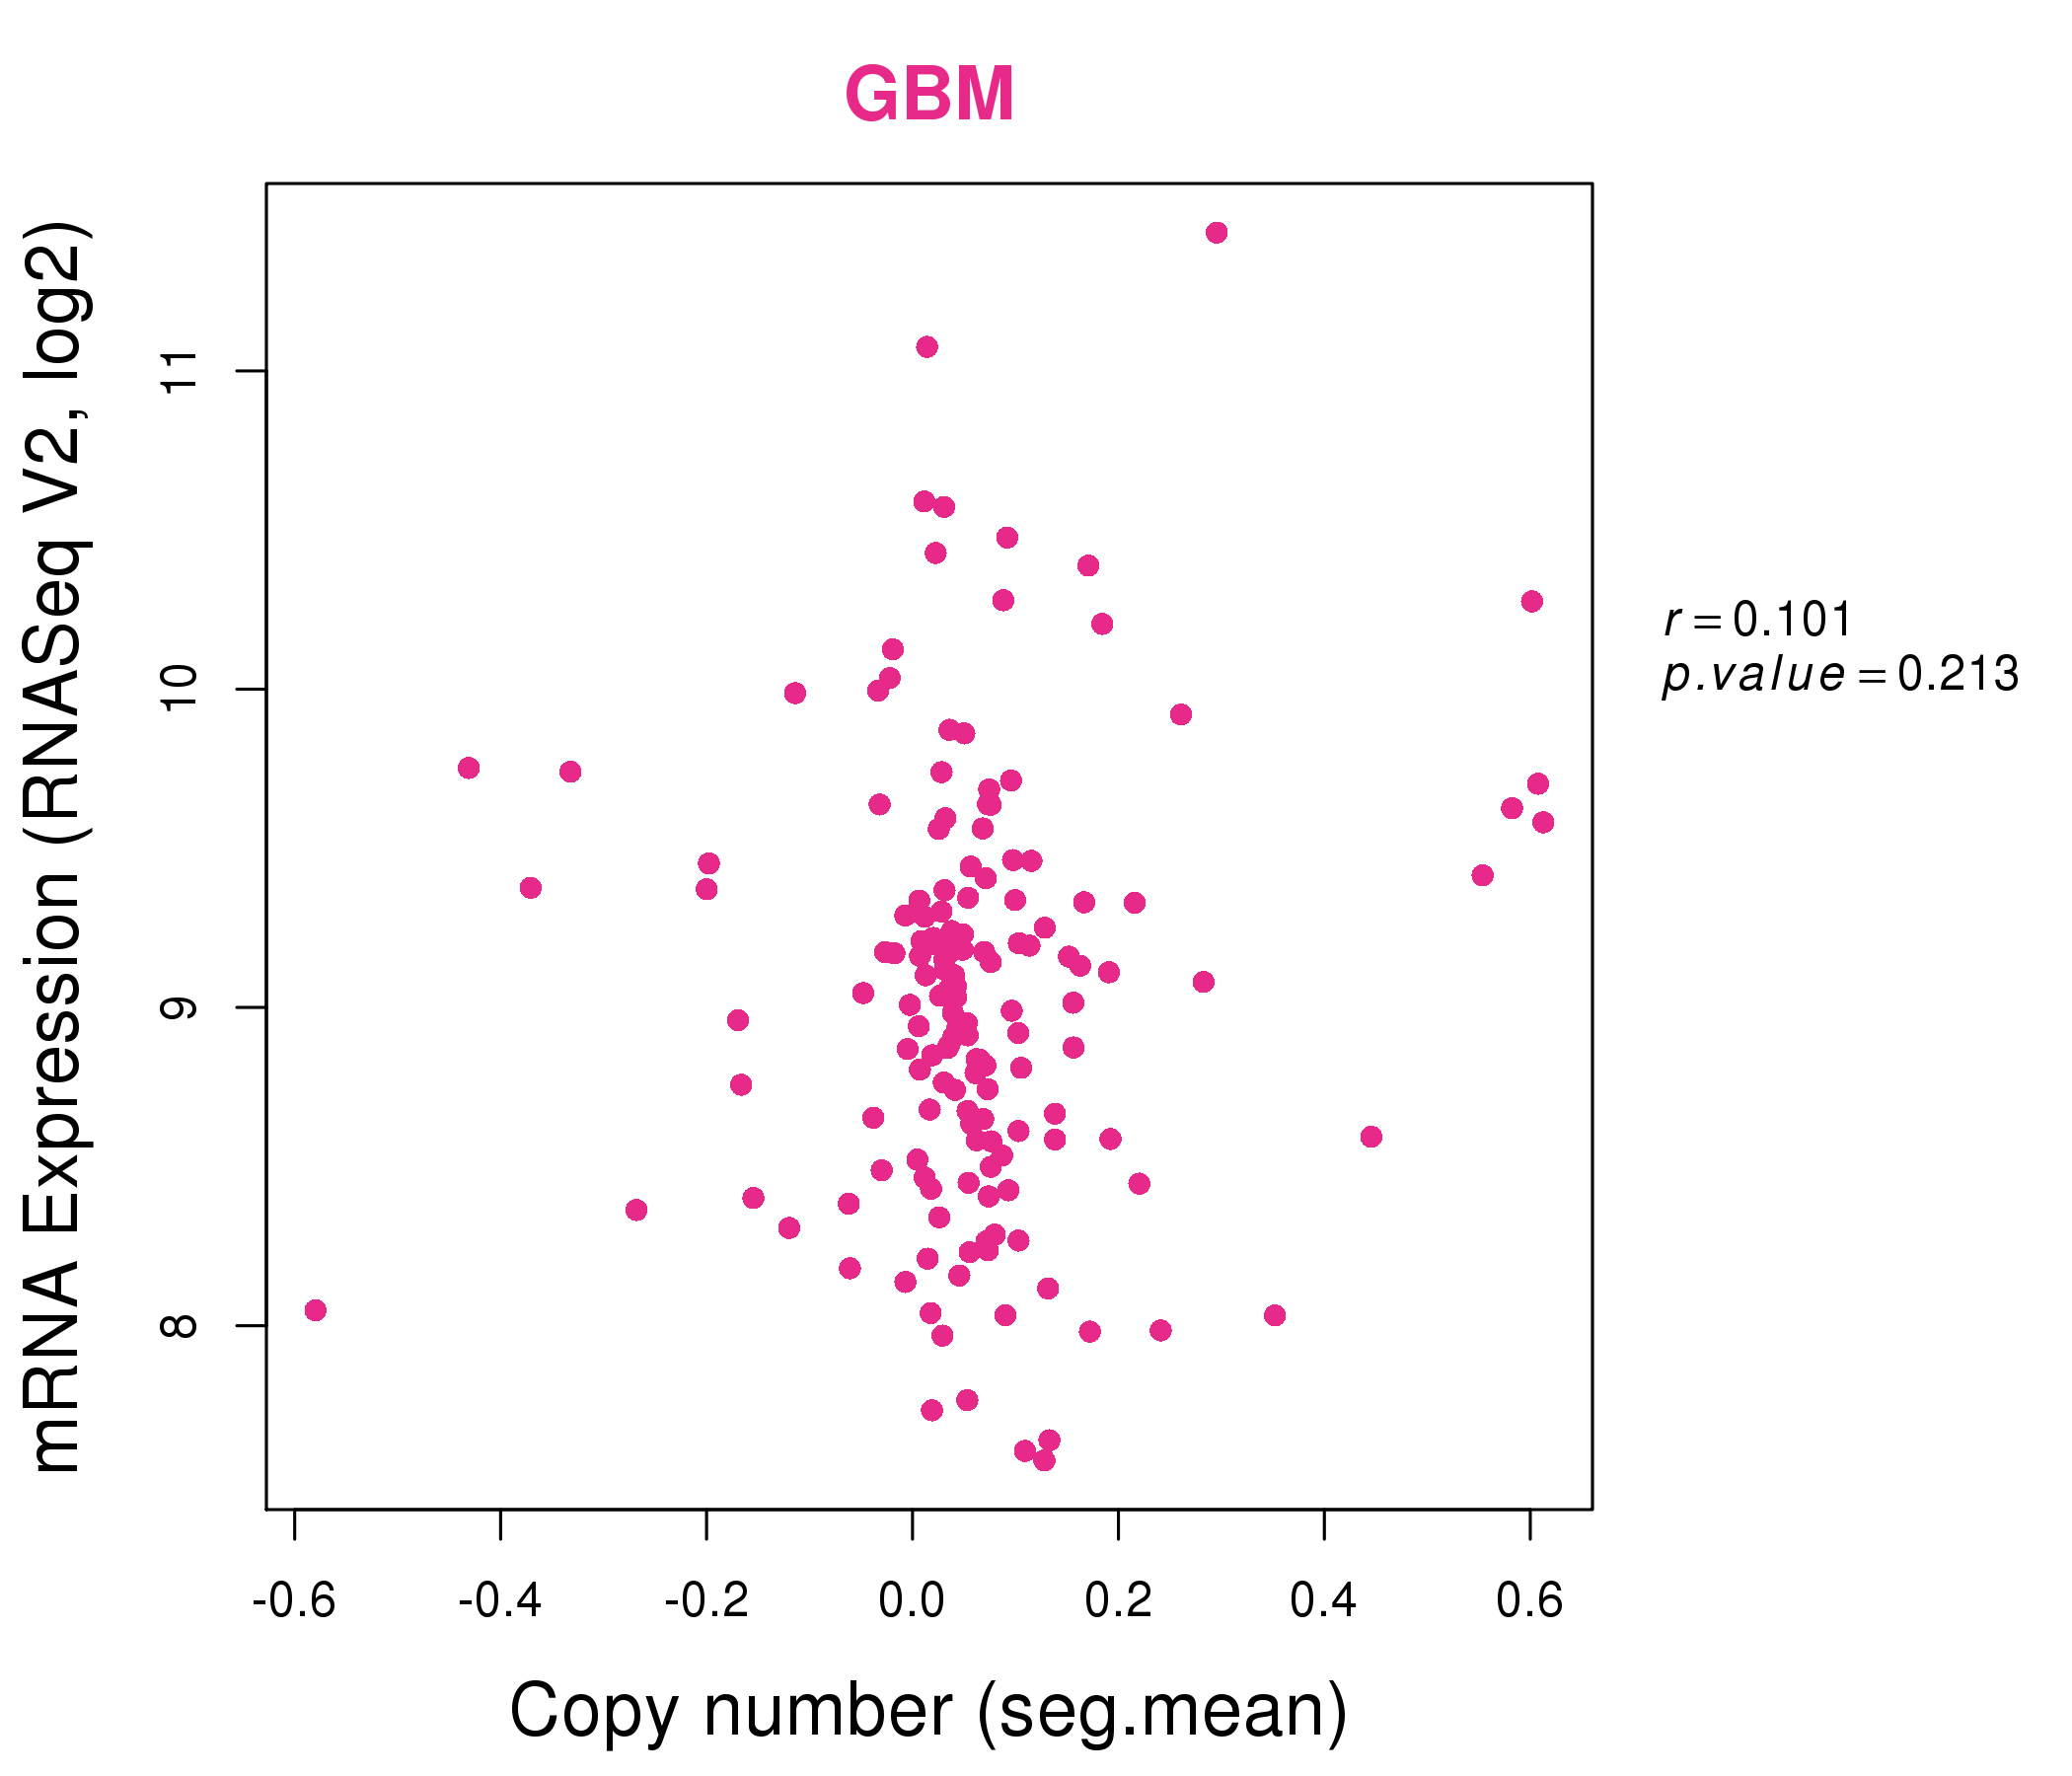
| * This plots show the correlation between CNV and gene expression. |
: Open all plots for all cancer types
 |
|
 |
|
| Top |
| Gene-Gene Network Information |
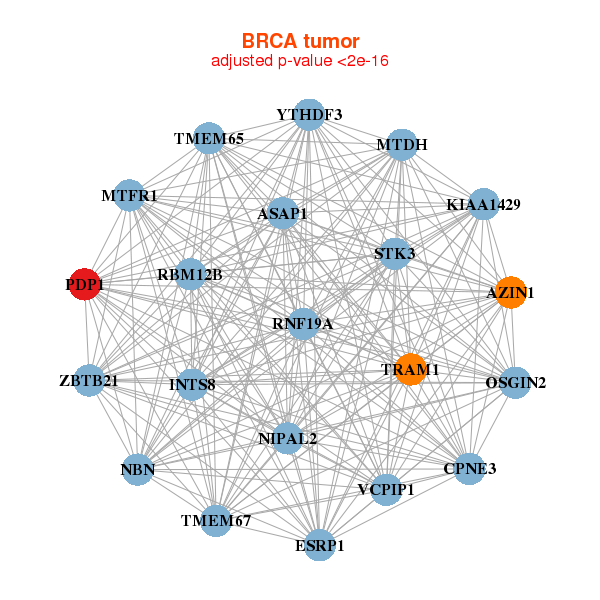
| * Co-Expression network figures were drawn using R package igraph. Only the top 20 genes with the highest correlations were shown. Red circle: input gene, orange circle: cell metabolism gene, sky circle: other gene |
: Open all plots for all cancer types
 |
| ||||
| ASAP1,AZIN1,CPNE3,ESRP1,INTS8,KIAA1429,MTDH, MTFR1,NBN,NIPAL2,OSGIN2,PDP1,RBM12B,RNF19A, STK3,TMEM65,TMEM67,TRAM1,VCPIP1,YTHDF3,ZBTB21 | C18orf25,C5orf22,CUL3,G3BP2,HSF2,MARCH7,MIOS, MLF1,MOB4,MOSPD1,MTM1,NEDD1,NPHP1,PDP1, PGM2L1,PPP1CB,PPP1R2,PTP4A1,RRP15,SLMAP,VEZF1 | ||||
 |
| ||||
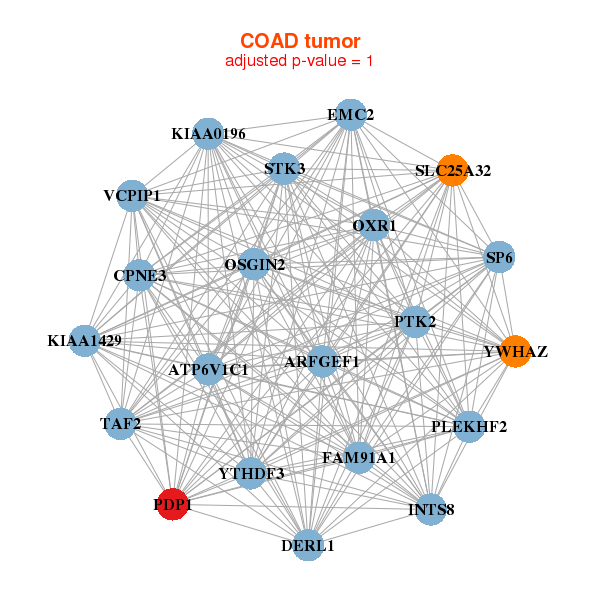
| ARFGEF1,ATP6V1C1,CPNE3,DERL1,FAM91A1,INTS8,KIAA0196, KIAA1429,OSGIN2,OXR1,PDP1,PLEKHF2,PTK2,SLC25A32, SP6,STK3,TAF2,EMC2,VCPIP1,YTHDF3,YWHAZ | ARSJ,B3GNT7,PRAC2,FAM71D,FOXA2,GLDN,HOXB13, KAZ,KCTD12,KIF13A,NOV,PDP1,PROS1,PTAR1, RARRES2,RBM24,RTN4R,SFTPA2,SPINK5,SPON1,ST6GALNAC6 |
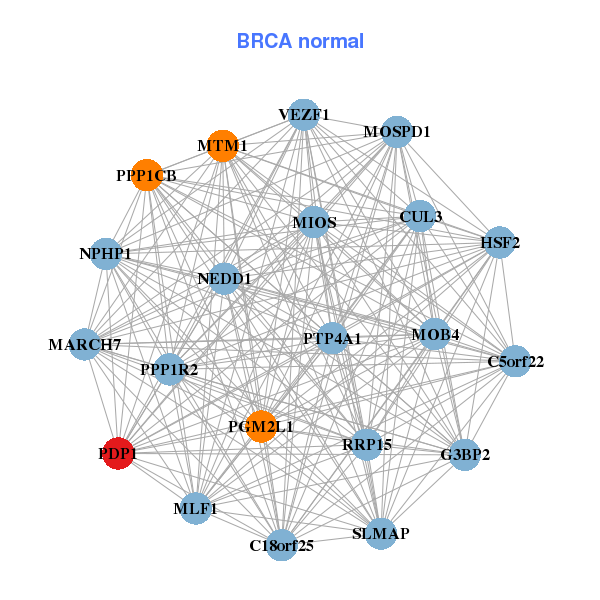

| * Co-Expression network figures were drawn using R package igraph. Only the top 20 genes with the highest correlations were shown. Red circle: input gene, orange circle: cell metabolism gene, sky circle: other gene |
: Open all plots for all cancer types
| Top |
: Open all interacting genes' information including KEGG pathway for all interacting genes from DAVID
| Top |
| Pharmacological Information for PDP1 |
| DB Category | DB Name | DB's ID and Url link |
| * Gene Centered Interaction Network. |
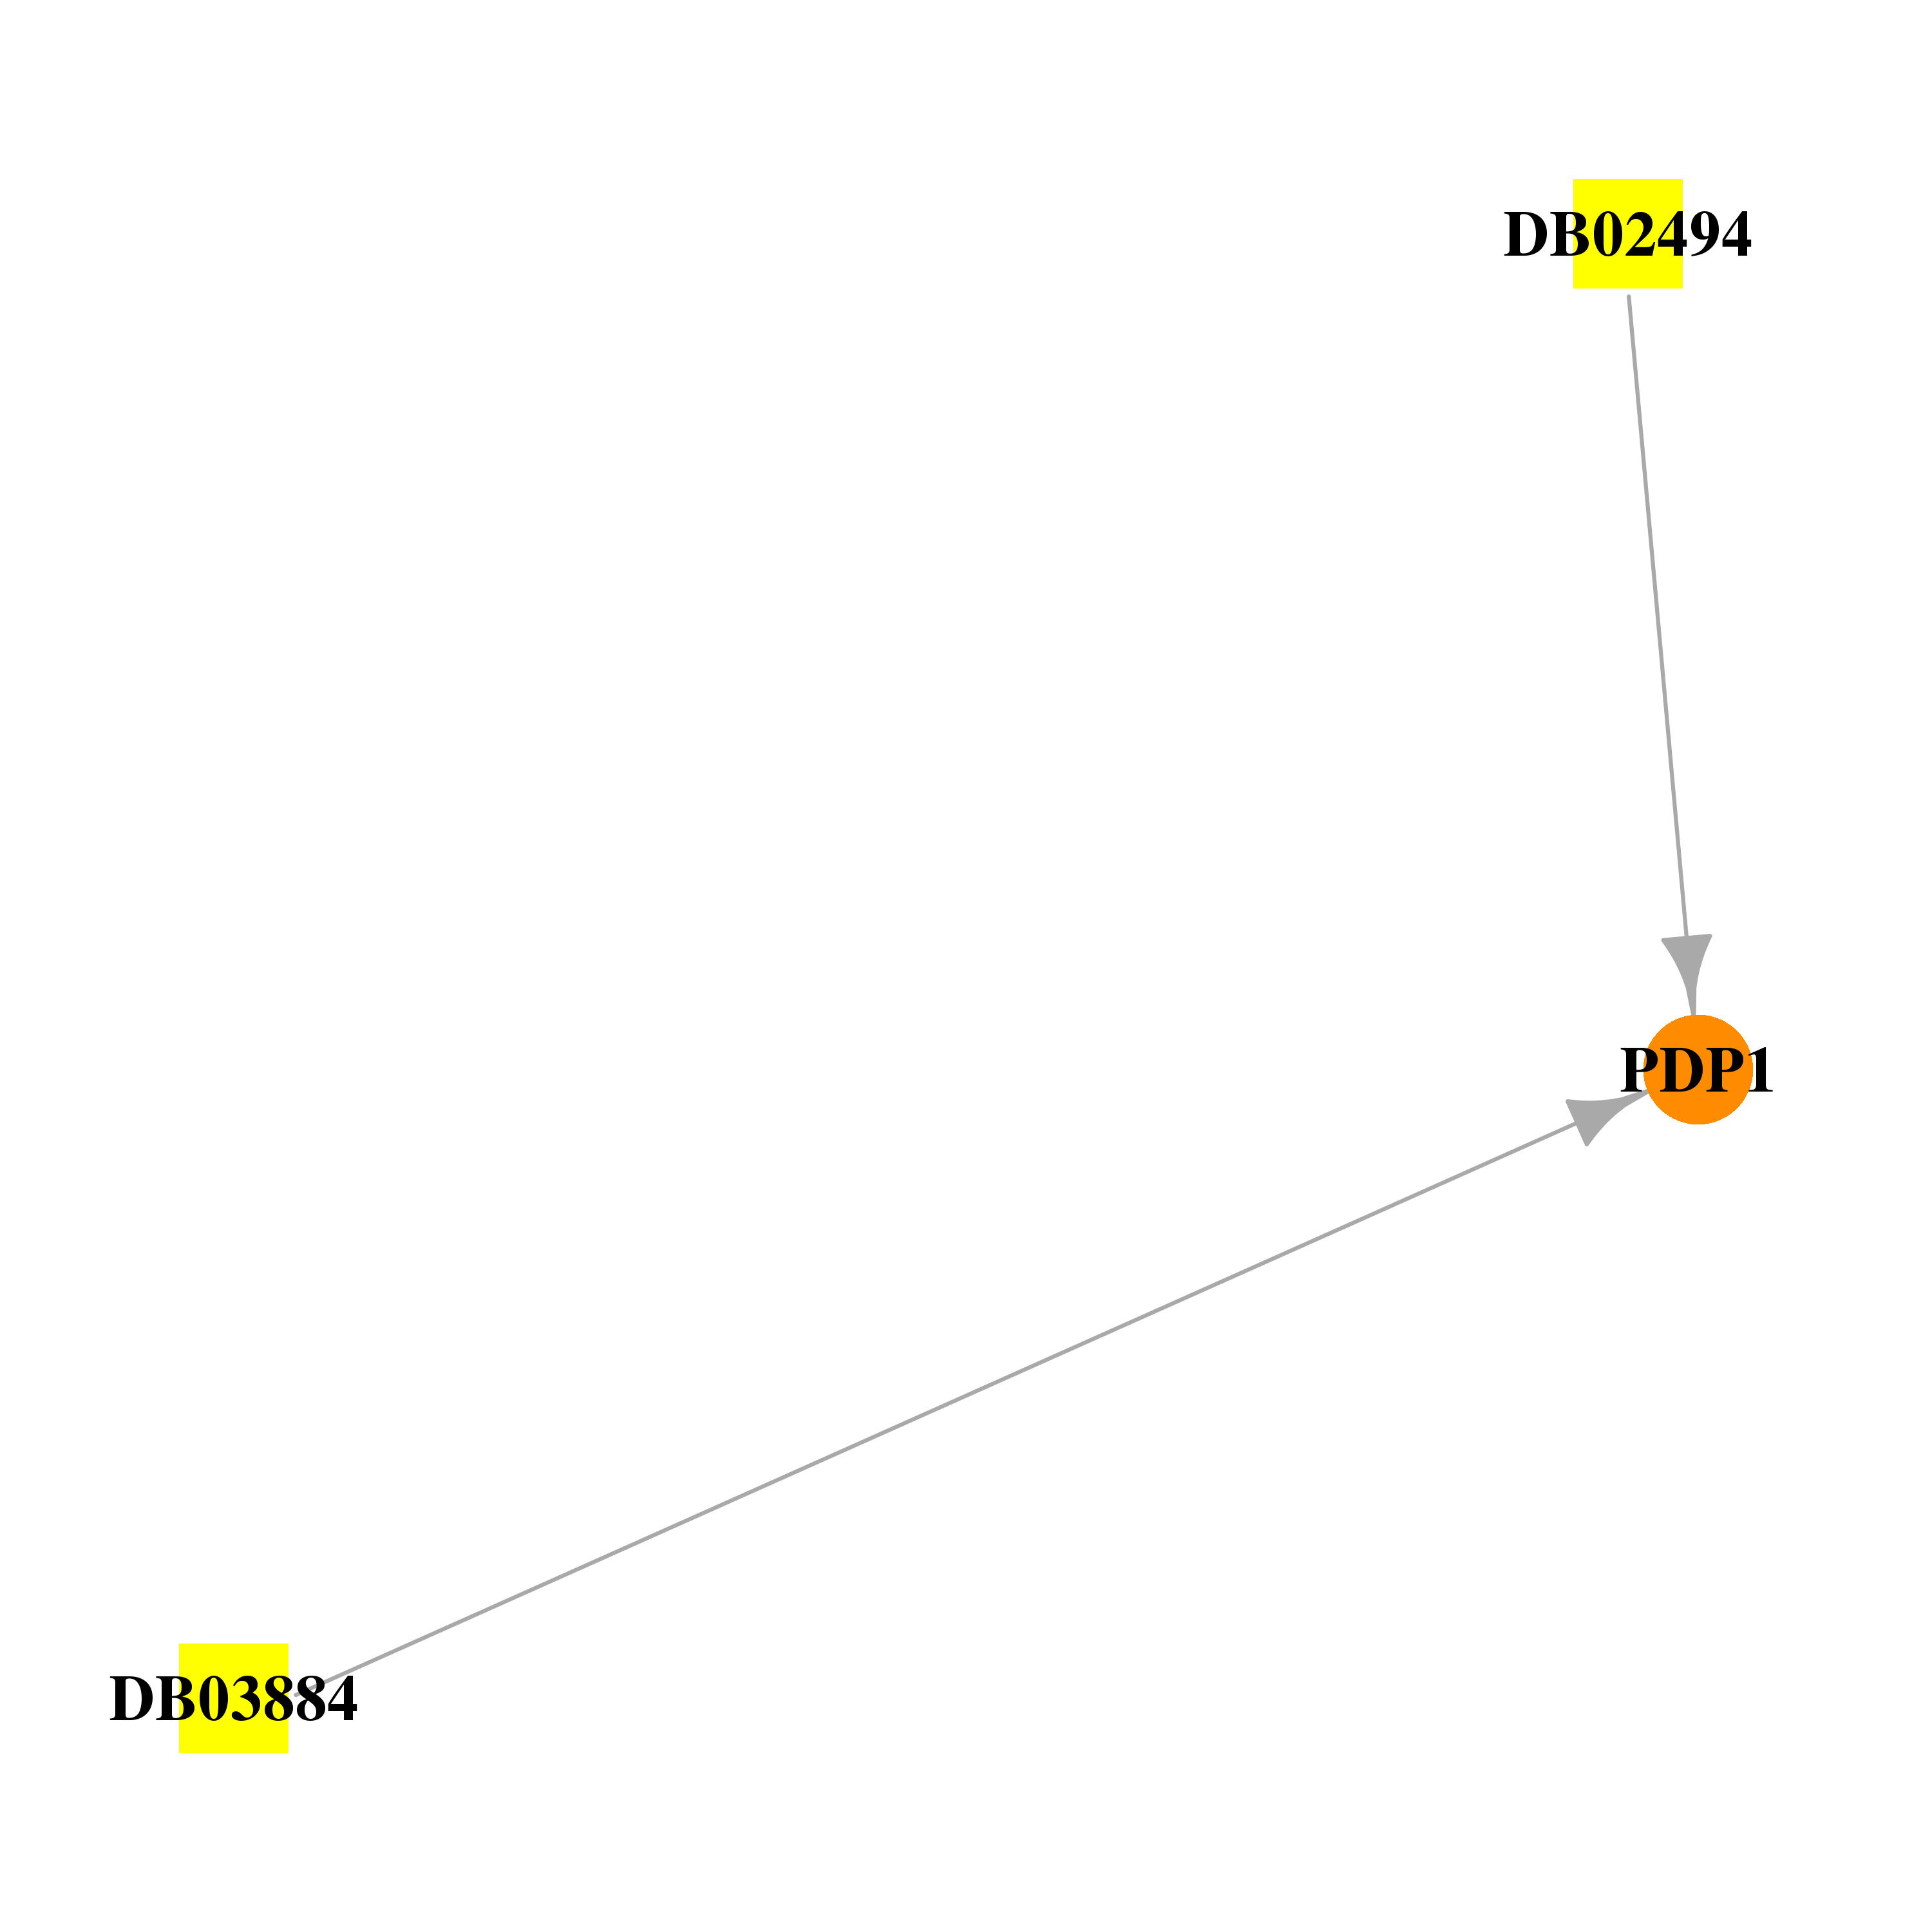 |
| * Drug Centered Interaction Network. |
| DrugBank ID | Target Name | Drug Groups | Generic Name | Drug Centered Network | Drug Structure |
| DB02494 | pyruvate dehyrogenase phosphatase catalytic subunit 1 | experimental | Alpha-Hydroxy-Beta-Phenyl-Propionic Acid | 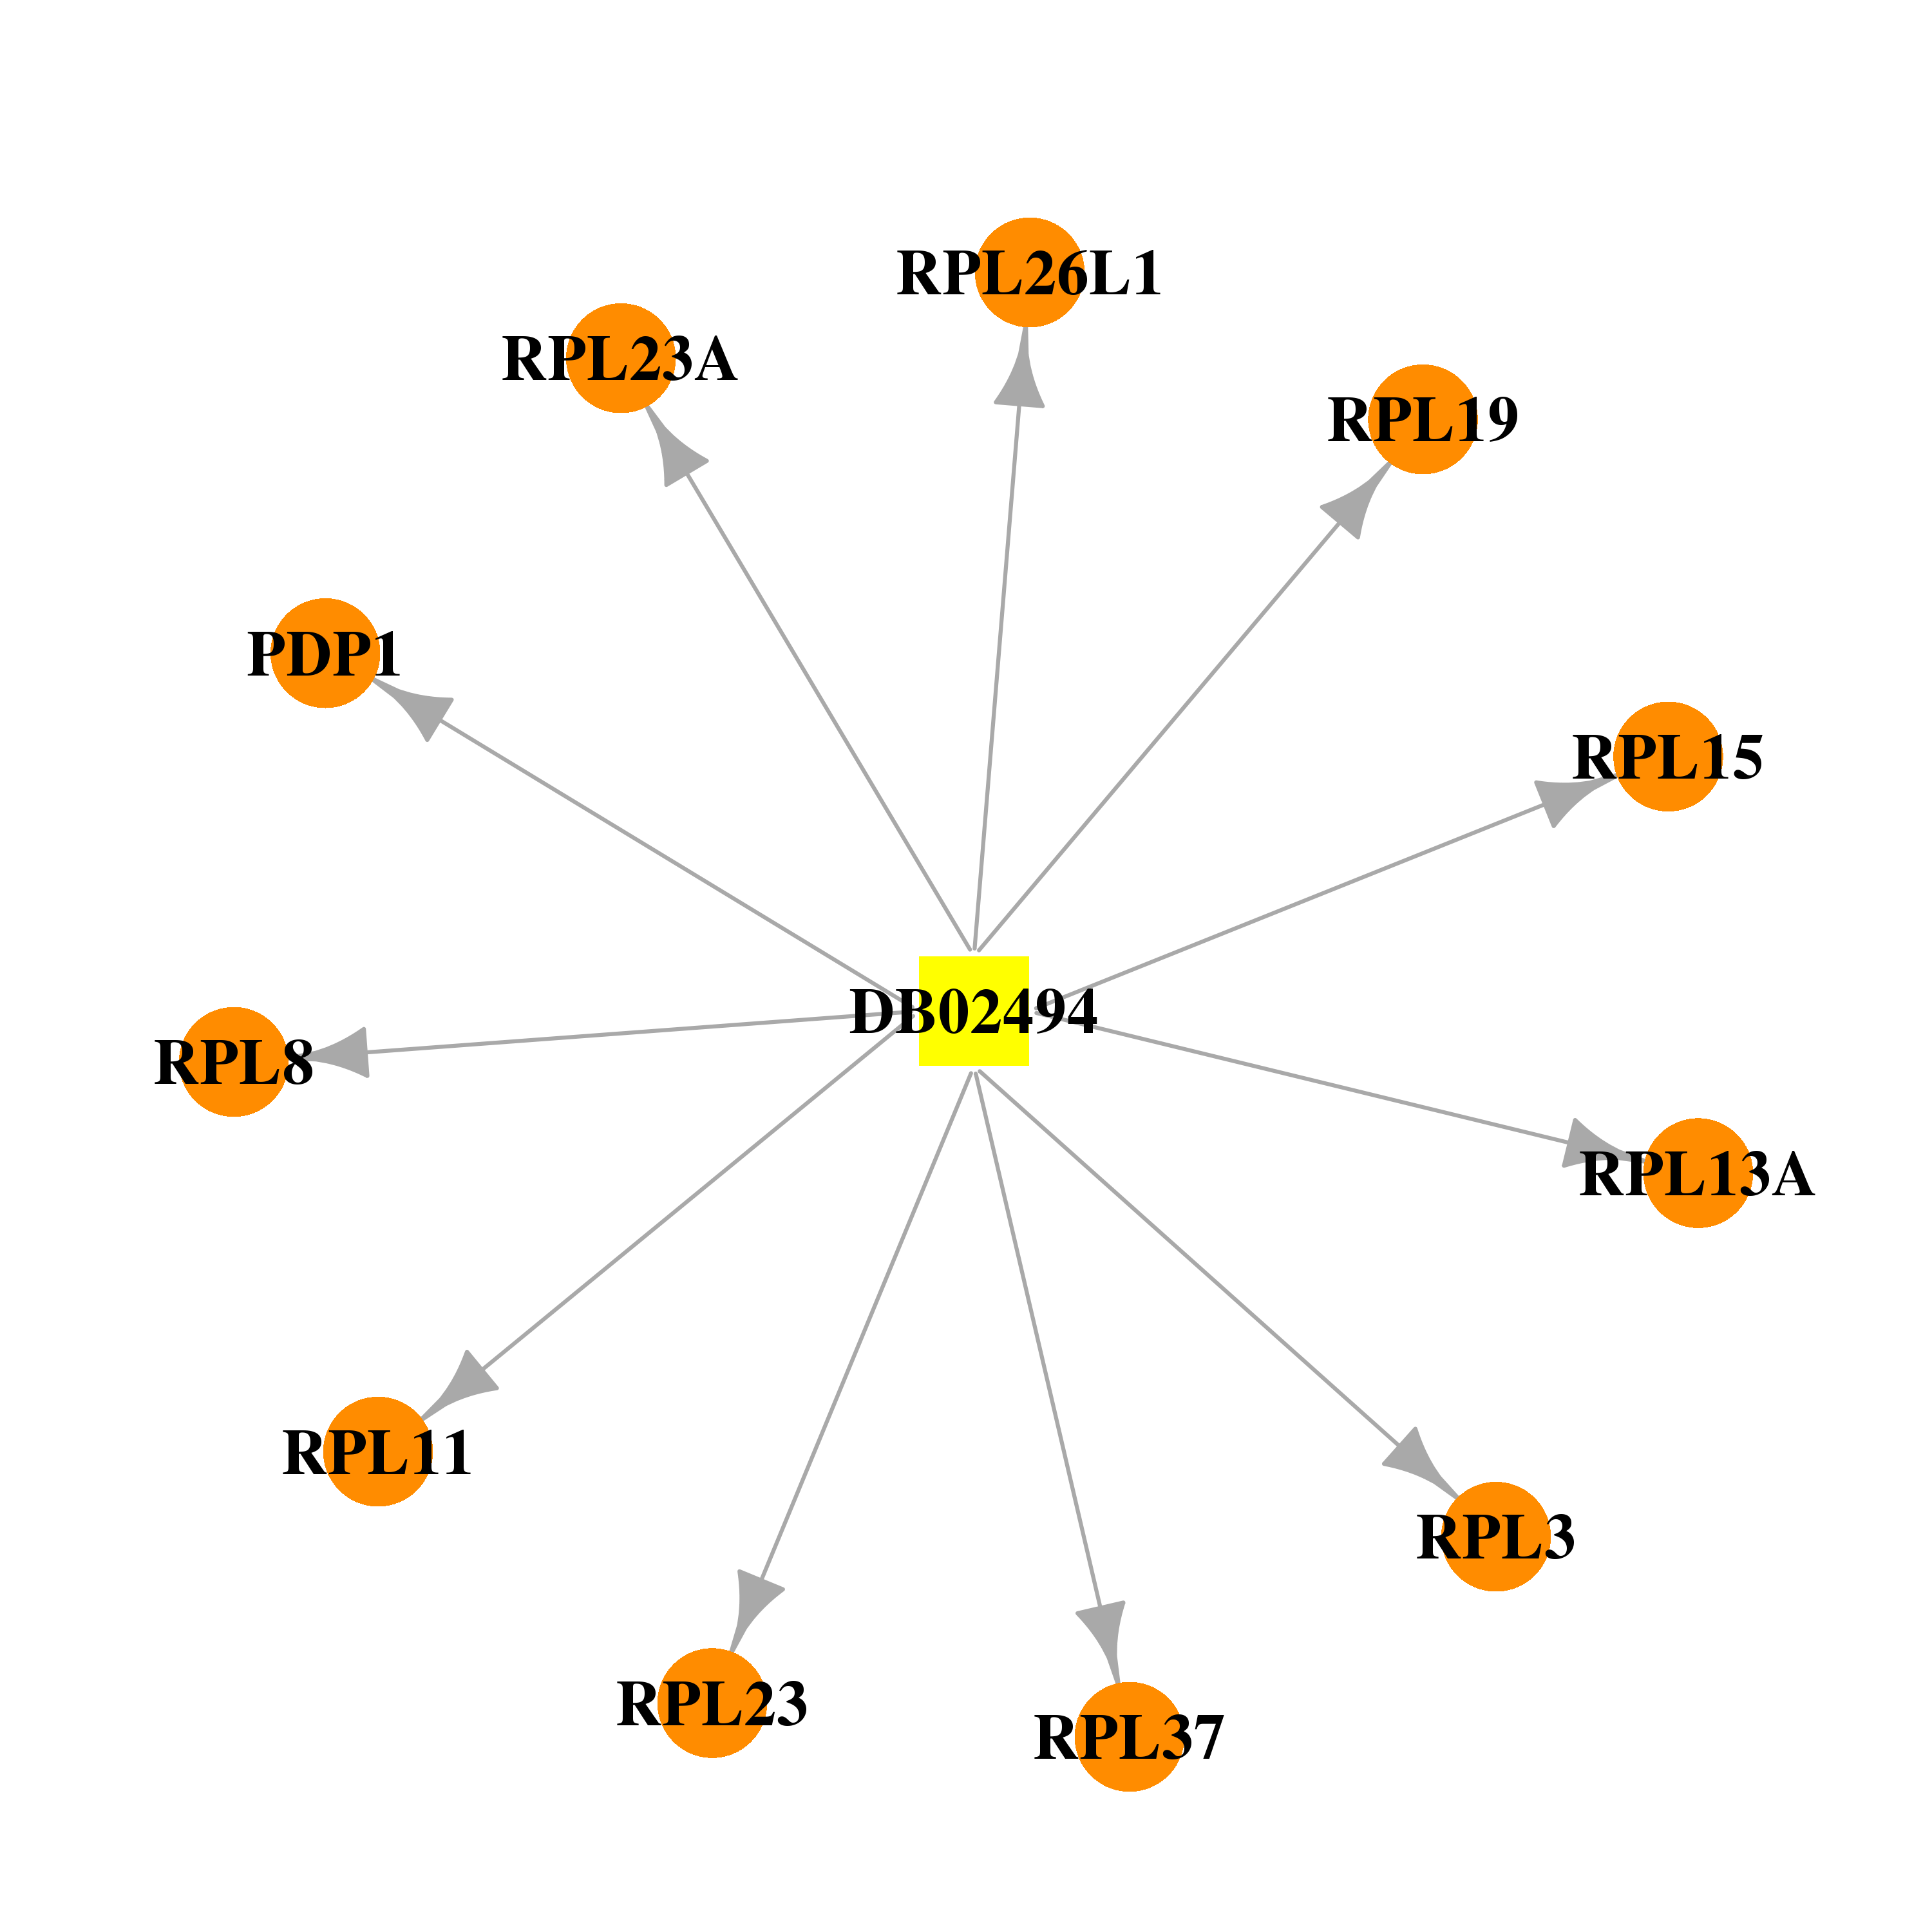 | 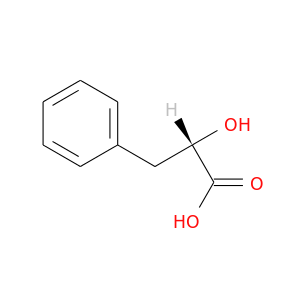 |
| DB03884 | pyruvate dehyrogenase phosphatase catalytic subunit 1 | experimental | 3-Phenylpyruvic Acid | 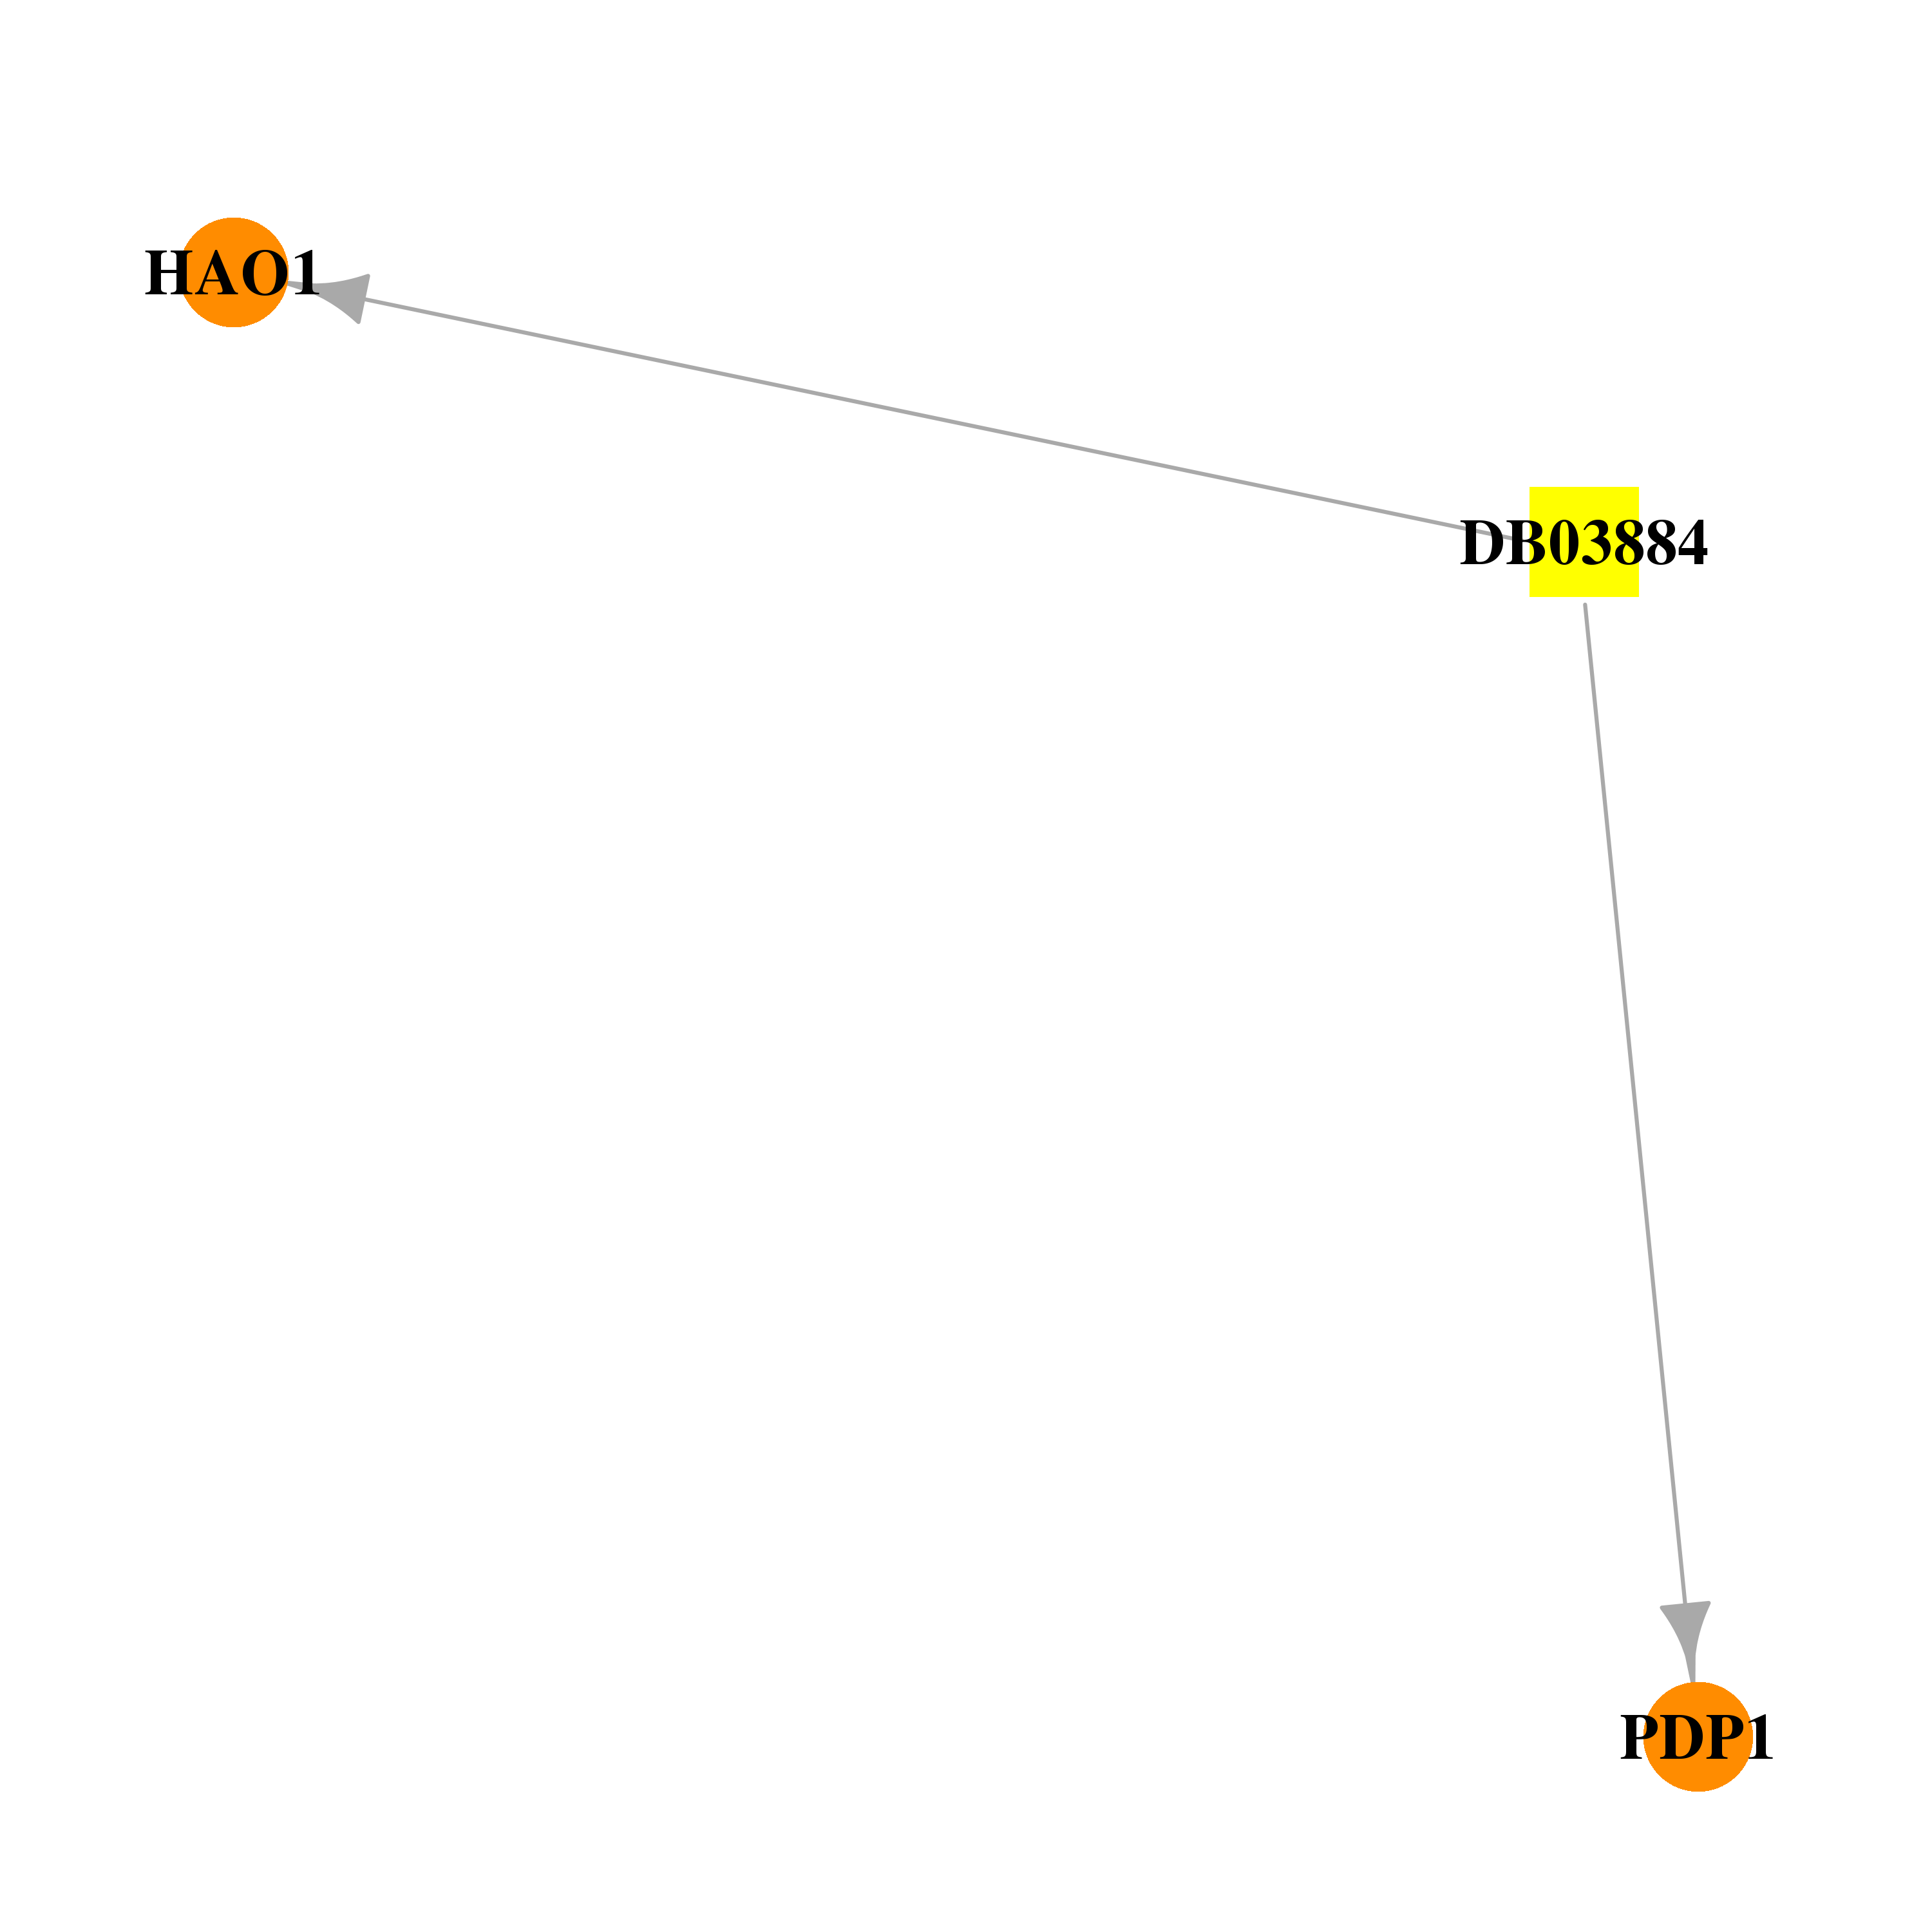 |  |
| Top |
| Cross referenced IDs for PDP1 |
| * We obtained these cross-references from Uniprot database. It covers 150 different DBs, 18 categories. http://www.uniprot.org/help/cross_references_section |
: Open all cross reference information
|
Copyright © 2016-Present - The Univsersity of Texas Health Science Center at Houston @ |