|
|||||||||||||||||||||||||||||||||||||||||||||||||||||||||||||||||||||||||||||||||||||||||||||||||||||||||||||||||||||||||||||||||||||||||||||||||||||||||||||||||||||||||||||||||||||||||||||||||||||||||||||||||||||||||||||||||||||||||||||||||||||||||||||||||||||||||||||||||||||||||||||||||||||||||||||||||||||||||||||||||||||||||||||||||||||||||||||||||||||||||||||||||
| |
| Phenotypic Information (metabolism pathway, cancer, disease, phenome) |
| |
| |
| Gene-Gene Network Information: Co-Expression Network, Interacting Genes & KEGG |
| |
|


| Gene Summary for PPAT |
| Basic gene info. | Gene symbol | PPAT |
| Gene name | phosphoribosyl pyrophosphate amidotransferase | |
| Synonyms | ATASE|GPAT|PRAT | |
| Cytomap | UCSC genome browser: 4q12 | |
| Genomic location | chr4 :57259528-57301802 | |
| Type of gene | protein-coding | |
| RefGenes | NM_002703.4, | |
| Ensembl id | ENSG00000128059 | |
| Description | amidophosphoribosyltransferaseglutamine PRPP amidotransferaseglutamine phosphoribosylpyrophosphatate amidotransferaseglutamine phosphoribosylpyrophosphate amidotransferase | |
| Modification date | 20141207 | |
| dbXrefs | MIM : 172450 | |
| HGNC : HGNC | ||
| Ensembl : ENSG00000128059 | ||
| HPRD : 01402 | ||
| Vega : OTTHUMG00000128842 | ||
| Protein | UniProt: go to UniProt's Cross Reference DB Table | |
| Expression | CleanEX: HS_PPAT | |
| BioGPS: 5471 | ||
| Gene Expression Atlas: ENSG00000128059 | ||
| The Human Protein Atlas: ENSG00000128059 | ||
| Pathway | NCI Pathway Interaction Database: PPAT | |
| KEGG: PPAT | ||
| REACTOME: PPAT | ||
| ConsensusPathDB | ||
| Pathway Commons: PPAT | ||
| Metabolism | MetaCyc: PPAT | |
| HUMANCyc: PPAT | ||
| Regulation | Ensembl's Regulation: ENSG00000128059 | |
| miRBase: chr4 :57,259,528-57,301,802 | ||
| TargetScan: NM_002703 | ||
| cisRED: ENSG00000128059 | ||
| Context | iHOP: PPAT | |
| cancer metabolism search in PubMed: PPAT | ||
| UCL Cancer Institute: PPAT | ||
| Assigned class in ccmGDB | C | |
| Top |
| Phenotypic Information for PPAT(metabolism pathway, cancer, disease, phenome) |
| Cancer | CGAP: PPAT |
| Familial Cancer Database: PPAT | |
| * This gene is included in those cancer gene databases. |
|
|
|
|
|
| . | |||||||||||||||||||||||||||||||||||||||||||||||||||||||||||||||||||||||||||||||||||||||||||||||||||||||||||||||||||||||||||||||||||||||||||||||||||||||||||||||||||||||||||||||||||||||||||||||||||||||||||||||||||||||||||||||||||||||||||||||||||||||||||||||||||||||||||||||||||||||||||||||||||||||||||||||||||||||||||||||||||||||||||||||||||||||||||||||||||||||||||
Oncogene 1 | Significant driver gene in | ||||||||||||||||||||||||||||||||||||||||||||||||||||||||||||||||||||||||||||||||||||||||||||||||||||||||||||||||||||||||||||||||||||||||||||||||||||||||||||||||||||||||||||||||||||||||||||||||||||||||||||||||||||||||||||||||||||||||||||||||||||||||||||||||||||||||||||||||||||||||||||||||||||||||||||||||||||||||||||||||||||||||||||||||||||||||||||||||||||||||||||||||
| cf) number; DB name 1 Oncogene; http://nar.oxfordjournals.org/content/35/suppl_1/D721.long, 2 Tumor Suppressor gene; https://bioinfo.uth.edu/TSGene/, 3 Cancer Gene Census; http://www.nature.com/nrc/journal/v4/n3/abs/nrc1299.html, 4 CancerGenes; http://nar.oxfordjournals.org/content/35/suppl_1/D721.long, 5 Network of Cancer Gene; http://ncg.kcl.ac.uk/index.php, 1Therapeutic Vulnerabilities in Cancer; http://cbio.mskcc.org/cancergenomics/statius/ |
| KEGG_PURINE_METABOLISM KEGG_ALANINE_ASPARTATE_AND_GLUTAMATE_METABOLISM REACTOME_METABOLISM_OF_NUCLEOTIDES REACTOME_PURINE_METABOLISM | |
| OMIM | |
| Orphanet | |
| Disease | KEGG Disease: PPAT |
| MedGen: PPAT (Human Medical Genetics with Condition) | |
| ClinVar: PPAT | |
| Phenotype | MGI: PPAT (International Mouse Phenotyping Consortium) |
| PhenomicDB: PPAT | |
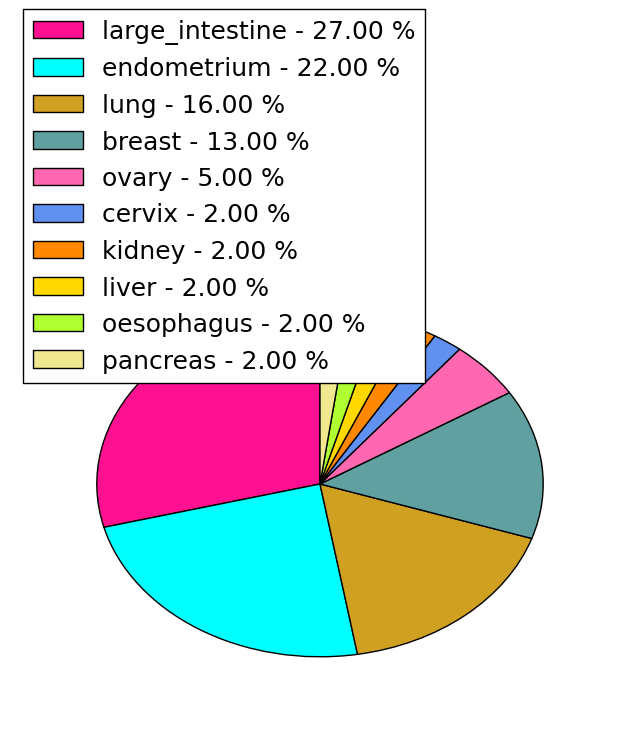
| Mutations for PPAT |
| * Under tables are showing count per each tissue to give us broad intuition about tissue specific mutation patterns.You can go to the detailed page for each mutation database's web site. |
| - Statistics for Tissue and Mutation type | Top |
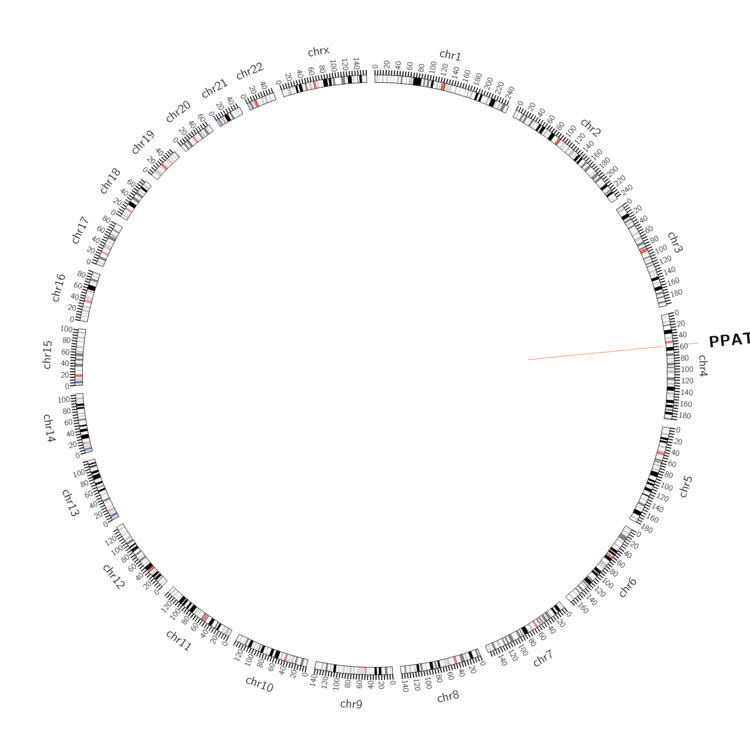 |
| - For Inter-chromosomal Variations |
| There's no inter-chromosomal structural variation. |
| - For Intra-chromosomal Variations |
| * Intra-chromosomal variantions includes 'intrachromosomal amplicon to amplicon', 'intrachromosomal amplicon to non-amplified dna', 'intrachromosomal deletion', 'intrachromosomal fold-back inversion', 'intrachromosomal inversion', 'intrachromosomal tandem duplication', 'Intrachromosomal unknown type', 'intrachromosomal with inverted orientation', 'intrachromosomal with non-inverted orientation'. |
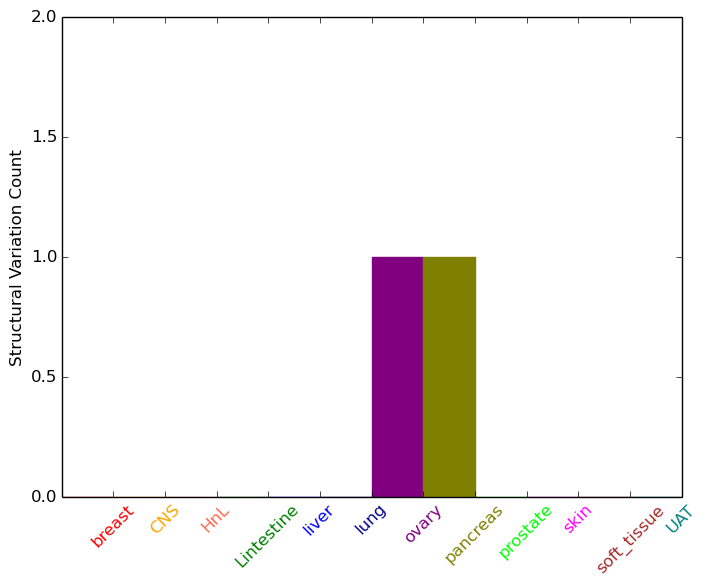 |
| Sample | Symbol_a | Chr_a | Start_a | End_a | Symbol_b | Chr_b | Start_b | End_b |
| ovary | PPAT | chr4 | 57275559 | 57275579 | PPAT | chr4 | 57275649 | 57275669 |
| pancreas | PPAT | chr4 | 57279722 | 57279742 | PPAT | chr4 | 57279621 | 57279641 |
| cf) Tissue number; Tissue name (1;Breast, 2;Central_nervous_system, 3;Haematopoietic_and_lymphoid_tissue, 4;Large_intestine, 5;Liver, 6;Lung, 7;Ovary, 8;Pancreas, 9;Prostate, 10;Skin, 11;Soft_tissue, 12;Upper_aerodigestive_tract) |
| * From mRNA Sanger sequences, Chitars2.0 arranged chimeric transcripts. This table shows PPAT related fusion information. |
| ID | Head Gene | Tail Gene | Accession | Gene_a | qStart_a | qEnd_a | Chromosome_a | tStart_a | tEnd_a | Gene_a | qStart_a | qEnd_a | Chromosome_a | tStart_a | tEnd_a |
| Top |
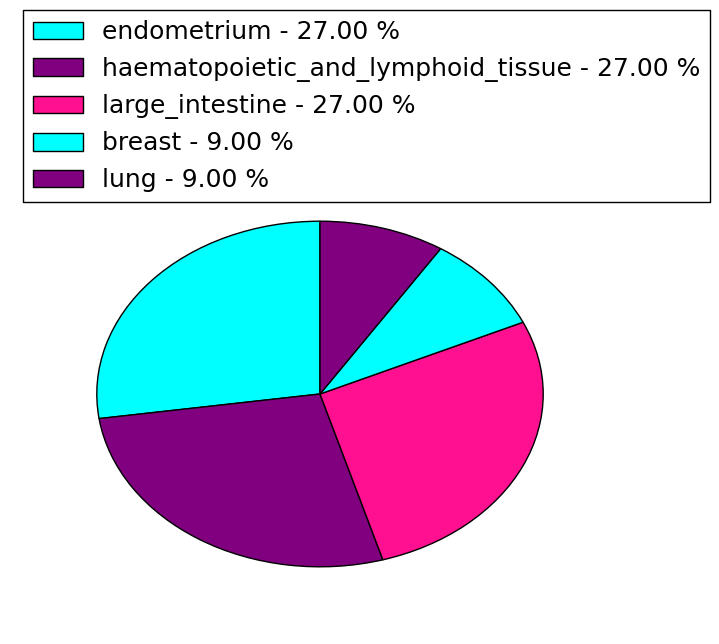
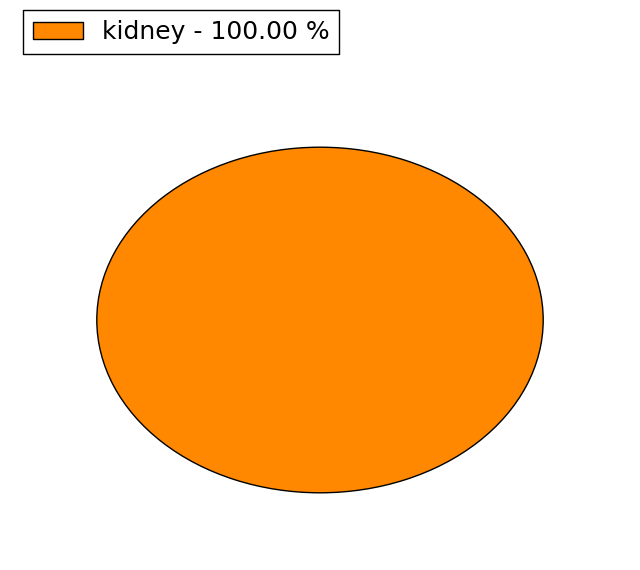
| Mutation type/ Tissue ID | brca | cns | cerv | endome | haematopo | kidn | Lintest | liver | lung | ns | ovary | pancre | prost | skin | stoma | thyro | urina | |||
| Total # sample | 4 | 2 | 1 | |||||||||||||||||
| GAIN (# sample) | 2 | 1 | ||||||||||||||||||
| LOSS (# sample) | 4 |
| cf) Tissue ID; Tissue type (1; Breast, 2; Central_nervous_system, 3; Cervix, 4; Endometrium, 5; Haematopoietic_and_lymphoid_tissue, 6; Kidney, 7; Large_intestine, 8; Liver, 9; Lung, 10; NS, 11; Ovary, 12; Pancreas, 13; Prostate, 14; Skin, 15; Stomach, 16; Thyroid, 17; Urinary_tract) |
| Top |
|
 |
| Top |
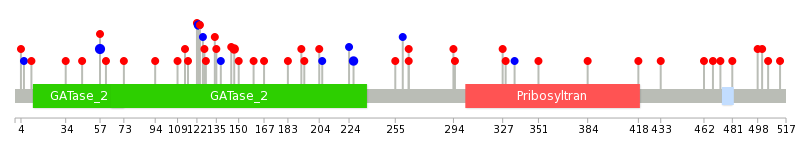
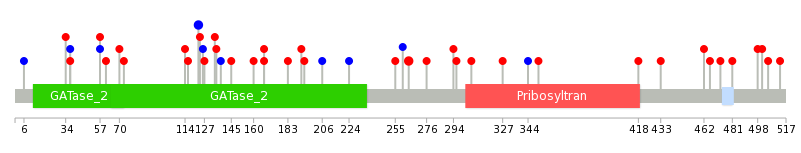
| Stat. for Non-Synonymous SNVs (# total SNVs=36) | (# total SNVs=11) |
 |  |
(# total SNVs=1) | (# total SNVs=0) |
 |
| Top |
| * When you move the cursor on each content, you can see more deailed mutation information on the Tooltip. Those are primary_site,primary_histology,mutation(aa),pubmedID. |
| GRCh37 position | Mutation(aa) | Unique sampleID count |
| chr4:57273840-57273840 | p.S57S | 3 |
| chr4:57272694-57272694 | p.G123G | 2 |
| chr4:57268328-57268328 | p.T227T | 2 |
| chr4:57269531-57269531 | p.D147H | 2 |
| chr4:57272783-57272783 | p.Y94H | 1 |
| chr4:57267500-57267500 | p.F294L | 1 |
| chr4:57301626-57301626 | p.L6L | 1 |
| chr4:57269285-57269285 | p.I194M | 1 |
| chr4:57262844-57262844 | p.P433H | 1 |
| chr4:57272662-57272662 | p.K134R | 1 |
| Top |
|
 |
| Point Mutation/ Tissue ID | 1 | 2 | 3 | 4 | 5 | 6 | 7 | 8 | 9 | 10 | 11 | 12 | 13 | 14 | 15 | 16 | 17 | 18 | 19 | 20 |
| # sample | 1 | 2 | 1 | 9 | 2 | 1 | 5 | 3 | 2 | 2 | 3 | 1 | 10 | |||||||
| # mutation | 1 | 2 | 1 | 9 | 2 | 1 | 8 | 3 | 2 | 2 | 3 | 1 | 11 | |||||||
| nonsynonymous SNV | 1 | 1 | 1 | 8 | 2 | 1 | 6 | 2 | 2 | 2 | 1 | 8 | ||||||||
| synonymous SNV | 1 | 1 | 2 | 1 | 2 | 1 | 3 |
| cf) Tissue ID; Tissue type (1; BLCA[Bladder Urothelial Carcinoma], 2; BRCA[Breast invasive carcinoma], 3; CESC[Cervical squamous cell carcinoma and endocervical adenocarcinoma], 4; COAD[Colon adenocarcinoma], 5; GBM[Glioblastoma multiforme], 6; Glioma Low Grade, 7; HNSC[Head and Neck squamous cell carcinoma], 8; KICH[Kidney Chromophobe], 9; KIRC[Kidney renal clear cell carcinoma], 10; KIRP[Kidney renal papillary cell carcinoma], 11; LAML[Acute Myeloid Leukemia], 12; LUAD[Lung adenocarcinoma], 13; LUSC[Lung squamous cell carcinoma], 14; OV[Ovarian serous cystadenocarcinoma ], 15; PAAD[Pancreatic adenocarcinoma], 16; PRAD[Prostate adenocarcinoma], 17; SKCM[Skin Cutaneous Melanoma], 18:STAD[Stomach adenocarcinoma], 19:THCA[Thyroid carcinoma], 20:UCEC[Uterine Corpus Endometrial Carcinoma]) |
| Top |
| * We represented just top 10 SNVs. When you move the cursor on each content, you can see more deailed mutation information on the Tooltip. Those are primary_site, primary_histology, mutation(aa), pubmedID. |
| Genomic Position | Mutation(aa) | Unique sampleID count |
| chr4:57272694 | p.Q264K | 2 |
| chr4:57269471 | p.G123G | 2 |
| chr4:57267592 | p.P167T | 2 |
| chr4:57267604 | p.T34I | 1 |
| chr4:57269567 | p.S327C | 1 |
| chr4:57262844 | p.H138H | 1 |
| chr4:57273840 | p.L6L | 1 |
| chr4:57267619 | p.C306G | 1 |
| chr4:57272662 | p.L135I | 1 |
| chr4:57262889 | p.D296N | 1 |
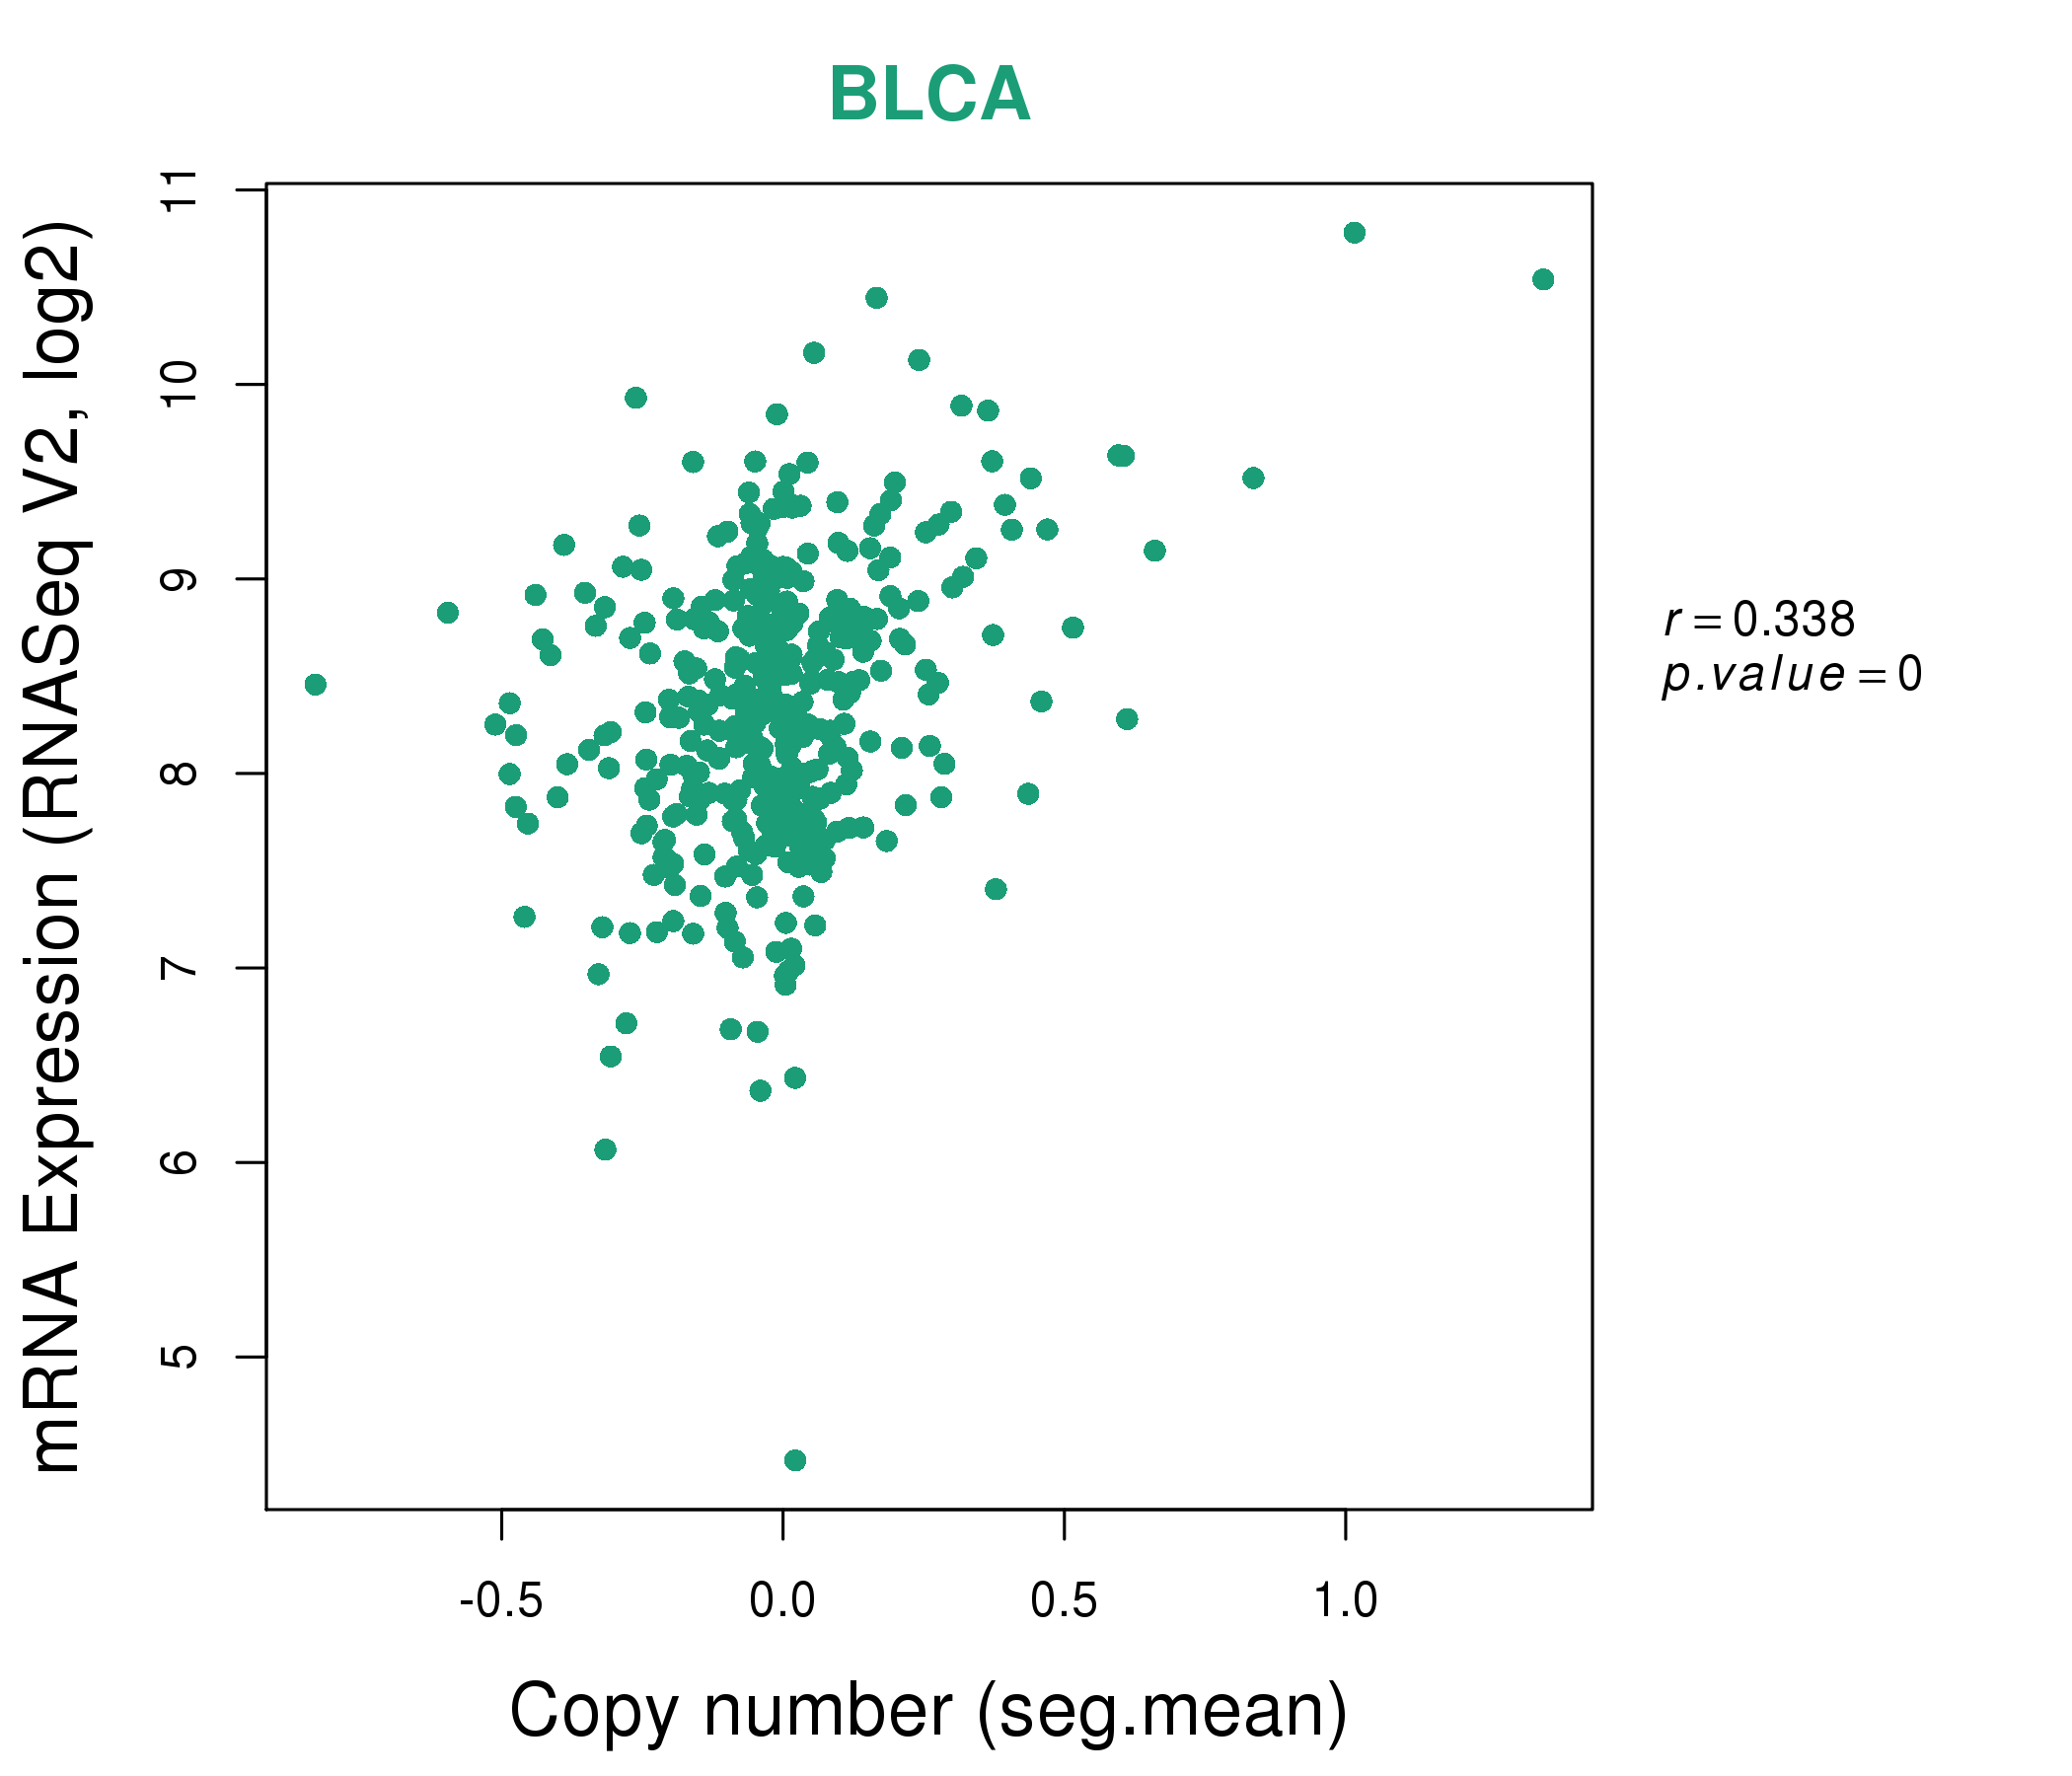
| * Copy number data were extracted from TCGA using R package TCGA-Assembler. The URLs of all public data files on TCGA DCC data server were gathered on Jan-05-2015. Function ProcessCNAData in TCGA-Assembler package was used to obtain gene-level copy number value which is calculated as the average copy number of the genomic region of a gene. |
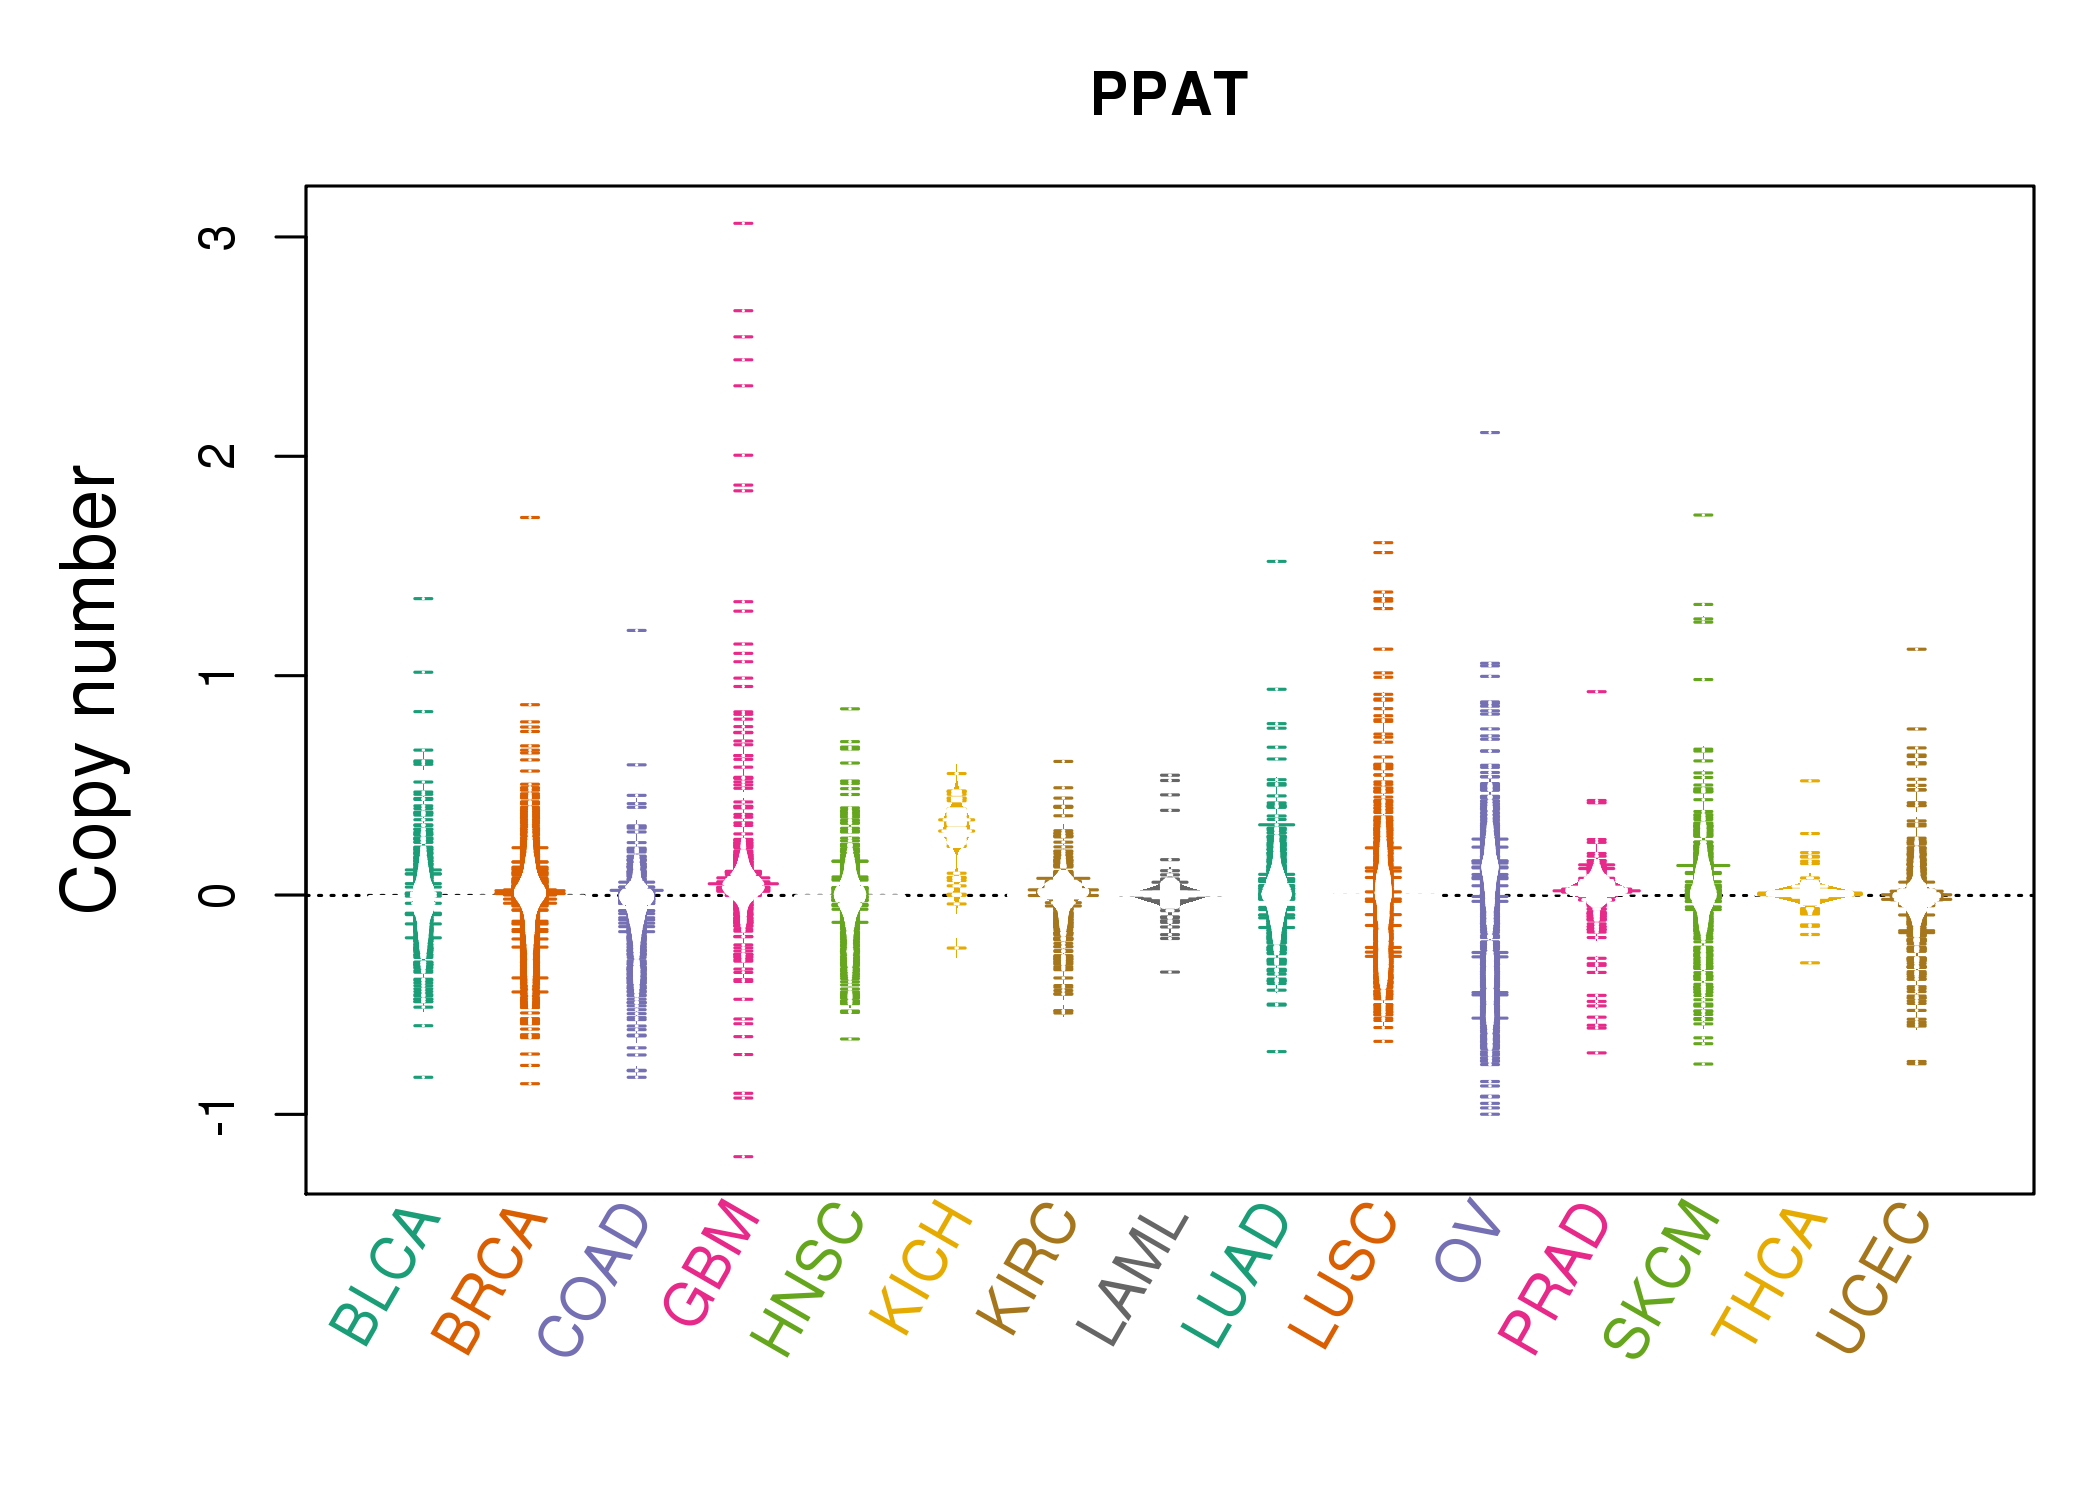 |
| cf) Tissue ID[Tissue type]: BLCA[Bladder Urothelial Carcinoma], BRCA[Breast invasive carcinoma], CESC[Cervical squamous cell carcinoma and endocervical adenocarcinoma], COAD[Colon adenocarcinoma], GBM[Glioblastoma multiforme], Glioma Low Grade, HNSC[Head and Neck squamous cell carcinoma], KICH[Kidney Chromophobe], KIRC[Kidney renal clear cell carcinoma], KIRP[Kidney renal papillary cell carcinoma], LAML[Acute Myeloid Leukemia], LUAD[Lung adenocarcinoma], LUSC[Lung squamous cell carcinoma], OV[Ovarian serous cystadenocarcinoma ], PAAD[Pancreatic adenocarcinoma], PRAD[Prostate adenocarcinoma], SKCM[Skin Cutaneous Melanoma], STAD[Stomach adenocarcinoma], THCA[Thyroid carcinoma], UCEC[Uterine Corpus Endometrial Carcinoma] |
| Top |
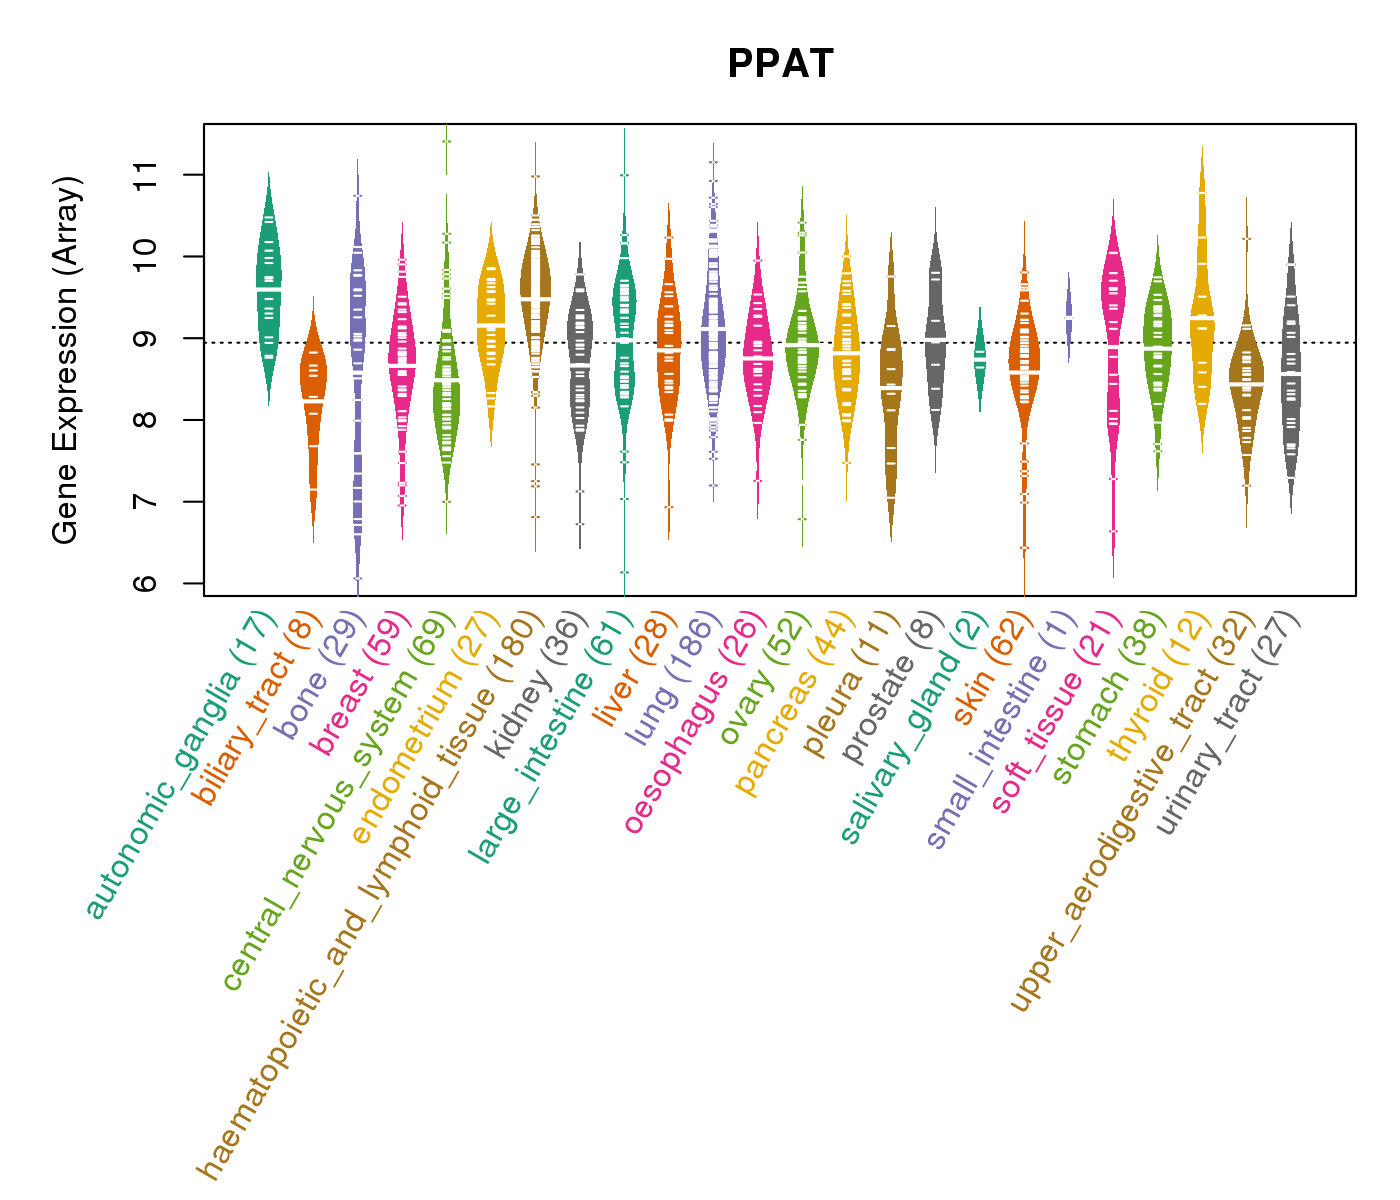
| Gene Expression for PPAT |
| * CCLE gene expression data were extracted from CCLE_Expression_Entrez_2012-10-18.res: Gene-centric RMA-normalized mRNA expression data. |
 |
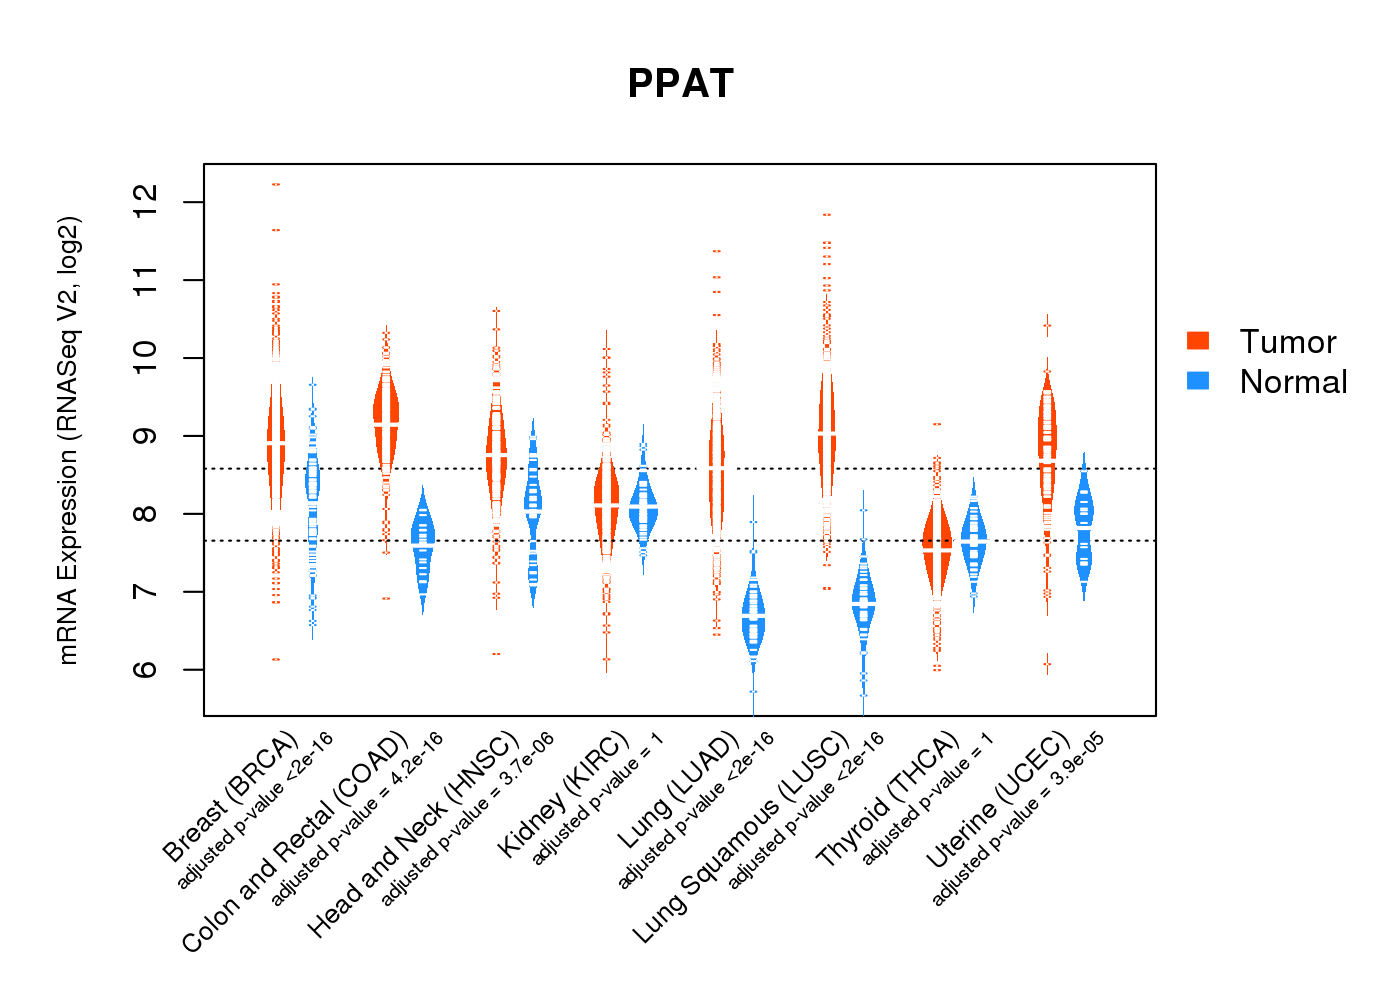
| * Normalized gene expression data of RNASeqV2 was extracted from TCGA using R package TCGA-Assembler. The URLs of all public data files on TCGA DCC data server were gathered at Jan-05-2015. Only eight cancer types have enough normal control samples for differential expression analysis. (t test, adjusted p<0.05 (using Benjamini-Hochberg FDR)) |
 |
| Top |
| * This plots show the correlation between CNV and gene expression. |
: Open all plots for all cancer types
 |
|
 |
|


| Top |
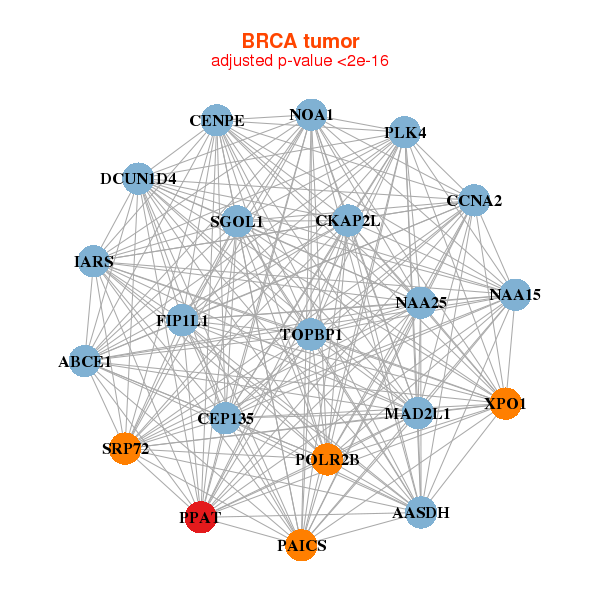
| Gene-Gene Network Information |
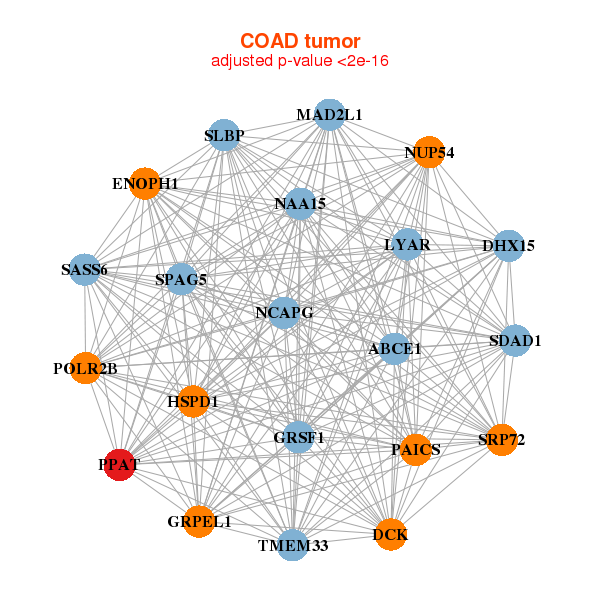
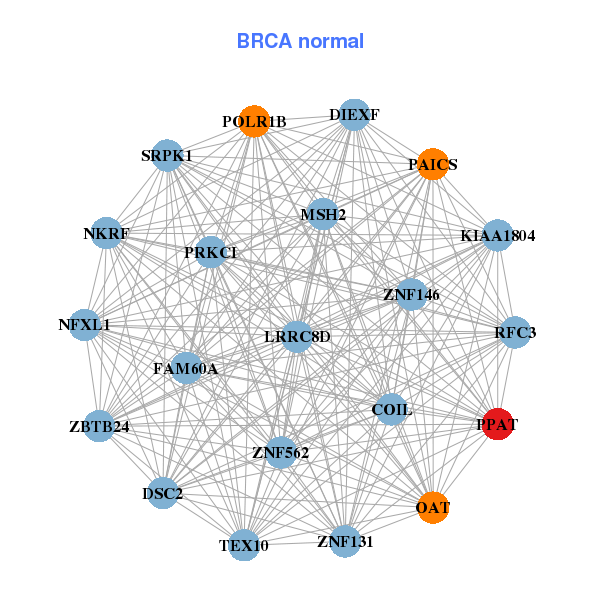
| * Co-Expression network figures were drawn using R package igraph. Only the top 20 genes with the highest correlations were shown. Red circle: input gene, orange circle: cell metabolism gene, sky circle: other gene |
: Open all plots for all cancer types
 |
| ||||
| AASDH,ABCE1,NOA1,CCNA2,CENPE,CEP135,CKAP2L, DCUN1D4,FIP1L1,IARS,MAD2L1,NAA15,NAA25,PAICS, PLK4,POLR2B,PPAT,SGOL1,SRP72,TOPBP1,XPO1 | DIEXF,COIL,DSC2,FAM60A,KIAA1804,LRRC8D,MSH2, NFXL1,NKRF,OAT,PAICS,POLR1B,PPAT,PRKCI, RFC3,SRPK1,TEX10,ZBTB24,ZNF131,ZNF146,ZNF562 | ||||
 |
| ||||
| ABCE1,DCK,DHX15,ENOPH1,GRPEL1,GRSF1,HSPD1, LYAR,MAD2L1,NAA15,NCAPG,NUP54,PAICS,POLR2B, PPAT,SASS6,SDAD1,SLBP,SPAG5,SRP72,TMEM33 | ASUN,CEP83,CEP78,DCLRE1A,EI24,EXOSC2,GART, METTL3,PIAS2,PM20D2,PMS1,PPAT,PRMT5,PRPF4, PTPLAD1,SKP2,SRP72,SUV39H2,WDR3,WDR75,XPOT |
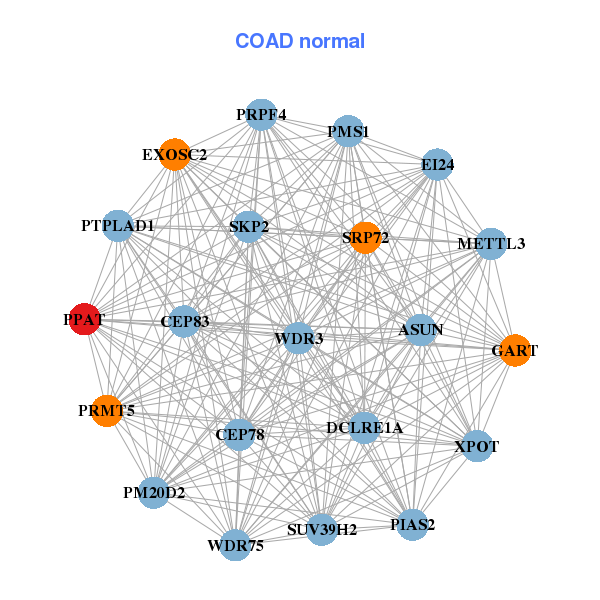
| * Co-Expression network figures were drawn using R package igraph. Only the top 20 genes with the highest correlations were shown. Red circle: input gene, orange circle: cell metabolism gene, sky circle: other gene |
: Open all plots for all cancer types
| Top |
: Open all interacting genes' information including KEGG pathway for all interacting genes from DAVID
| Top |
| Pharmacological Information for PPAT |
| DB Category | DB Name | DB's ID and Url link |
| * Gene Centered Interaction Network. |
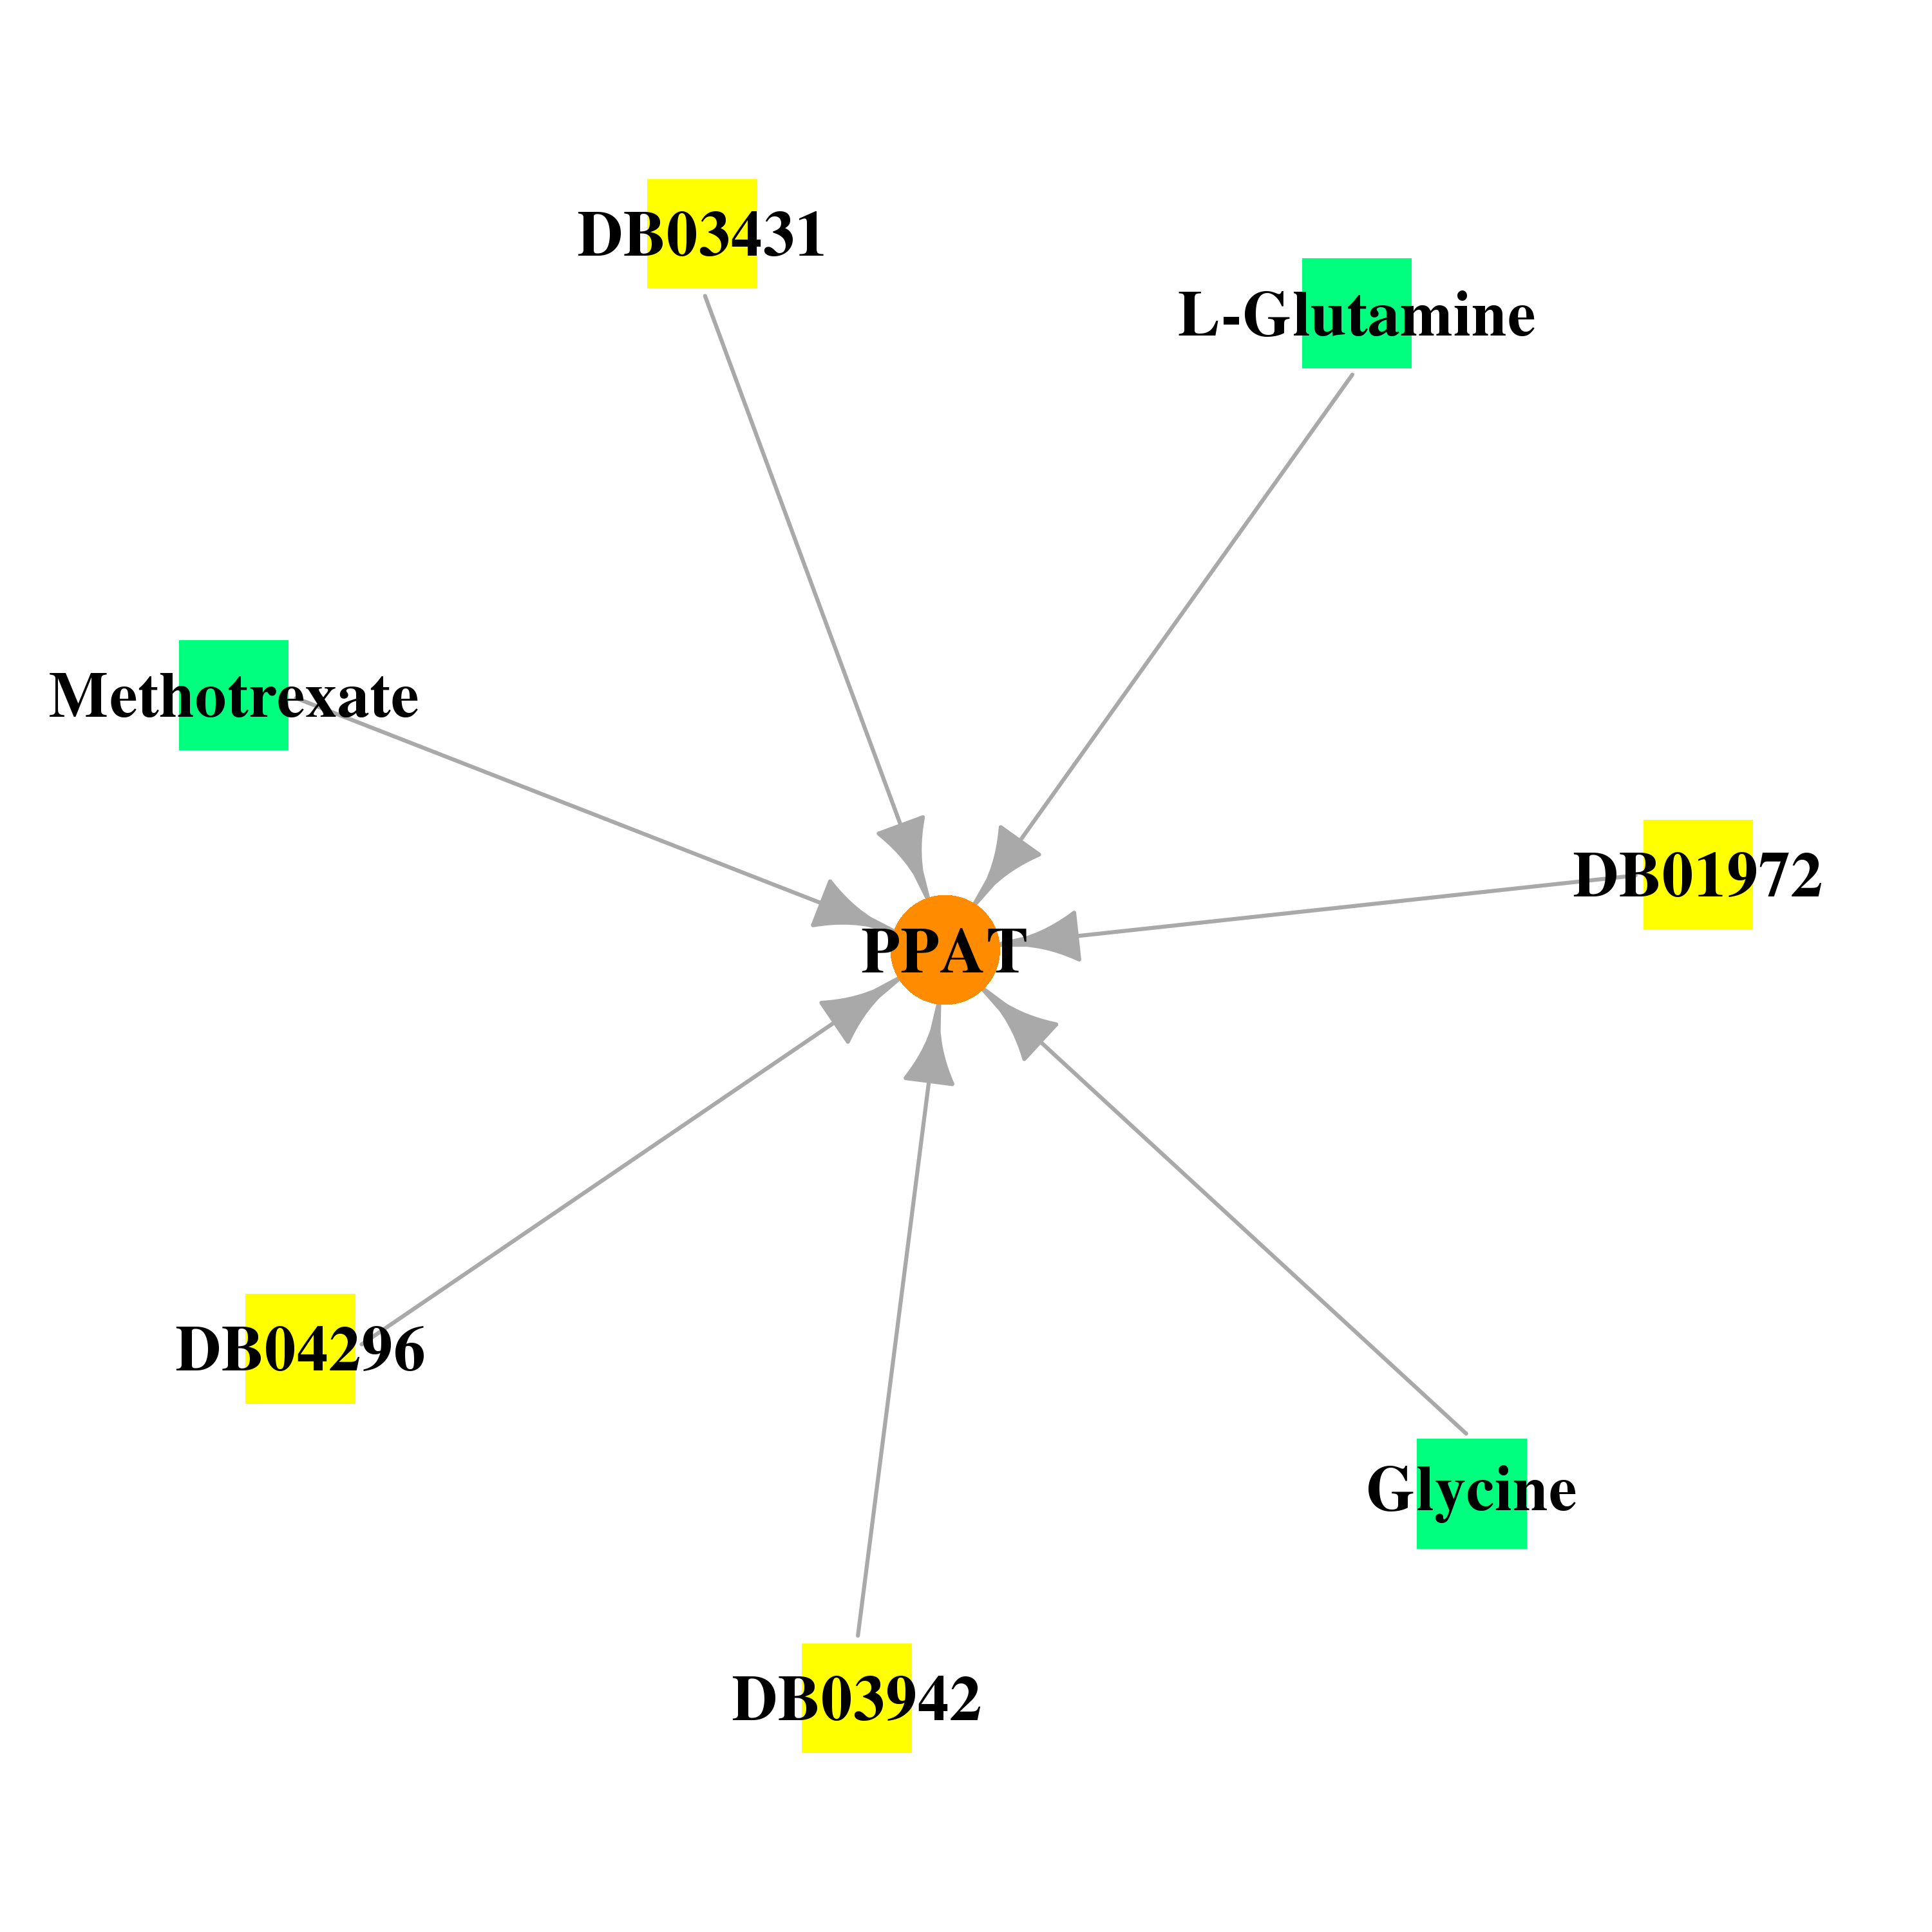 |
| * Drug Centered Interaction Network. |
| DrugBank ID | Target Name | Drug Groups | Generic Name | Drug Centered Network | Drug Structure |
| DB00130 | phosphoribosyl pyrophosphate amidotransferase | approved; nutraceutical; investigational | L-Glutamine |  |  |
| DB01972 | phosphoribosyl pyrophosphate amidotransferase | experimental | Guanosine-5'-Monophosphate | 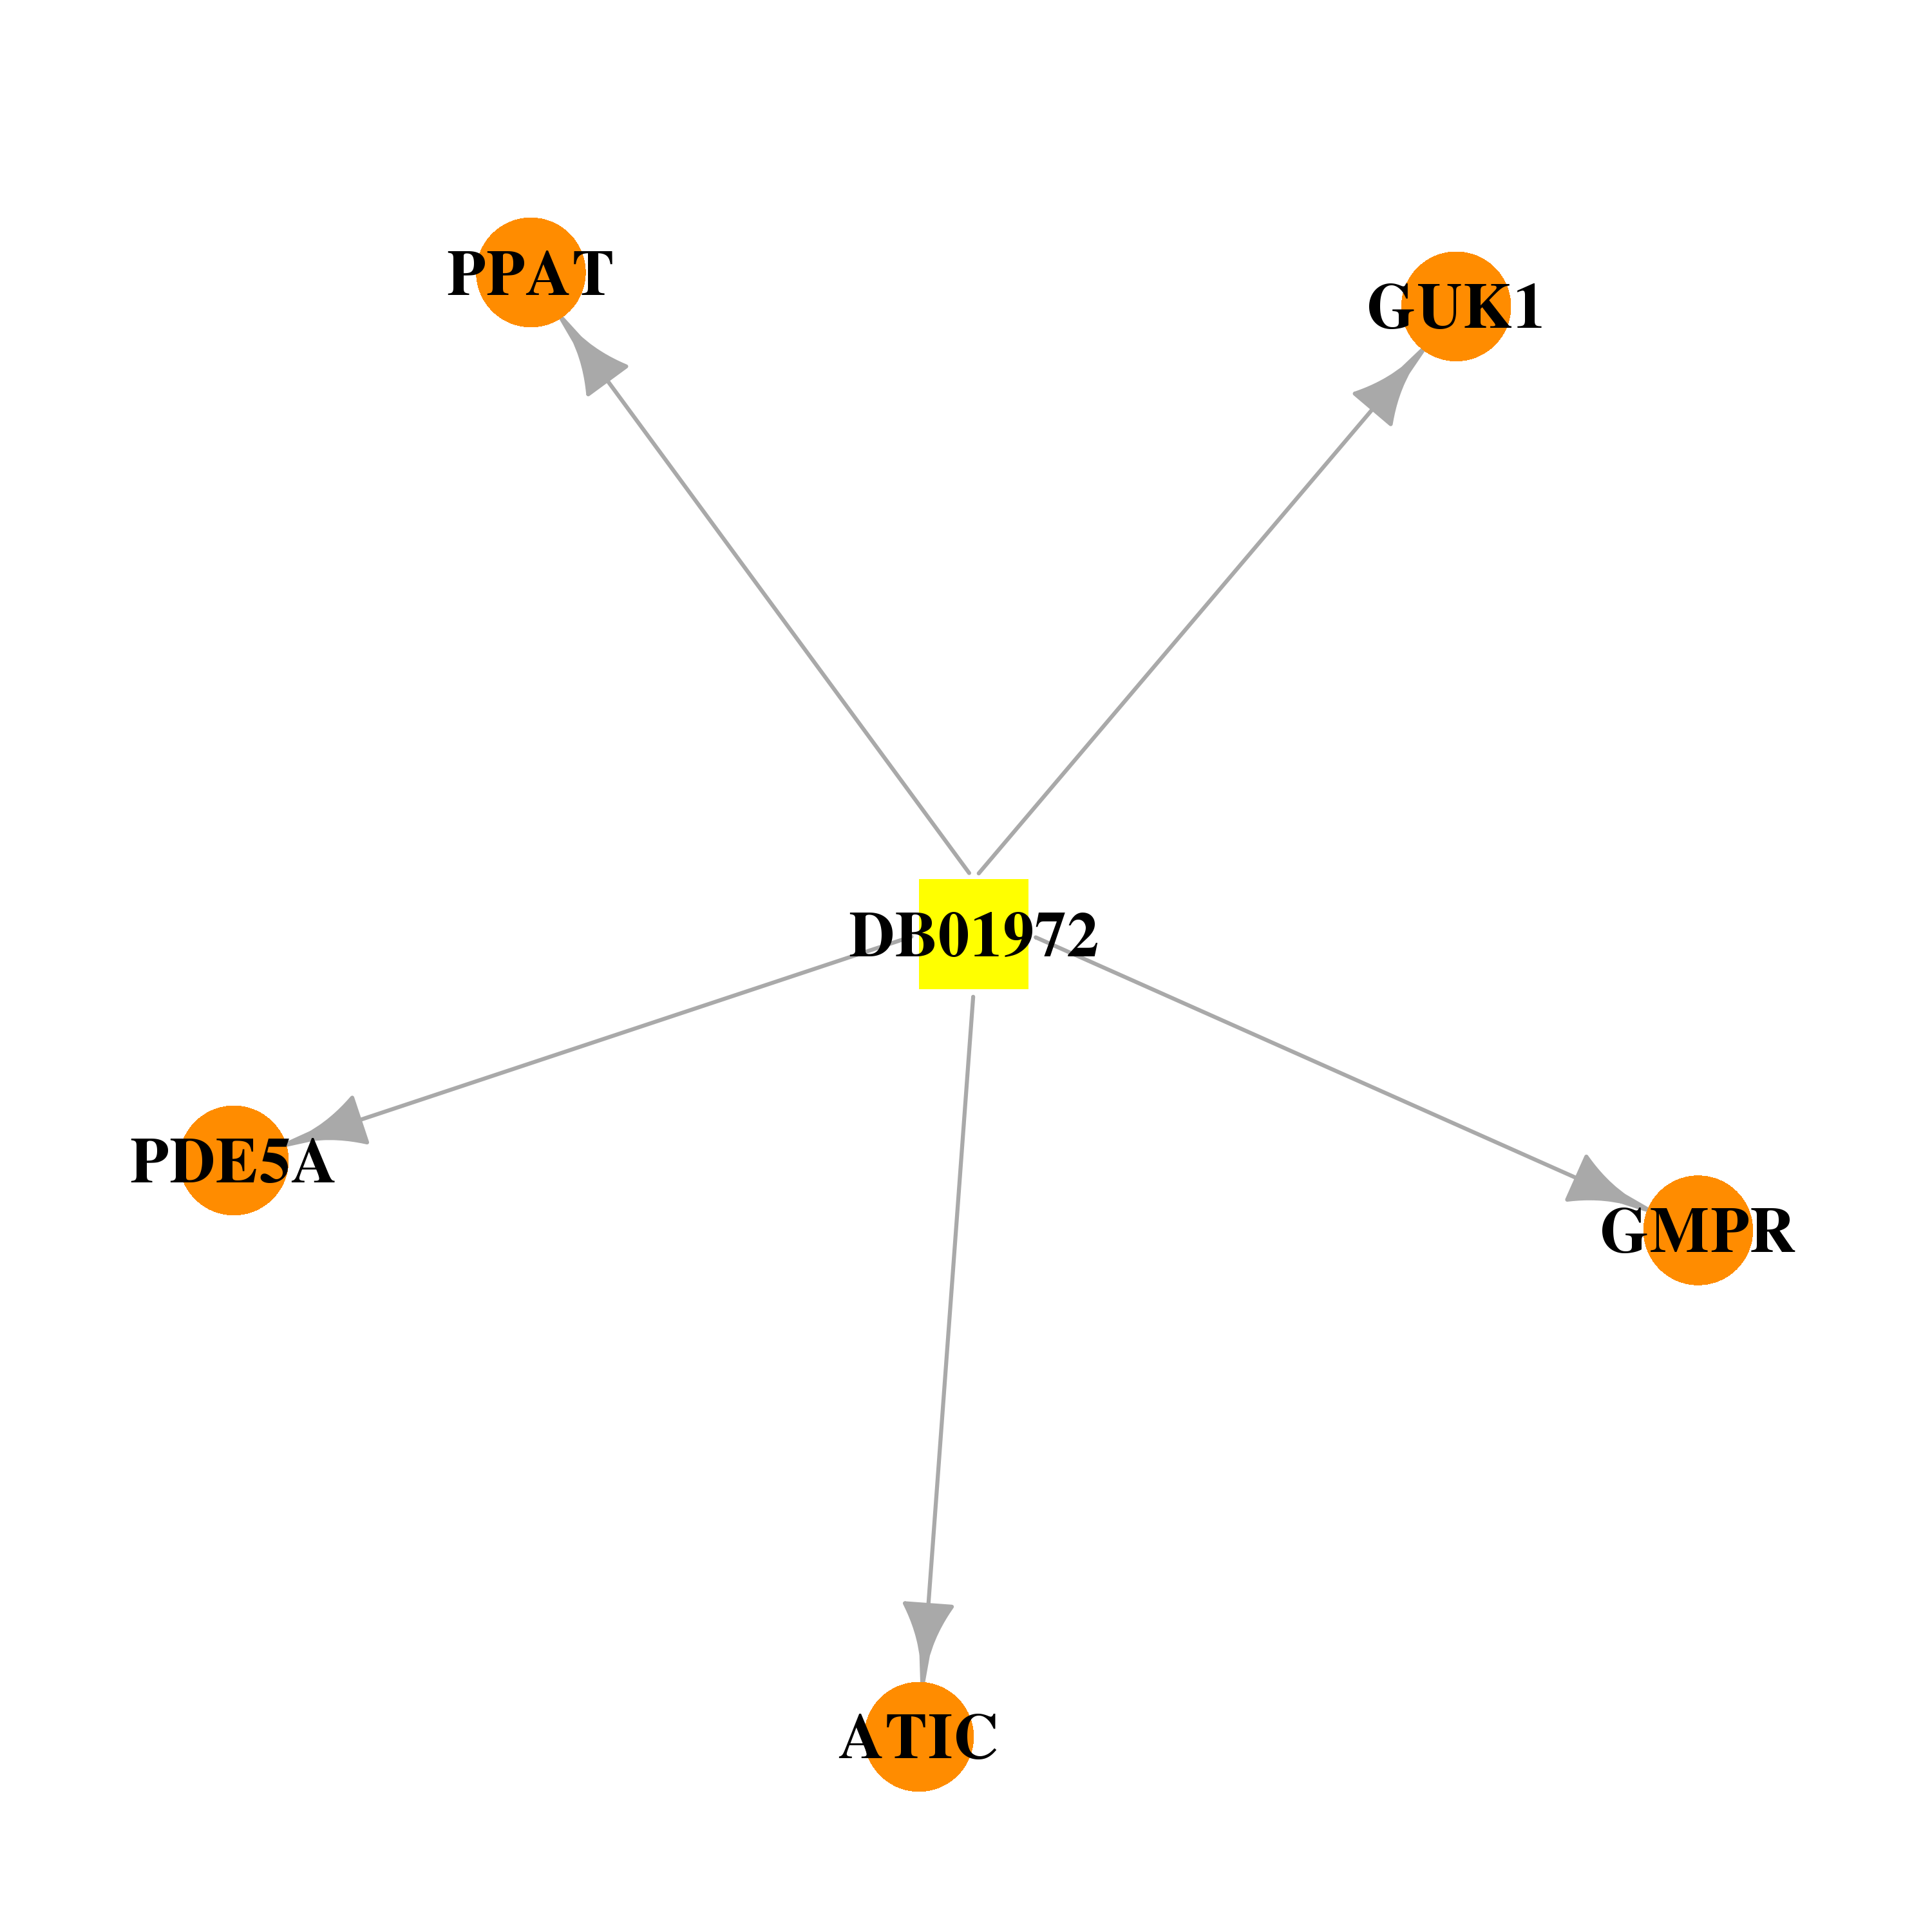 | 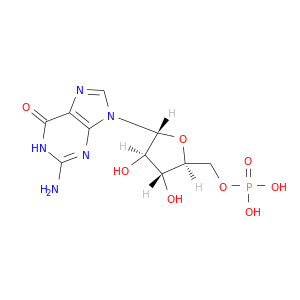 |
| DB03431 | phosphoribosyl pyrophosphate amidotransferase | experimental | Adenosine-5'-Diphosphate | 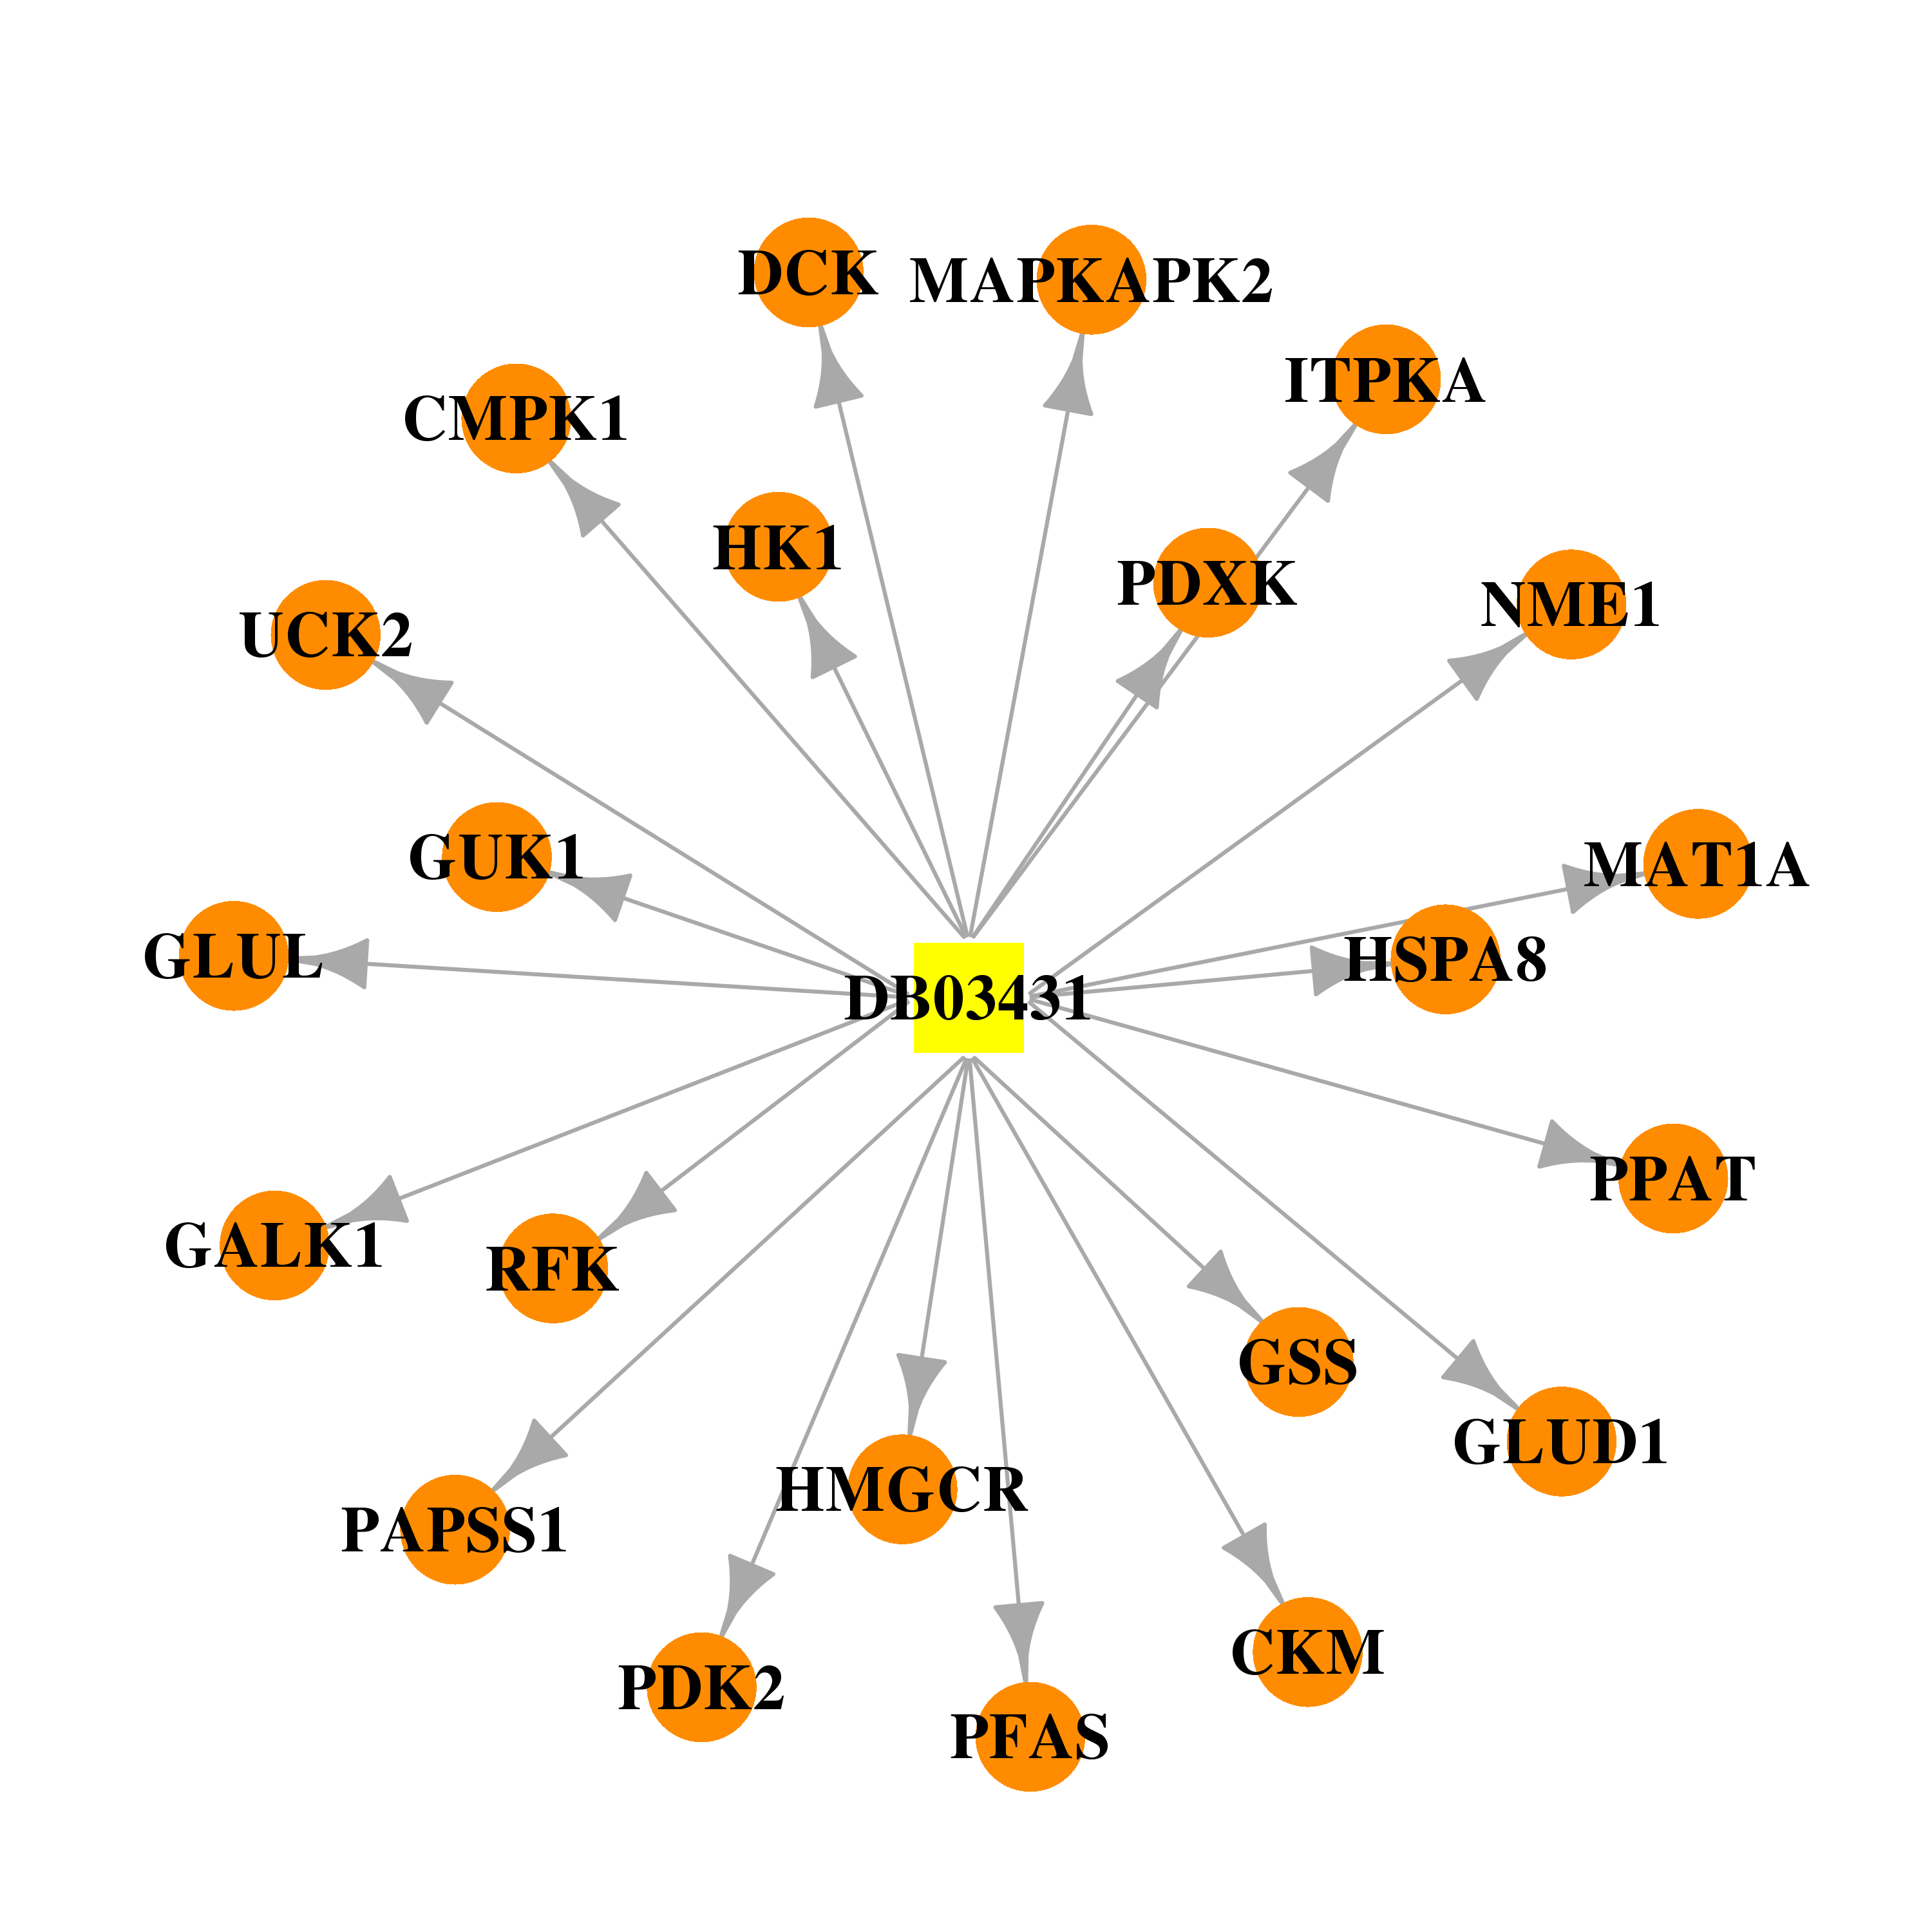 | 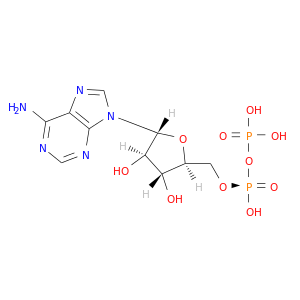 |
| DB03942 | phosphoribosyl pyrophosphate amidotransferase | experimental | Carboxylic PRPP |  |  |
| DB04296 | phosphoribosyl pyrophosphate amidotransferase | experimental | 5-Oxo-L-Norleucine | 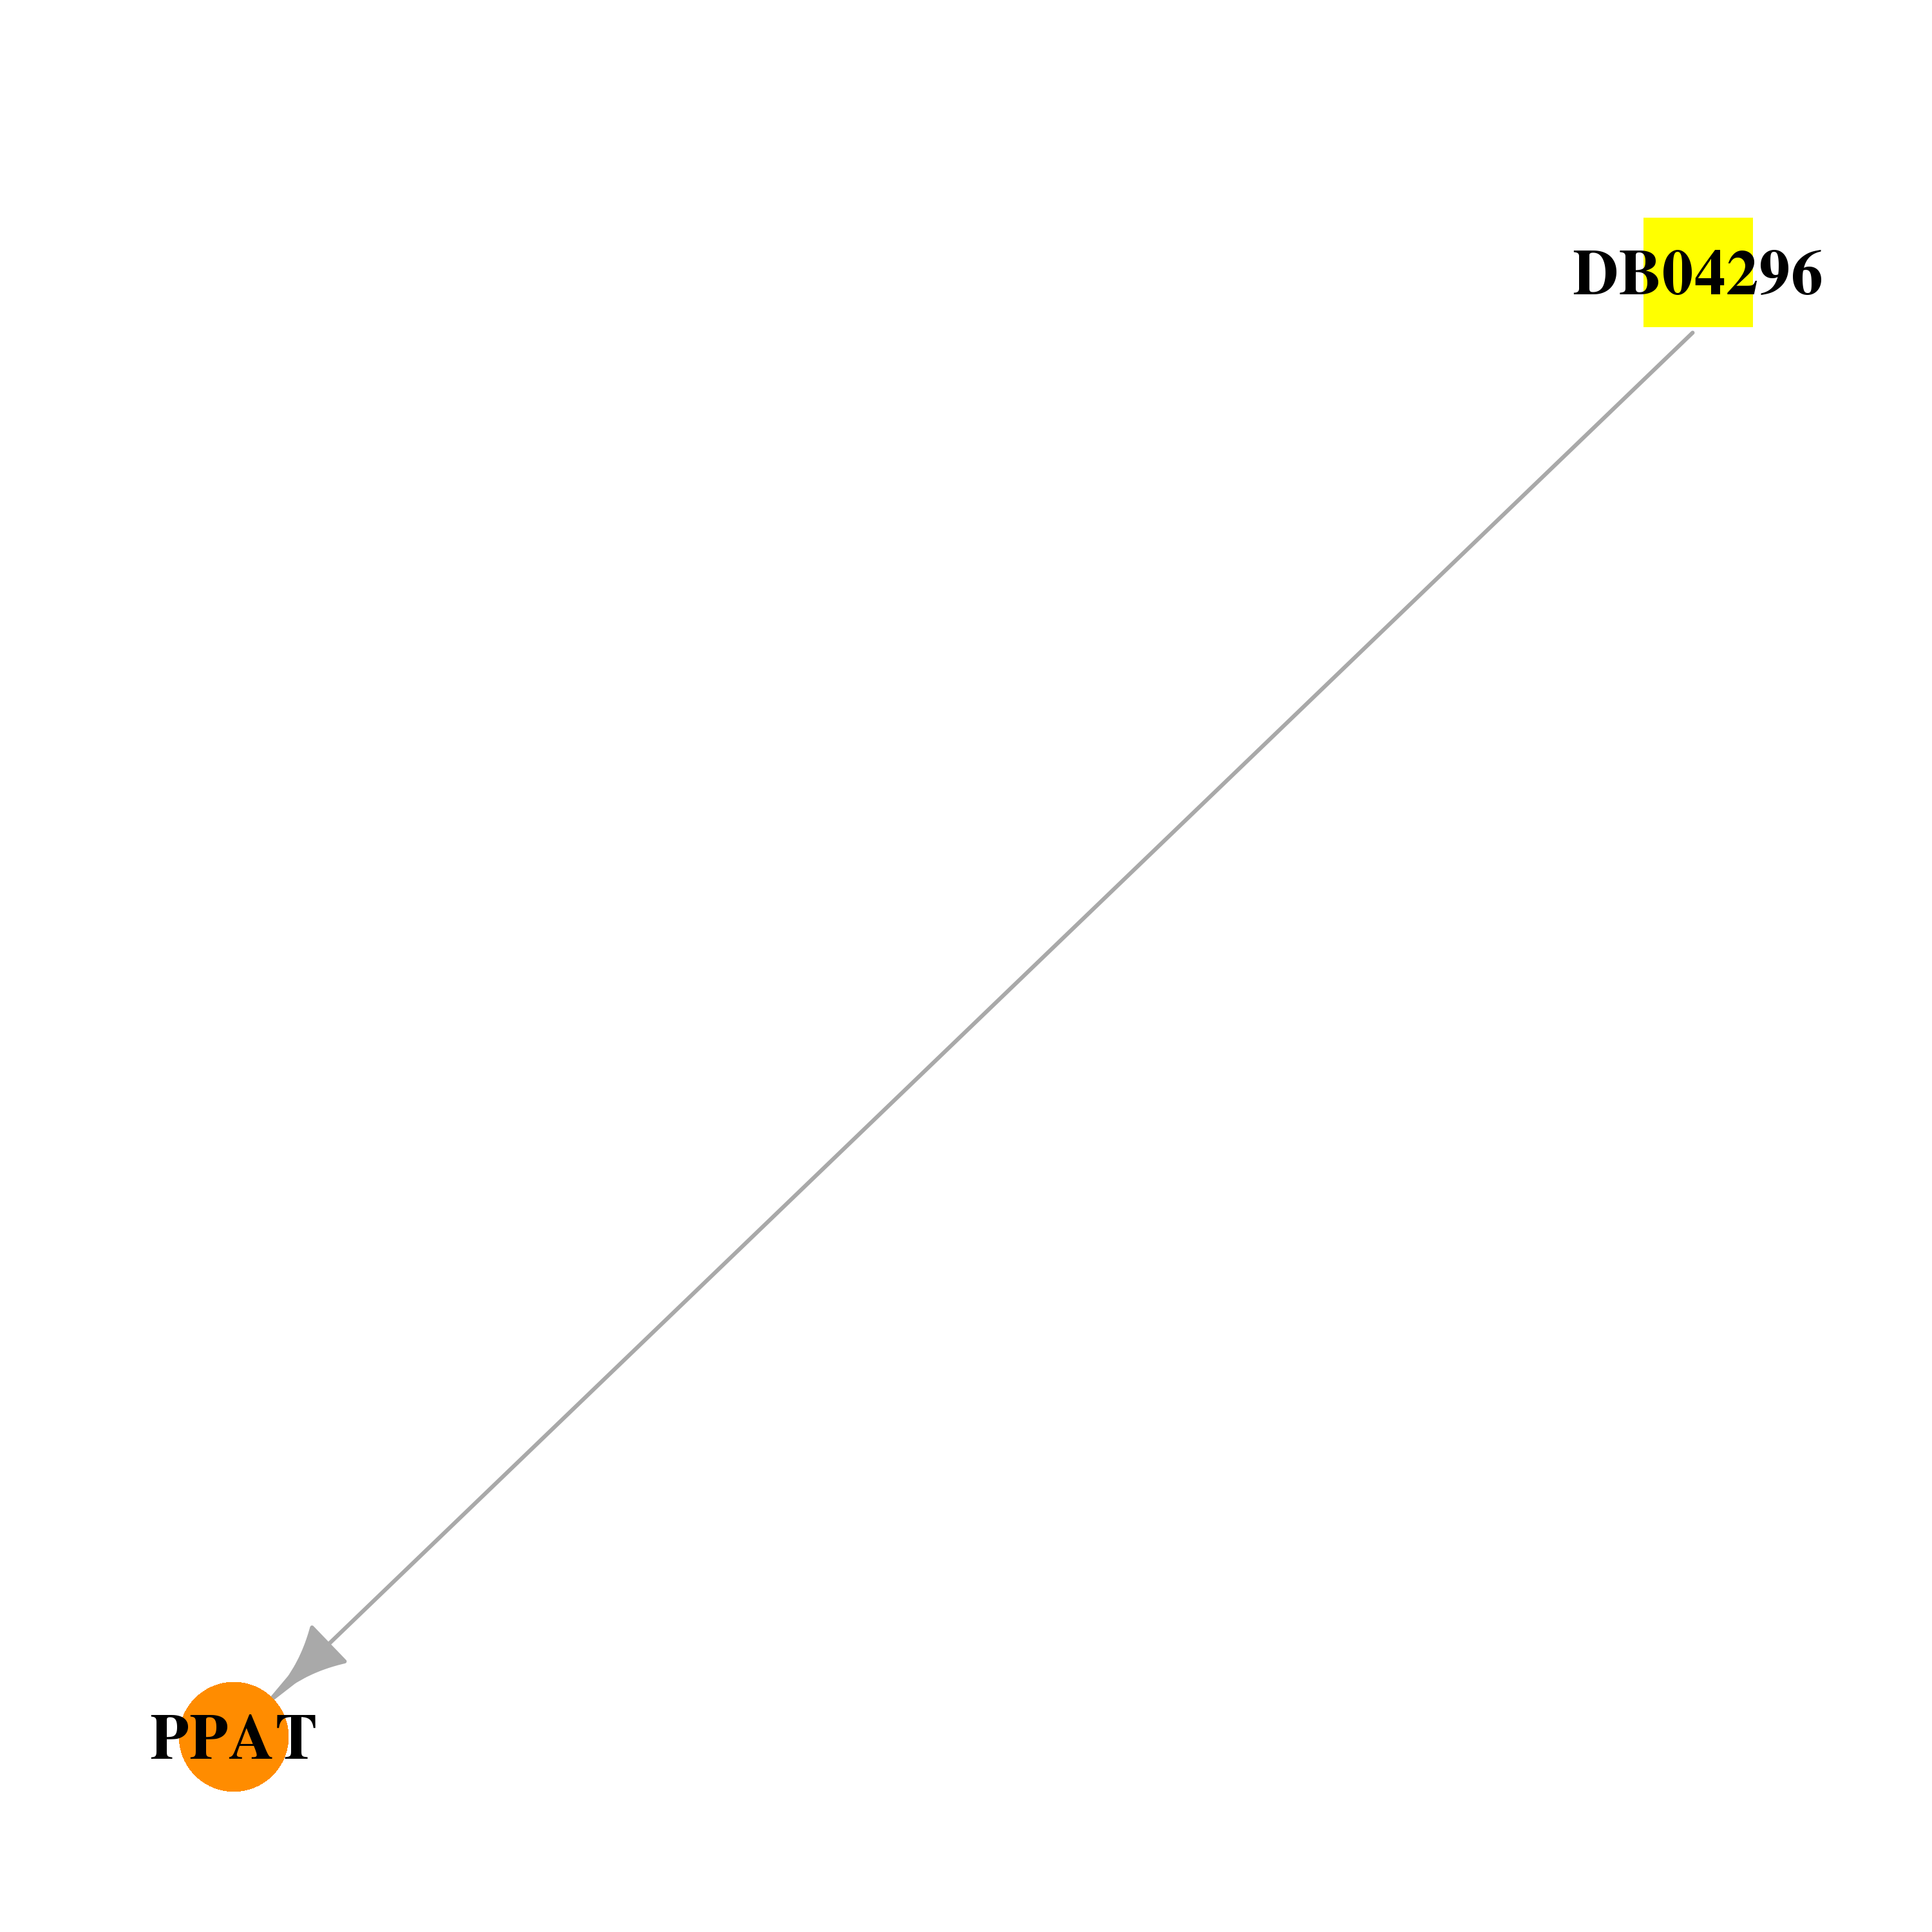 | 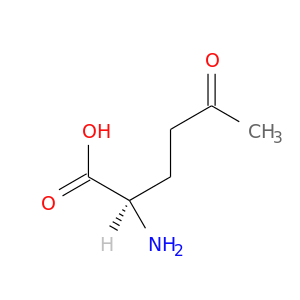 |
| DB00145 | phosphoribosyl pyrophosphate amidotransferase | approved; nutraceutical | Glycine |  |  |
| DB00563 | phosphoribosyl pyrophosphate amidotransferase | approved | Methotrexate |  |  |
| Top |
| Cross referenced IDs for PPAT |
| * We obtained these cross-references from Uniprot database. It covers 150 different DBs, 18 categories. http://www.uniprot.org/help/cross_references_section |
: Open all cross reference information
|
Copyright © 2016-Present - The Univsersity of Texas Health Science Center at Houston @ |