|
||||||||||||||||||||||||||||||||||||||||||||||||||||||||||||||||||||||||||||||||||||||||||||||||||||||||||||||||||||||||||||||||||||||||||||||||||||||||||||||||||||||||||||||||||||||||||||||||||||||||||||||||||||||||||||||||||||||||||||||||||||||||||||||||||||||||||||||||||||||||||||||||||||||||||||||||||||||||||
| |
| Phenotypic Information (metabolism pathway, cancer, disease, phenome) |
| |
| |
| Gene-Gene Network Information: Co-Expression Network, Interacting Genes & KEGG |
| |
|


| Gene Summary for ELOVL2 |
| Basic gene info. | Gene symbol | ELOVL2 |
| Gene name | ELOVL fatty acid elongase 2 | |
| Synonyms | SSC2 | |
| Cytomap | UCSC genome browser: 6p24.2 | |
| Genomic location | chr6 :10980992-11044624 | |
| Type of gene | protein-coding | |
| RefGenes | NM_017770.3, | |
| Ensembl id | ENSG00000197977 | |
| Description | 3-keto acyl-CoA synthase ELOVL2ELOVL FA elongase 2elongation of very long chain fatty acids (FEN1/Elo2, SUR4/Elo3, yeast)-like 2elongation of very long chain fatty acids protein 2very-long-chain 3-oxoacyl-CoA synthase 2 | |
| Modification date | 20141211 | |
| dbXrefs | MIM : 611814 | |
| HGNC : HGNC | ||
| Ensembl : ENSG00000197977 | ||
| HPRD : 16857 | ||
| Vega : OTTHUMG00000014252 | ||
| Protein | UniProt: go to UniProt's Cross Reference DB Table | |
| Expression | CleanEX: HS_ELOVL2 | |
| BioGPS: 54898 | ||
| Gene Expression Atlas: ENSG00000197977 | ||
| The Human Protein Atlas: ENSG00000197977 | ||
| Pathway | NCI Pathway Interaction Database: ELOVL2 | |
| KEGG: ELOVL2 | ||
| REACTOME: ELOVL2 | ||
| ConsensusPathDB | ||
| Pathway Commons: ELOVL2 | ||
| Metabolism | MetaCyc: ELOVL2 | |
| HUMANCyc: ELOVL2 | ||
| Regulation | Ensembl's Regulation: ENSG00000197977 | |
| miRBase: chr6 :10,980,992-11,044,624 | ||
| TargetScan: NM_017770 | ||
| cisRED: ENSG00000197977 | ||
| Context | iHOP: ELOVL2 | |
| cancer metabolism search in PubMed: ELOVL2 | ||
| UCL Cancer Institute: ELOVL2 | ||
| Assigned class in ccmGDB | C | |
| Top |
| Phenotypic Information for ELOVL2(metabolism pathway, cancer, disease, phenome) |
| Cancer | CGAP: ELOVL2 |
| Familial Cancer Database: ELOVL2 | |
| * This gene is included in those cancer gene databases. |
|
|
|
|
|
|
| ||||||||||||||||||||||||||||||||||||||||||||||||||||||||||||||||||||||||||||||||||||||||||||||||||||||||||||||||||||||||||||||||||||||||||||||||||||||||||||||||||||||||||||||||||||||||||||||||||||||||||||||||||||||||||||||||||||||||||||||||||||||||||||||||||||||||||||||||||||||||||||||||||||||||||||||||||||
Oncogene 1 | Significant driver gene in | |||||||||||||||||||||||||||||||||||||||||||||||||||||||||||||||||||||||||||||||||||||||||||||||||||||||||||||||||||||||||||||||||||||||||||||||||||||||||||||||||||||||||||||||||||||||||||||||||||||||||||||||||||||||||||||||||||||||||||||||||||||||||||||||||||||||||||||||||||||||||||||||||||||||||||||||||||||||||
| cf) number; DB name 1 Oncogene; http://nar.oxfordjournals.org/content/35/suppl_1/D721.long, 2 Tumor Suppressor gene; https://bioinfo.uth.edu/TSGene/, 3 Cancer Gene Census; http://www.nature.com/nrc/journal/v4/n3/abs/nrc1299.html, 4 CancerGenes; http://nar.oxfordjournals.org/content/35/suppl_1/D721.long, 5 Network of Cancer Gene; http://ncg.kcl.ac.uk/index.php, 1Therapeutic Vulnerabilities in Cancer; http://cbio.mskcc.org/cancergenomics/statius/ |
| REACTOME_METABOLISM_OF_LIPIDS_AND_LIPOPROTEINS | |
| OMIM | |
| Orphanet | |
| Disease | KEGG Disease: ELOVL2 |
| MedGen: ELOVL2 (Human Medical Genetics with Condition) | |
| ClinVar: ELOVL2 | |
| Phenotype | MGI: ELOVL2 (International Mouse Phenotyping Consortium) |
| PhenomicDB: ELOVL2 | |
| Mutations for ELOVL2 |
| * Under tables are showing count per each tissue to give us broad intuition about tissue specific mutation patterns.You can go to the detailed page for each mutation database's web site. |
| - Statistics for Tissue and Mutation type | Top |
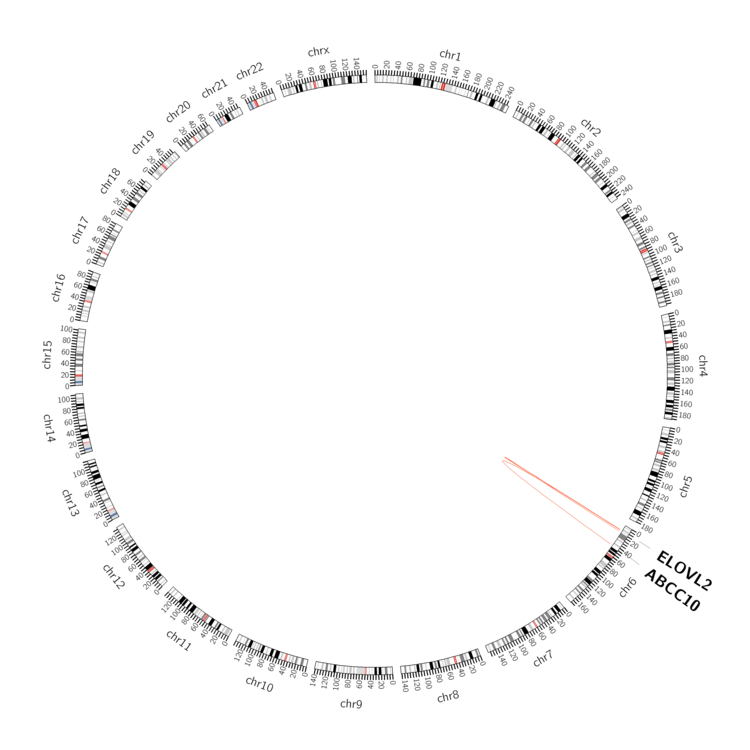 |
| - For Inter-chromosomal Variations |
| There's no inter-chromosomal structural variation. |
| - For Intra-chromosomal Variations |
| * Intra-chromosomal variantions includes 'intrachromosomal amplicon to amplicon', 'intrachromosomal amplicon to non-amplified dna', 'intrachromosomal deletion', 'intrachromosomal fold-back inversion', 'intrachromosomal inversion', 'intrachromosomal tandem duplication', 'Intrachromosomal unknown type', 'intrachromosomal with inverted orientation', 'intrachromosomal with non-inverted orientation'. |
 |
| Sample | Symbol_a | Chr_a | Start_a | End_a | Symbol_b | Chr_b | Start_b | End_b |
| pancreas | ELOVL2 | chr6 | 11005824 | 11005844 | ABCC10 | chr6 | 43396541 | 43396561 |
| prostate | ELOVL2 | chr6 | 11026593 | 11028593 | chr6 | 14180751 | 14182751 | |
| prostate | ELOVL2 | chr6 | 11027251 | 11029251 | chr6 | 11592523 | 11594523 |
| cf) Tissue number; Tissue name (1;Breast, 2;Central_nervous_system, 3;Haematopoietic_and_lymphoid_tissue, 4;Large_intestine, 5;Liver, 6;Lung, 7;Ovary, 8;Pancreas, 9;Prostate, 10;Skin, 11;Soft_tissue, 12;Upper_aerodigestive_tract) |
| * From mRNA Sanger sequences, Chitars2.0 arranged chimeric transcripts. This table shows ELOVL2 related fusion information. |
| ID | Head Gene | Tail Gene | Accession | Gene_a | qStart_a | qEnd_a | Chromosome_a | tStart_a | tEnd_a | Gene_a | qStart_a | qEnd_a | Chromosome_a | tStart_a | tEnd_a |
| Top |
| Mutation type/ Tissue ID | brca | cns | cerv | endome | haematopo | kidn | Lintest | liver | lung | ns | ovary | pancre | prost | skin | stoma | thyro | urina | |||
| Total # sample | 1 | 1 | 6 | 1 | ||||||||||||||||
| GAIN (# sample) | 1 | 1 | 1 | |||||||||||||||||
| LOSS (# sample) | 6 |
| cf) Tissue ID; Tissue type (1; Breast, 2; Central_nervous_system, 3; Cervix, 4; Endometrium, 5; Haematopoietic_and_lymphoid_tissue, 6; Kidney, 7; Large_intestine, 8; Liver, 9; Lung, 10; NS, 11; Ovary, 12; Pancreas, 13; Prostate, 14; Skin, 15; Stomach, 16; Thyroid, 17; Urinary_tract) |
| Top |
|
 |
| Top |
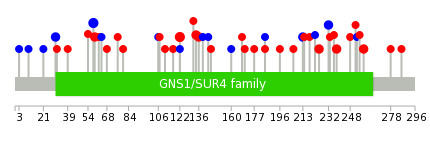
| Stat. for Non-Synonymous SNVs (# total SNVs=33) | (# total SNVs=11) |
 |  |
(# total SNVs=0) | (# total SNVs=0) |
| Top |
| * When you move the cursor on each content, you can see more deailed mutation information on the Tooltip. Those are primary_site,primary_histology,mutation(aa),pubmedID. |
| GRCh37 position | Mutation(aa) | Unique sampleID count |
| chr6:10995380-10995380 | p.S122F | 3 |
| chr6:11005686-11005686 | p.N58N | 3 |
| chr6:11005770-11005770 | p.F30F | 2 |
| chr6:10990062-10990062 | p.F213F | 2 |
| chr6:10995339-10995339 | p.R136W | 2 |
| chr6:10995345-10995345 | p.V134I | 2 |
| chr6:10989988-10989988 | p.Q238R | 2 |
| chr6:11005684-11005684 | p.R59I | 2 |
| chr6:10990005-10990005 | p.F232F | 2 |
| chr6:10984132-10984132 | p.R258Q | 2 |
| Top |
|
 |
| Point Mutation/ Tissue ID | 1 | 2 | 3 | 4 | 5 | 6 | 7 | 8 | 9 | 10 | 11 | 12 | 13 | 14 | 15 | 16 | 17 | 18 | 19 | 20 |
| # sample | 7 | 1 | 1 | 6 | 3 | 5 | 4 | 8 | ||||||||||||
| # mutation | 7 | 1 | 1 | 6 | 3 | 5 | 3 | 11 | ||||||||||||
| nonsynonymous SNV | 7 | 1 | 1 | 5 | 2 | 1 | 3 | 7 | ||||||||||||
| synonymous SNV | 1 | 1 | 4 | 4 |
| cf) Tissue ID; Tissue type (1; BLCA[Bladder Urothelial Carcinoma], 2; BRCA[Breast invasive carcinoma], 3; CESC[Cervical squamous cell carcinoma and endocervical adenocarcinoma], 4; COAD[Colon adenocarcinoma], 5; GBM[Glioblastoma multiforme], 6; Glioma Low Grade, 7; HNSC[Head and Neck squamous cell carcinoma], 8; KICH[Kidney Chromophobe], 9; KIRC[Kidney renal clear cell carcinoma], 10; KIRP[Kidney renal papillary cell carcinoma], 11; LAML[Acute Myeloid Leukemia], 12; LUAD[Lung adenocarcinoma], 13; LUSC[Lung squamous cell carcinoma], 14; OV[Ovarian serous cystadenocarcinoma ], 15; PAAD[Pancreatic adenocarcinoma], 16; PRAD[Prostate adenocarcinoma], 17; SKCM[Skin Cutaneous Melanoma], 18:STAD[Stomach adenocarcinoma], 19:THCA[Thyroid carcinoma], 20:UCEC[Uterine Corpus Endometrial Carcinoma]) |
| Top |
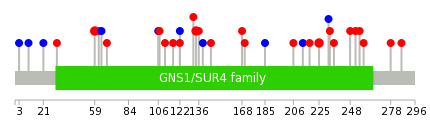
| * We represented just top 10 SNVs. When you move the cursor on each content, you can see more deailed mutation information on the Tooltip. Those are primary_site, primary_histology, mutation(aa), pubmedID. |
| Genomic Position | Mutation(aa) | Unique sampleID count |
| chr6:10995345 | p.V225M | 2 |
| chr6:11005684 | p.R59I | 2 |
| chr6:10990028 | p.V134I | 2 |
| chr6:11000322 | p.F252V | 1 |
| chr6:10989938 | p.F132I | 1 |
| chr6:10990671 | p.L248I | 1 |
| chr6:11000334 | p.S122S | 1 |
| chr6:10989947 | p.I236V | 1 |
| chr6:10995243 | p.S122F | 1 |
| chr6:11000335 | p.G233S | 1 |
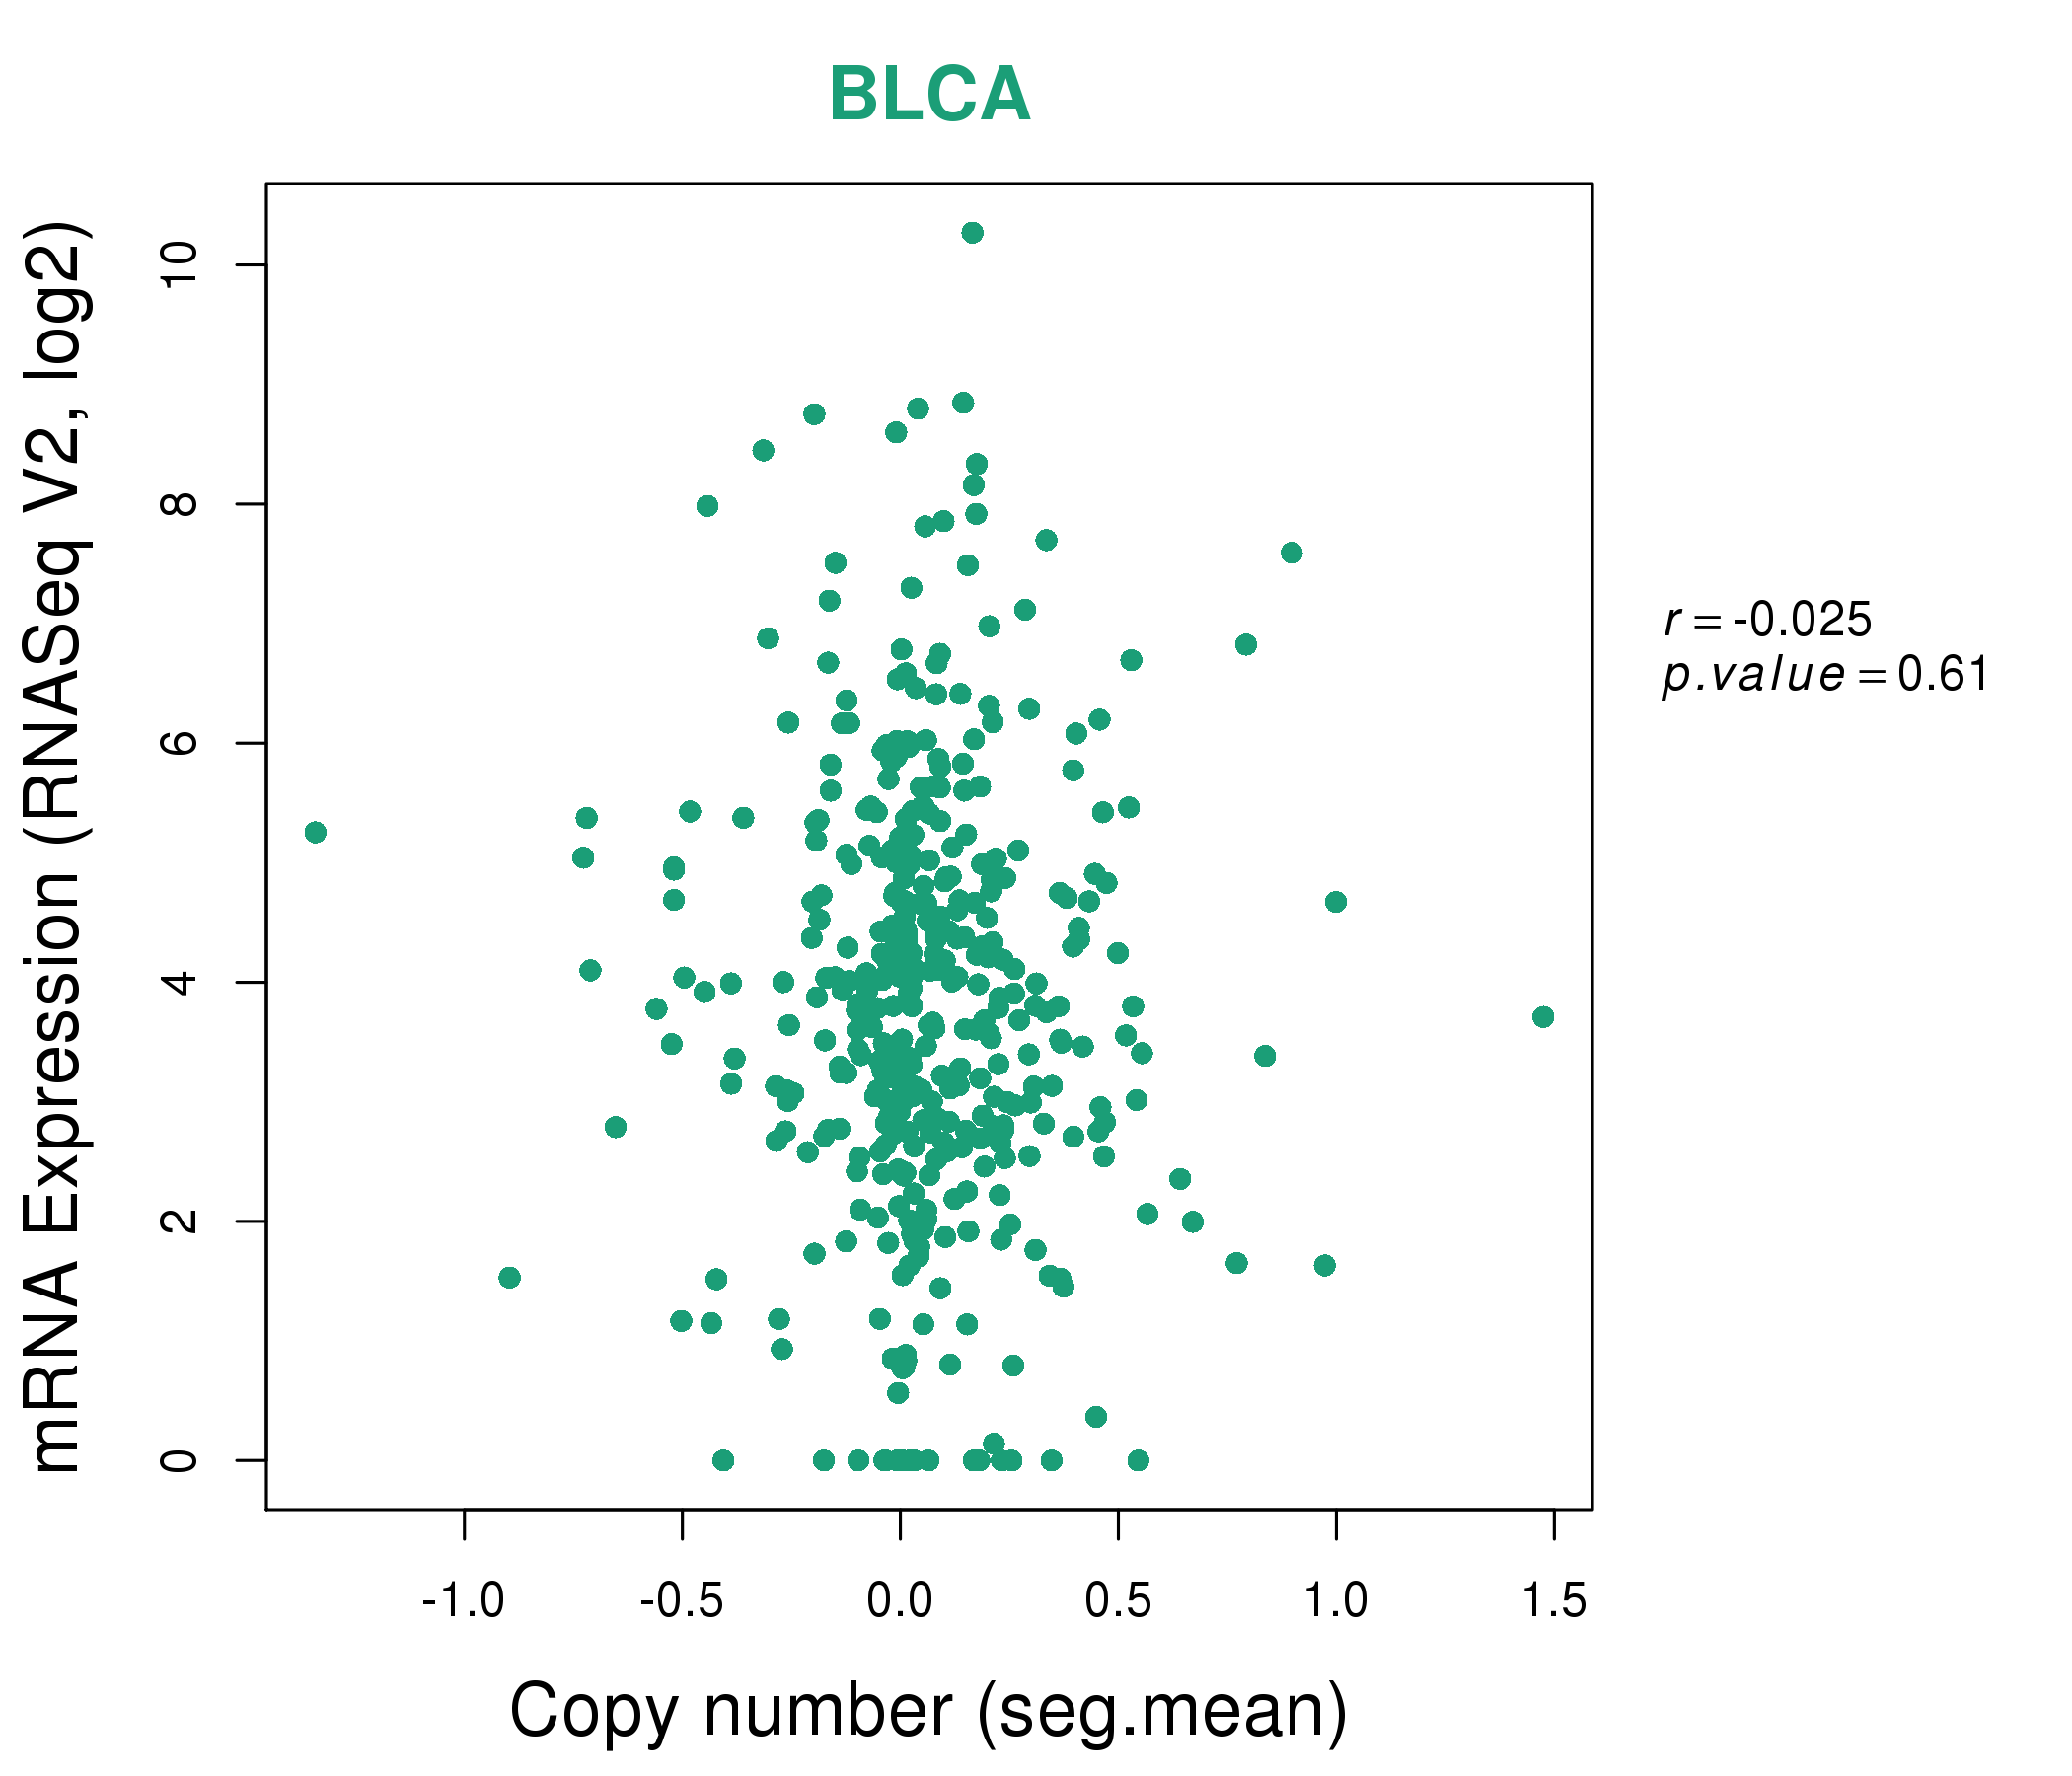
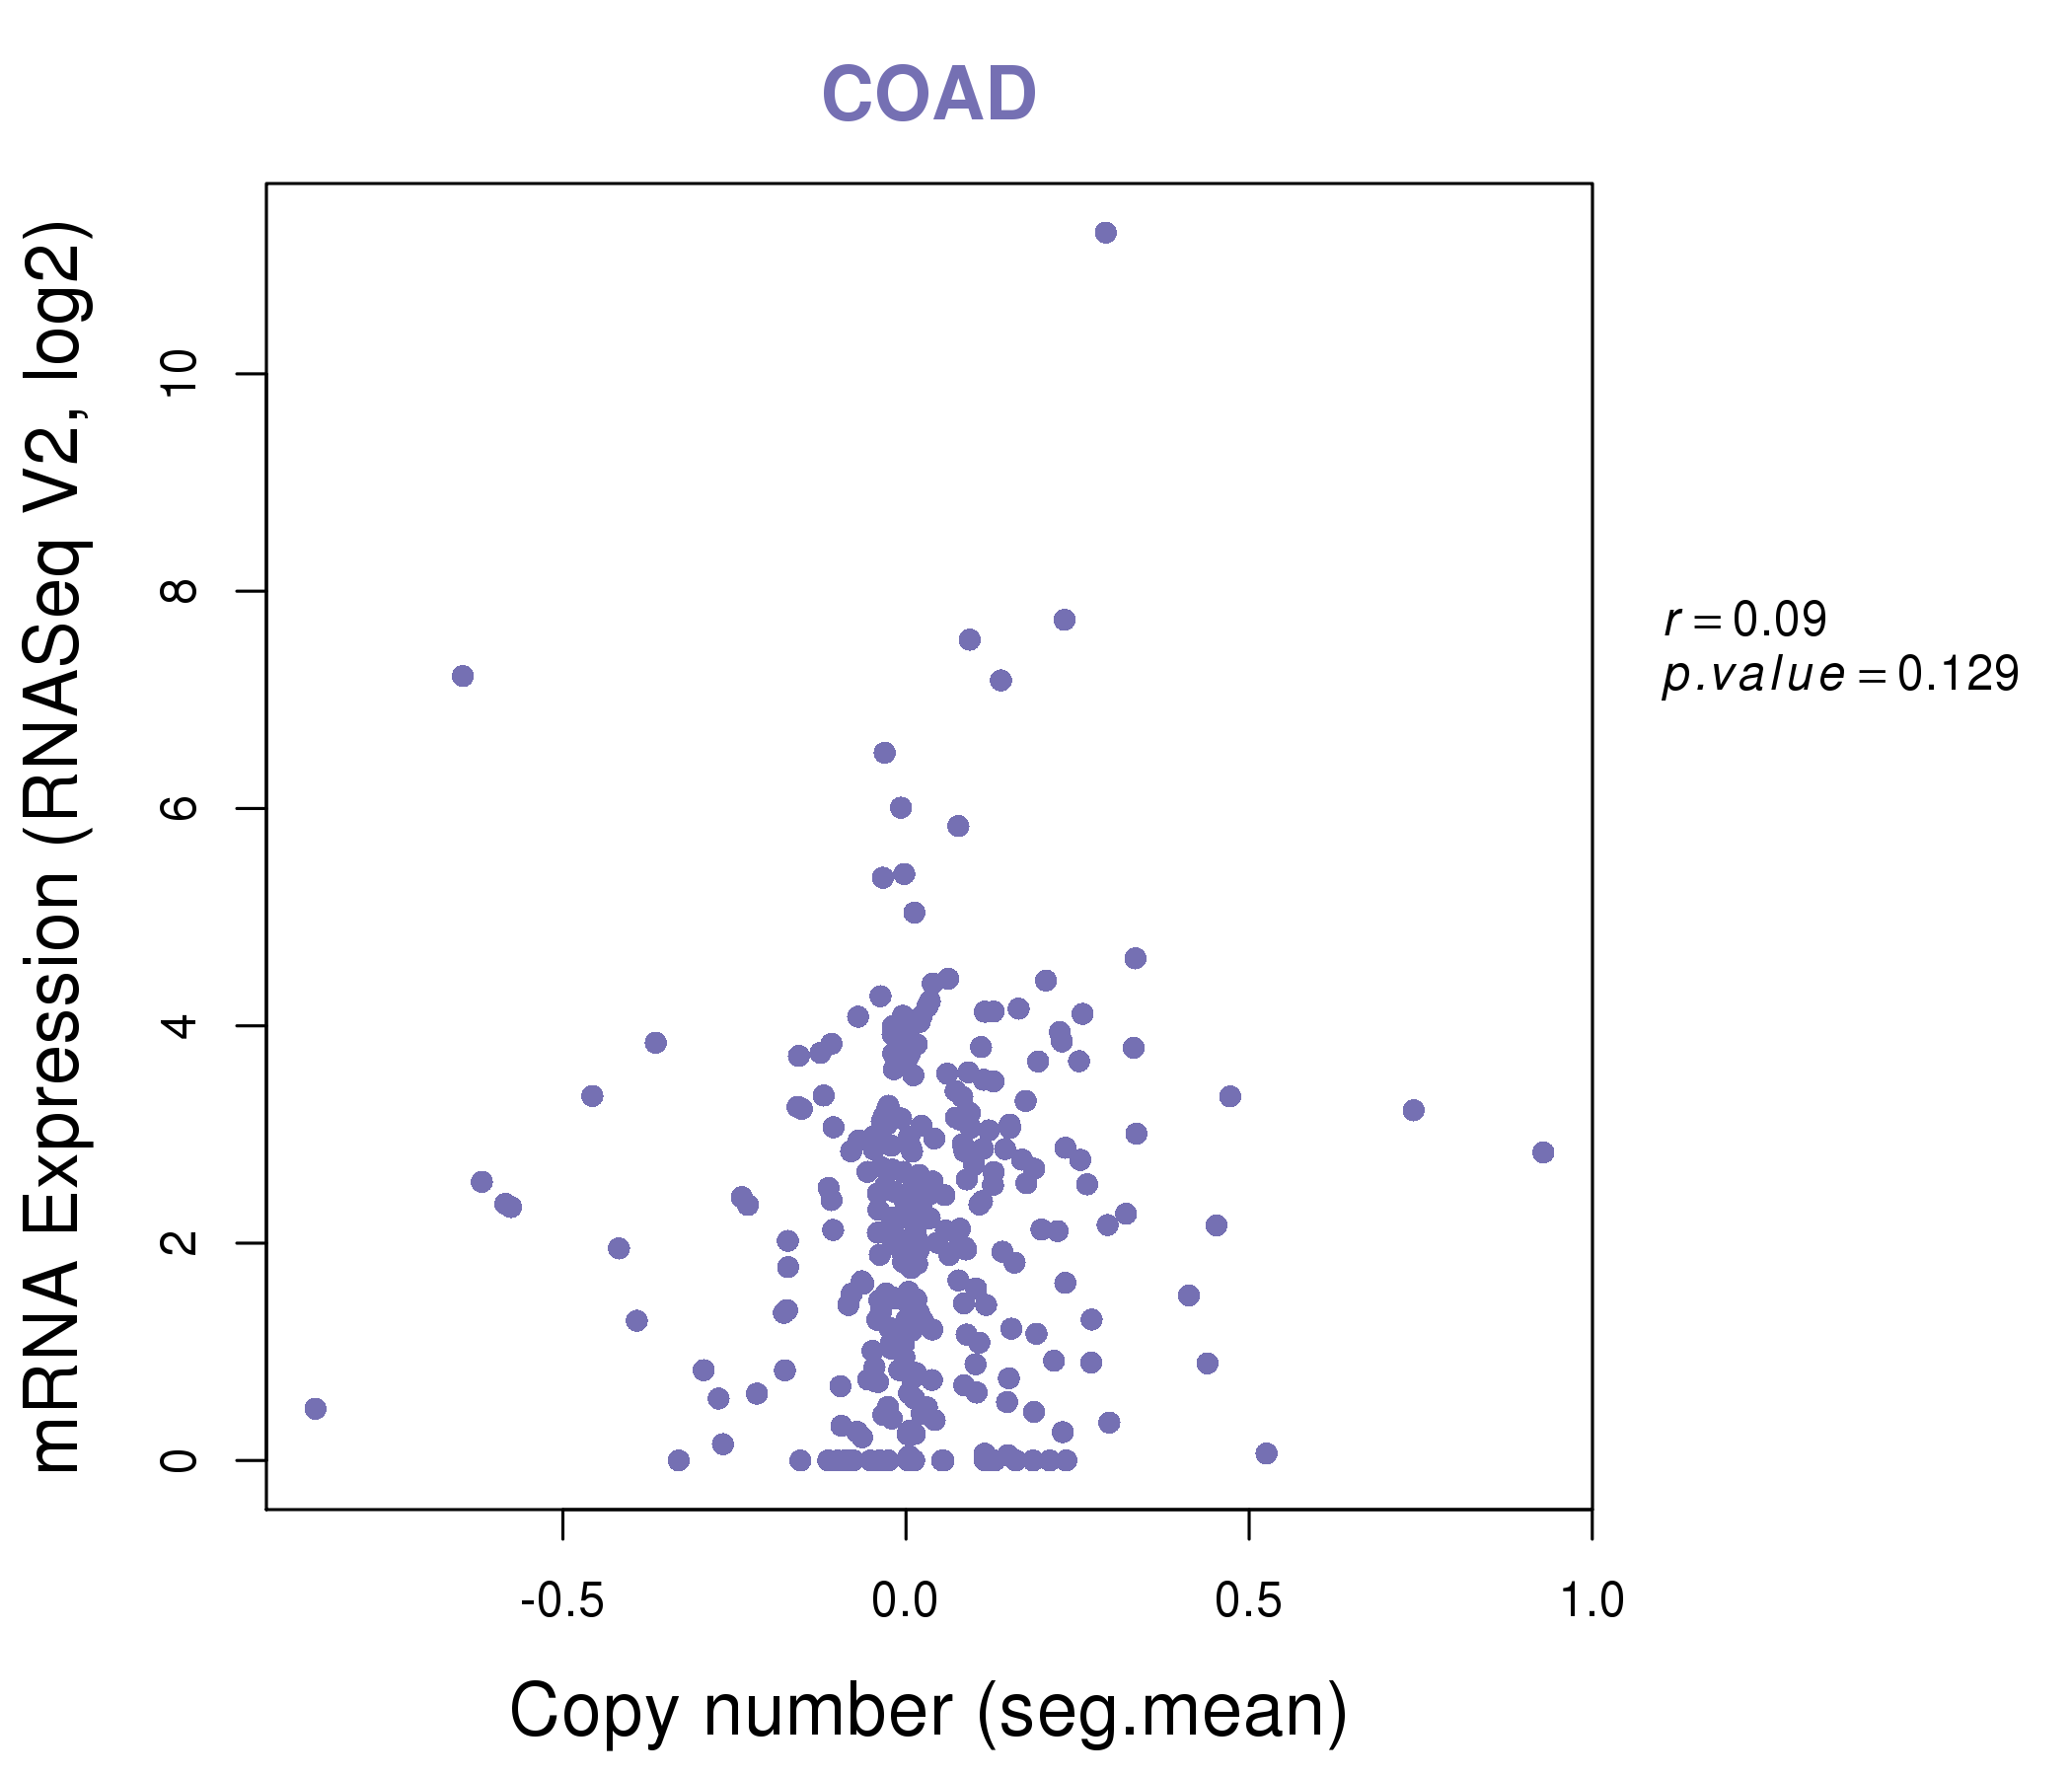
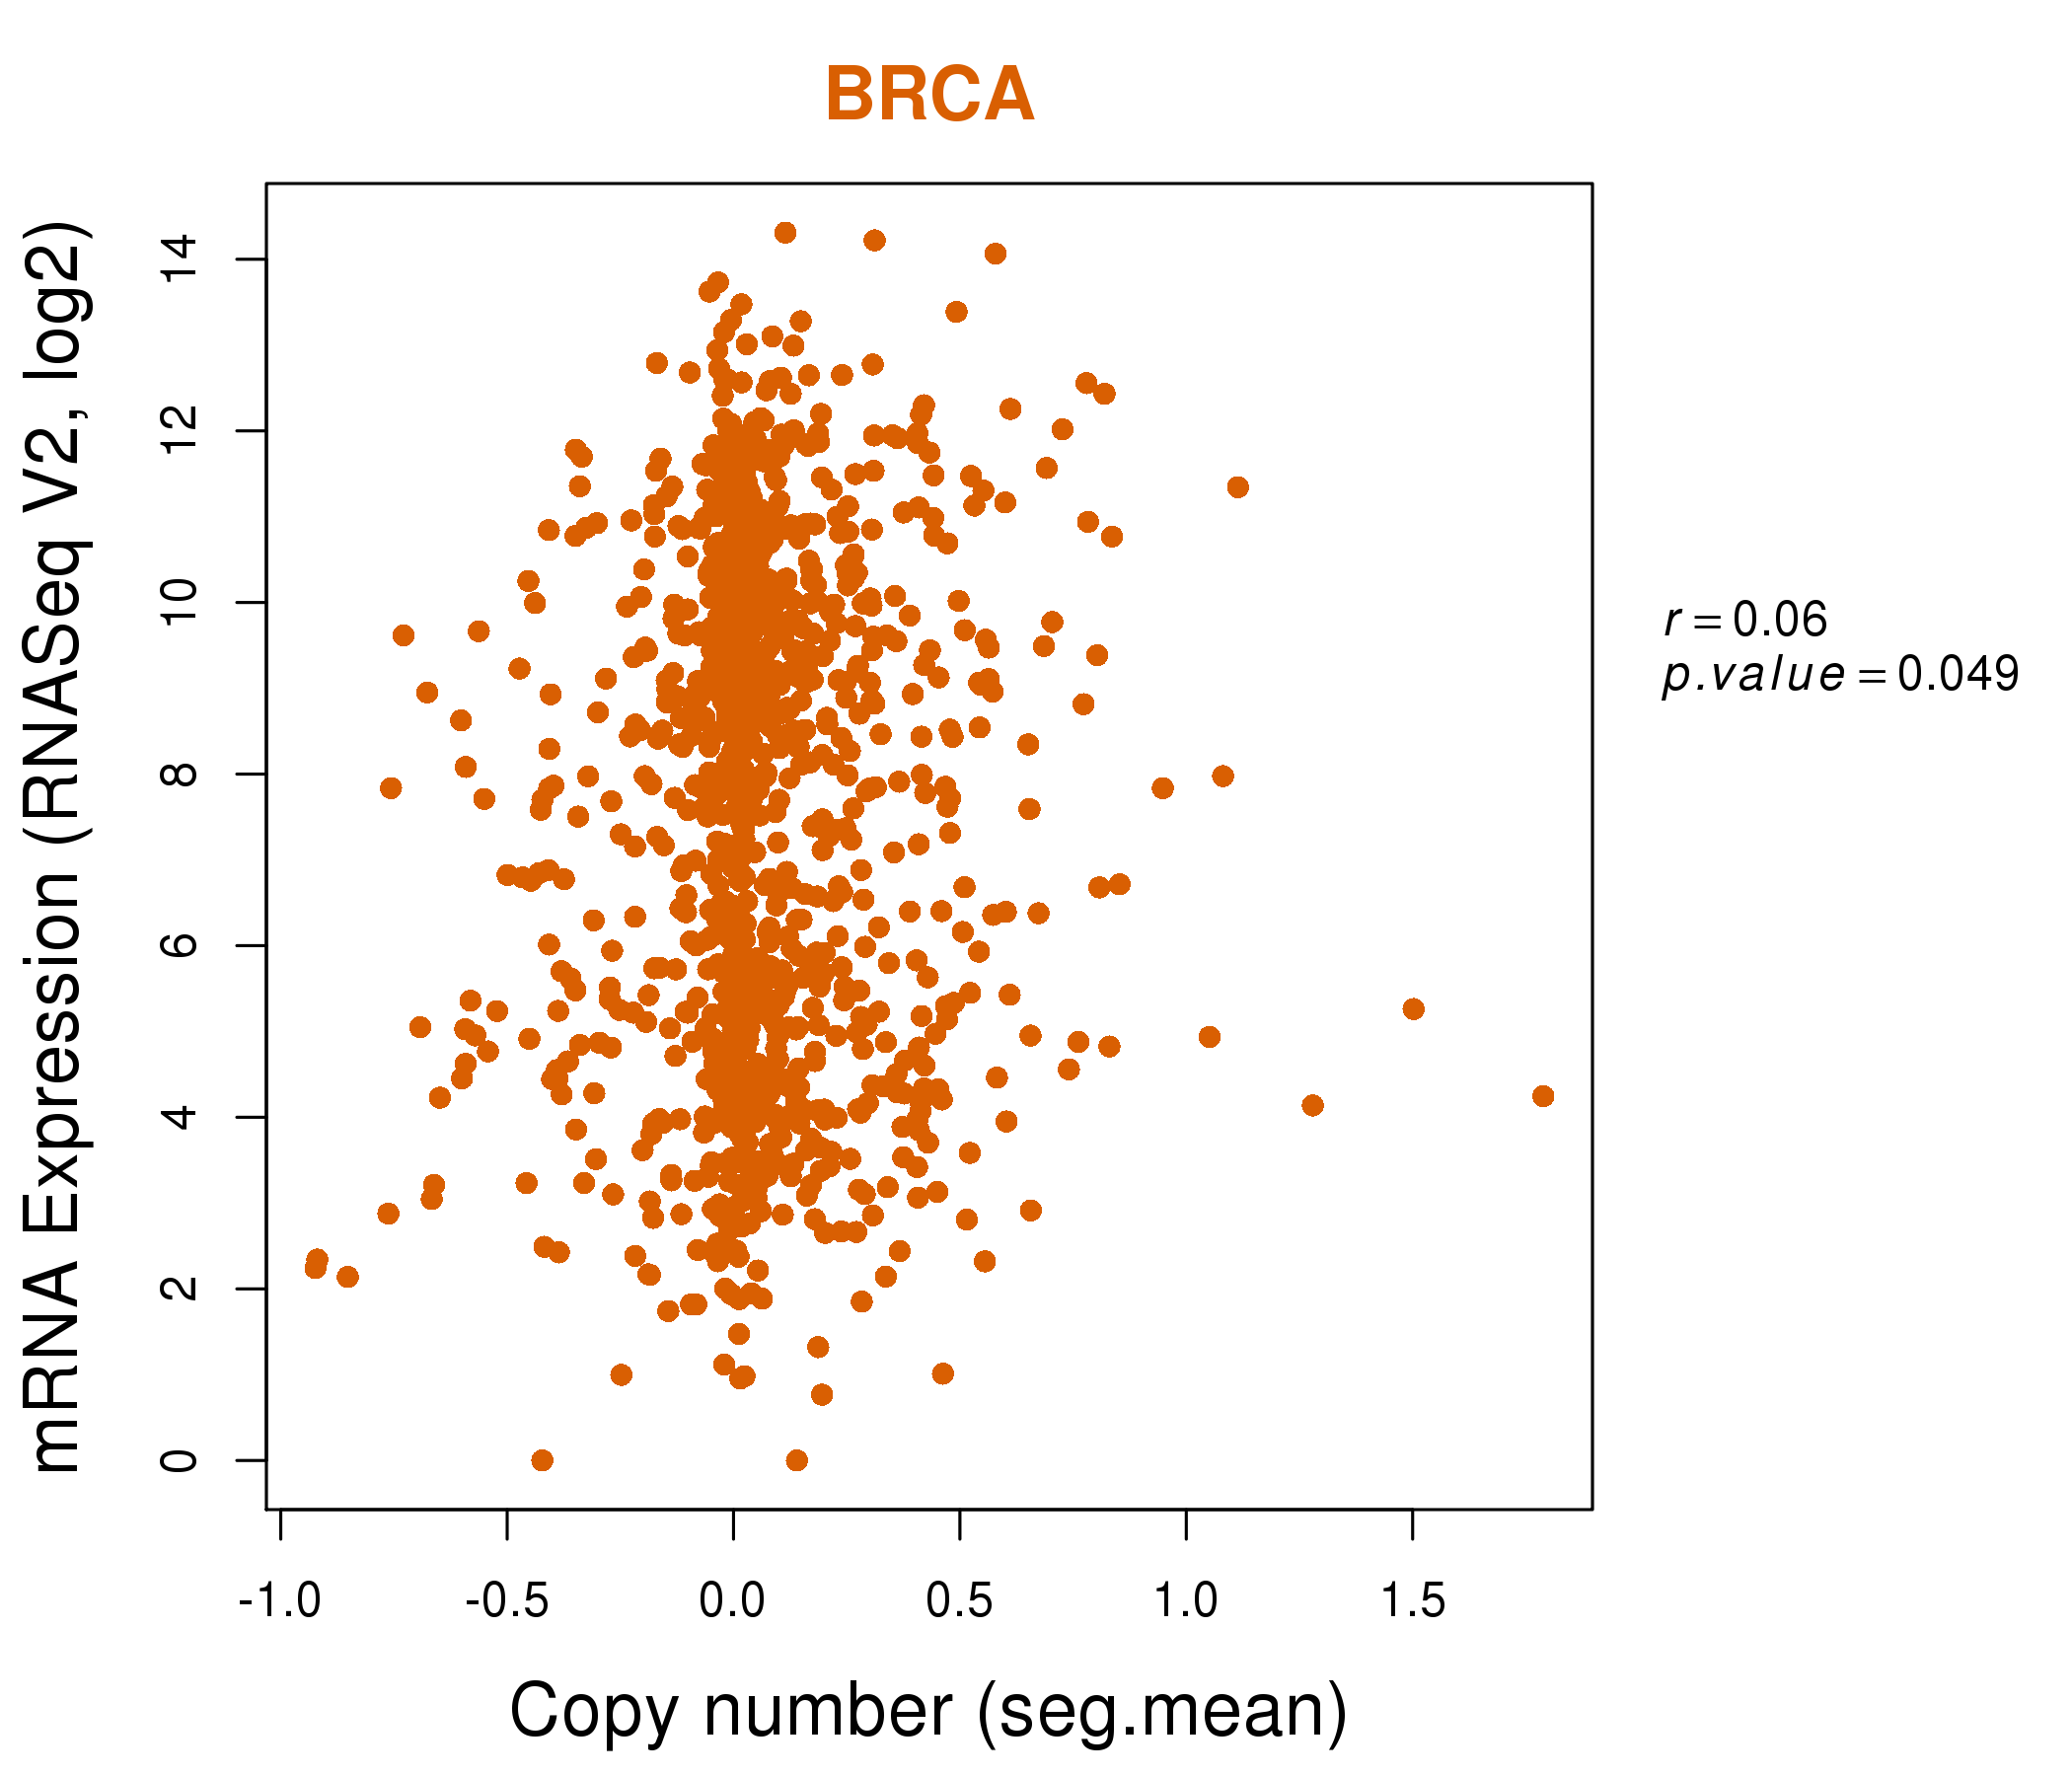
| * Copy number data were extracted from TCGA using R package TCGA-Assembler. The URLs of all public data files on TCGA DCC data server were gathered on Jan-05-2015. Function ProcessCNAData in TCGA-Assembler package was used to obtain gene-level copy number value which is calculated as the average copy number of the genomic region of a gene. |
 |
| cf) Tissue ID[Tissue type]: BLCA[Bladder Urothelial Carcinoma], BRCA[Breast invasive carcinoma], CESC[Cervical squamous cell carcinoma and endocervical adenocarcinoma], COAD[Colon adenocarcinoma], GBM[Glioblastoma multiforme], Glioma Low Grade, HNSC[Head and Neck squamous cell carcinoma], KICH[Kidney Chromophobe], KIRC[Kidney renal clear cell carcinoma], KIRP[Kidney renal papillary cell carcinoma], LAML[Acute Myeloid Leukemia], LUAD[Lung adenocarcinoma], LUSC[Lung squamous cell carcinoma], OV[Ovarian serous cystadenocarcinoma ], PAAD[Pancreatic adenocarcinoma], PRAD[Prostate adenocarcinoma], SKCM[Skin Cutaneous Melanoma], STAD[Stomach adenocarcinoma], THCA[Thyroid carcinoma], UCEC[Uterine Corpus Endometrial Carcinoma] |
| Top |
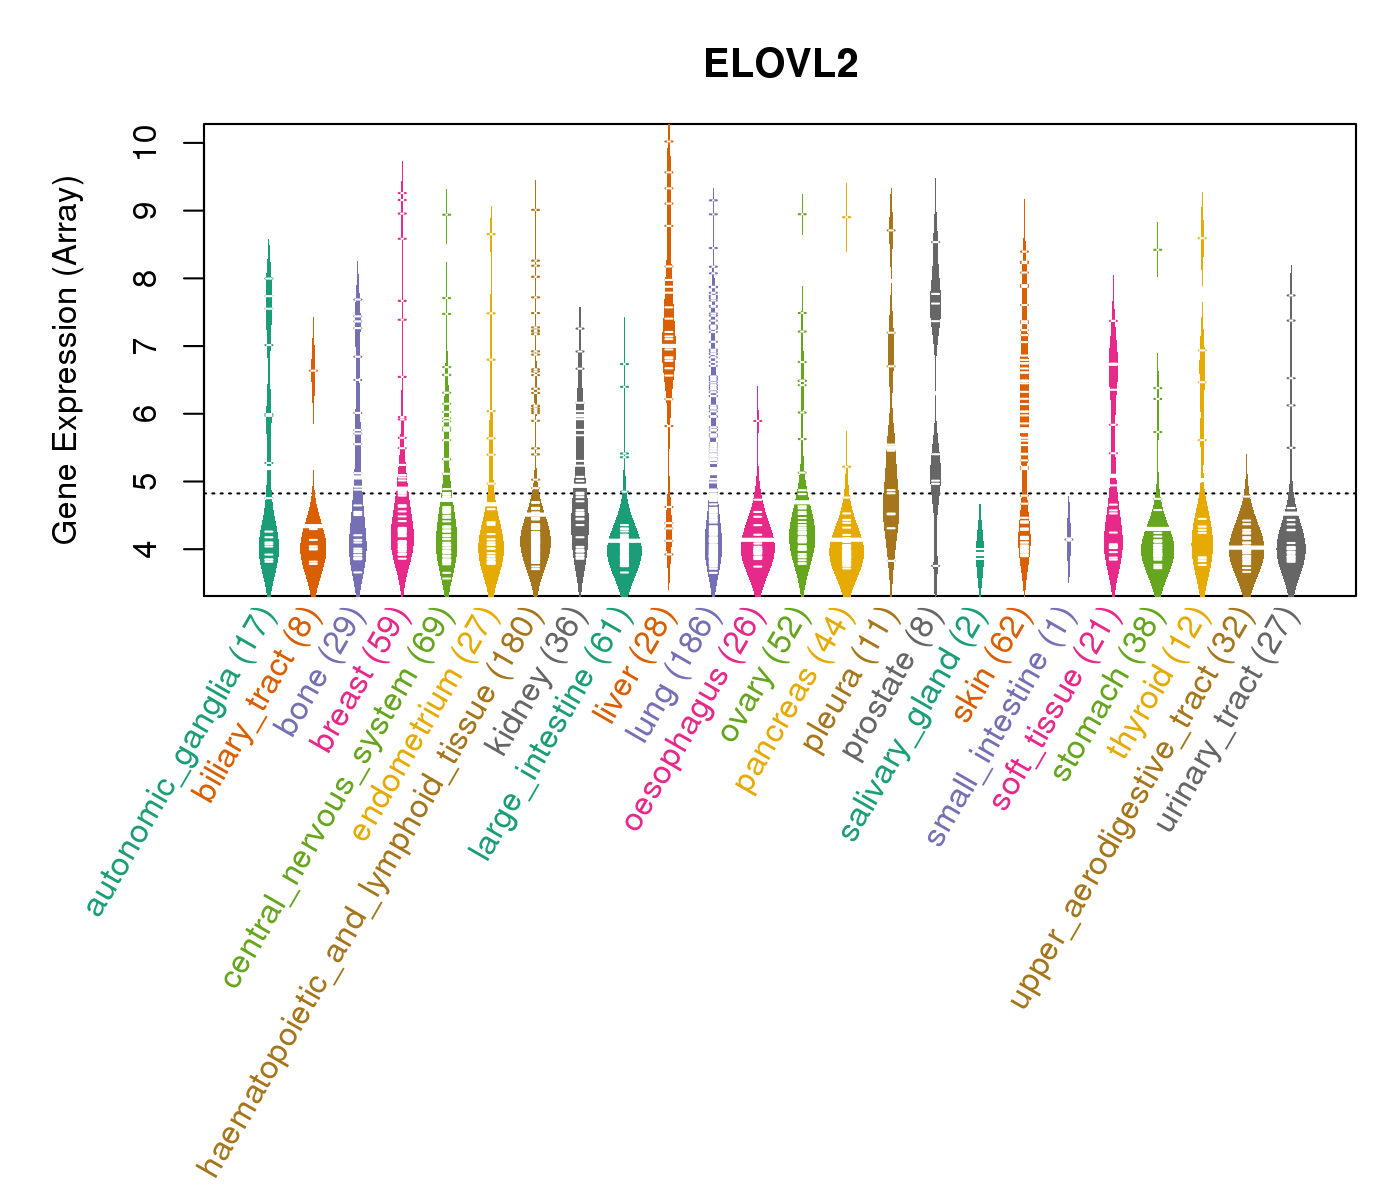
| Gene Expression for ELOVL2 |
| * CCLE gene expression data were extracted from CCLE_Expression_Entrez_2012-10-18.res: Gene-centric RMA-normalized mRNA expression data. |
 |
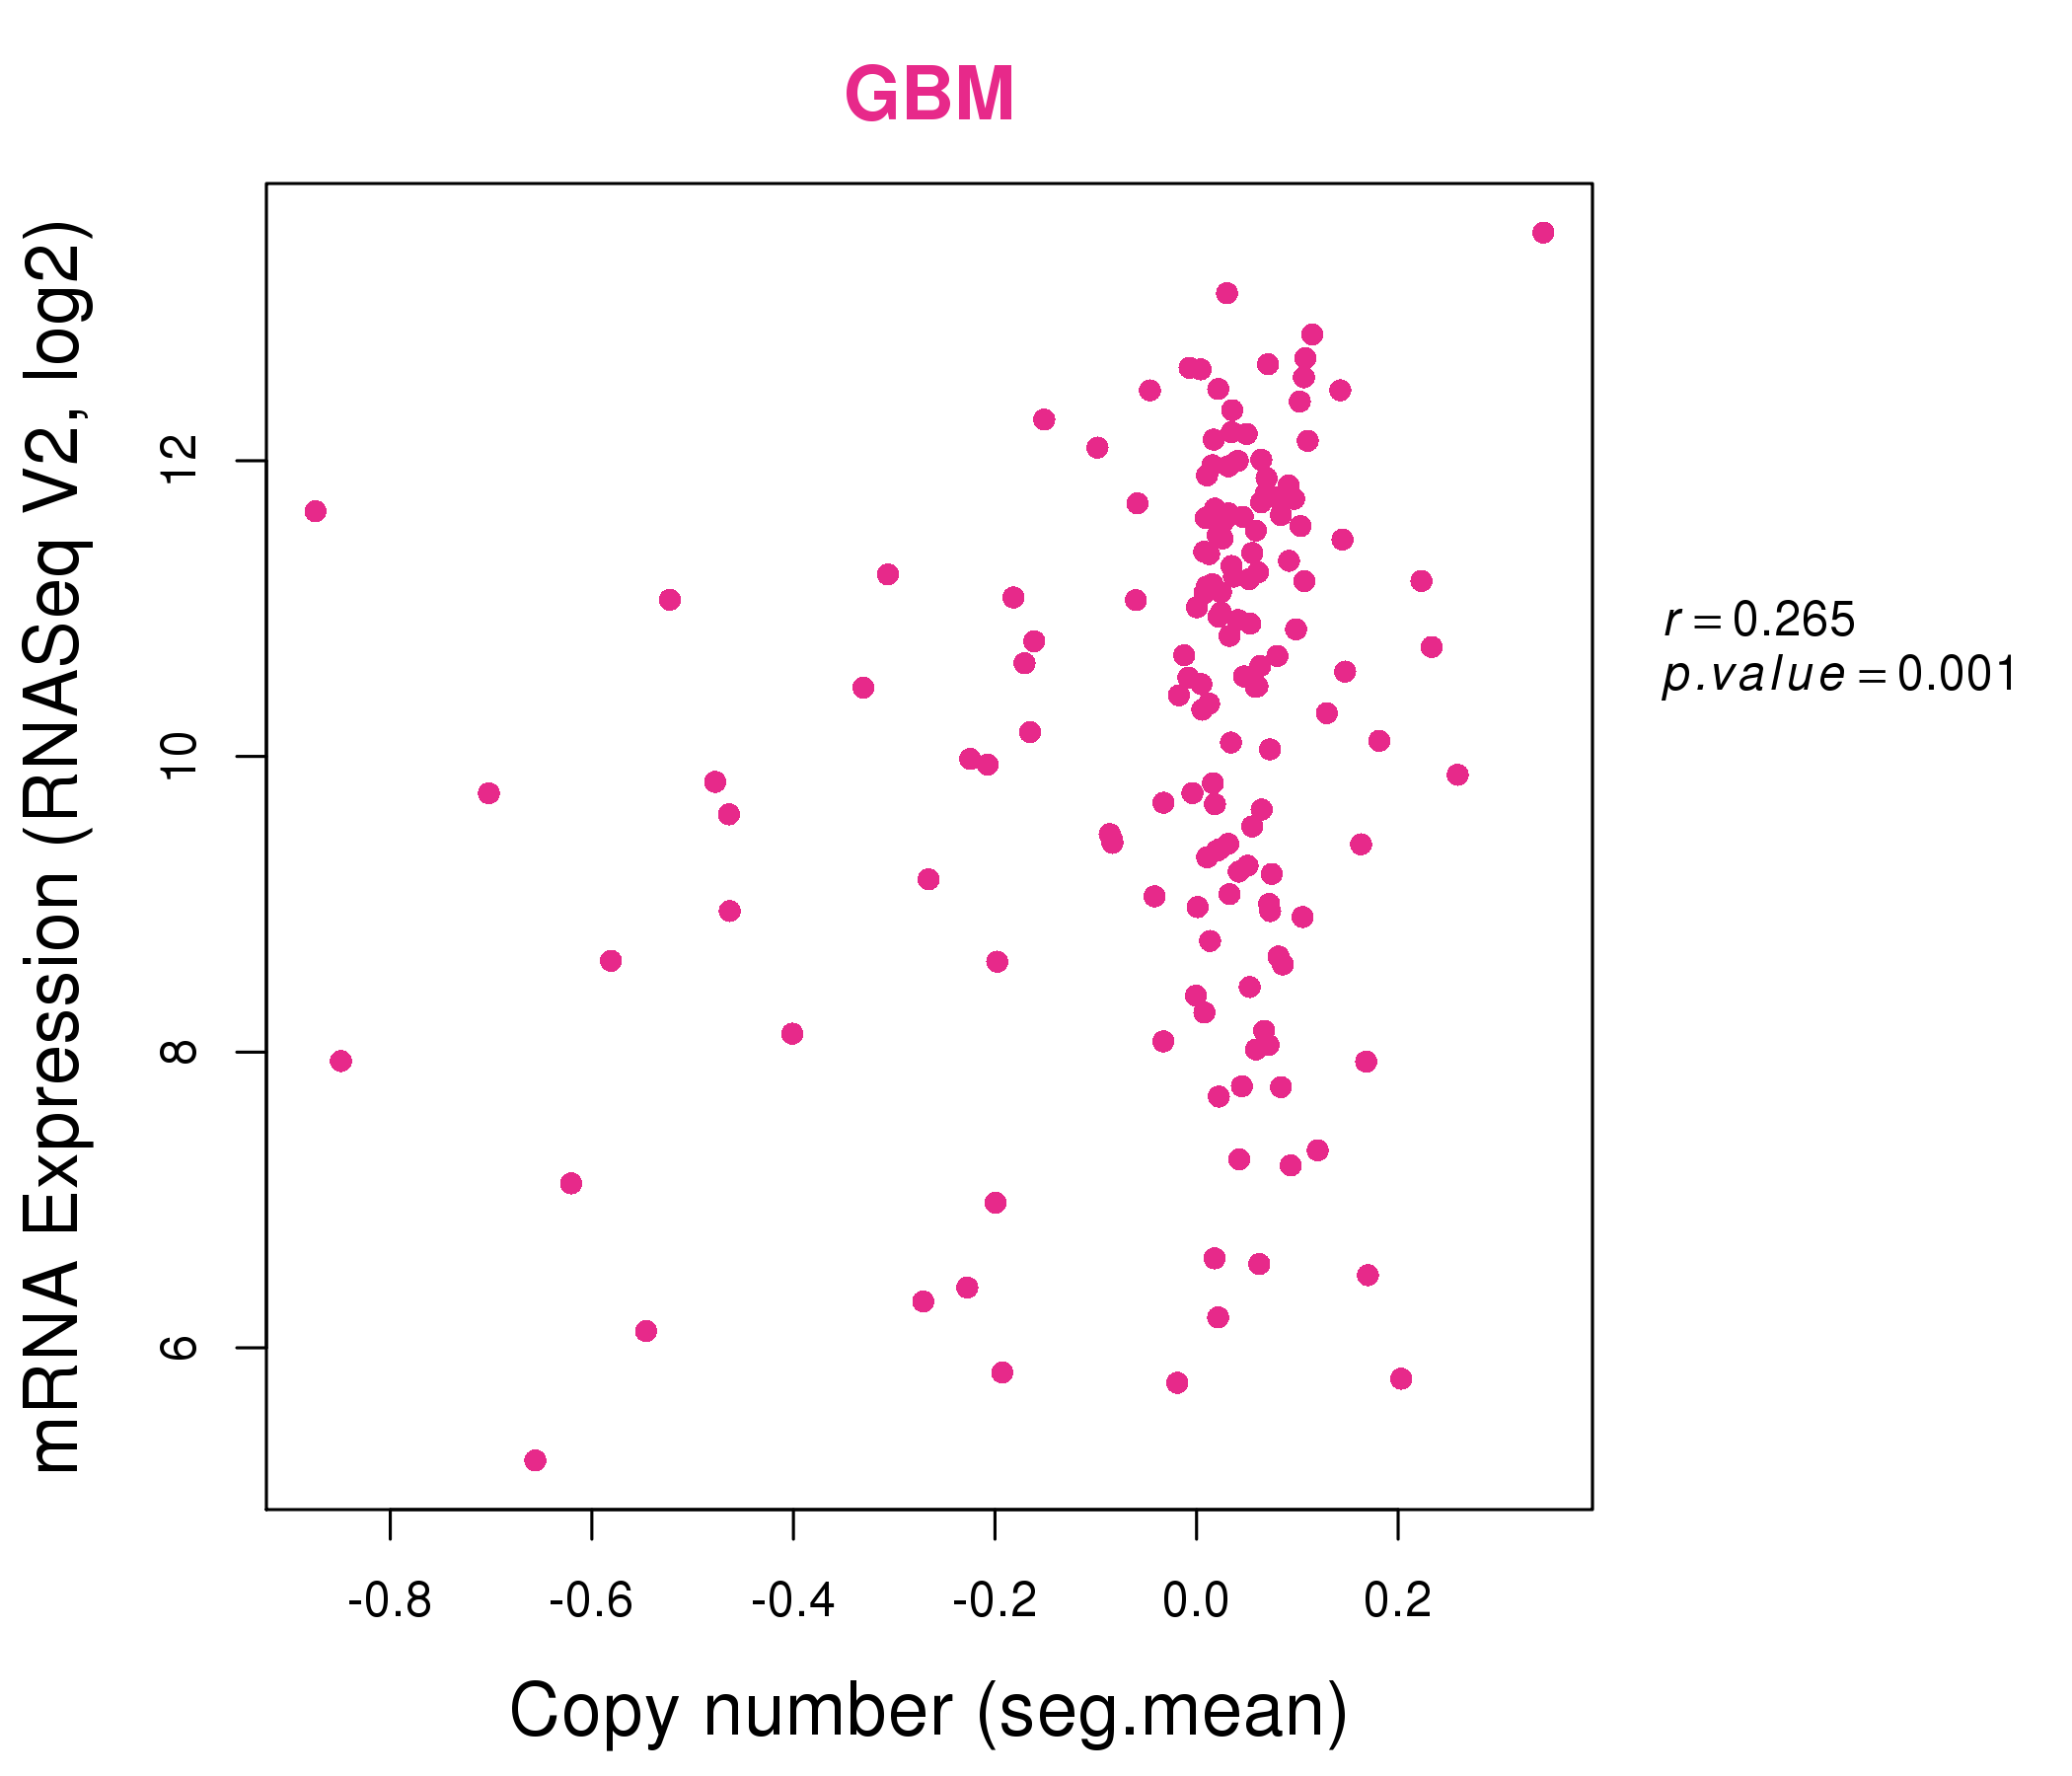
| * Normalized gene expression data of RNASeqV2 was extracted from TCGA using R package TCGA-Assembler. The URLs of all public data files on TCGA DCC data server were gathered at Jan-05-2015. Only eight cancer types have enough normal control samples for differential expression analysis. (t test, adjusted p<0.05 (using Benjamini-Hochberg FDR)) |
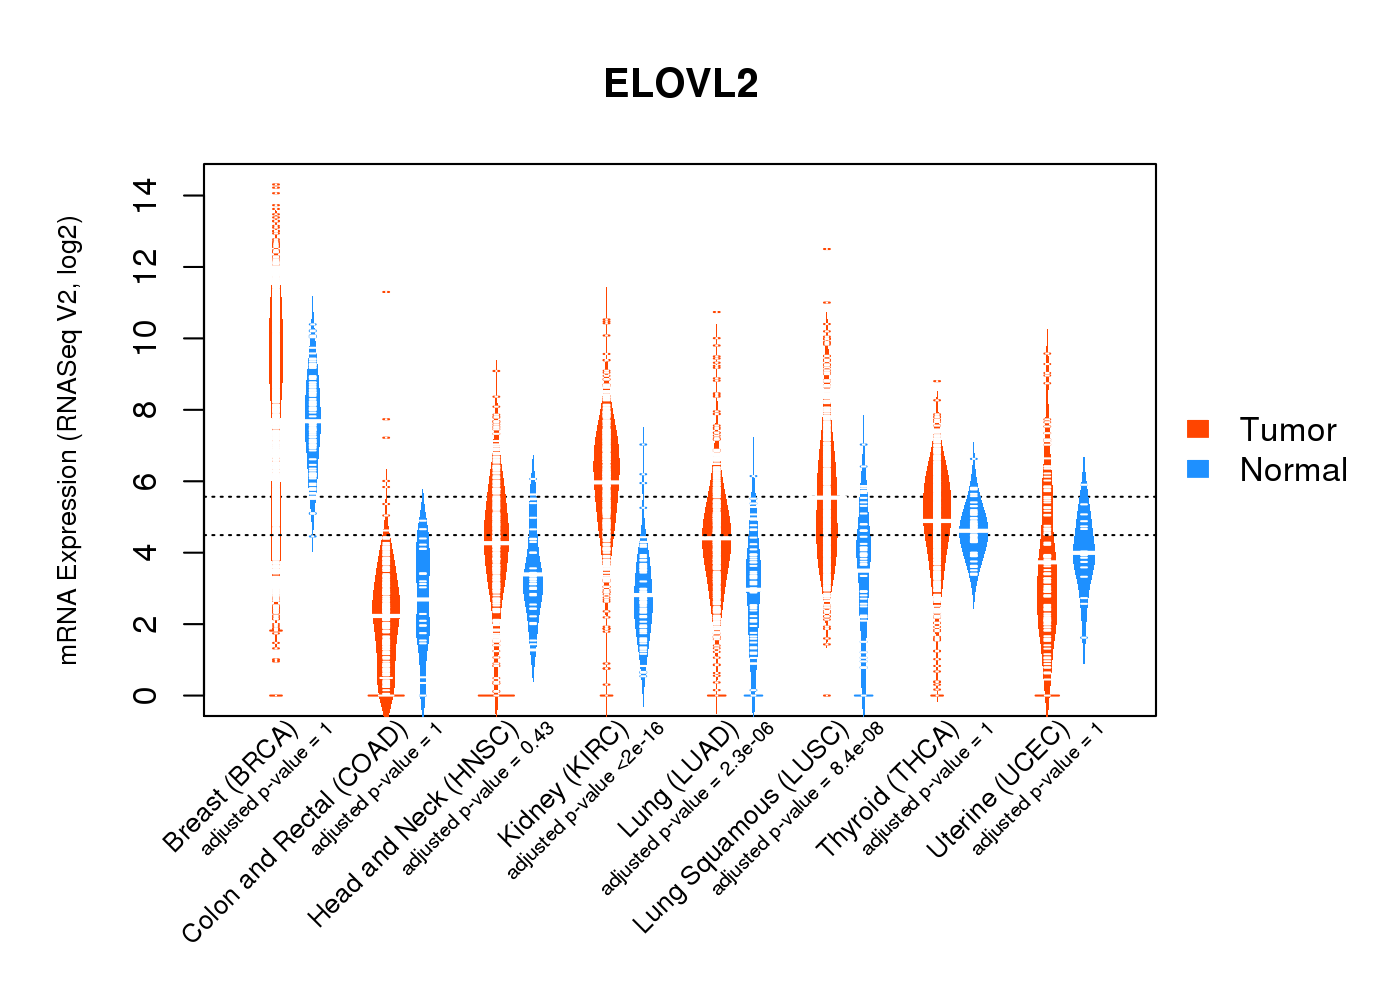 |
| Top |
| * This plots show the correlation between CNV and gene expression. |
: Open all plots for all cancer types
 |
|
 |
|
| Top |
| Gene-Gene Network Information |
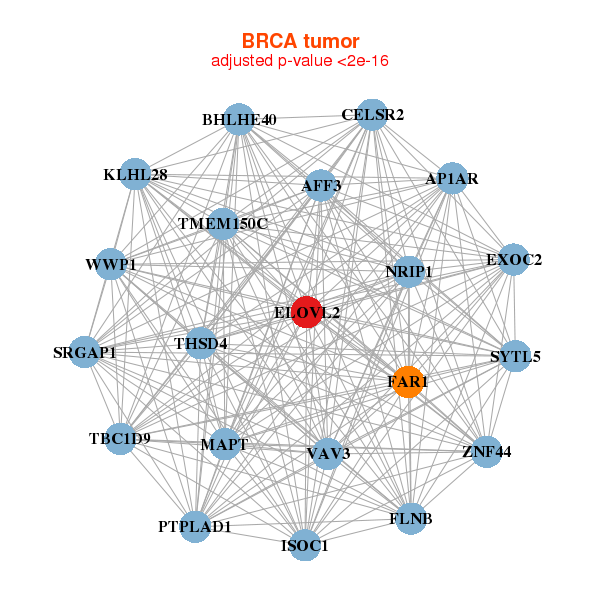
| * Co-Expression network figures were drawn using R package igraph. Only the top 20 genes with the highest correlations were shown. Red circle: input gene, orange circle: cell metabolism gene, sky circle: other gene |
: Open all plots for all cancer types
 |
|
| AFF3,AP1AR,BHLHE40,CELSR2,ELOVL2,EXOC2,FAR1, FLNB,ISOC1,KLHL28,MAPT,NRIP1,PTPLAD1,SRGAP1, SYTL5,TBC1D9,THSD4,TMEM150C,VAV3,WWP1,ZNF44 | AGR2,CA8,CELSR1,CT62,ELOVL2,FLNB,IL17RB, ITIH6,LPPR3,MAGED2,MYB,NXNL2,PREX1,SGK3, SLC39A6,TBC1D9,TMEM26,EWSAT1,TSPAN13,XBP1,ZNF92 |
 |
|
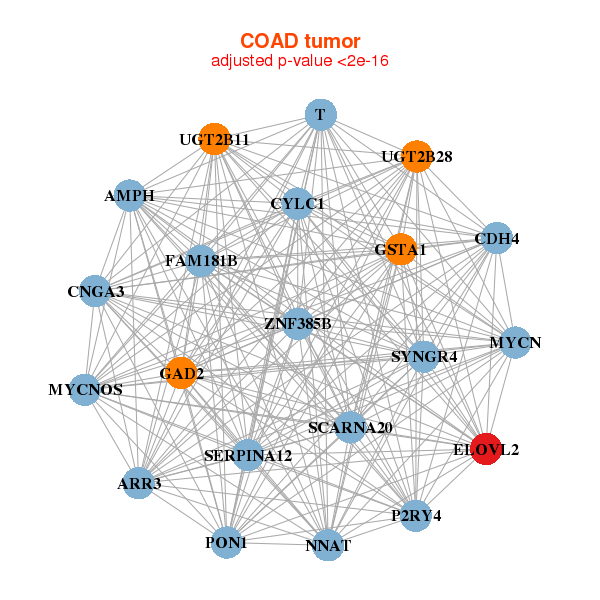
| AMPH,ARR3,CDH4,CNGA3,CYLC1,ELOVL2,FAM181B, GAD2,GSTA1,MYCN,MYCNOS,NNAT,P2RY4,PON1, SCARNA20,SERPINA12,SYNGR4,T,UGT2B11,UGT2B28,ZNF385B | ADAMTS8,C7,CITED4,CNTLN,CTF1,DZIP1,ELOVL2, FZD7,GALNT16,LHFP,PBX3,CPQ,PRIMA1,PTPRZ1, RGS5,RIMKLB,RNF165,SHC4,SLC35F1,TCEAL3,TYRO3 |

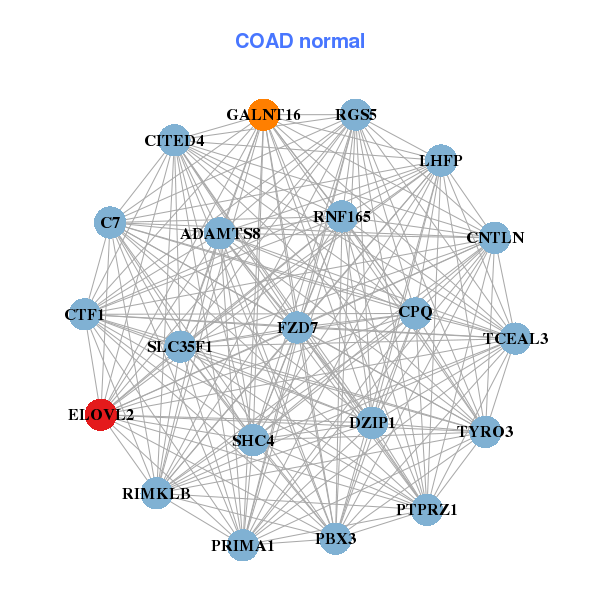
| * Co-Expression network figures were drawn using R package igraph. Only the top 20 genes with the highest correlations were shown. Red circle: input gene, orange circle: cell metabolism gene, sky circle: other gene |
: Open all plots for all cancer types
| Top |
: Open all interacting genes' information including KEGG pathway for all interacting genes from DAVID
| Top |
| Pharmacological Information for ELOVL2 |
| There's no related Drug. |
| Top |
| Cross referenced IDs for ELOVL2 |
| * We obtained these cross-references from Uniprot database. It covers 150 different DBs, 18 categories. http://www.uniprot.org/help/cross_references_section |
: Open all cross reference information
|
Copyright © 2016-Present - The Univsersity of Texas Health Science Center at Houston @ |