|
||||||||||||||||||||||||||||||||||||||||||||||||||||||||||||||||||||||||||||||||||||||||||||||||||||||||||||||||||||||||||||||||||||||||||||||||||||||||||||||||||||||||||||||||||||||||||||||||||||||||||||||||||||||||||||||||||||||||||||||||||||||||||||||||||||||||||||||||||||||||||||||||||||||||||||||||||||||||||
| |
| Phenotypic Information (metabolism pathway, cancer, disease, phenome) |
| |
| |
| Gene-Gene Network Information: Co-Expression Network, Interacting Genes & KEGG |
| |
|


| Gene Summary for LPCAT2 |
| Basic gene info. | Gene symbol | LPCAT2 |
| Gene name | lysophosphatidylcholine acyltransferase 2 | |
| Synonyms | AYTL1|LysoPAFAT | |
| Cytomap | UCSC genome browser: 16q12.2 | |
| Genomic location | chr16 :55542912-55620582 | |
| Type of gene | protein-coding | |
| RefGenes | NM_017839.4, | |
| Ensembl id | ENSG00000087253 | |
| Description | 1-AGP acyltransferase 111-AGPAT 111-acylglycerol-3-phosphate O-acyltransferase 111-acylglycerophosphocholine O-acyltransferase1-alkylglycerophosphocholine O-acetyltransferaseLPAAT-alphaLPC acyltransferase 2LPCAT-2acetyl-CoA:lyso-PAF acetyltransfer | |
| Modification date | 20141207 | |
| dbXrefs | MIM : 612040 | |
| HGNC : HGNC | ||
| Ensembl : ENSG00000087253 | ||
| HPRD : 07913 | ||
| Vega : OTTHUMG00000133238 | ||
| Protein | UniProt: go to UniProt's Cross Reference DB Table | |
| Expression | CleanEX: HS_LPCAT2 | |
| BioGPS: 54947 | ||
| Gene Expression Atlas: ENSG00000087253 | ||
| The Human Protein Atlas: ENSG00000087253 | ||
| Pathway | NCI Pathway Interaction Database: LPCAT2 | |
| KEGG: LPCAT2 | ||
| REACTOME: LPCAT2 | ||
| ConsensusPathDB | ||
| Pathway Commons: LPCAT2 | ||
| Metabolism | MetaCyc: LPCAT2 | |
| HUMANCyc: LPCAT2 | ||
| Regulation | Ensembl's Regulation: ENSG00000087253 | |
| miRBase: chr16 :55,542,912-55,620,582 | ||
| TargetScan: NM_017839 | ||
| cisRED: ENSG00000087253 | ||
| Context | iHOP: LPCAT2 | |
| cancer metabolism search in PubMed: LPCAT2 | ||
| UCL Cancer Institute: LPCAT2 | ||
| Assigned class in ccmGDB | C | |
| Top |
| Phenotypic Information for LPCAT2(metabolism pathway, cancer, disease, phenome) |
| Cancer | CGAP: LPCAT2 |
| Familial Cancer Database: LPCAT2 | |
| * This gene is included in those cancer gene databases. |
|
|
|
|
|
|
| ||||||||||||||||||||||||||||||||||||||||||||||||||||||||||||||||||||||||||||||||||||||||||||||||||||||||||||||||||||||||||||||||||||||||||||||||||||||||||||||||||||||||||||||||||||||||||||||||||||||||||||||||||||||||||||||||||||||||||||||||||||||||||||||||||||||||||||||||||||||||||||||||||||||||||||||||||||
Oncogene 1 | Significant driver gene in | |||||||||||||||||||||||||||||||||||||||||||||||||||||||||||||||||||||||||||||||||||||||||||||||||||||||||||||||||||||||||||||||||||||||||||||||||||||||||||||||||||||||||||||||||||||||||||||||||||||||||||||||||||||||||||||||||||||||||||||||||||||||||||||||||||||||||||||||||||||||||||||||||||||||||||||||||||||||||
| cf) number; DB name 1 Oncogene; http://nar.oxfordjournals.org/content/35/suppl_1/D721.long, 2 Tumor Suppressor gene; https://bioinfo.uth.edu/TSGene/, 3 Cancer Gene Census; http://www.nature.com/nrc/journal/v4/n3/abs/nrc1299.html, 4 CancerGenes; http://nar.oxfordjournals.org/content/35/suppl_1/D721.long, 5 Network of Cancer Gene; http://ncg.kcl.ac.uk/index.php, 1Therapeutic Vulnerabilities in Cancer; http://cbio.mskcc.org/cancergenomics/statius/ |
| KEGG_GLYCEROPHOSPHOLIPID_METABOLISM REACTOME_PHOSPHOLIPID_METABOLISM REACTOME_METABOLISM_OF_LIPIDS_AND_LIPOPROTEINS | |
| OMIM | |
| Orphanet | |
| Disease | KEGG Disease: LPCAT2 |
| MedGen: LPCAT2 (Human Medical Genetics with Condition) | |
| ClinVar: LPCAT2 | |
| Phenotype | MGI: LPCAT2 (International Mouse Phenotyping Consortium) |
| PhenomicDB: LPCAT2 | |
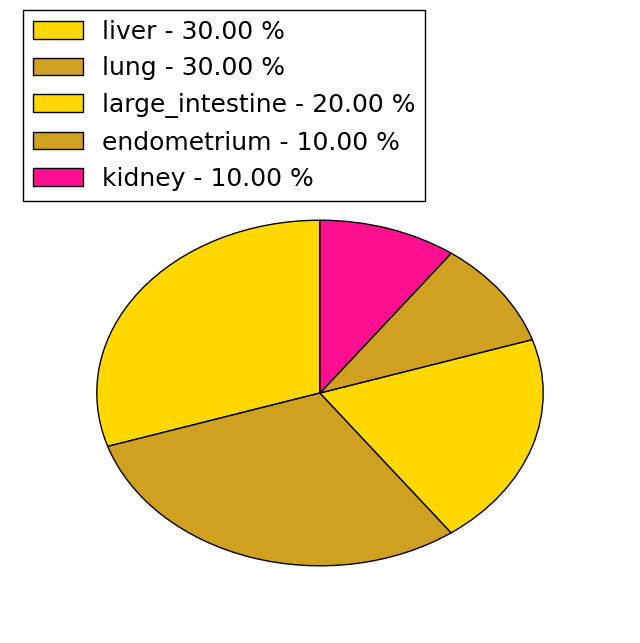
| Mutations for LPCAT2 |
| * Under tables are showing count per each tissue to give us broad intuition about tissue specific mutation patterns.You can go to the detailed page for each mutation database's web site. |
| There's no structural variation information in COSMIC data for this gene. |
| * From mRNA Sanger sequences, Chitars2.0 arranged chimeric transcripts. This table shows LPCAT2 related fusion information. |
| ID | Head Gene | Tail Gene | Accession | Gene_a | qStart_a | qEnd_a | Chromosome_a | tStart_a | tEnd_a | Gene_a | qStart_a | qEnd_a | Chromosome_a | tStart_a | tEnd_a |
| AJ420584 | LPCAT2 | 25 | 1589 | 16 | 55565824 | 55617581 | TXNDC5 | 1584 | 1900 | 6 | 8014214 | 8014530 | |
| AI333351 | ATP6V1D | 3 | 350 | 14 | 67804589 | 67804936 | LPCAT2 | 348 | 462 | 16 | 55600700 | 55600814 | |
| AA602968 | LPCAT2 | 8 | 107 | 16 | 55620028 | 55620127 | LPCAT2 | 103 | 429 | 16 | 55619706 | 55620032 | |
| CN286009 | LPCAT2 | 13 | 74 | 16 | 55618722 | 55618783 | LPCAT2 | 55 | 426 | 16 | 55618734 | 55619115 | |
| Top |
| Mutation type/ Tissue ID | brca | cns | cerv | endome | haematopo | kidn | Lintest | liver | lung | ns | ovary | pancre | prost | skin | stoma | thyro | urina | |||
| Total # sample | 1 | 1 | 2 | 1 | ||||||||||||||||
| GAIN (# sample) | 1 | |||||||||||||||||||
| LOSS (# sample) | 1 | 1 | 2 |
| cf) Tissue ID; Tissue type (1; Breast, 2; Central_nervous_system, 3; Cervix, 4; Endometrium, 5; Haematopoietic_and_lymphoid_tissue, 6; Kidney, 7; Large_intestine, 8; Liver, 9; Lung, 10; NS, 11; Ovary, 12; Pancreas, 13; Prostate, 14; Skin, 15; Stomach, 16; Thyroid, 17; Urinary_tract) |
| Top |
|
 |
| Top |
| Stat. for Non-Synonymous SNVs (# total SNVs=32) | (# total SNVs=10) |
 |  |
(# total SNVs=0) | (# total SNVs=0) |
| Top |
| * When you move the cursor on each content, you can see more deailed mutation information on the Tooltip. Those are primary_site,primary_histology,mutation(aa),pubmedID. |
| GRCh37 position | Mutation(aa) | Unique sampleID count |
| chr16:55579721-55579721 | p.L309L | 3 |
| chr16:55613030-55613030 | p.V442I | 2 |
| chr16:55613052-55613052 | p.T449M | 2 |
| chr16:55585003-55585003 | p.L402F | 2 |
| chr16:55568366-55568366 | p.T258T | 2 |
| chr16:55616885-55616885 | p.L504L | 1 |
| chr16:55579714-55579714 | p.R307Q | 1 |
| chr16:55559500-55559500 | p.A84A | 1 |
| chr16:55584910-55584910 | p.A371S | 1 |
| chr16:55562455-55562455 | p.L160L | 1 |
| Top |
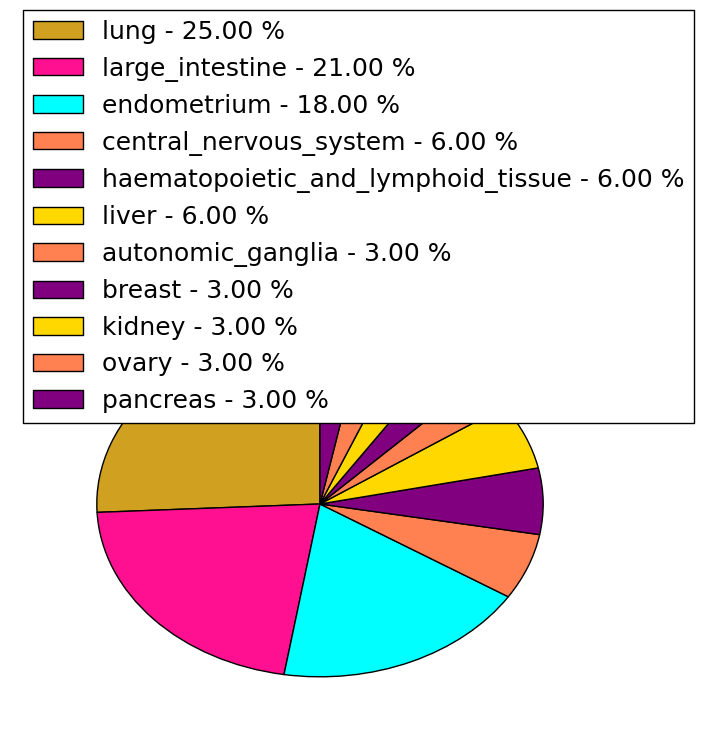
|
 |
| Point Mutation/ Tissue ID | 1 | 2 | 3 | 4 | 5 | 6 | 7 | 8 | 9 | 10 | 11 | 12 | 13 | 14 | 15 | 16 | 17 | 18 | 19 | 20 |
| # sample | 6 | 1 | 2 | 1 | 7 | 3 | 7 | 9 | 6 | |||||||||||
| # mutation | 6 | 1 | 2 | 1 | 7 | 3 | 7 | 10 | 7 | |||||||||||
| nonsynonymous SNV | 4 | 1 | 2 | 1 | 4 | 3 | 3 | 8 | 6 | |||||||||||
| synonymous SNV | 2 | 3 | 4 | 2 | 1 |
| cf) Tissue ID; Tissue type (1; BLCA[Bladder Urothelial Carcinoma], 2; BRCA[Breast invasive carcinoma], 3; CESC[Cervical squamous cell carcinoma and endocervical adenocarcinoma], 4; COAD[Colon adenocarcinoma], 5; GBM[Glioblastoma multiforme], 6; Glioma Low Grade, 7; HNSC[Head and Neck squamous cell carcinoma], 8; KICH[Kidney Chromophobe], 9; KIRC[Kidney renal clear cell carcinoma], 10; KIRP[Kidney renal papillary cell carcinoma], 11; LAML[Acute Myeloid Leukemia], 12; LUAD[Lung adenocarcinoma], 13; LUSC[Lung squamous cell carcinoma], 14; OV[Ovarian serous cystadenocarcinoma ], 15; PAAD[Pancreatic adenocarcinoma], 16; PRAD[Prostate adenocarcinoma], 17; SKCM[Skin Cutaneous Melanoma], 18:STAD[Stomach adenocarcinoma], 19:THCA[Thyroid carcinoma], 20:UCEC[Uterine Corpus Endometrial Carcinoma]) |
| Top |
| * We represented just top 10 SNVs. When you move the cursor on each content, you can see more deailed mutation information on the Tooltip. Those are primary_site, primary_histology, mutation(aa), pubmedID. |
| Genomic Position | Mutation(aa) | Unique sampleID count |
| chr16:55613052 | p.T449M | 2 |
| chr16:55584911 | p.A371V | 2 |
| chr16:55583308 | p.Q262Q | 1 |
| chr16:55559537 | p.V422V | 1 |
| chr16:55613023 | p.G20W | 1 |
| chr16:55565881 | p.V306V | 1 |
| chr16:55583314 | p.L423S | 1 |
| chr16:55562317 | p.P41L | 1 |
| chr16:55613030 | p.M310V | 1 |
| chr16:55566747 | p.N428I | 1 |
| * Copy number data were extracted from TCGA using R package TCGA-Assembler. The URLs of all public data files on TCGA DCC data server were gathered on Jan-05-2015. Function ProcessCNAData in TCGA-Assembler package was used to obtain gene-level copy number value which is calculated as the average copy number of the genomic region of a gene. |
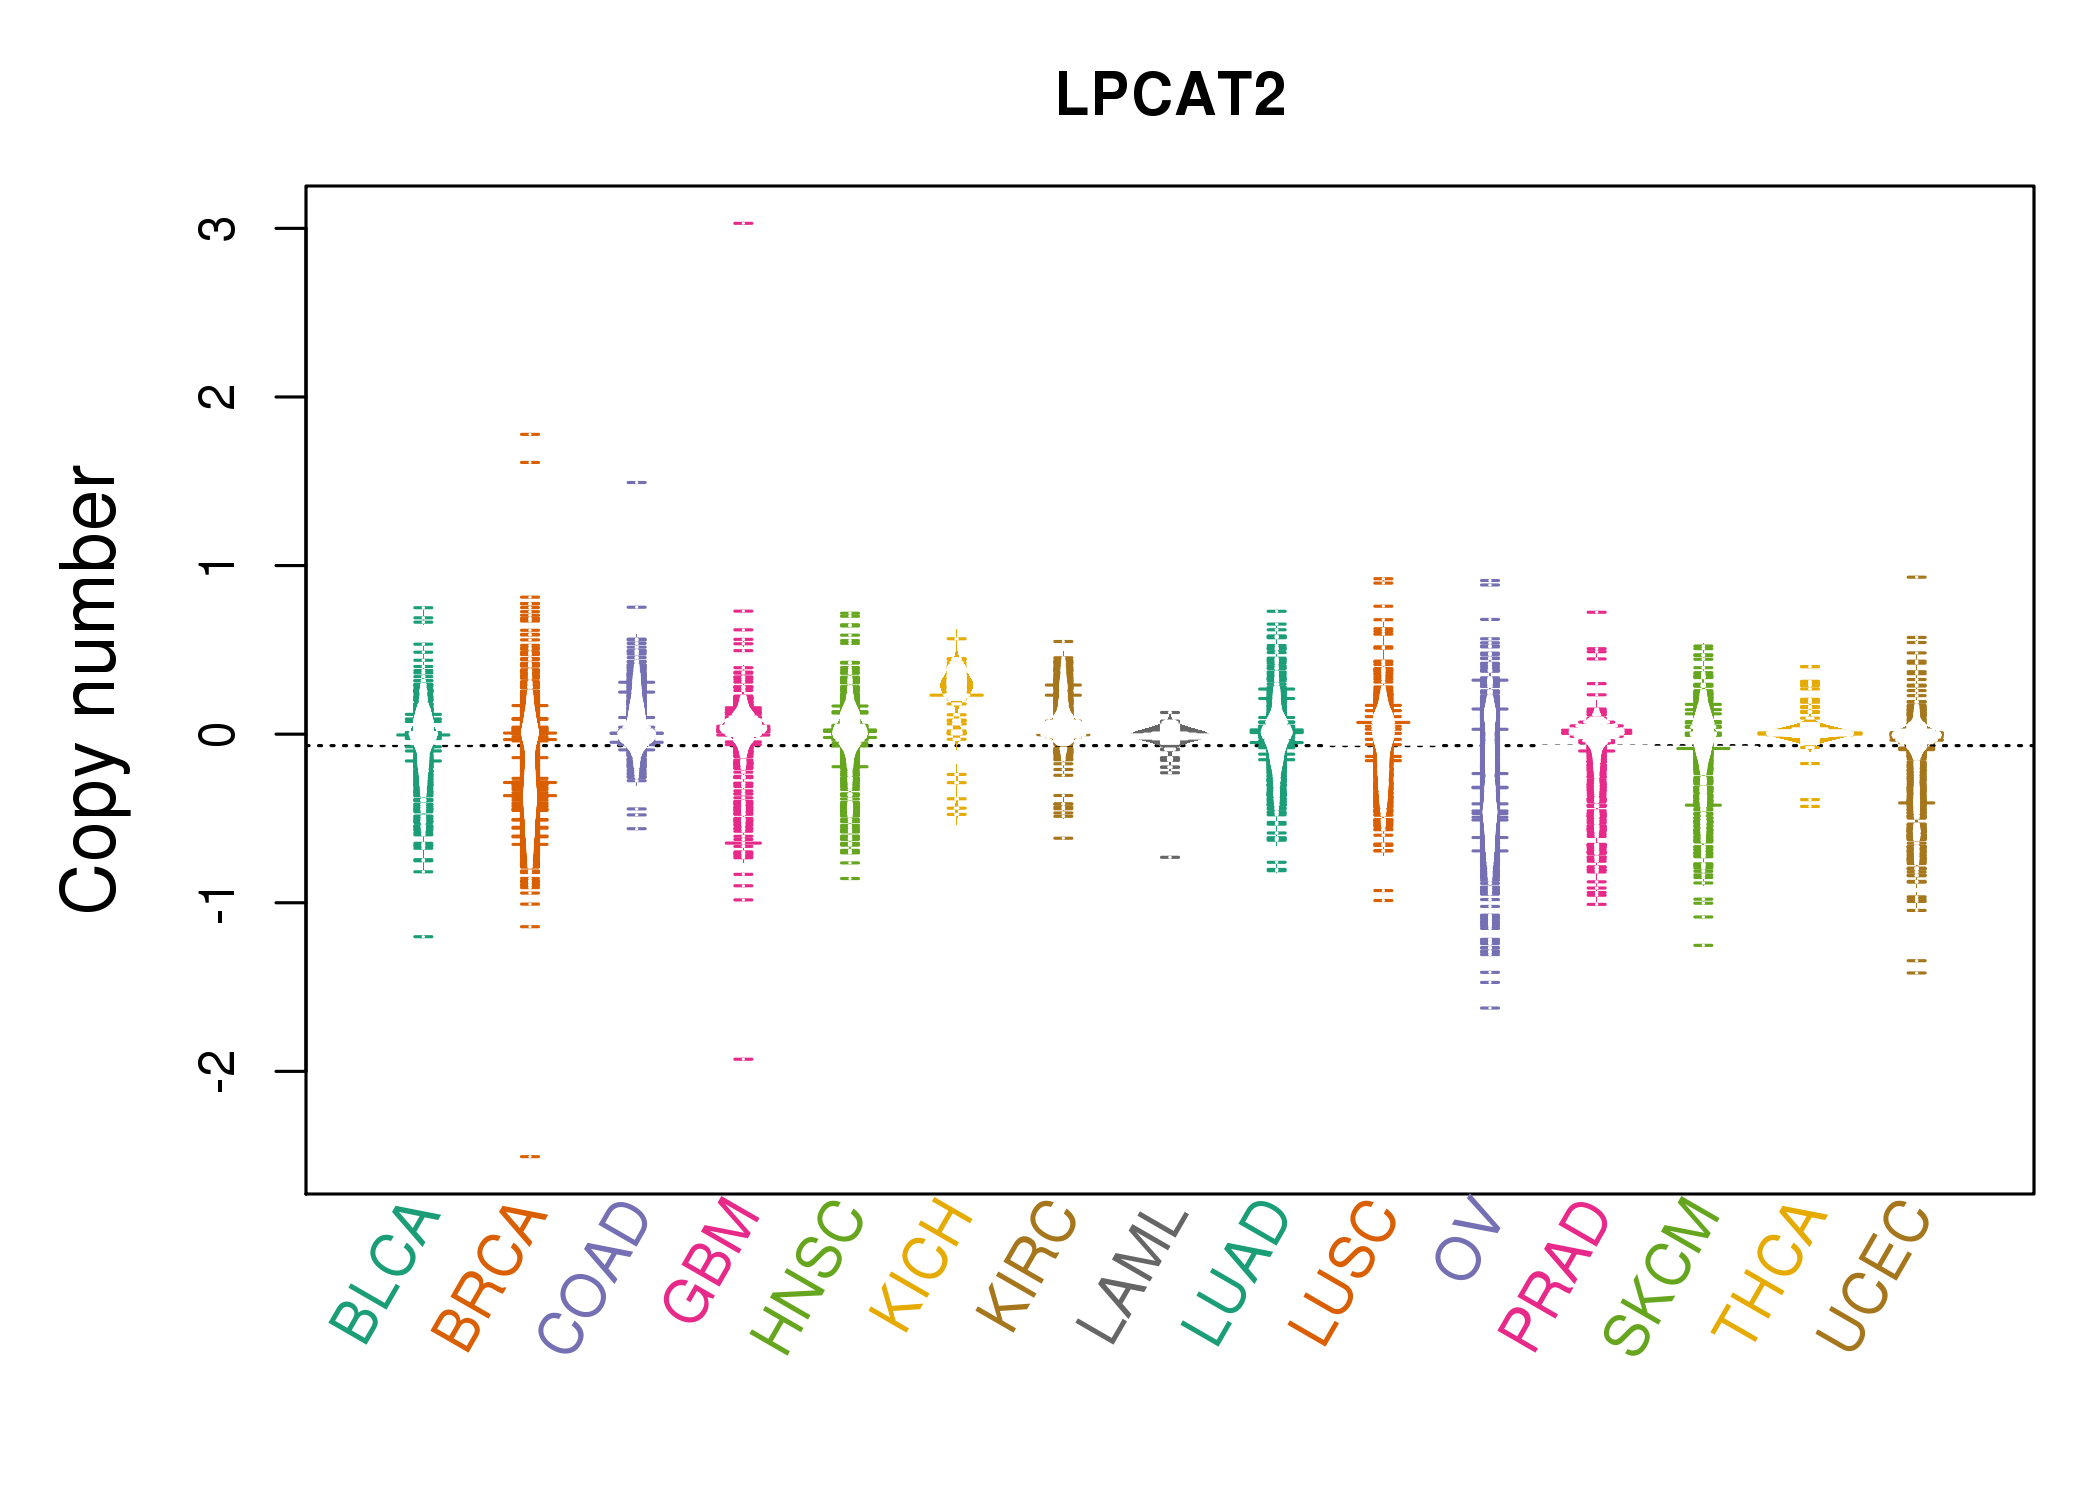 |
| cf) Tissue ID[Tissue type]: BLCA[Bladder Urothelial Carcinoma], BRCA[Breast invasive carcinoma], CESC[Cervical squamous cell carcinoma and endocervical adenocarcinoma], COAD[Colon adenocarcinoma], GBM[Glioblastoma multiforme], Glioma Low Grade, HNSC[Head and Neck squamous cell carcinoma], KICH[Kidney Chromophobe], KIRC[Kidney renal clear cell carcinoma], KIRP[Kidney renal papillary cell carcinoma], LAML[Acute Myeloid Leukemia], LUAD[Lung adenocarcinoma], LUSC[Lung squamous cell carcinoma], OV[Ovarian serous cystadenocarcinoma ], PAAD[Pancreatic adenocarcinoma], PRAD[Prostate adenocarcinoma], SKCM[Skin Cutaneous Melanoma], STAD[Stomach adenocarcinoma], THCA[Thyroid carcinoma], UCEC[Uterine Corpus Endometrial Carcinoma] |
| Top |
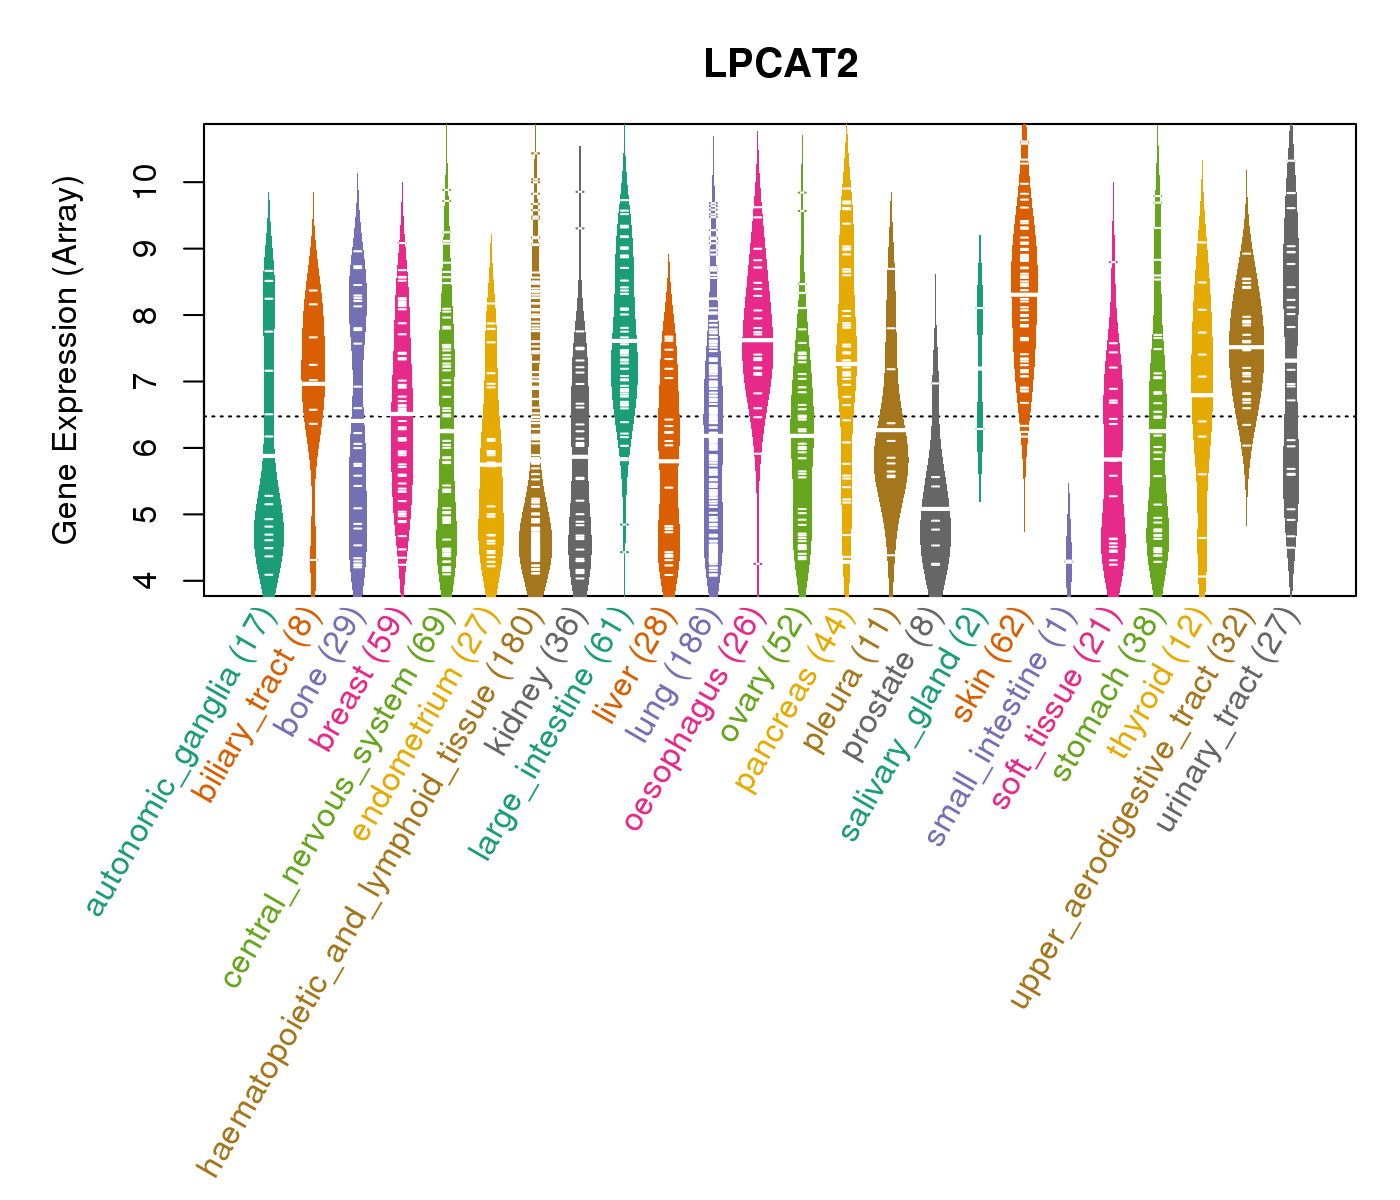
| Gene Expression for LPCAT2 |
| * CCLE gene expression data were extracted from CCLE_Expression_Entrez_2012-10-18.res: Gene-centric RMA-normalized mRNA expression data. |
 |
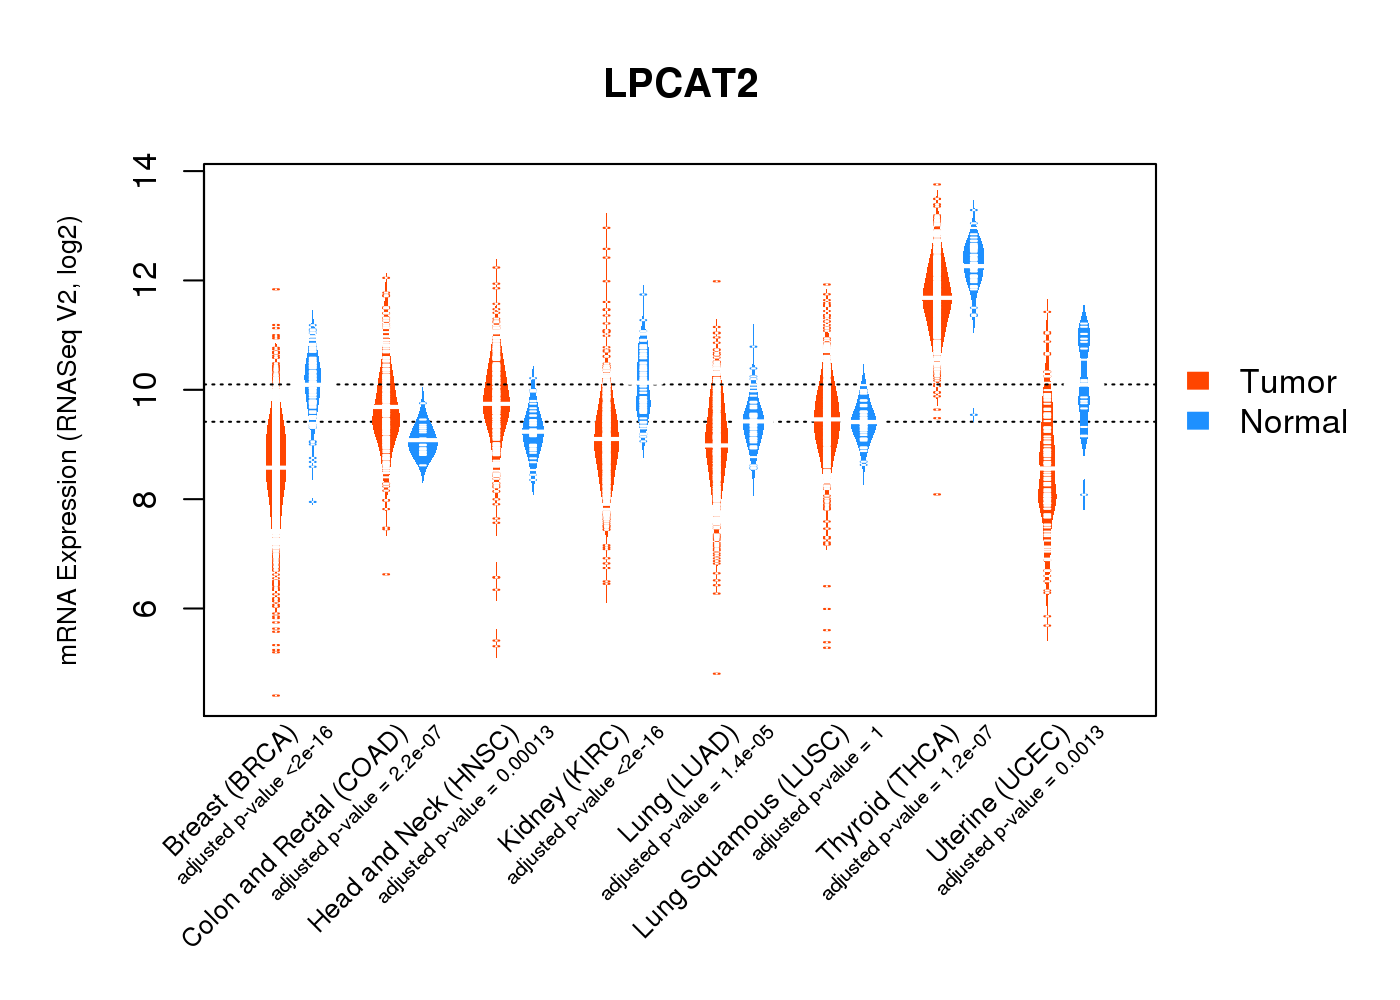
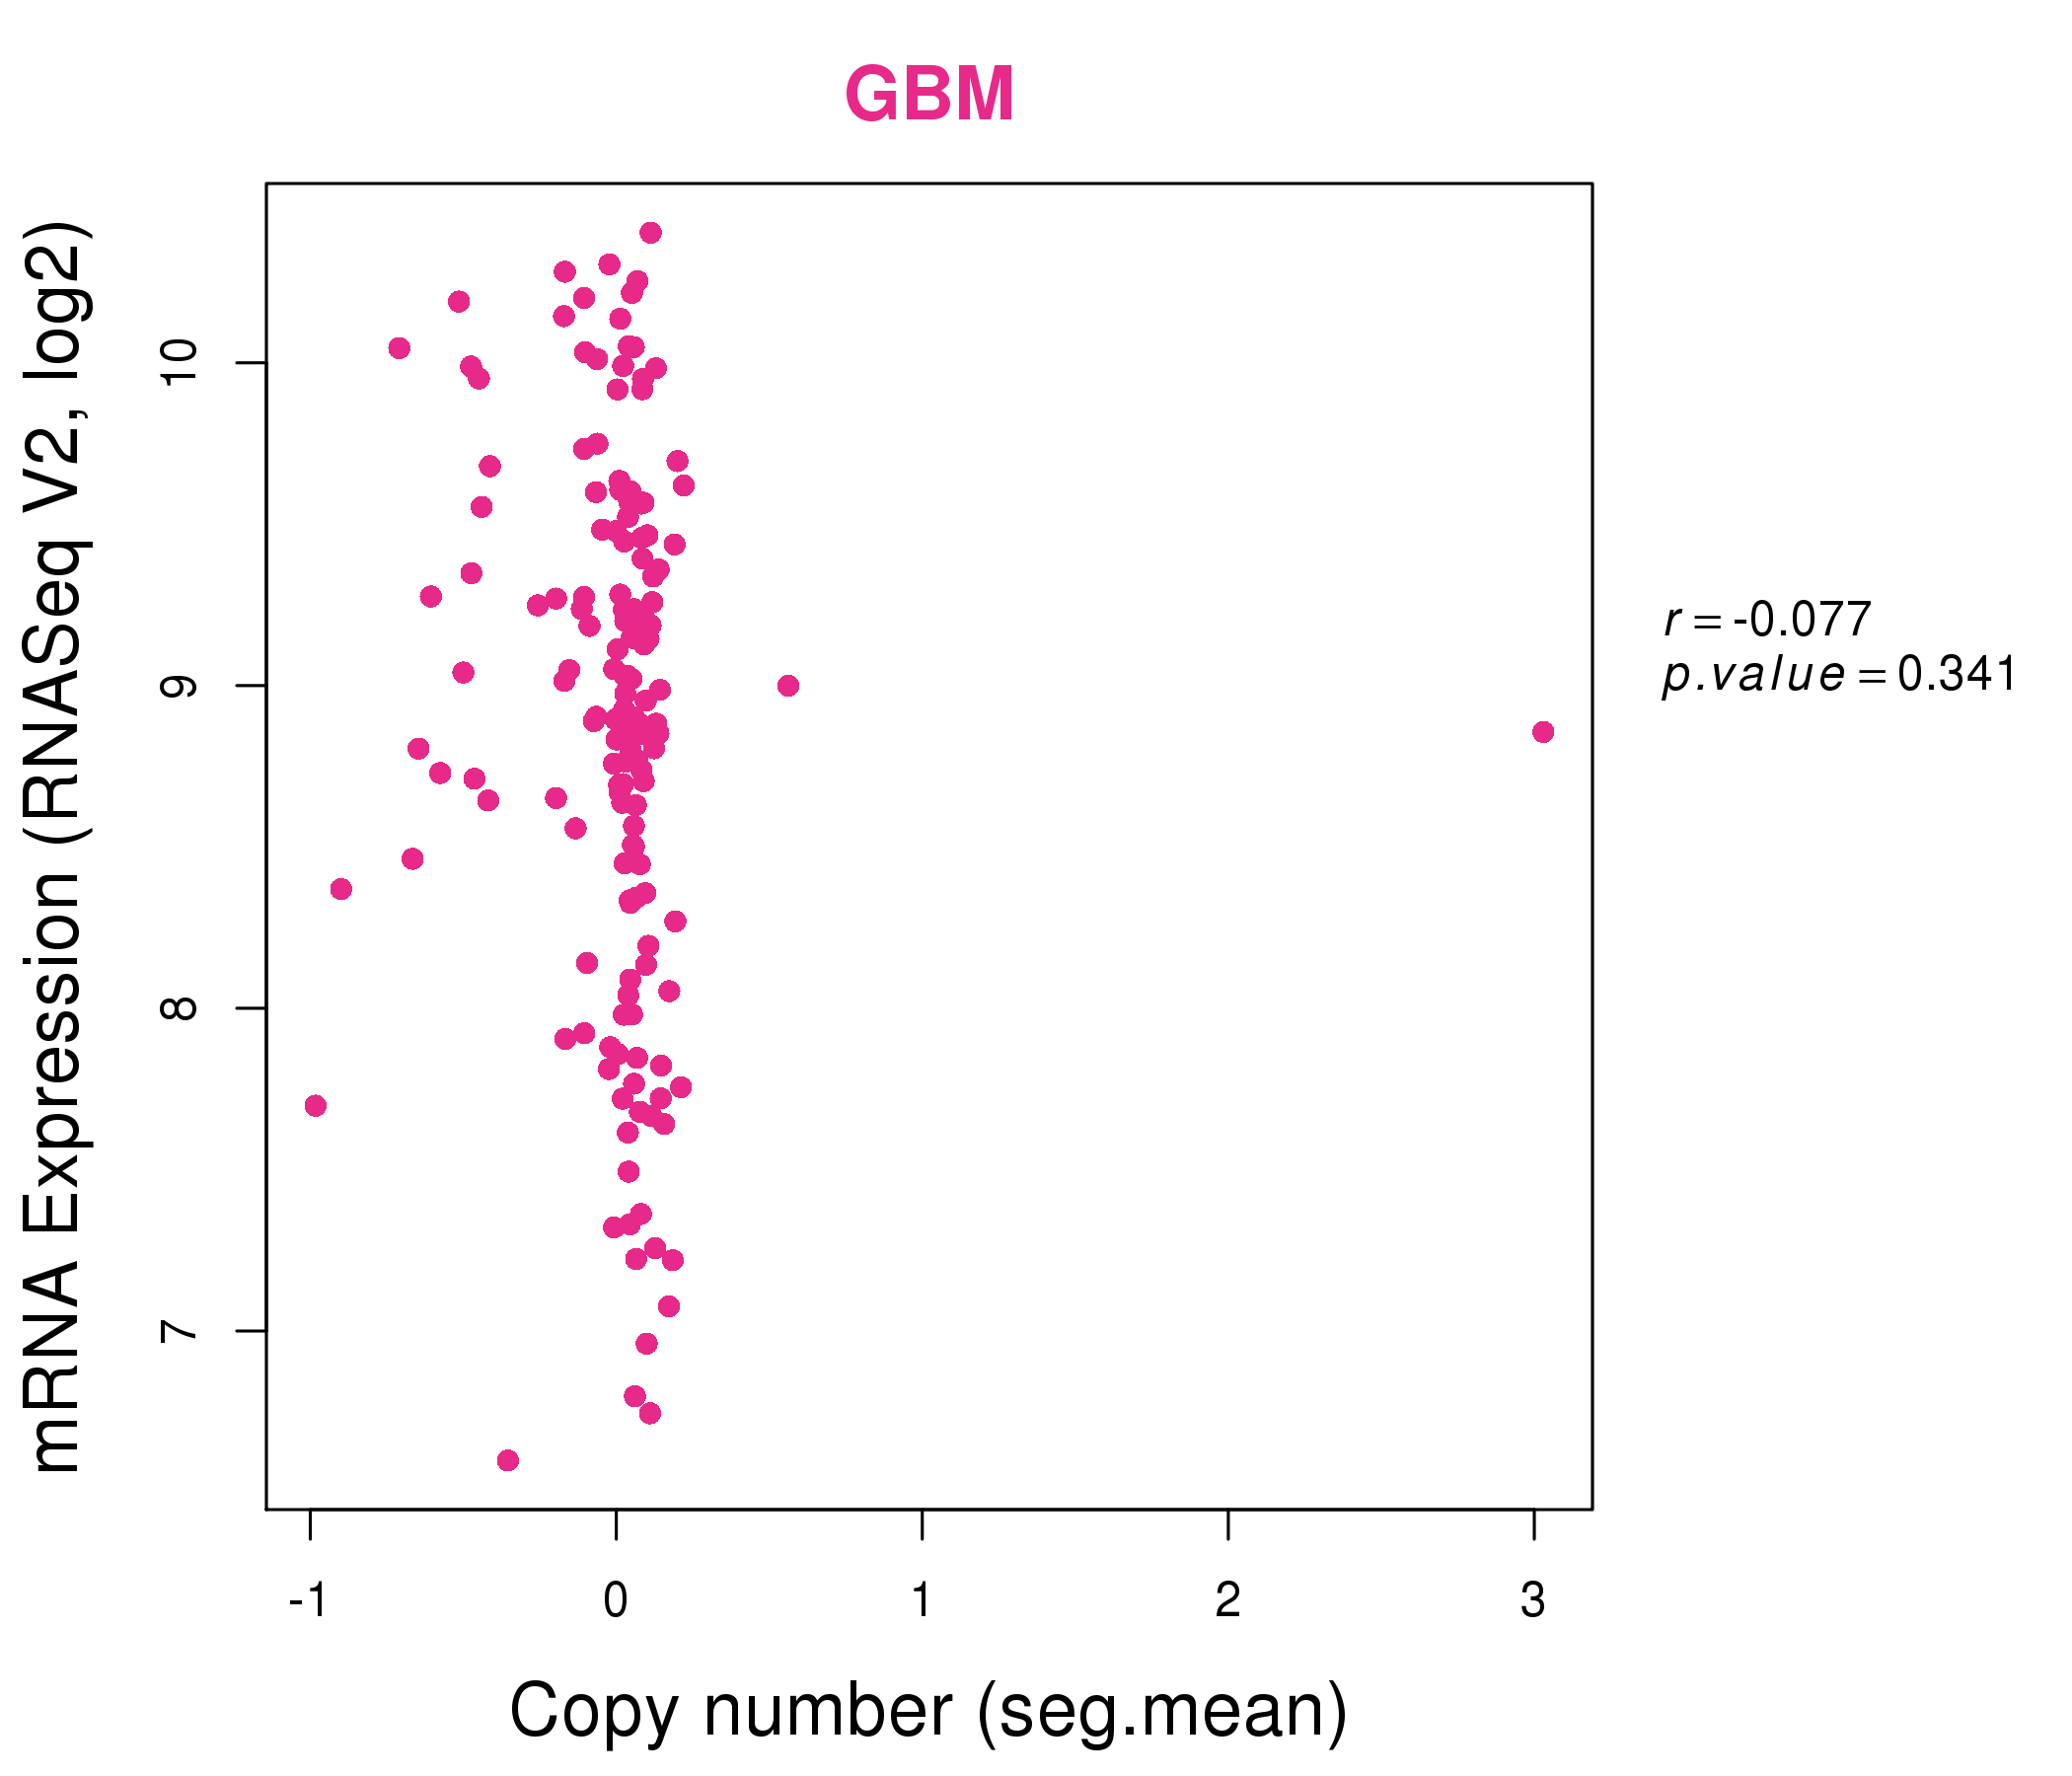
| * Normalized gene expression data of RNASeqV2 was extracted from TCGA using R package TCGA-Assembler. The URLs of all public data files on TCGA DCC data server were gathered at Jan-05-2015. Only eight cancer types have enough normal control samples for differential expression analysis. (t test, adjusted p<0.05 (using Benjamini-Hochberg FDR)) |
 |
| Top |
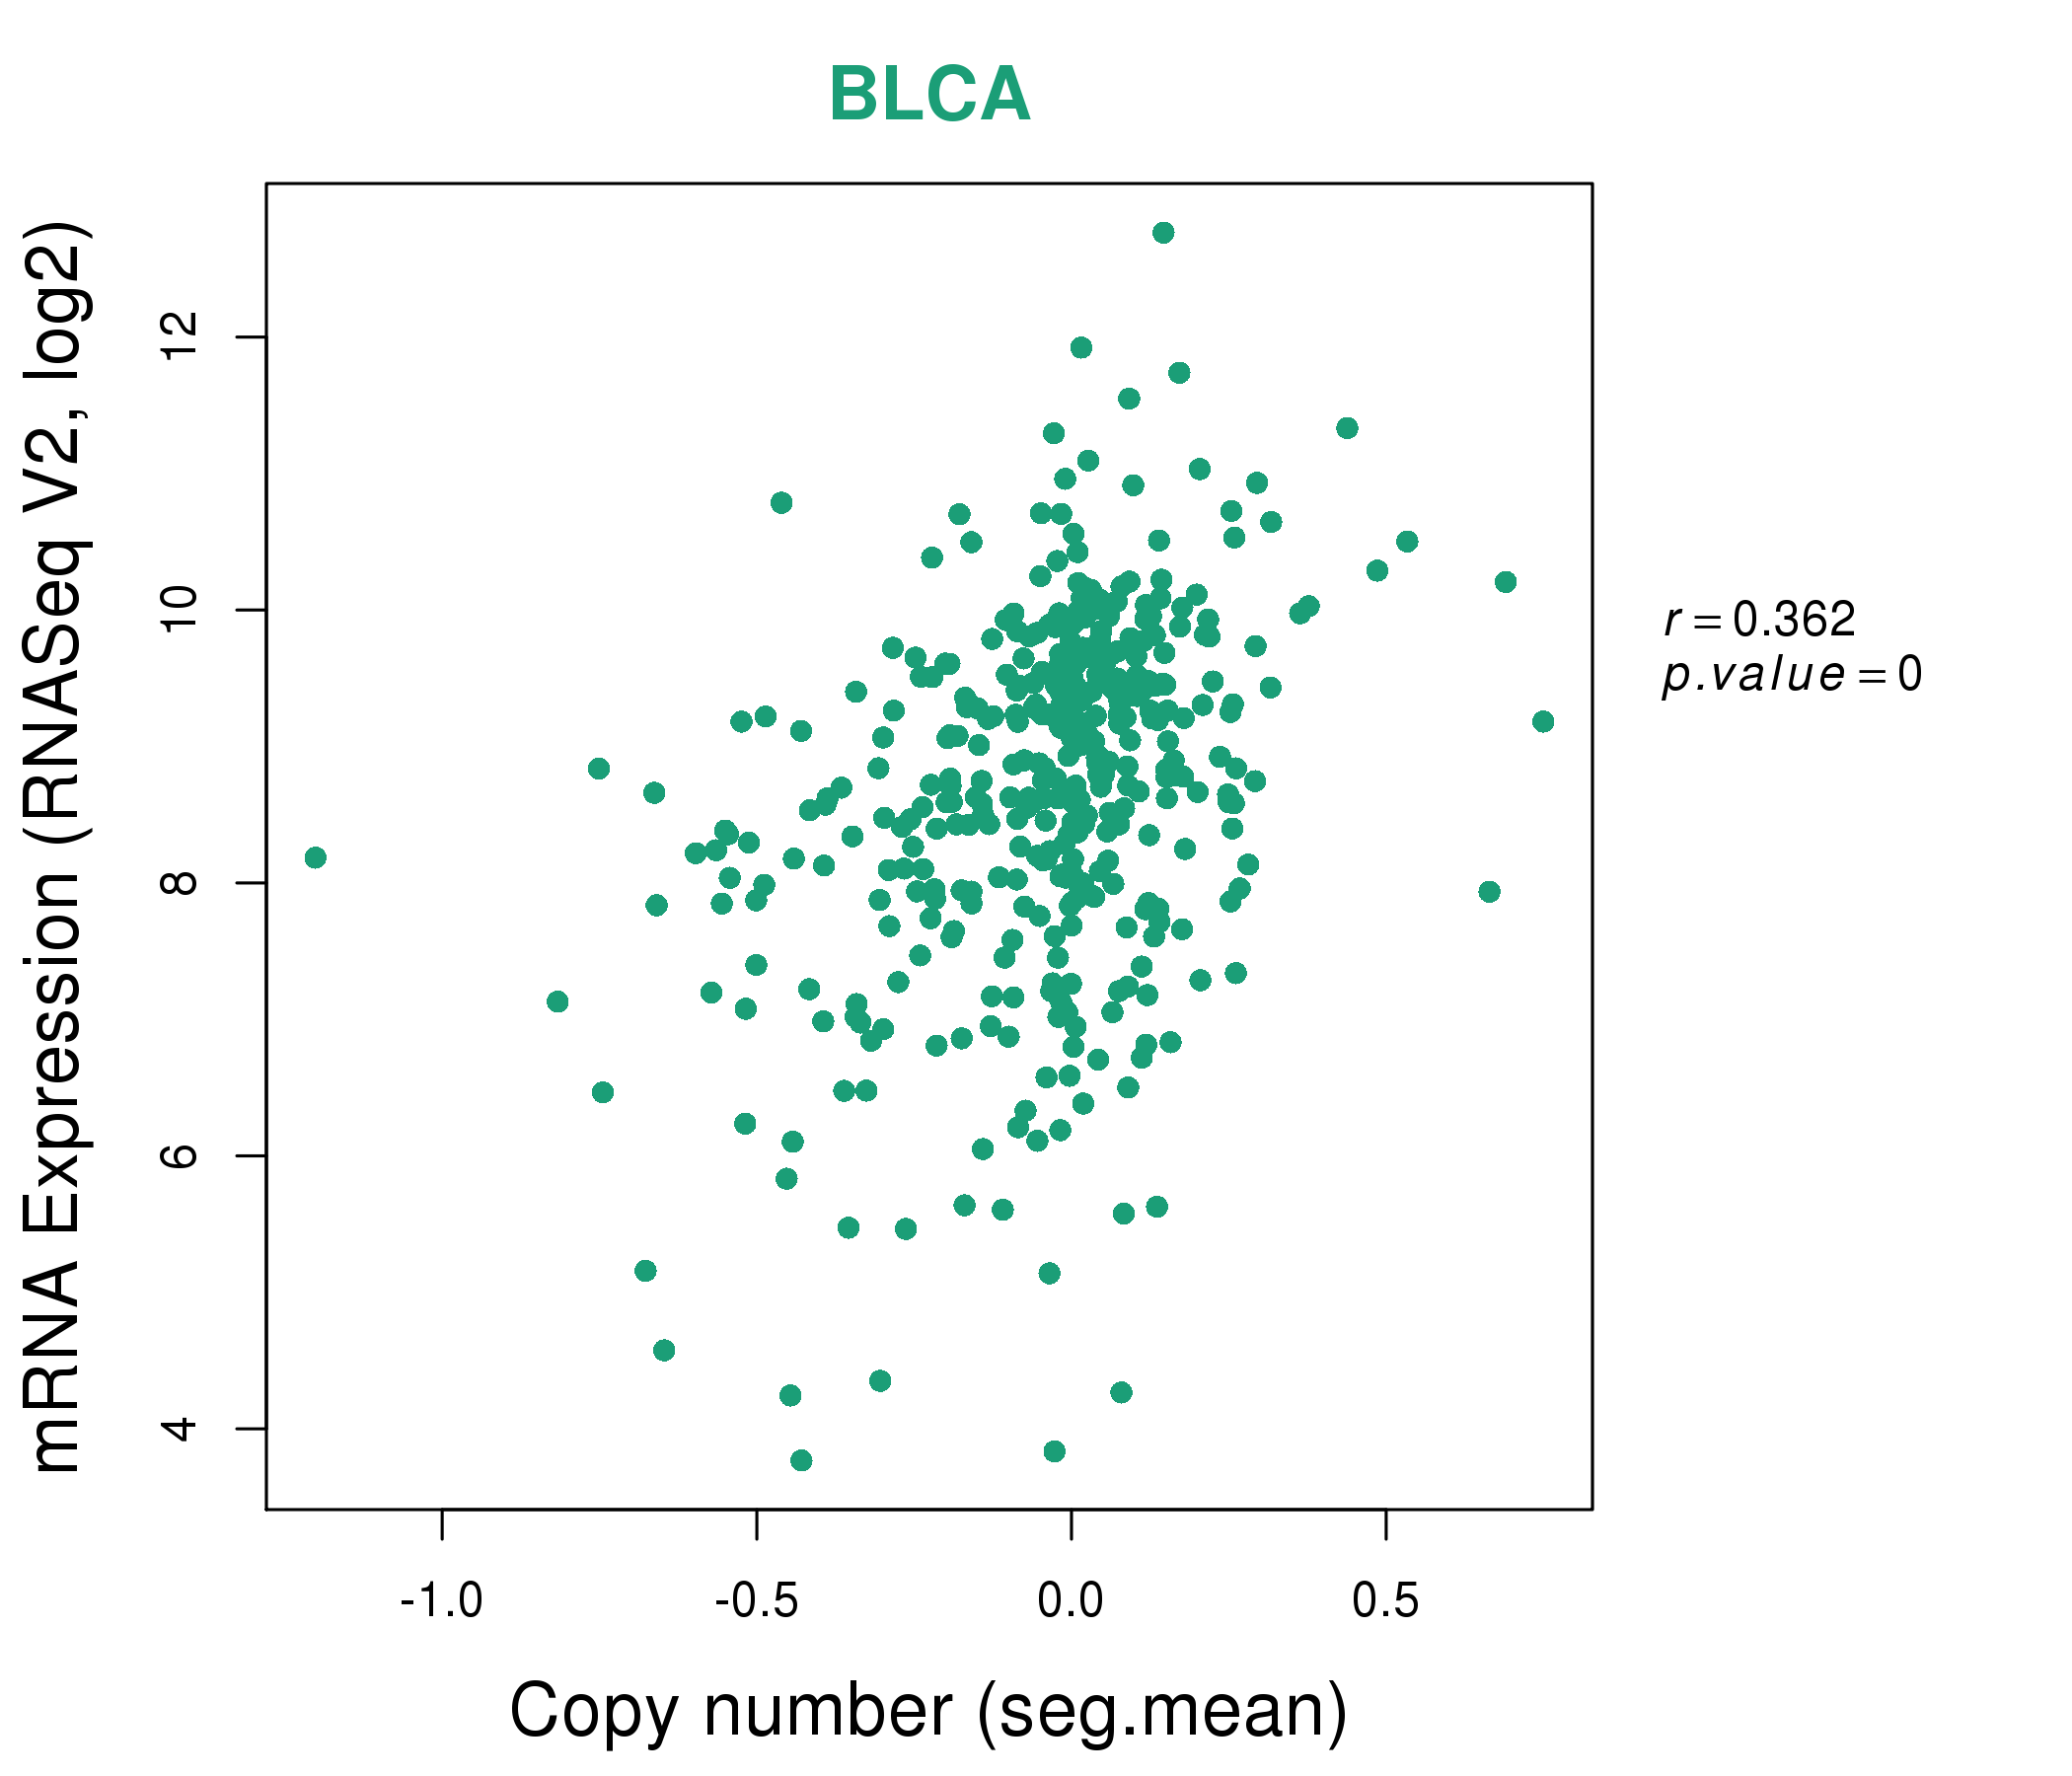
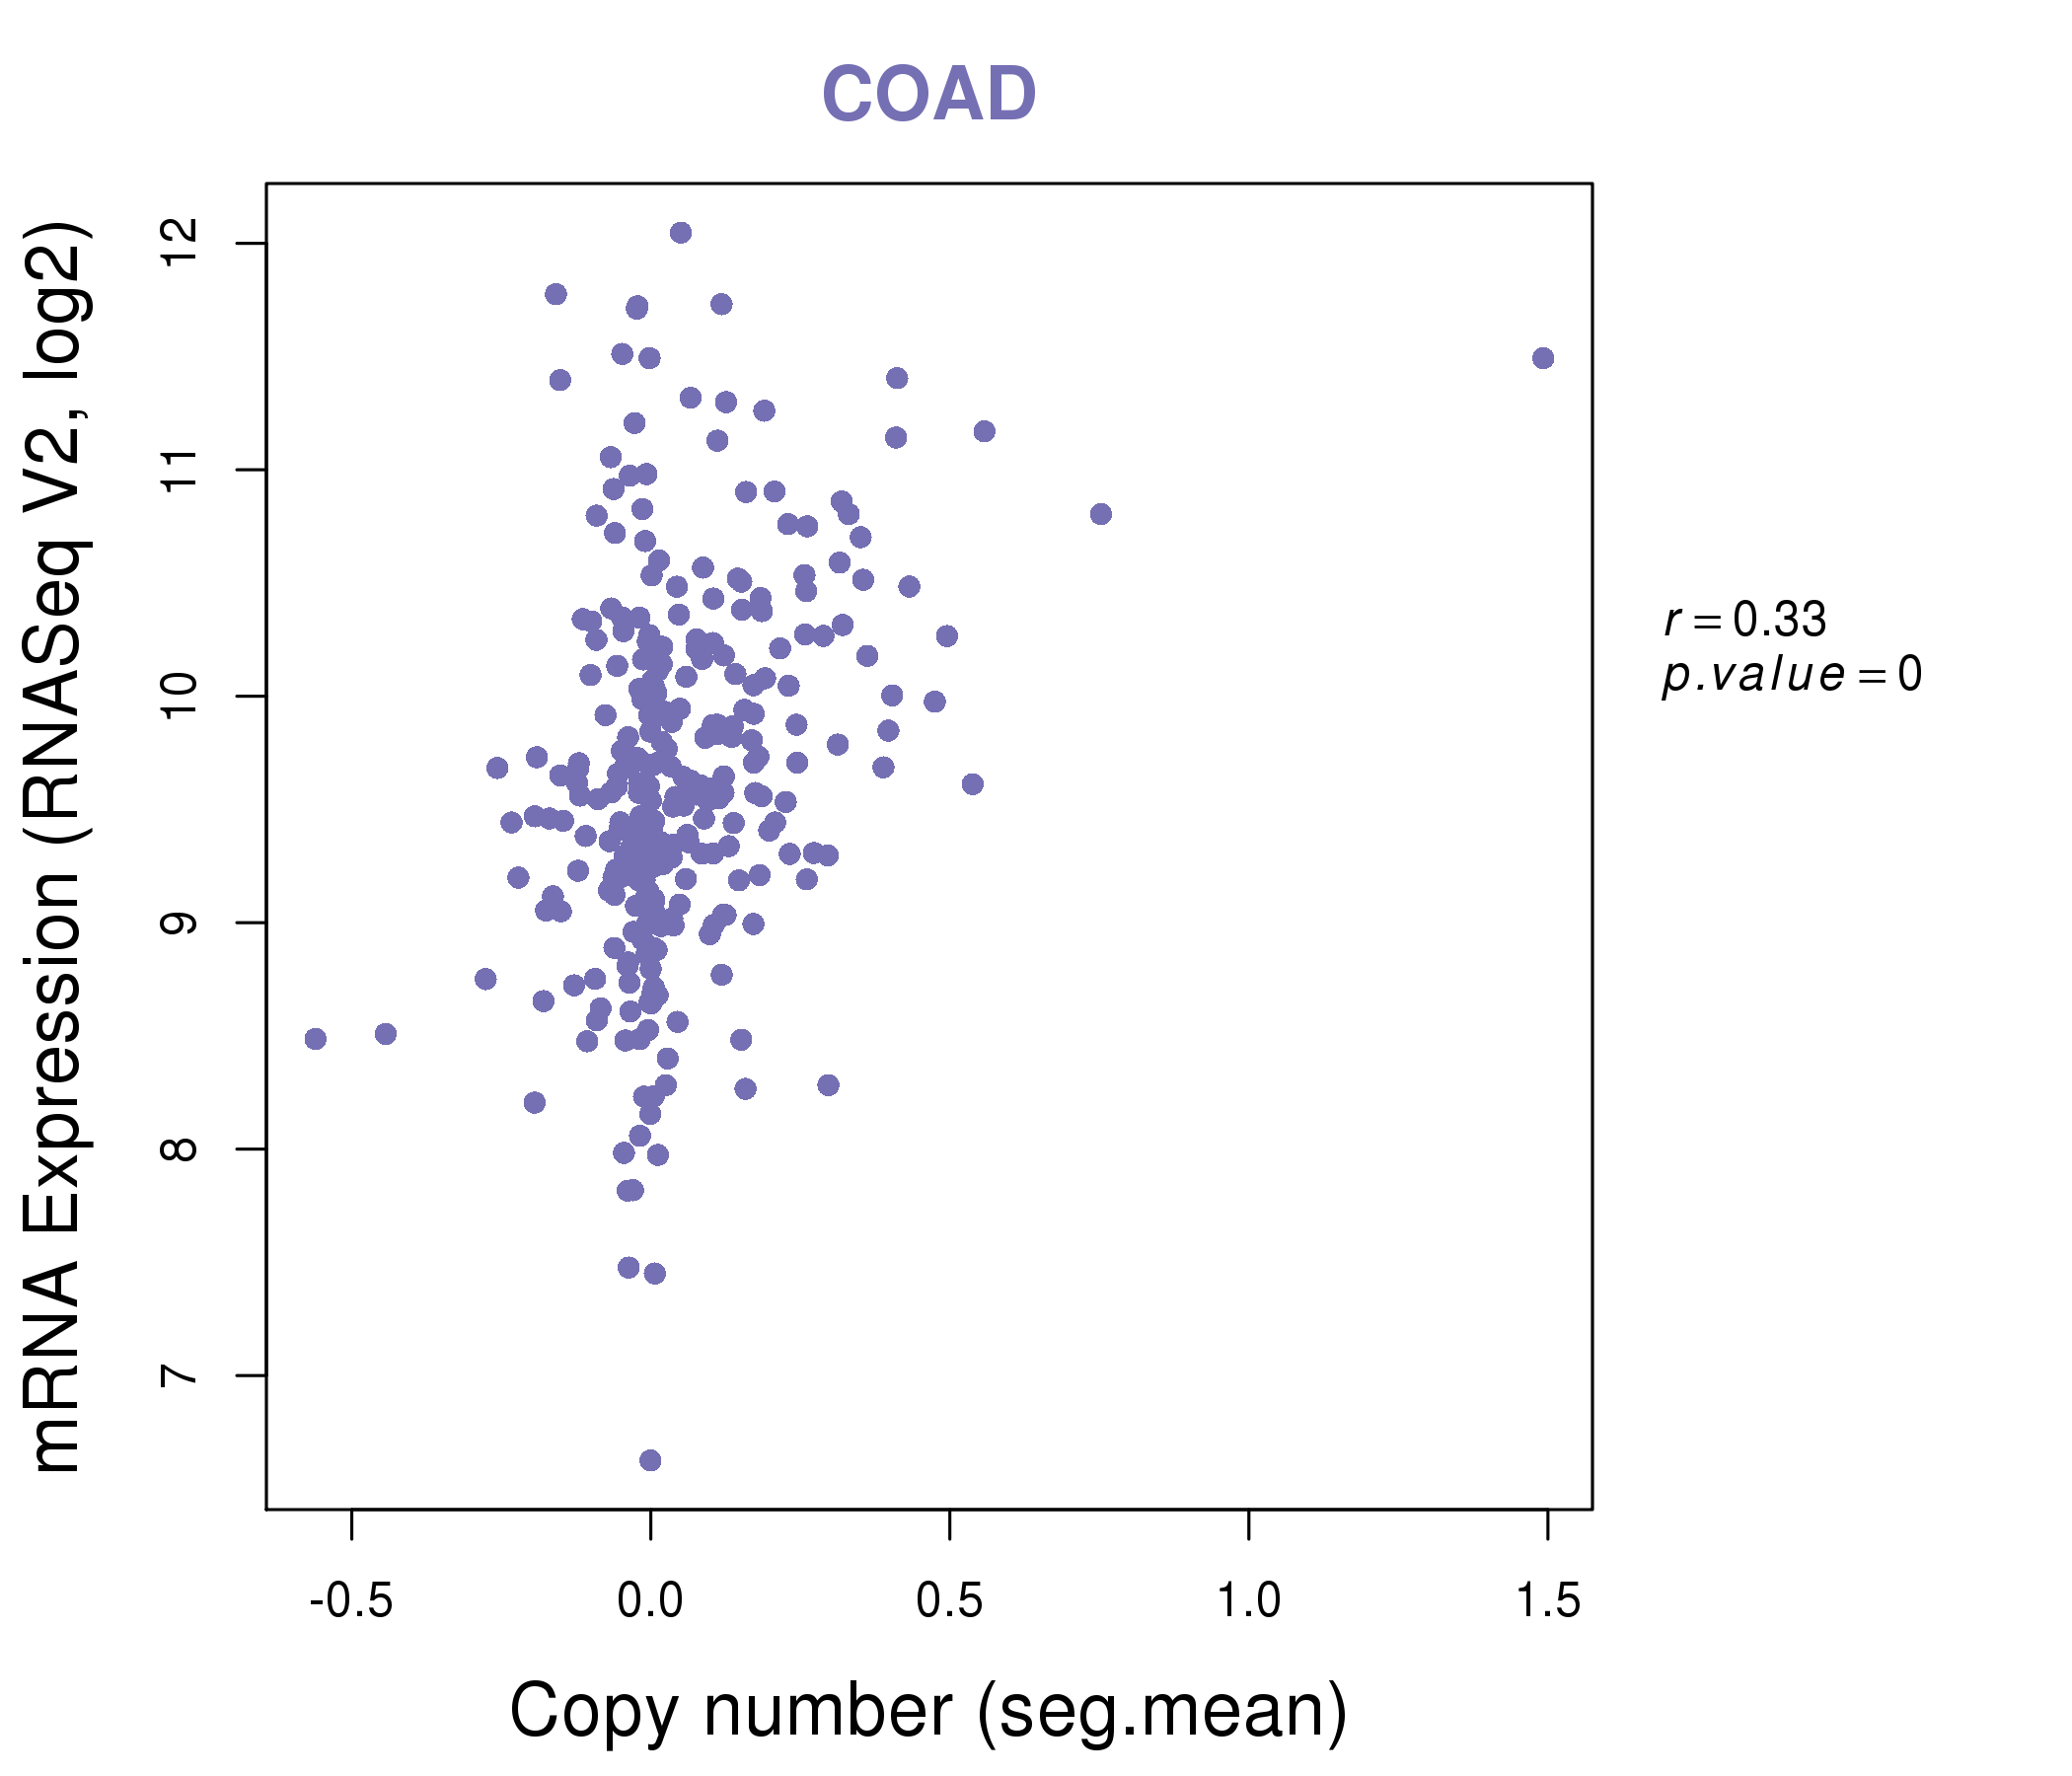
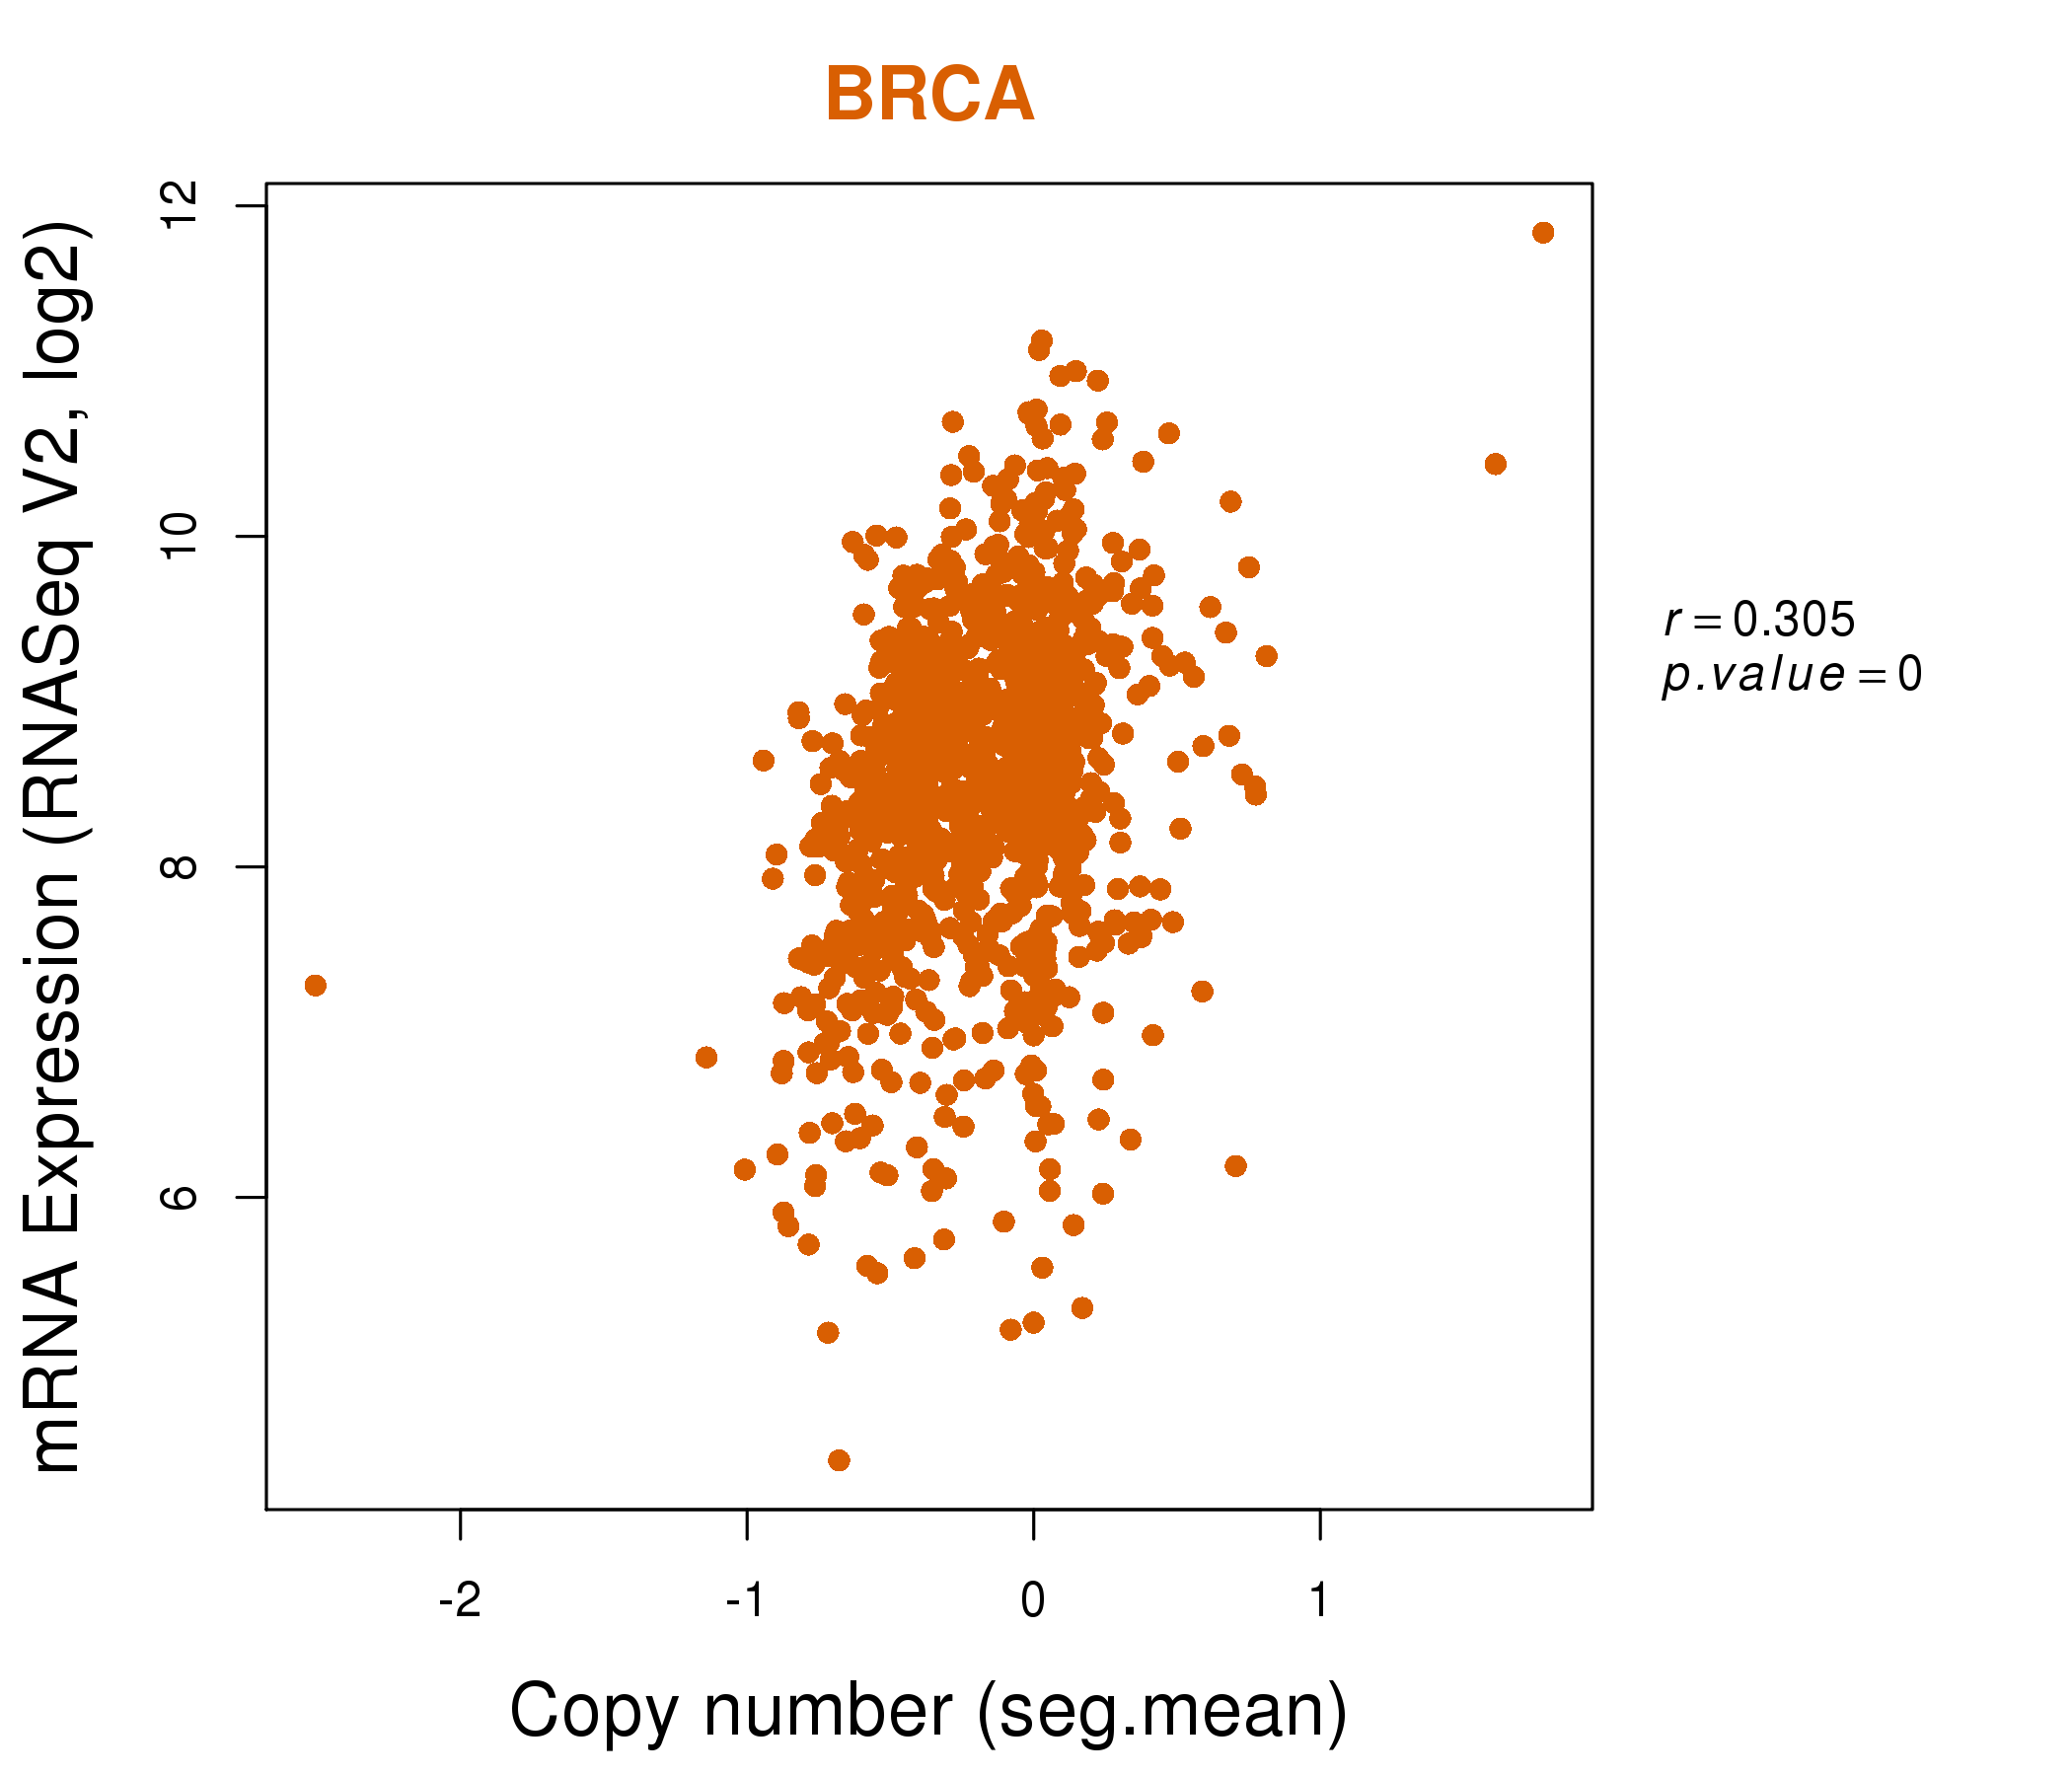
| * This plots show the correlation between CNV and gene expression. |
: Open all plots for all cancer types
 |
|
 |
|
| Top |
| Gene-Gene Network Information |
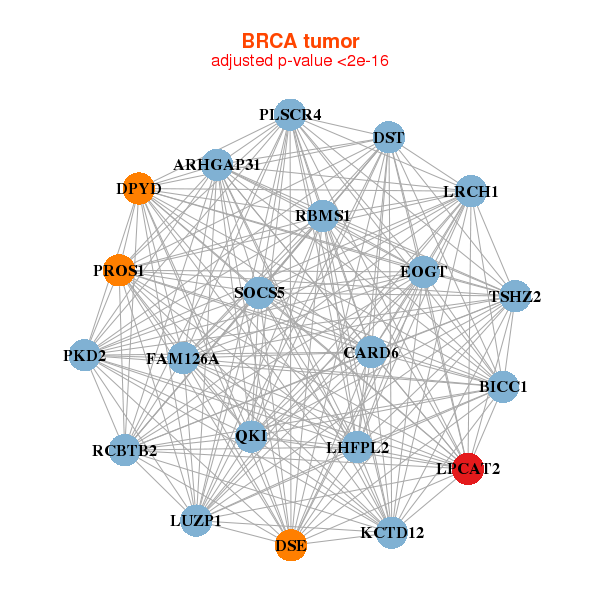
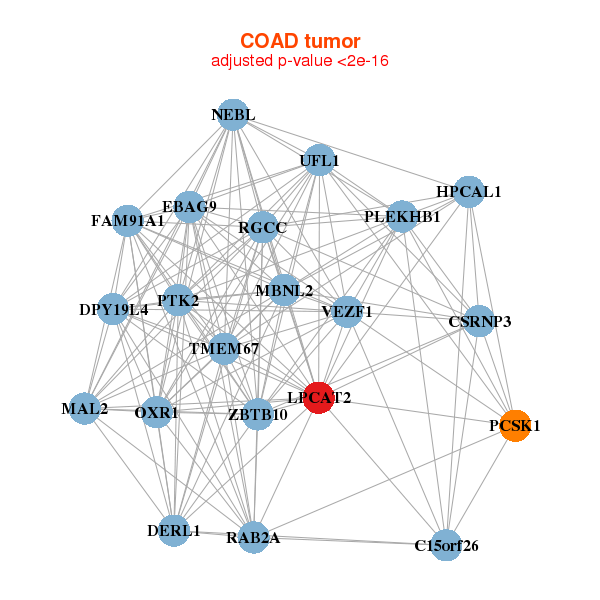
| * Co-Expression network figures were drawn using R package igraph. Only the top 20 genes with the highest correlations were shown. Red circle: input gene, orange circle: cell metabolism gene, sky circle: other gene |
: Open all plots for all cancer types
 |
|
| ARHGAP31,BICC1,EOGT,CARD6,DPYD,DSE,DST, FAM126A,KCTD12,LHFPL2,LPCAT2,LRCH1,LUZP1,PKD2, PLSCR4,PROS1,QKI,RBMS1,RCBTB2,SOCS5,TSHZ2 | TMEM237,TDRP,COMMD2,DENND6A,FAM13B,ZC2HC1A,CCSER1, FEM1B,IL1RAP,LPCAT2,LZTFL1,MCTP2,NAP1L2,NUDT21, PRKCI,RBMXL1,SMEK1,TP63,USP31,ZNF10,ZNF136 |
 |
|
| RGCC,C15orf26,CSRNP3,DERL1,DPY19L4,EBAG9,FAM91A1, HPCAL1,UFL1,LPCAT2,MAL2,MBNL2,NEBL,OXR1, PCSK1,PLEKHB1,PTK2,RAB2A,TMEM67,VEZF1,ZBTB10 | ASUN,TMA16,C4orf46,CLINT1,GPX2,GSTCD,LPCAT2, MRPS27,MTHFD2,PGA4,PM20D2,PPAT,PRPS2,RCN1, RNF183,SKP2,SLC10A7,SORD,TMEM173,WDR75,ZWILCH |
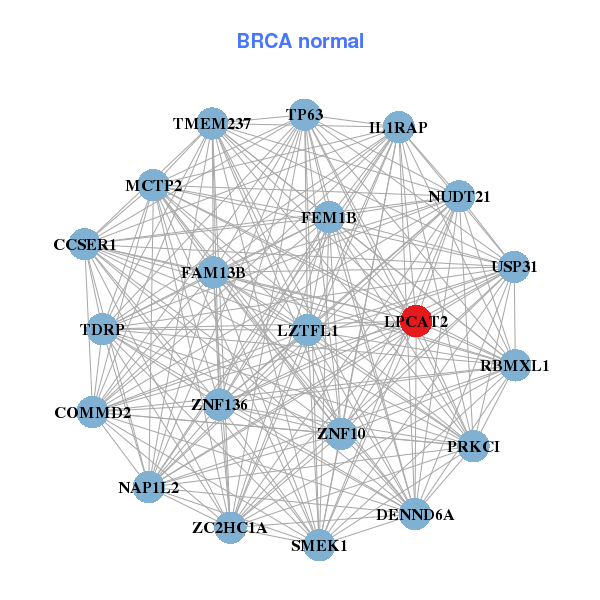
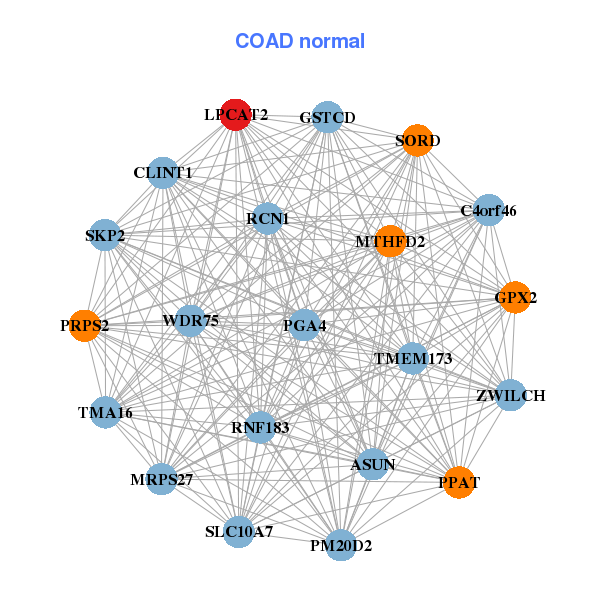
| * Co-Expression network figures were drawn using R package igraph. Only the top 20 genes with the highest correlations were shown. Red circle: input gene, orange circle: cell metabolism gene, sky circle: other gene |
: Open all plots for all cancer types
| Top |
: Open all interacting genes' information including KEGG pathway for all interacting genes from DAVID
| Top |
| Pharmacological Information for LPCAT2 |
| There's no related Drug. |
| Top |
| Cross referenced IDs for LPCAT2 |
| * We obtained these cross-references from Uniprot database. It covers 150 different DBs, 18 categories. http://www.uniprot.org/help/cross_references_section |
: Open all cross reference information
|
Copyright © 2016-Present - The Univsersity of Texas Health Science Center at Houston @ |