|
||||||||||||||||||||
| |
| Phenotypic Information (metabolism pathway, cancer, disease, phenome) |
| |
| |
| Gene-Gene Network Information: Co-Expression Network, Interacting Genes & KEGG |
| |
|


| Gene Summary for UCKL1 |
| Top |
| Phenotypic Information for UCKL1(metabolism pathway, cancer, disease, phenome) |
| Cancer | CGAP: UCKL1 |
| Familial Cancer Database: UCKL1 | |
| * This gene is included in those cancer gene databases. |
|
|
|
|
|
|
| ||||||||||||||
Oncogene 1 | Significant driver gene in | |||||||||||||||||||
| cf) number; DB name 1 Oncogene; http://nar.oxfordjournals.org/content/35/suppl_1/D721.long, 2 Tumor Suppressor gene; https://bioinfo.uth.edu/TSGene/, 3 Cancer Gene Census; http://www.nature.com/nrc/journal/v4/n3/abs/nrc1299.html, 4 CancerGenes; http://nar.oxfordjournals.org/content/35/suppl_1/D721.long, 5 Network of Cancer Gene; http://ncg.kcl.ac.uk/index.php, 1Therapeutic Vulnerabilities in Cancer; http://cbio.mskcc.org/cancergenomics/statius/ |
| KEGG_PYRIMIDINE_METABOLISM KEGG_DRUG_METABOLISM_OTHER_ENZYMES | |
| OMIM | |
| Orphanet | |
| Disease | KEGG Disease: UCKL1 |
| MedGen: UCKL1 (Human Medical Genetics with Condition) | |
| ClinVar: UCKL1 | |
| Phenotype | MGI: UCKL1 (International Mouse Phenotyping Consortium) |
| PhenomicDB: UCKL1 | |
| Mutations for UCKL1 |
| * Under tables are showing count per each tissue to give us broad intuition about tissue specific mutation patterns.You can go to the detailed page for each mutation database's web site. |
| - Statistics for Tissue and Mutation type | Top |
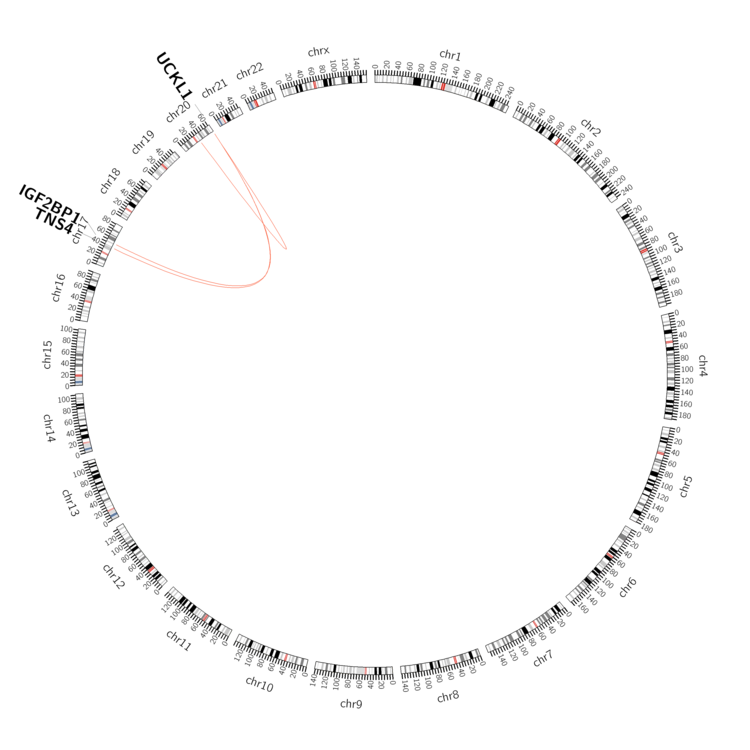 |
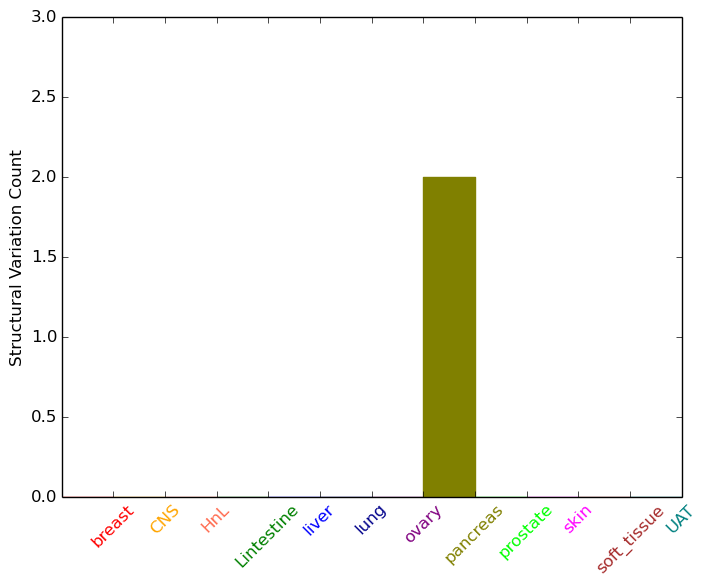
| - For Inter-chromosomal Variations |
| * Inter-chromosomal variantions includes 'interchromosomal amplicon to amplicon', 'interchromosomal amplicon to non-amplified dna', 'interchromosomal insertion', 'Interchromosomal unknown type'. |
 |
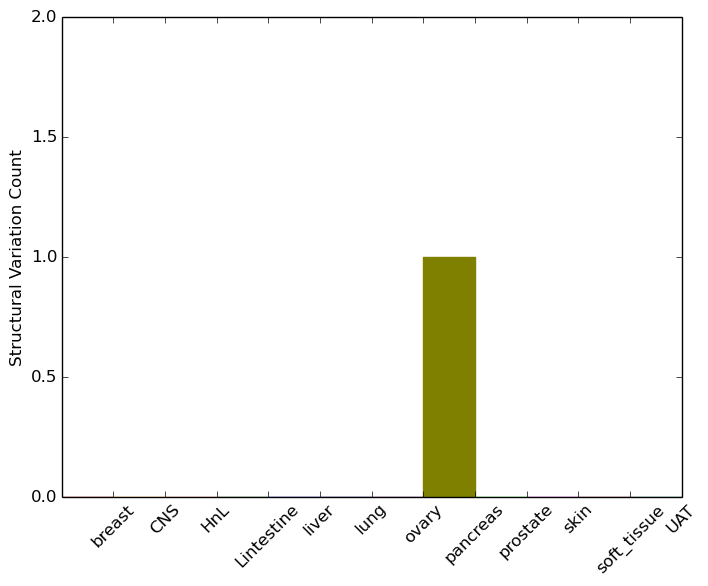
| - For Intra-chromosomal Variations |
| * Intra-chromosomal variantions includes 'intrachromosomal amplicon to amplicon', 'intrachromosomal amplicon to non-amplified dna', 'intrachromosomal deletion', 'intrachromosomal fold-back inversion', 'intrachromosomal inversion', 'intrachromosomal tandem duplication', 'Intrachromosomal unknown type', 'intrachromosomal with inverted orientation', 'intrachromosomal with non-inverted orientation'. |
 |
| Sample | Symbol_a | Chr_a | Start_a | End_a | Symbol_b | Chr_b | Start_b | End_b |
| pancreas | UCKL1 | chr20 | 62581378 | 62581398 | chr20 | 32803880 | 32803900 |
| cf) Tissue number; Tissue name (1;Breast, 2;Central_nervous_system, 3;Haematopoietic_and_lymphoid_tissue, 4;Large_intestine, 5;Liver, 6;Lung, 7;Ovary, 8;Pancreas, 9;Prostate, 10;Skin, 11;Soft_tissue, 12;Upper_aerodigestive_tract) |
| * From mRNA Sanger sequences, Chitars2.0 arranged chimeric transcripts. This table shows UCKL1 related fusion information. |
| ID | Head Gene | Tail Gene | Accession | Gene_a | qStart_a | qEnd_a | Chromosome_a | tStart_a | tEnd_a | Gene_a | qStart_a | qEnd_a | Chromosome_a | tStart_a | tEnd_a |
| Top |
| There's no copy number variation information in COSMIC data for this gene. |
| Top |
|
 |
| Top |
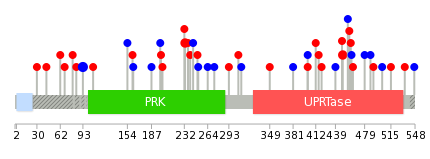
| Stat. for Non-Synonymous SNVs (# total SNVs=22) | (# total SNVs=13) |
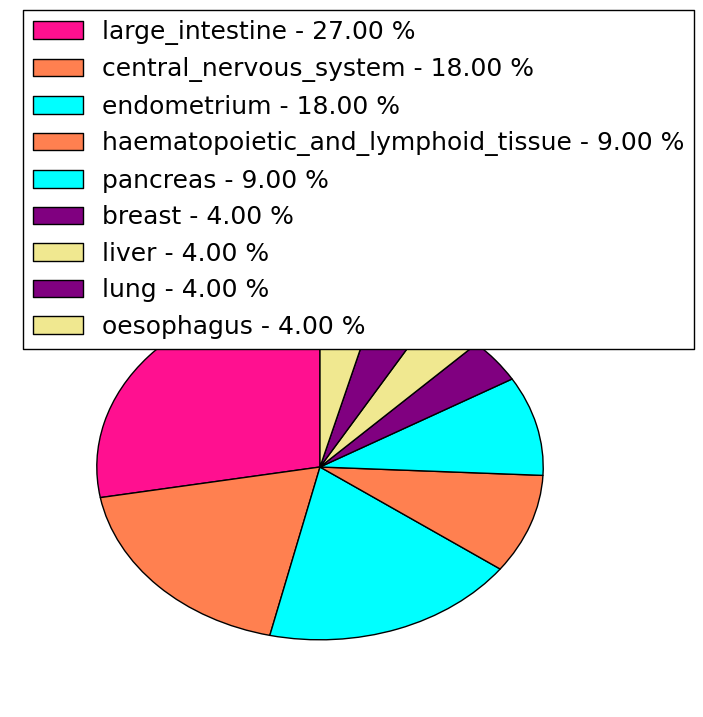 | 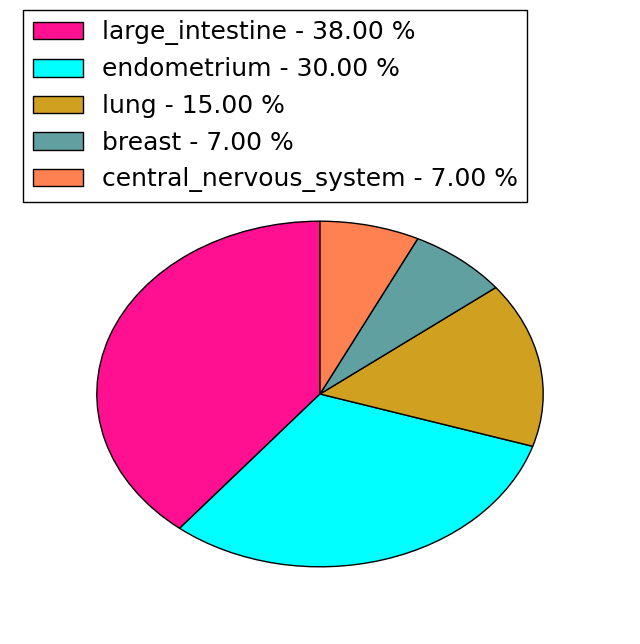 |
(# total SNVs=0) | (# total SNVs=0) |
| Top |
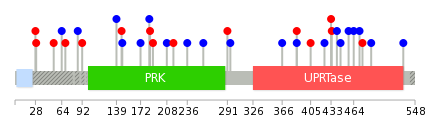
| * When you move the cursor on each content, you can see more deailed mutation information on the Tooltip. Those are primary_site,primary_histology,mutation(aa),pubmedID. |
| GRCh37 position | Mutation(aa) | Unique sampleID count |
| chr20:62577831-62577831 | p.T93T | 3 |
| chr20:62571796-62571796 | p.V449M | 2 |
| chr20:62576044-62576044 | p.R233H | 2 |
| chr20:62571609-62571609 | p.A487A | 1 |
| chr20:62577054-62577054 | p.V202I | 1 |
| chr20:62571990-62571990 | p.G420D | 1 |
| chr20:62577873-62577873 | p.I79M | 1 |
| chr20:62575778-62575778 | p.V293E | 1 |
| chr20:62571633-62571633 | p.I479I | 1 |
| chr20:62577060-62577060 | p.A200S | 1 |
| Top |
|
 |
| Point Mutation/ Tissue ID | 1 | 2 | 3 | 4 | 5 | 6 | 7 | 8 | 9 | 10 | 11 | 12 | 13 | 14 | 15 | 16 | 17 | 18 | 19 | 20 |
| # sample | 2 | 1 | 1 | 3 | 2 | 1 | 1 | 2 | 2 | 3 | 7 | 7 | ||||||||
| # mutation | 2 | 1 | 1 | 3 | 2 | 1 | 1 | 2 | 2 | 3 | 7 | 8 | ||||||||
| nonsynonymous SNV | 1 | 1 | 2 | 1 | 1 | 1 | 2 | 1 | 4 | |||||||||||
| synonymous SNV | 1 | 1 | 1 | 1 | 1 | 1 | 2 | 1 | 6 | 4 |
| cf) Tissue ID; Tissue type (1; BLCA[Bladder Urothelial Carcinoma], 2; BRCA[Breast invasive carcinoma], 3; CESC[Cervical squamous cell carcinoma and endocervical adenocarcinoma], 4; COAD[Colon adenocarcinoma], 5; GBM[Glioblastoma multiforme], 6; Glioma Low Grade, 7; HNSC[Head and Neck squamous cell carcinoma], 8; KICH[Kidney Chromophobe], 9; KIRC[Kidney renal clear cell carcinoma], 10; KIRP[Kidney renal papillary cell carcinoma], 11; LAML[Acute Myeloid Leukemia], 12; LUAD[Lung adenocarcinoma], 13; LUSC[Lung squamous cell carcinoma], 14; OV[Ovarian serous cystadenocarcinoma ], 15; PAAD[Pancreatic adenocarcinoma], 16; PRAD[Prostate adenocarcinoma], 17; SKCM[Skin Cutaneous Melanoma], 18:STAD[Stomach adenocarcinoma], 19:THCA[Thyroid carcinoma], 20:UCEC[Uterine Corpus Endometrial Carcinoma]) |
| Top |
| * We represented just top 10 SNVs. When you move the cursor on each content, you can see more deailed mutation information on the Tooltip. Those are primary_site, primary_histology, mutation(aa), pubmedID. |
| Genomic Position | Mutation(aa) | Unique sampleID count |
| chr20:62571758 | p.G184G,UCKL1 | 1 |
| chr20:62575923 | p.V441V,UCKL1 | 1 |
| chr20:62577605 | p.T172T,UCKL1 | 1 |
| chr20:62571773 | p.V434M,UCKL1 | 1 |
| chr20:62575989 | p.H433Q,UCKL1 | 1 |
| chr20:62577807 | p.F147F,UCKL1 | 1 |
| chr20:62571796 | p.R424R,UCKL1 | 1 |
| chr20:62576048 | p.D146N,UCKL1 | 1 |
| chr20:62577859 | p.G405D,UCKL1 | 1 |
| chr20:62571797 | p.F139F,UCKL1 | 1 |
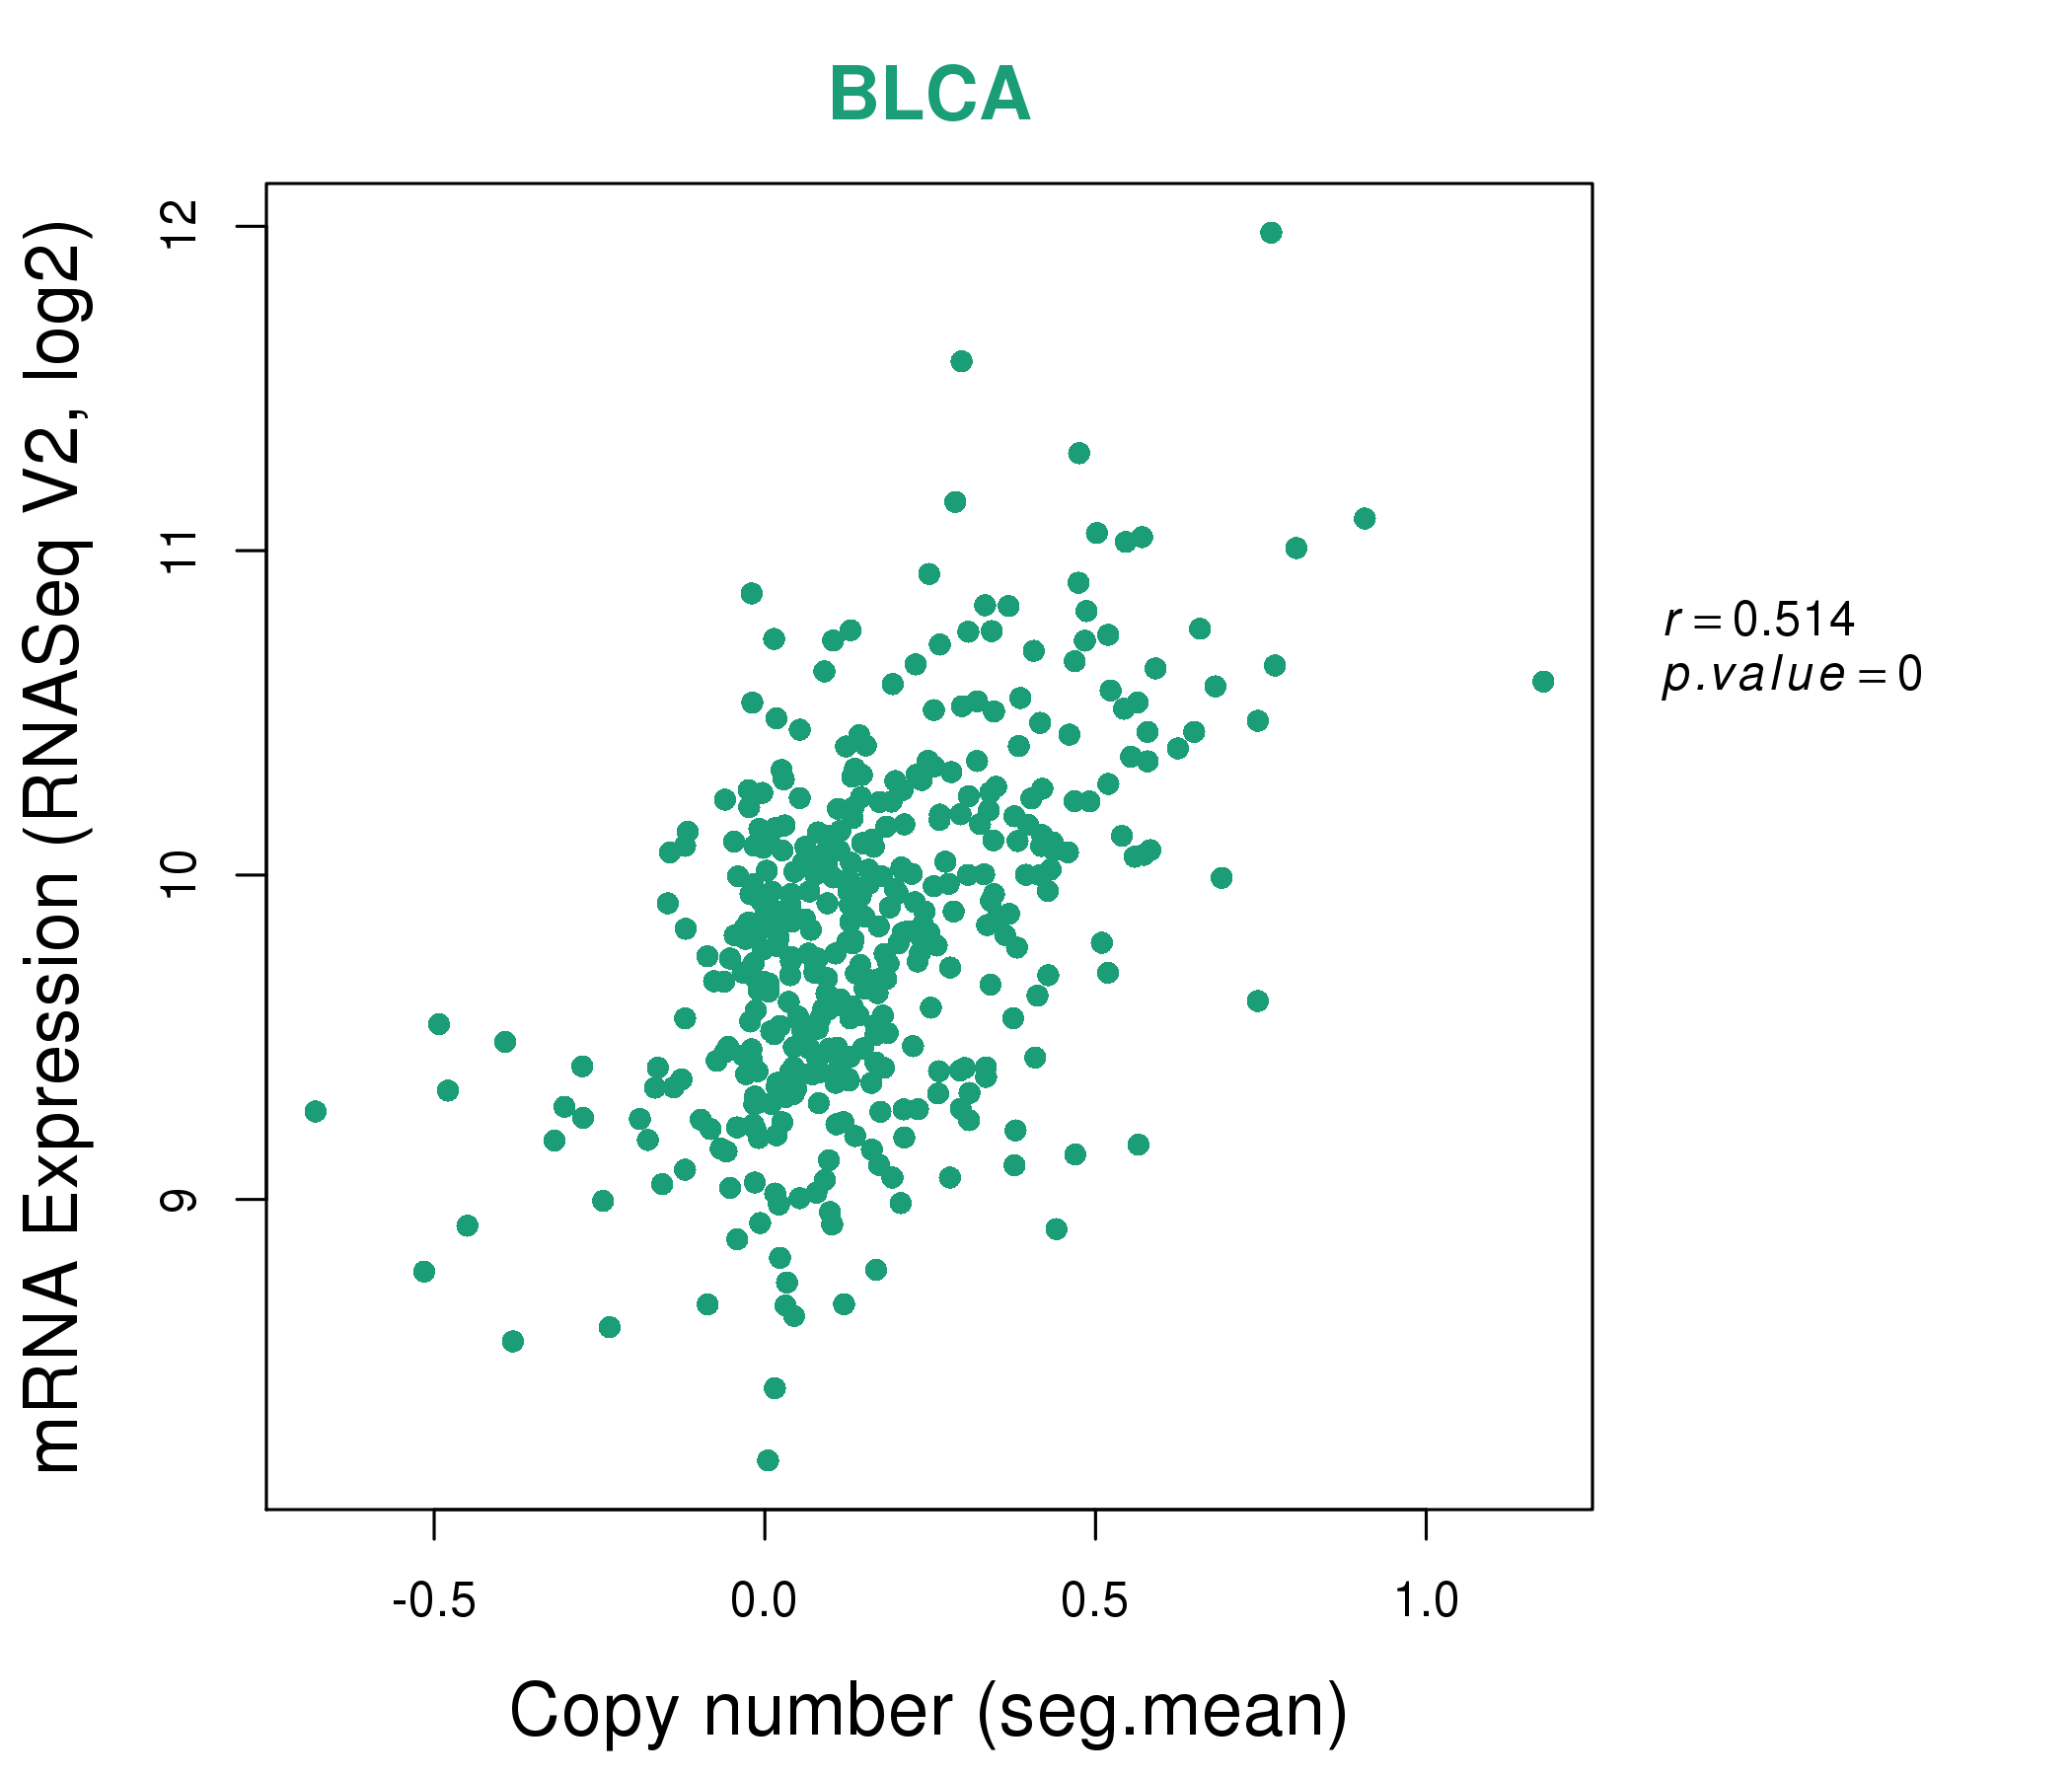
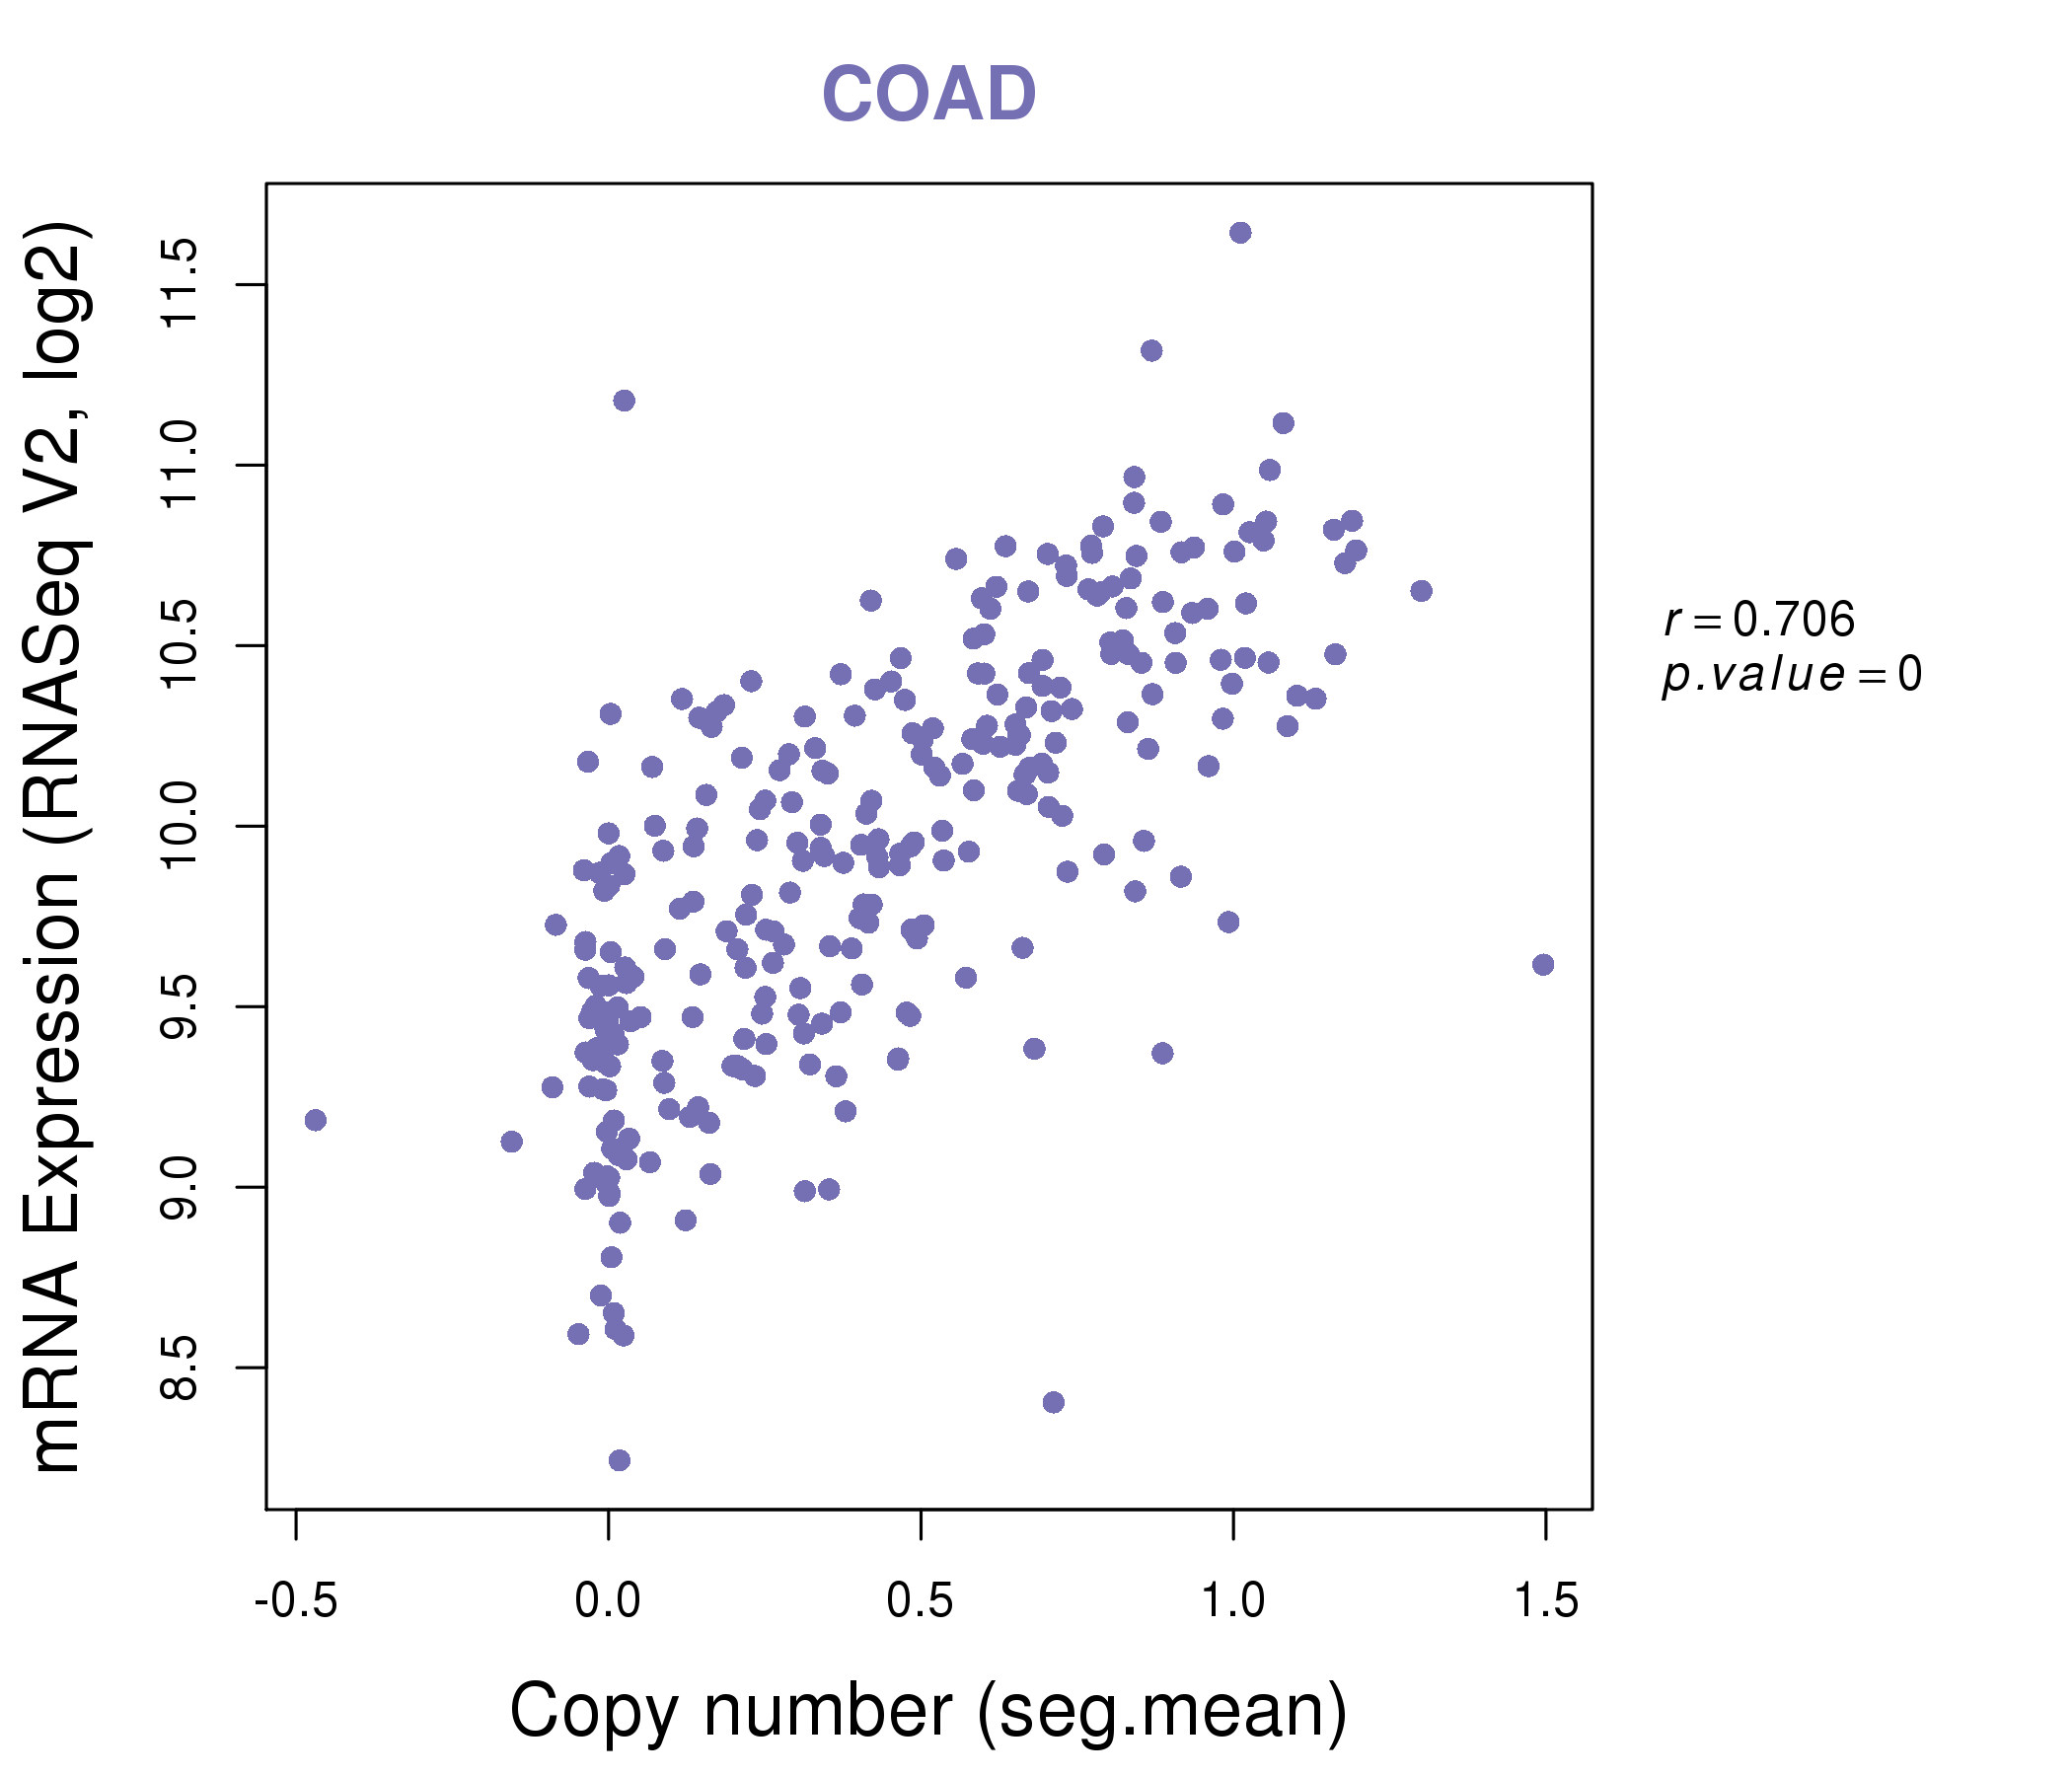
| * Copy number data were extracted from TCGA using R package TCGA-Assembler. The URLs of all public data files on TCGA DCC data server were gathered on Jan-05-2015. Function ProcessCNAData in TCGA-Assembler package was used to obtain gene-level copy number value which is calculated as the average copy number of the genomic region of a gene. |
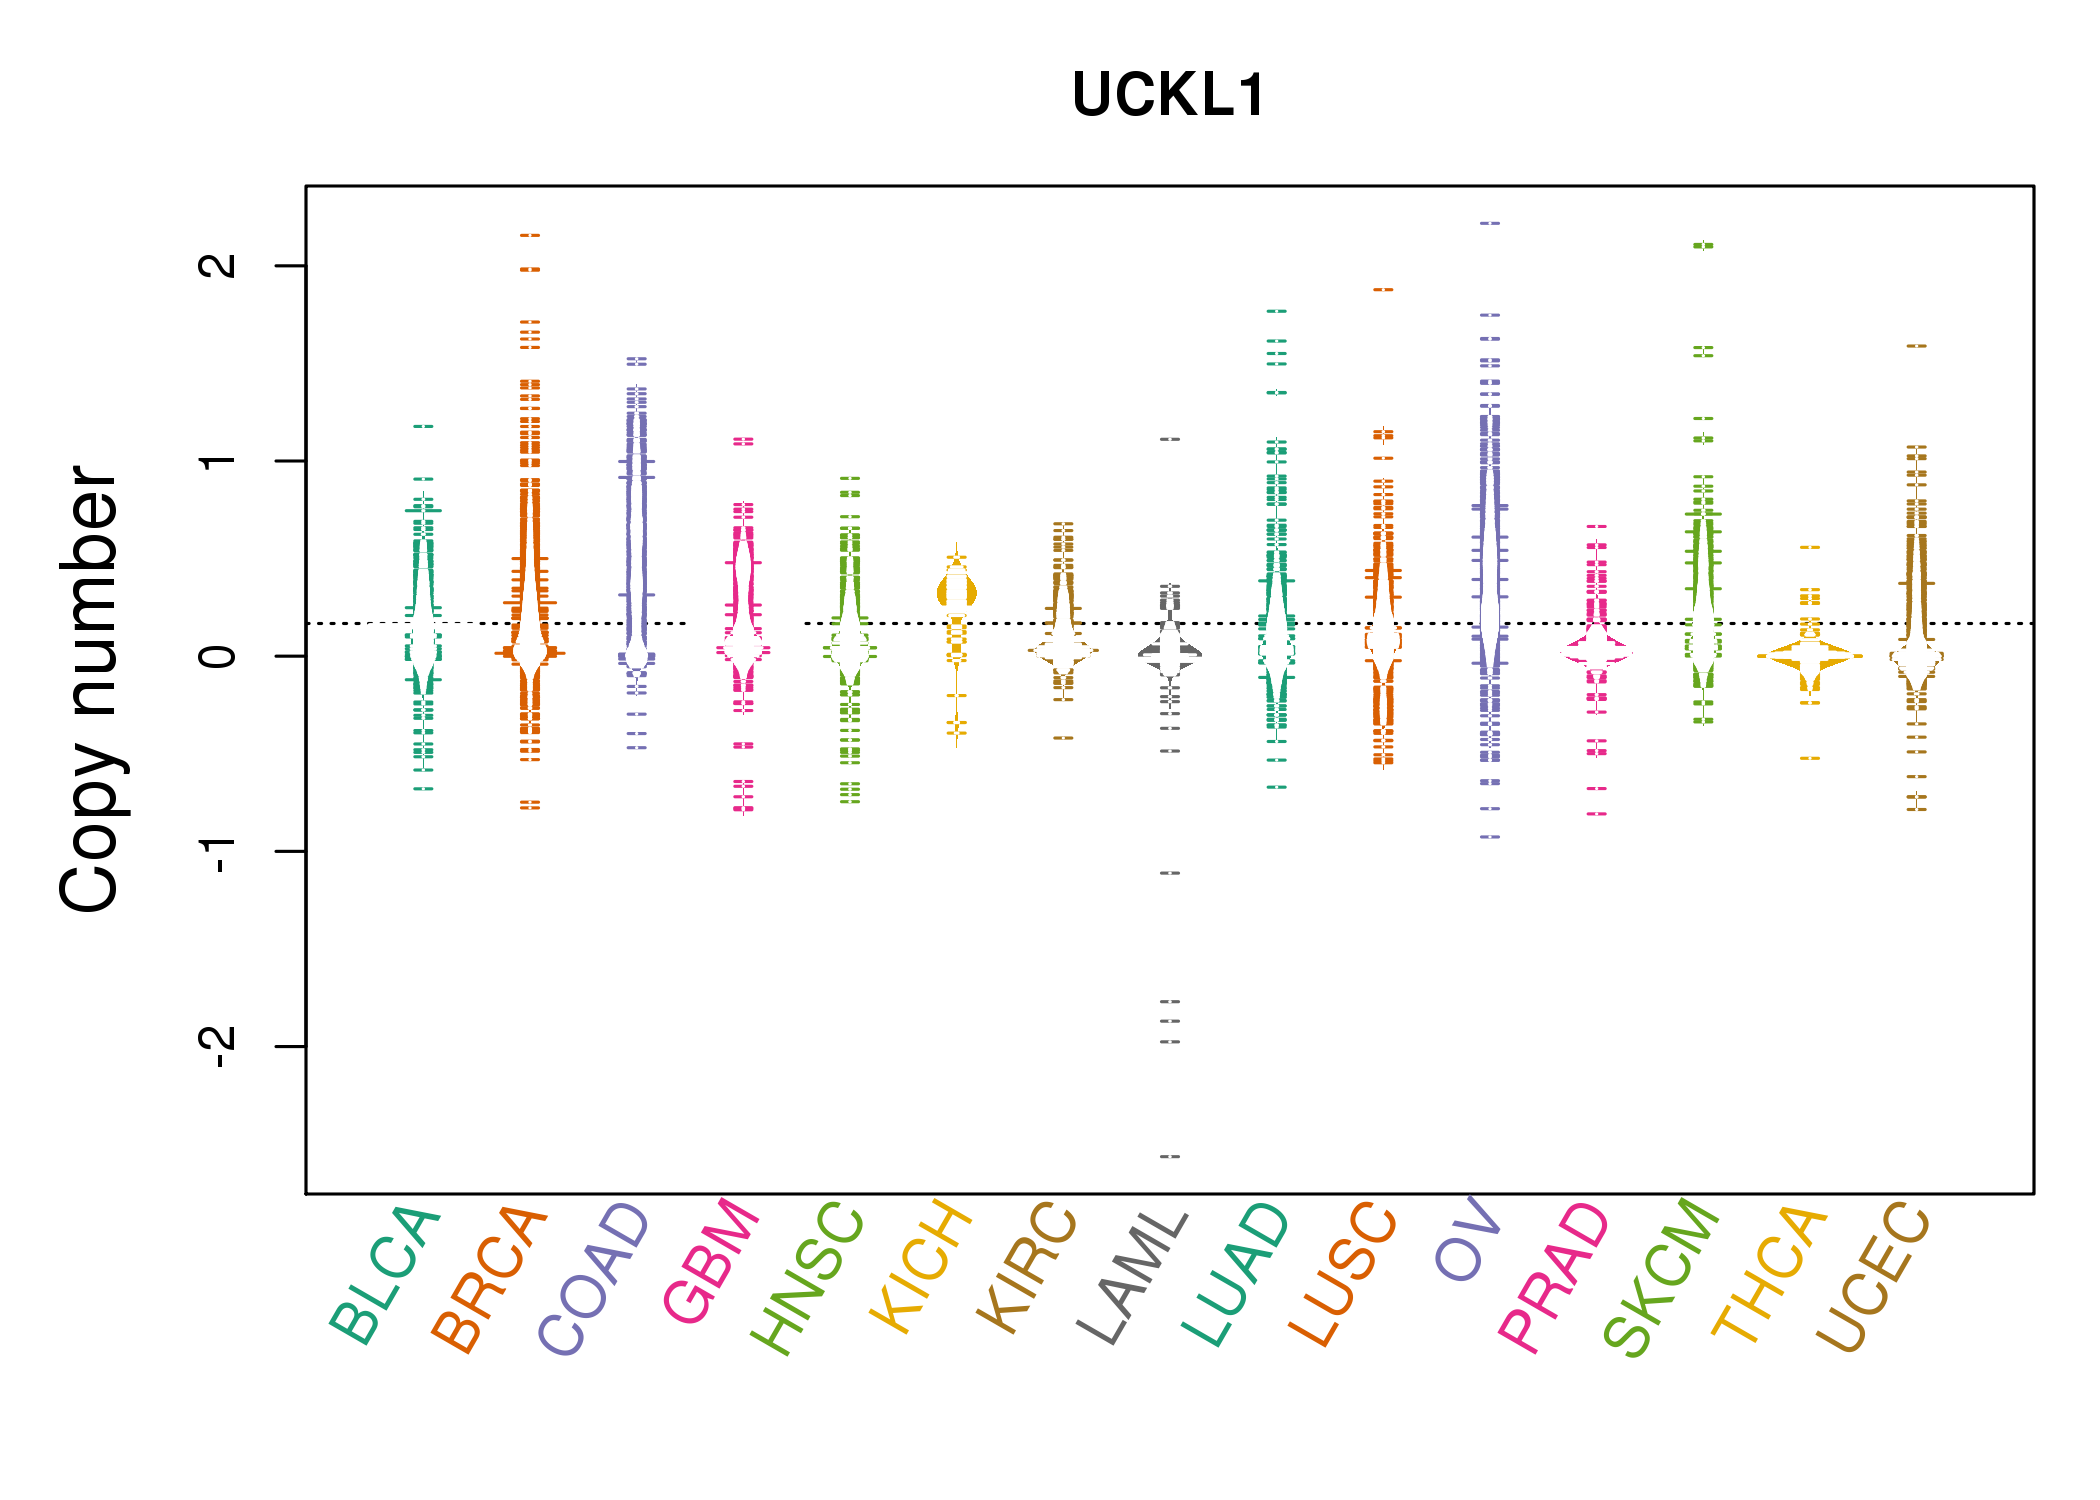 |
| cf) Tissue ID[Tissue type]: BLCA[Bladder Urothelial Carcinoma], BRCA[Breast invasive carcinoma], CESC[Cervical squamous cell carcinoma and endocervical adenocarcinoma], COAD[Colon adenocarcinoma], GBM[Glioblastoma multiforme], Glioma Low Grade, HNSC[Head and Neck squamous cell carcinoma], KICH[Kidney Chromophobe], KIRC[Kidney renal clear cell carcinoma], KIRP[Kidney renal papillary cell carcinoma], LAML[Acute Myeloid Leukemia], LUAD[Lung adenocarcinoma], LUSC[Lung squamous cell carcinoma], OV[Ovarian serous cystadenocarcinoma ], PAAD[Pancreatic adenocarcinoma], PRAD[Prostate adenocarcinoma], SKCM[Skin Cutaneous Melanoma], STAD[Stomach adenocarcinoma], THCA[Thyroid carcinoma], UCEC[Uterine Corpus Endometrial Carcinoma] |
| Top |
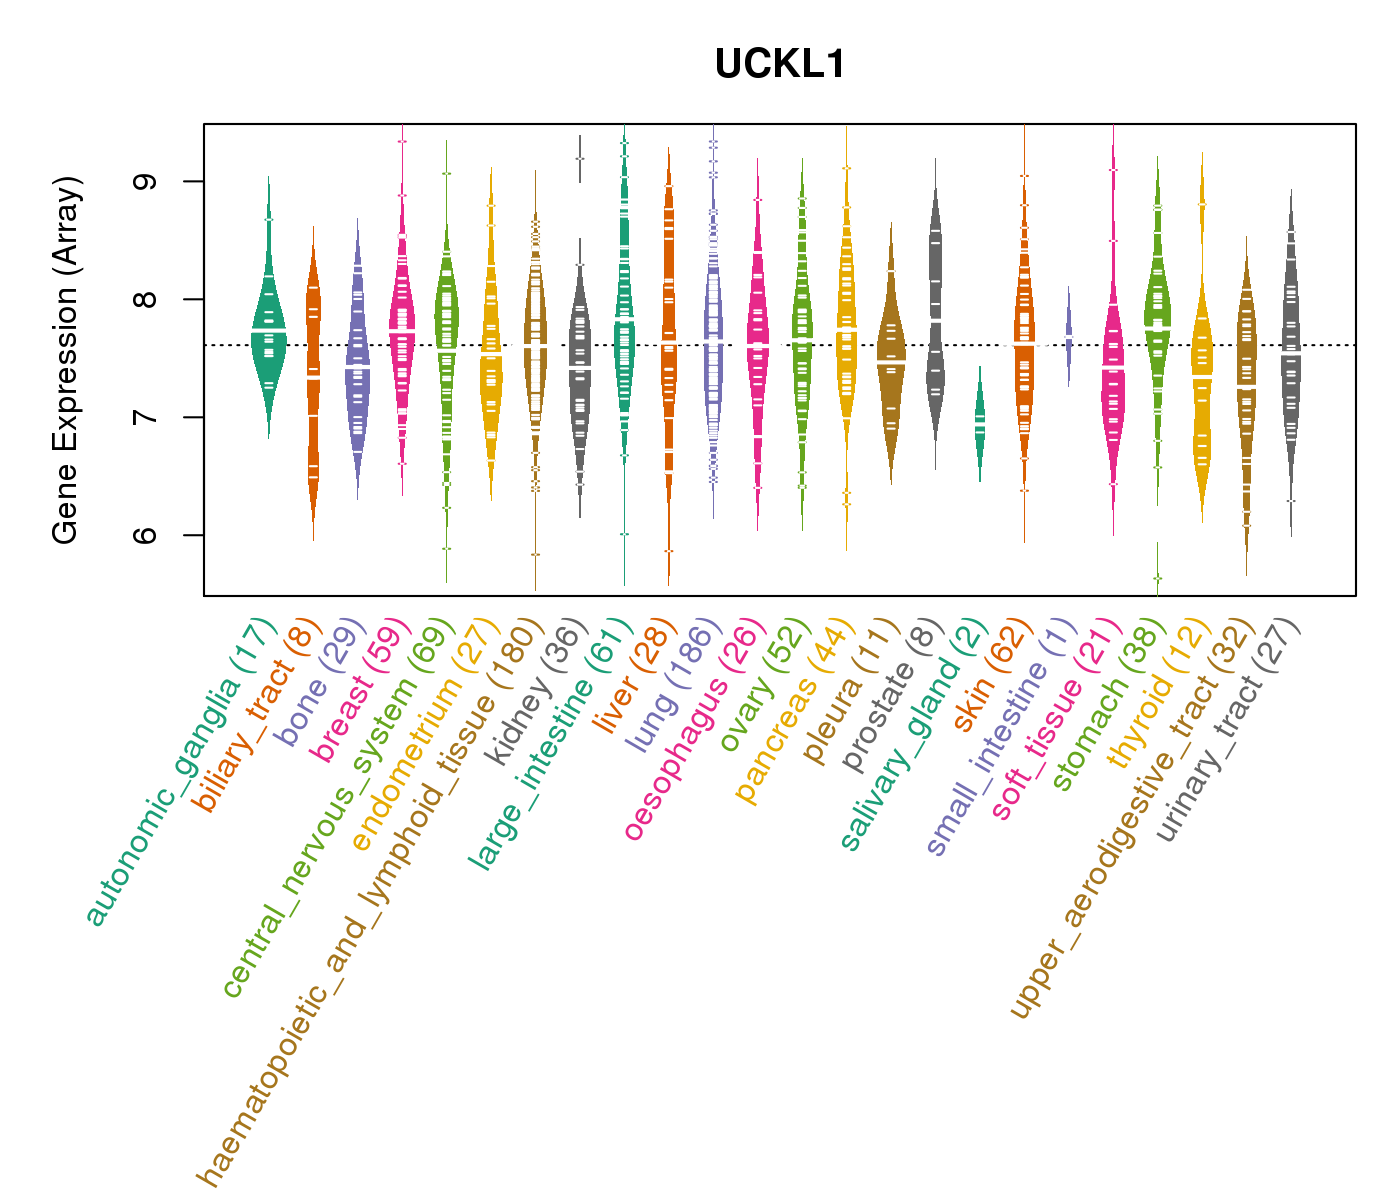
| Gene Expression for UCKL1 |
| * CCLE gene expression data were extracted from CCLE_Expression_Entrez_2012-10-18.res: Gene-centric RMA-normalized mRNA expression data. |
 |
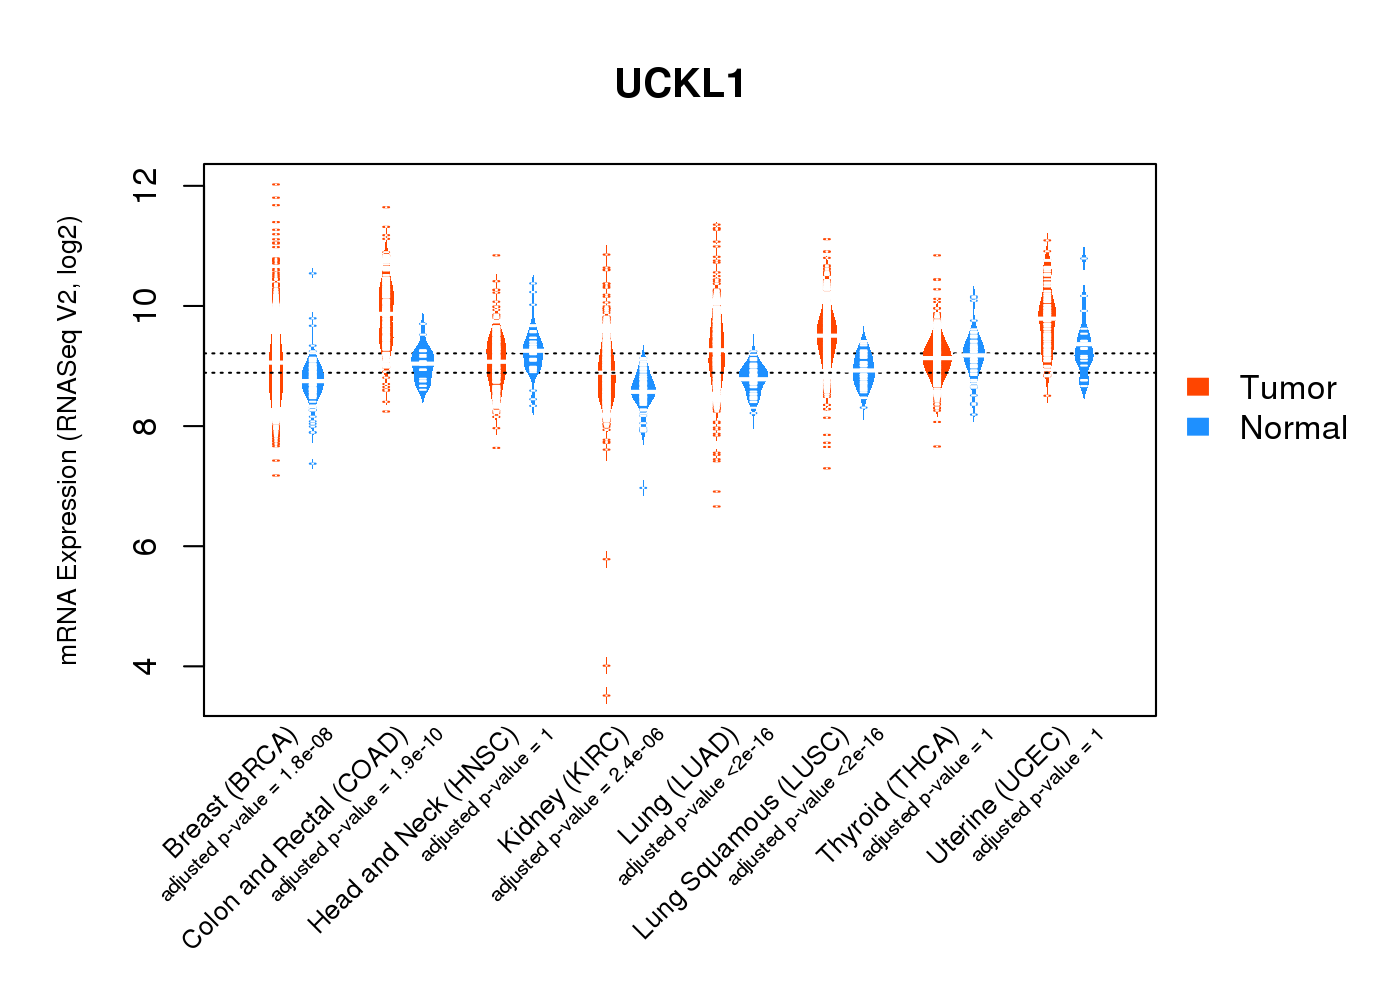
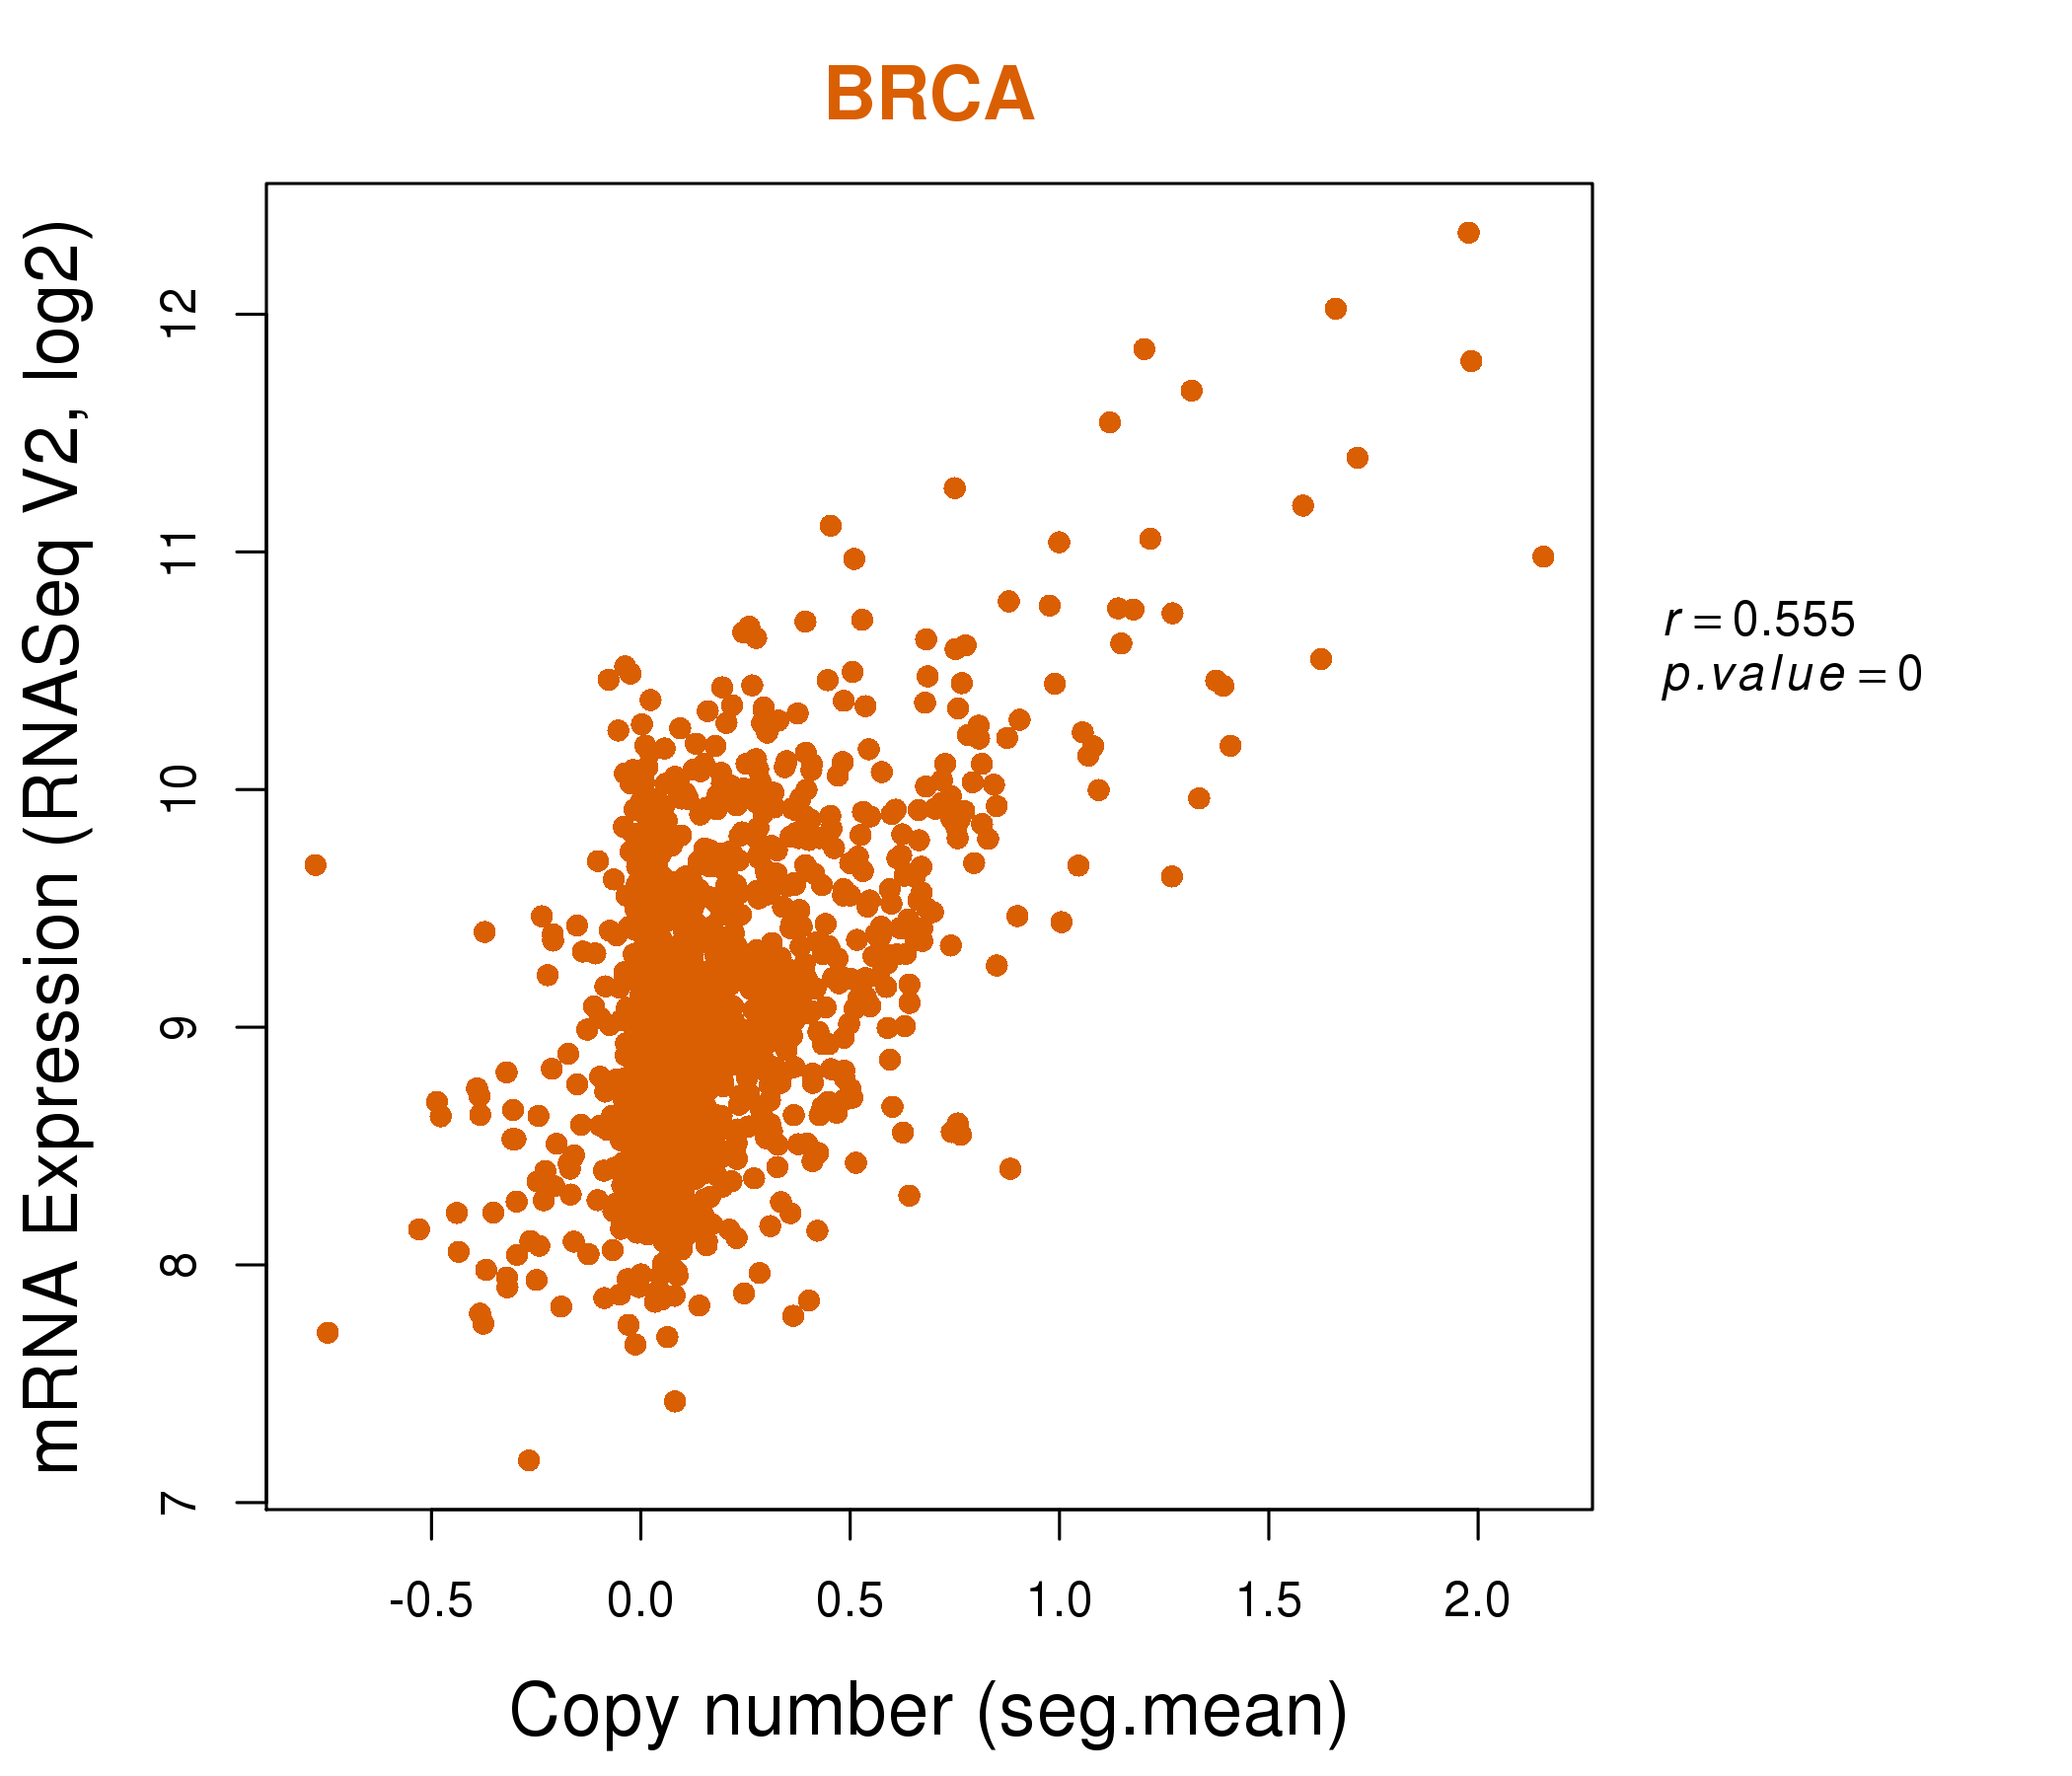
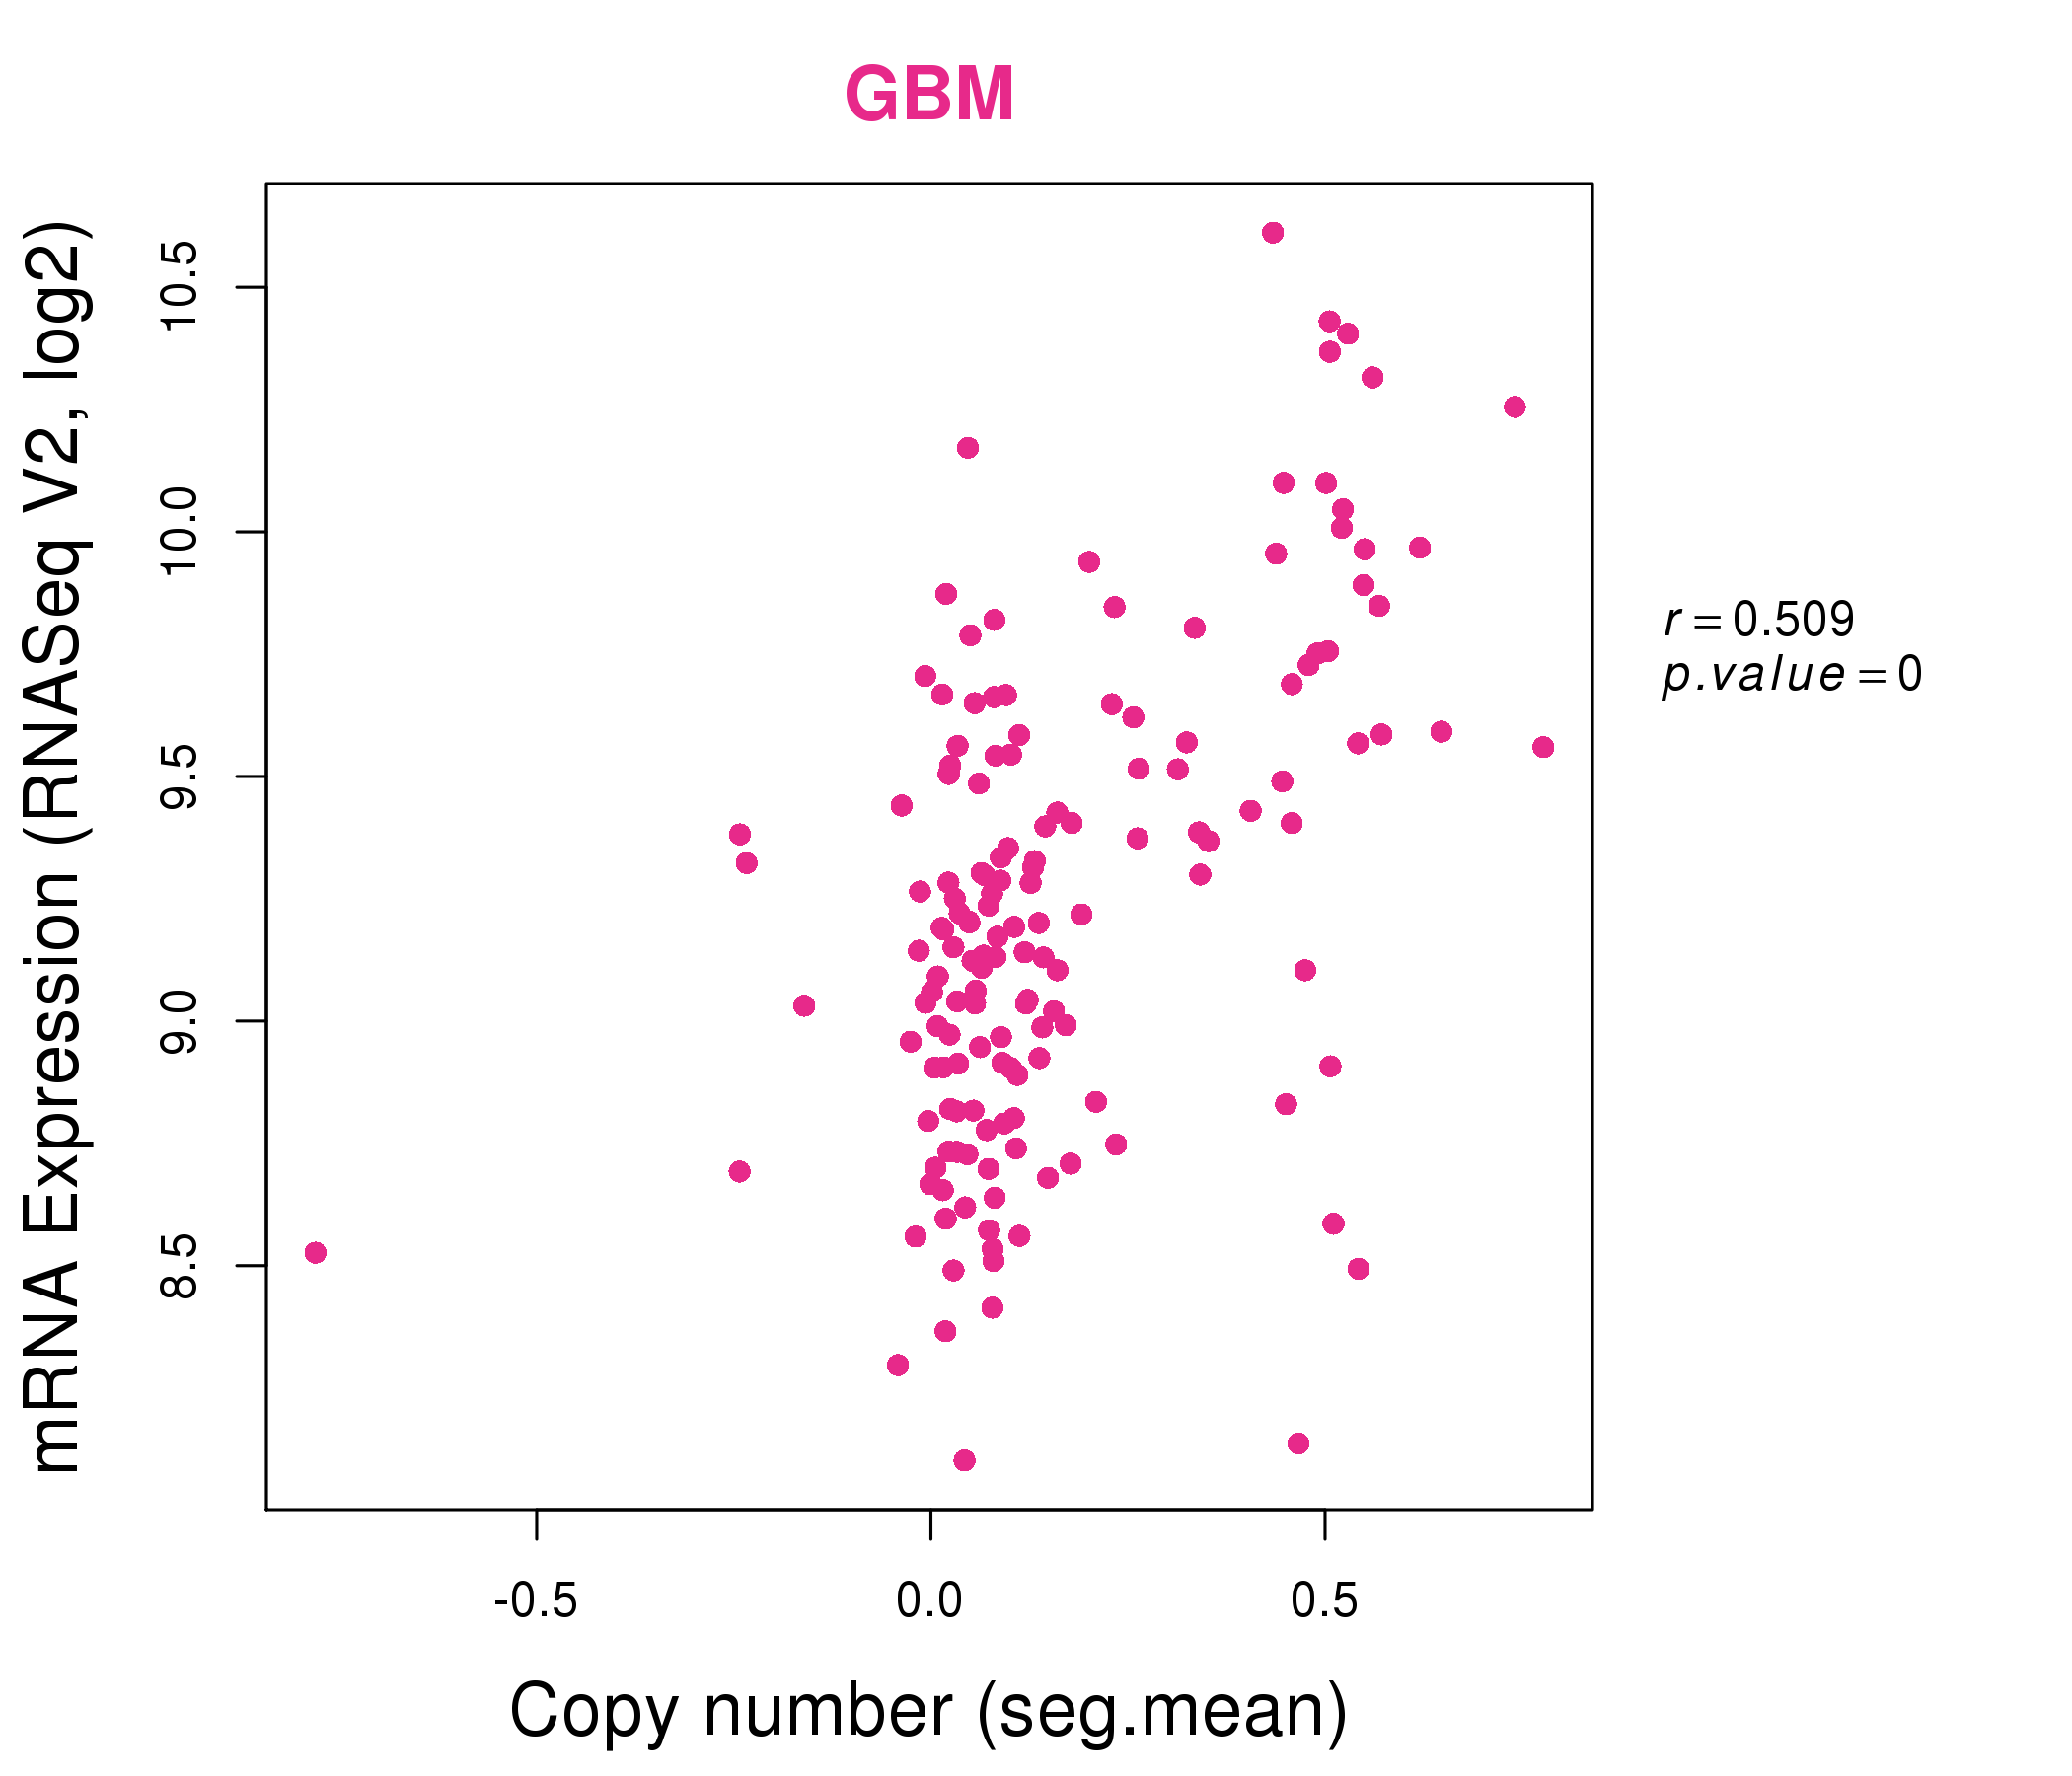
| * Normalized gene expression data of RNASeqV2 was extracted from TCGA using R package TCGA-Assembler. The URLs of all public data files on TCGA DCC data server were gathered at Jan-05-2015. Only eight cancer types have enough normal control samples for differential expression analysis. (t test, adjusted p<0.05 (using Benjamini-Hochberg FDR)) |
 |
| Top |
| * This plots show the correlation between CNV and gene expression. |
: Open all plots for all cancer types
 |
|
 |
|
| Top |
| Gene-Gene Network Information |
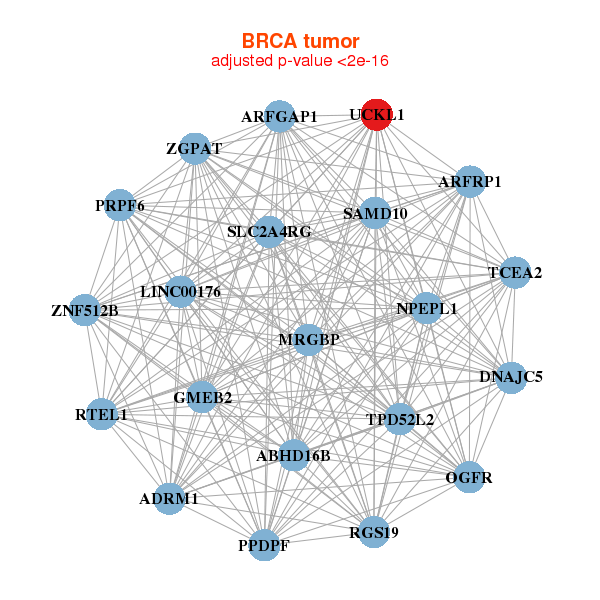
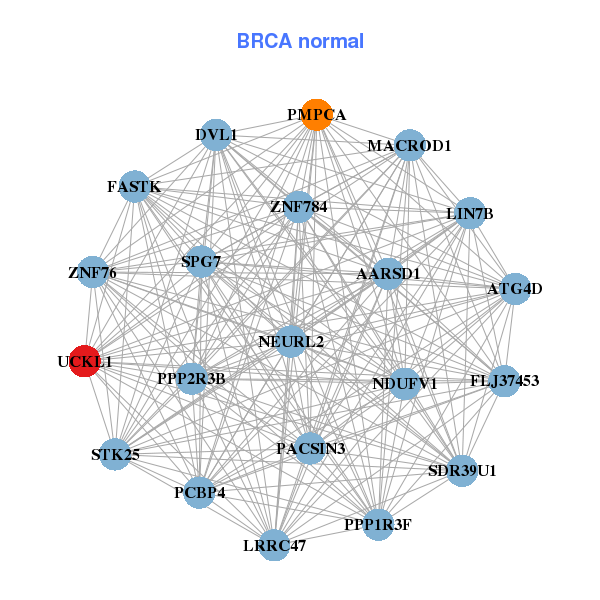
| * Co-Expression network figures were drawn using R package igraph. Only the top 20 genes with the highest correlations were shown. Red circle: input gene, orange circle: cell metabolism gene, sky circle: other gene |
: Open all plots for all cancer types
 |
|
| ADRM1,ARFGAP1,ARFRP1,ABHD16B,MRGBP,DNAJC5,GMEB2, LINC00176,NPEPL1,OGFR,PPDPF,PRPF6,RGS19,RTEL1, SAMD10,SLC2A4RG,TCEA2,TPD52L2,UCKL1,ZGPAT,ZNF512B | AARSD1,ATG4D,DVL1,FASTK,FLJ37453,LIN7B,LRRC47, MACROD1,NDUFV1,NEURL2,PACSIN3,PCBP4,PMPCA,PPP1R3F, PPP2R3B,SDR39U1,SPG7,STK25,UCKL1,ZNF76,ZNF784 |
 |
|
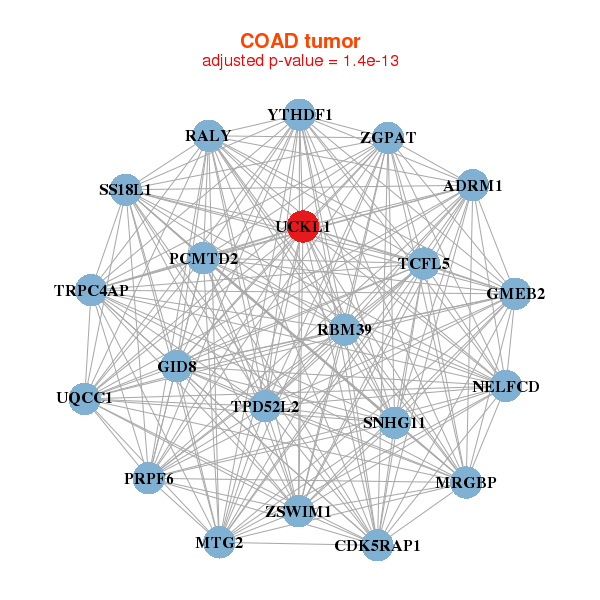
| ADRM1,GID8,MRGBP,CDK5RAP1,GMEB2,MTG2,PCMTD2, PRPF6,RALY,RBM39,SNHG11,SS18L1,TCFL5,NELFCD, TPD52L2,TRPC4AP,UCKL1,UQCC1,YTHDF1,ZGPAT,ZSWIM1 | ADCK5,LMNTD2,ENTHD2,CAPN10,CCDC130,CDK10,CLEC18A, CPSF3L,FASTK,IRF3,PIDD1,MAMDC4,MYL5,OGFOD2, PHKG2,PHLDB3,CLASRP,TAZ,TRPV1,UCKL1,WRAP73 |
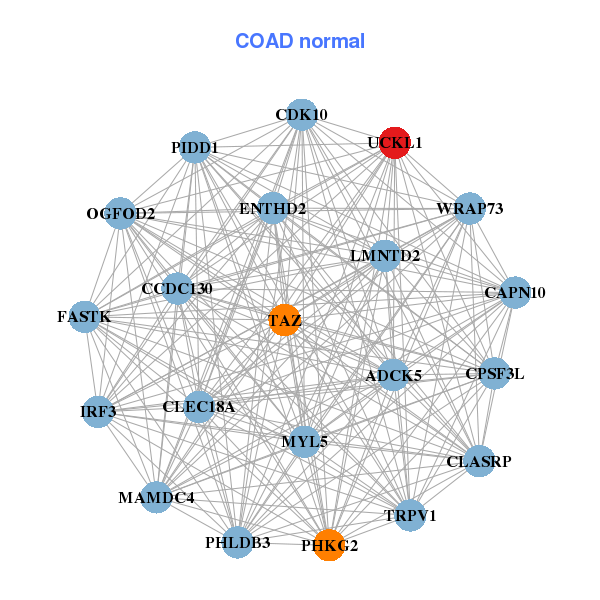
| * Co-Expression network figures were drawn using R package igraph. Only the top 20 genes with the highest correlations were shown. Red circle: input gene, orange circle: cell metabolism gene, sky circle: other gene |
: Open all plots for all cancer types
| Top |
: Open all interacting genes' information including KEGG pathway for all interacting genes from DAVID
| Top |
| Pharmacological Information for UCKL1 |
| There's no related Drug. |
| Top |
| Cross referenced IDs for UCKL1 |
| * We obtained these cross-references from Uniprot database. It covers 150 different DBs, 18 categories. http://www.uniprot.org/help/cross_references_section |
: Open all cross reference information
|
Copyright © 2016-Present - The Univsersity of Texas Health Science Center at Houston @ |