|
||||||||||||||||||||
| |
| Phenotypic Information (metabolism pathway, cancer, disease, phenome) |
| |
| |
| Gene-Gene Network Information: Co-Expression Network, Interacting Genes & KEGG |
| |
|


| Gene Summary for PPOX |
| Basic gene info. | Gene symbol | PPOX |
| Gene name | protoporphyrinogen oxidase | |
| Synonyms | PPO|V290M|VP | |
| Cytomap | UCSC genome browser: 1q22 | |
| Genomic location | chr1 :161136180-161141010 | |
| Type of gene | protein-coding | |
| RefGenes | NM_000309.3, NM_001122764.1, | |
| Ensembl id | ENSG00000143224 | |
| Description | - | |
| Modification date | 20141219 | |
| dbXrefs | MIM : 600923 | |
| HGNC : HGNC | ||
| Ensembl : ENSG00000143224 | ||
| HPRD : 02953 | ||
| Vega : OTTHUMG00000034342 | ||
| Protein | UniProt: go to UniProt's Cross Reference DB Table | |
| Expression | CleanEX: HS_PPOX | |
| BioGPS: 5498 | ||
| Gene Expression Atlas: ENSG00000143224 | ||
| The Human Protein Atlas: ENSG00000143224 | ||
| Pathway | NCI Pathway Interaction Database: PPOX | |
| KEGG: PPOX | ||
| REACTOME: PPOX | ||
| ConsensusPathDB | ||
| Pathway Commons: PPOX | ||
| Metabolism | MetaCyc: PPOX | |
| HUMANCyc: PPOX | ||
| Regulation | Ensembl's Regulation: ENSG00000143224 | |
| miRBase: chr1 :161,136,180-161,141,010 | ||
| TargetScan: NM_000309 | ||
| cisRED: ENSG00000143224 | ||
| Context | iHOP: PPOX | |
| cancer metabolism search in PubMed: PPOX | ||
| UCL Cancer Institute: PPOX | ||
| Assigned class in ccmGDB | C | |
| Top |
| Phenotypic Information for PPOX(metabolism pathway, cancer, disease, phenome) |
| Cancer | CGAP: PPOX |
| Familial Cancer Database: PPOX | |
| * This gene is included in those cancer gene databases. |
|
|
|
|
|
| . | ||||||||||||||
Oncogene 1 | Significant driver gene in | |||||||||||||||||||
| cf) number; DB name 1 Oncogene; http://nar.oxfordjournals.org/content/35/suppl_1/D721.long, 2 Tumor Suppressor gene; https://bioinfo.uth.edu/TSGene/, 3 Cancer Gene Census; http://www.nature.com/nrc/journal/v4/n3/abs/nrc1299.html, 4 CancerGenes; http://nar.oxfordjournals.org/content/35/suppl_1/D721.long, 5 Network of Cancer Gene; http://ncg.kcl.ac.uk/index.php, 1Therapeutic Vulnerabilities in Cancer; http://cbio.mskcc.org/cancergenomics/statius/ |
| KEGG_PORPHYRIN_AND_CHLOROPHYLL_METABOLISM REACTOME_METABOLISM_OF_PORPHYRINS | |
| OMIM | |
| Orphanet | |
| Disease | KEGG Disease: PPOX |
| MedGen: PPOX (Human Medical Genetics with Condition) | |
| ClinVar: PPOX | |
| Phenotype | MGI: PPOX (International Mouse Phenotyping Consortium) |
| PhenomicDB: PPOX | |
| Mutations for PPOX |
| * Under tables are showing count per each tissue to give us broad intuition about tissue specific mutation patterns.You can go to the detailed page for each mutation database's web site. |
| There's no structural variation information in COSMIC data for this gene. |
| * From mRNA Sanger sequences, Chitars2.0 arranged chimeric transcripts. This table shows PPOX related fusion information. |
| ID | Head Gene | Tail Gene | Accession | Gene_a | qStart_a | qEnd_a | Chromosome_a | tStart_a | tEnd_a | Gene_a | qStart_a | qEnd_a | Chromosome_a | tStart_a | tEnd_a |
| DC302335 | ELK1 | 2 | 87 | X | 47509894 | 47509979 | PPOX | 87 | 546 | 1 | 161144978 | 161146355 | |
| Top |
| There's no copy number variation information in COSMIC data for this gene. |
| Top |
|
 |
| Top |
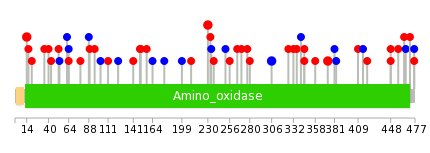
| Stat. for Non-Synonymous SNVs (# total SNVs=31) | (# total SNVs=11) |
 |  |
(# total SNVs=0) | (# total SNVs=0) |
| Top |
| * When you move the cursor on each content, you can see more deailed mutation information on the Tooltip. Those are primary_site,primary_histology,mutation(aa),pubmedID. |
| GRCh37 position | Mutation(aa) | Unique sampleID count |
| chr1:161136677-161136677 | p.G14S | 2 |
| chr1:161140875-161140875 | p.G448A | 2 |
| chr1:161138221-161138221 | p.? | 2 |
| chr1:161140428-161140428 | p.W373R | 2 |
| chr1:161138854-161138854 | p.R230C | 2 |
| chr1:161139745-161139745 | p.L306L | 2 |
| chr1:161136986-161136986 | p.R62R | 1 |
| chr1:161140206-161140206 | p.G332A | 1 |
| chr1:161137892-161137892 | p.F149C | 1 |
| chr1:161140706-161140706 | p.P420T | 1 |
| Top |
|
 |
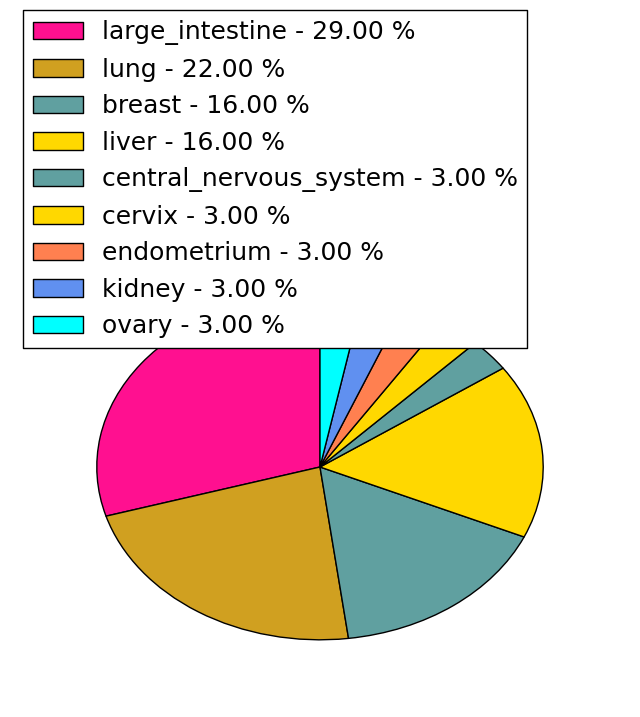
| Point Mutation/ Tissue ID | 1 | 2 | 3 | 4 | 5 | 6 | 7 | 8 | 9 | 10 | 11 | 12 | 13 | 14 | 15 | 16 | 17 | 18 | 19 | 20 |
| # sample | 5 | 2 | 6 | 1 | 3 | 1 | 3 | 1 | 4 | 4 | 1 | 4 | ||||||||
| # mutation | 6 | 2 | 6 | 1 | 3 | 1 | 2 | 1 | 4 | 4 | 1 | 4 | ||||||||
| nonsynonymous SNV | 3 | 2 | 5 | 3 | 1 | 1 | 1 | 3 | 2 | 1 | ||||||||||
| synonymous SNV | 3 | 1 | 1 | 1 | 1 | 2 | 4 |
| cf) Tissue ID; Tissue type (1; BLCA[Bladder Urothelial Carcinoma], 2; BRCA[Breast invasive carcinoma], 3; CESC[Cervical squamous cell carcinoma and endocervical adenocarcinoma], 4; COAD[Colon adenocarcinoma], 5; GBM[Glioblastoma multiforme], 6; Glioma Low Grade, 7; HNSC[Head and Neck squamous cell carcinoma], 8; KICH[Kidney Chromophobe], 9; KIRC[Kidney renal clear cell carcinoma], 10; KIRP[Kidney renal papillary cell carcinoma], 11; LAML[Acute Myeloid Leukemia], 12; LUAD[Lung adenocarcinoma], 13; LUSC[Lung squamous cell carcinoma], 14; OV[Ovarian serous cystadenocarcinoma ], 15; PAAD[Pancreatic adenocarcinoma], 16; PRAD[Prostate adenocarcinoma], 17; SKCM[Skin Cutaneous Melanoma], 18:STAD[Stomach adenocarcinoma], 19:THCA[Thyroid carcinoma], 20:UCEC[Uterine Corpus Endometrial Carcinoma]) |
| Top |
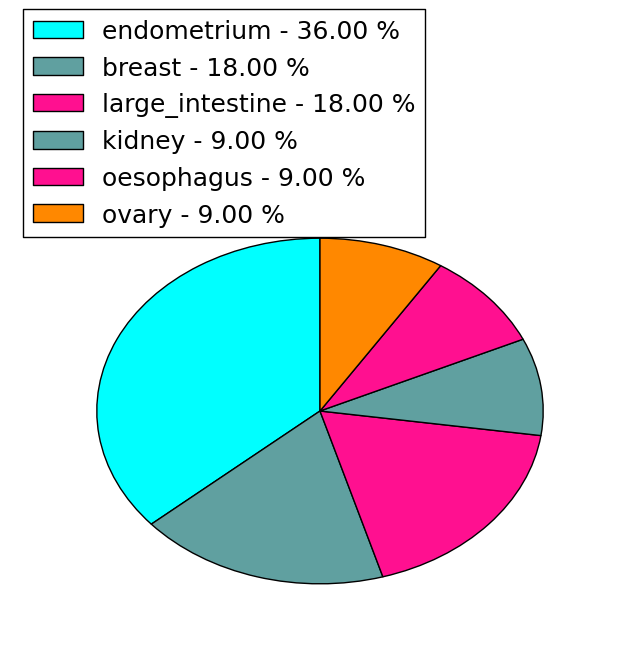
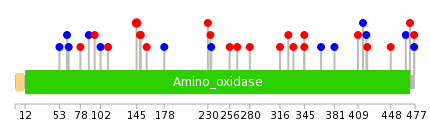
| * We represented just top 10 SNVs. When you move the cursor on each content, you can see more deailed mutation information on the Tooltip. Those are primary_site, primary_histology, mutation(aa), pubmedID. |
| Genomic Position | Mutation(aa) | Unique sampleID count |
| chr1:161137880 | p.T145I,PPOX | 2 |
| chr1:161139773 | p.L178L,PPOX | 1 |
| chr1:161140875 | p.I419I,PPOX | 1 |
| chr1:161137892 | p.R230C,PPOX | 1 |
| chr1:161139803 | p.P420T,PPOX | 1 |
| chr1:161140930 | p.L233V,PPOX | 1 |
| chr1:161137894 | p.G448A,PPOX | 1 |
| chr1:161140206 | p.E234E,PPOX | 1 |
| chr1:161136961 | p.A466A,PPOX | 1 |
| chr1:161140943 | p.I53I,PPOX | 1 |
| * Copy number data were extracted from TCGA using R package TCGA-Assembler. The URLs of all public data files on TCGA DCC data server were gathered on Jan-05-2015. Function ProcessCNAData in TCGA-Assembler package was used to obtain gene-level copy number value which is calculated as the average copy number of the genomic region of a gene. |
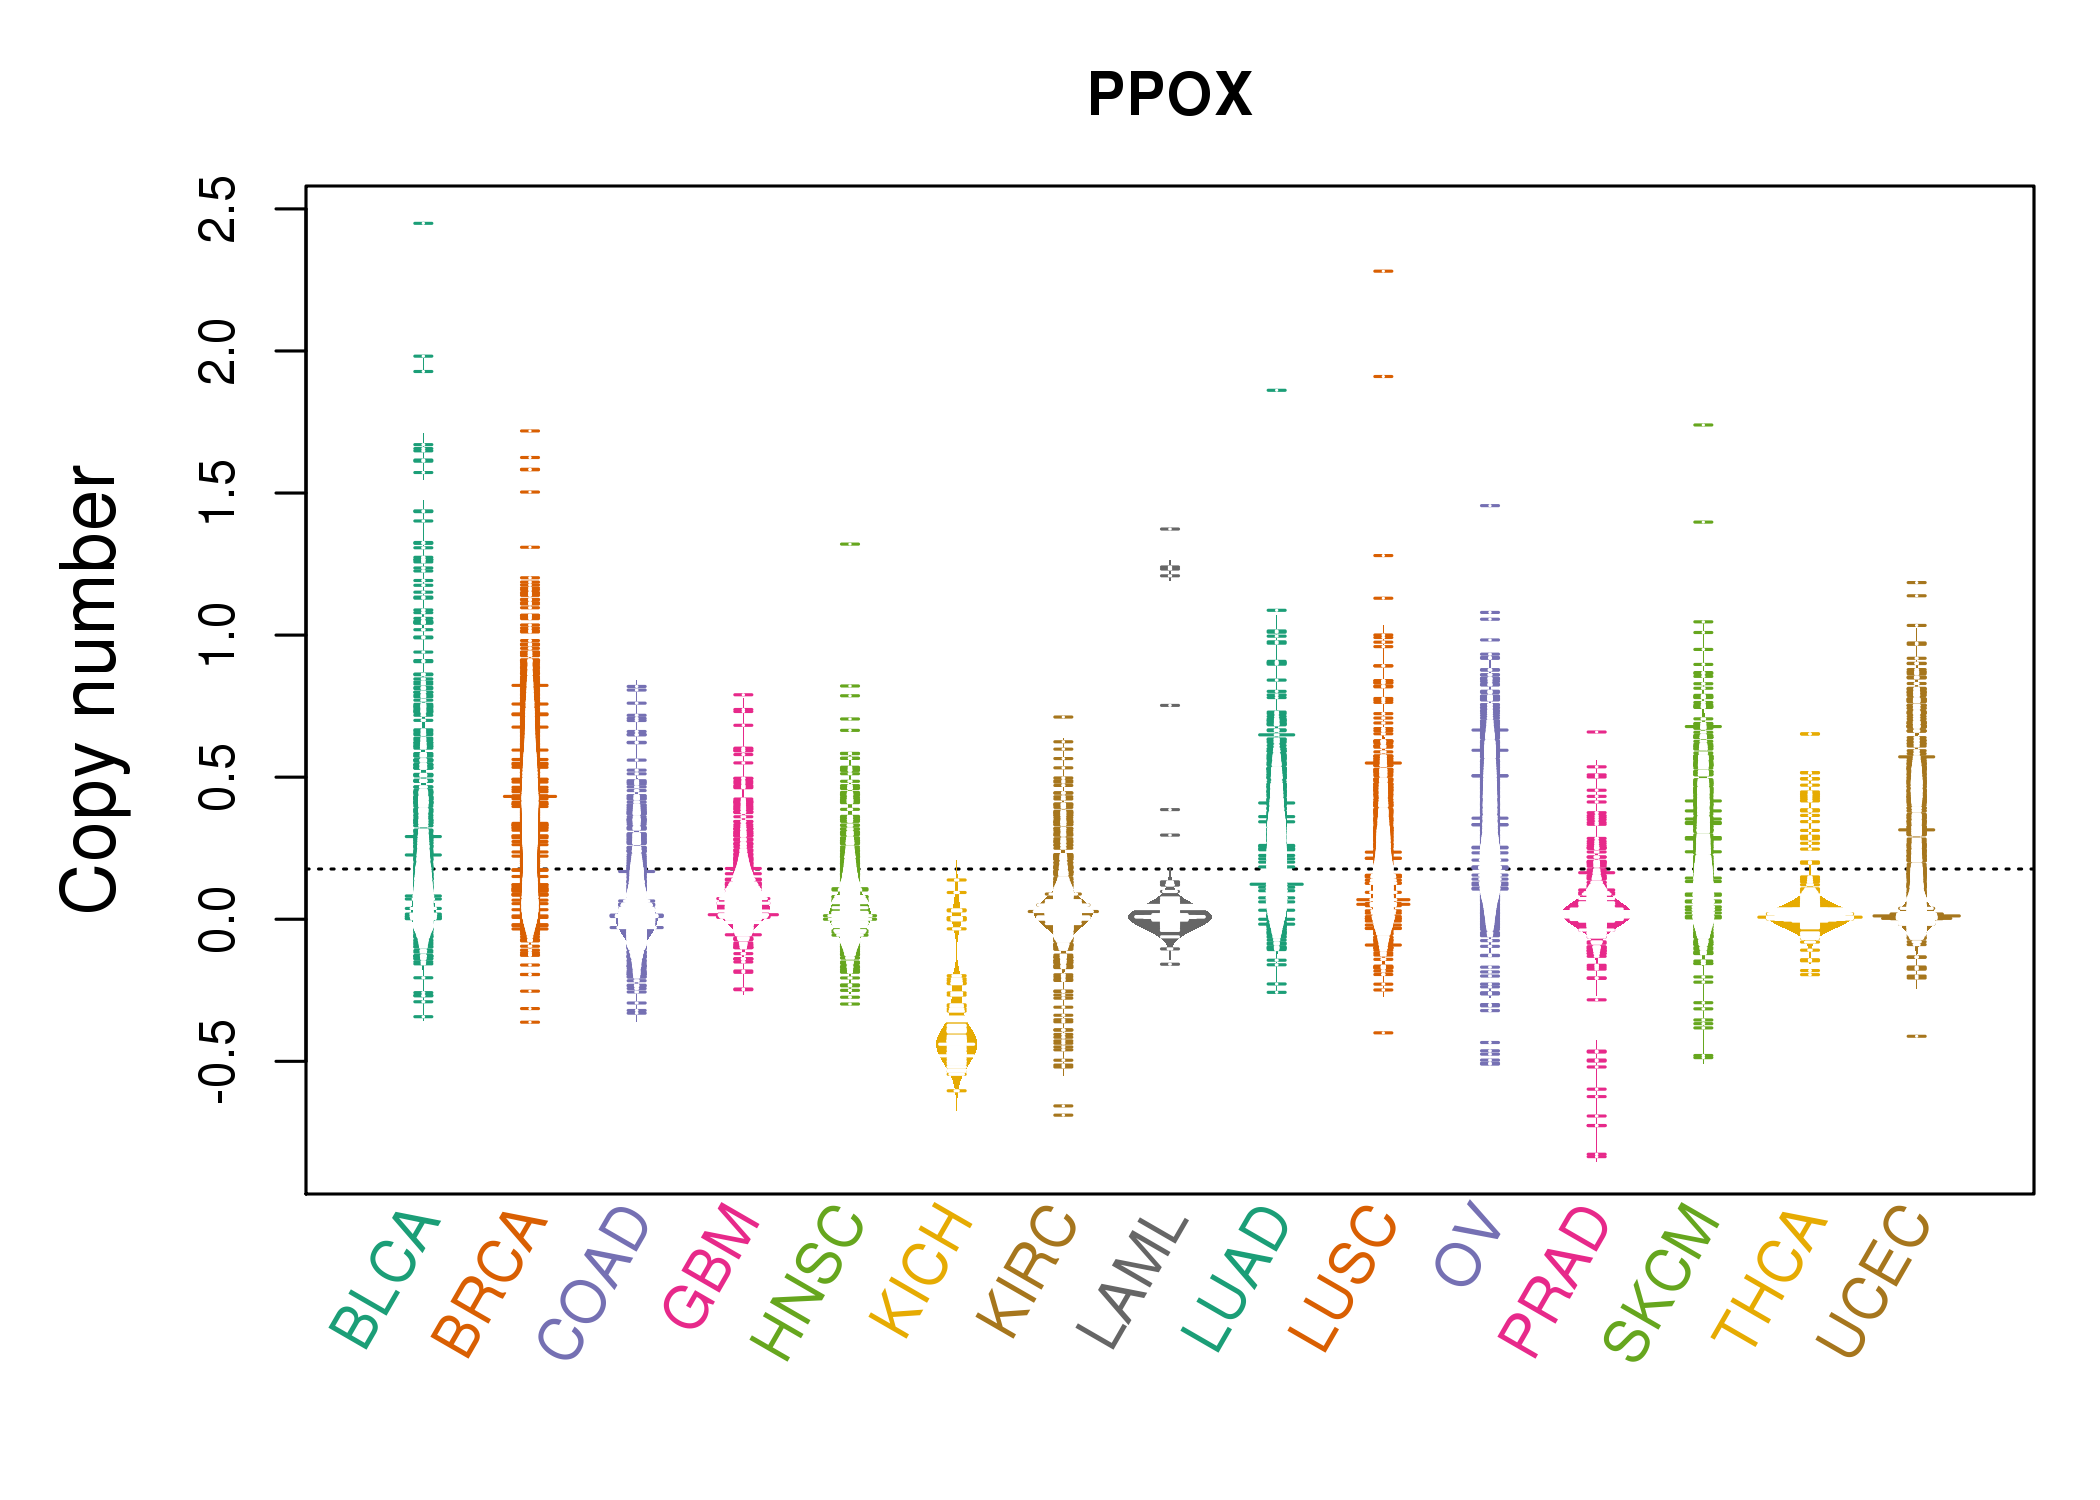 |
| cf) Tissue ID[Tissue type]: BLCA[Bladder Urothelial Carcinoma], BRCA[Breast invasive carcinoma], CESC[Cervical squamous cell carcinoma and endocervical adenocarcinoma], COAD[Colon adenocarcinoma], GBM[Glioblastoma multiforme], Glioma Low Grade, HNSC[Head and Neck squamous cell carcinoma], KICH[Kidney Chromophobe], KIRC[Kidney renal clear cell carcinoma], KIRP[Kidney renal papillary cell carcinoma], LAML[Acute Myeloid Leukemia], LUAD[Lung adenocarcinoma], LUSC[Lung squamous cell carcinoma], OV[Ovarian serous cystadenocarcinoma ], PAAD[Pancreatic adenocarcinoma], PRAD[Prostate adenocarcinoma], SKCM[Skin Cutaneous Melanoma], STAD[Stomach adenocarcinoma], THCA[Thyroid carcinoma], UCEC[Uterine Corpus Endometrial Carcinoma] |
| Top |
| Gene Expression for PPOX |
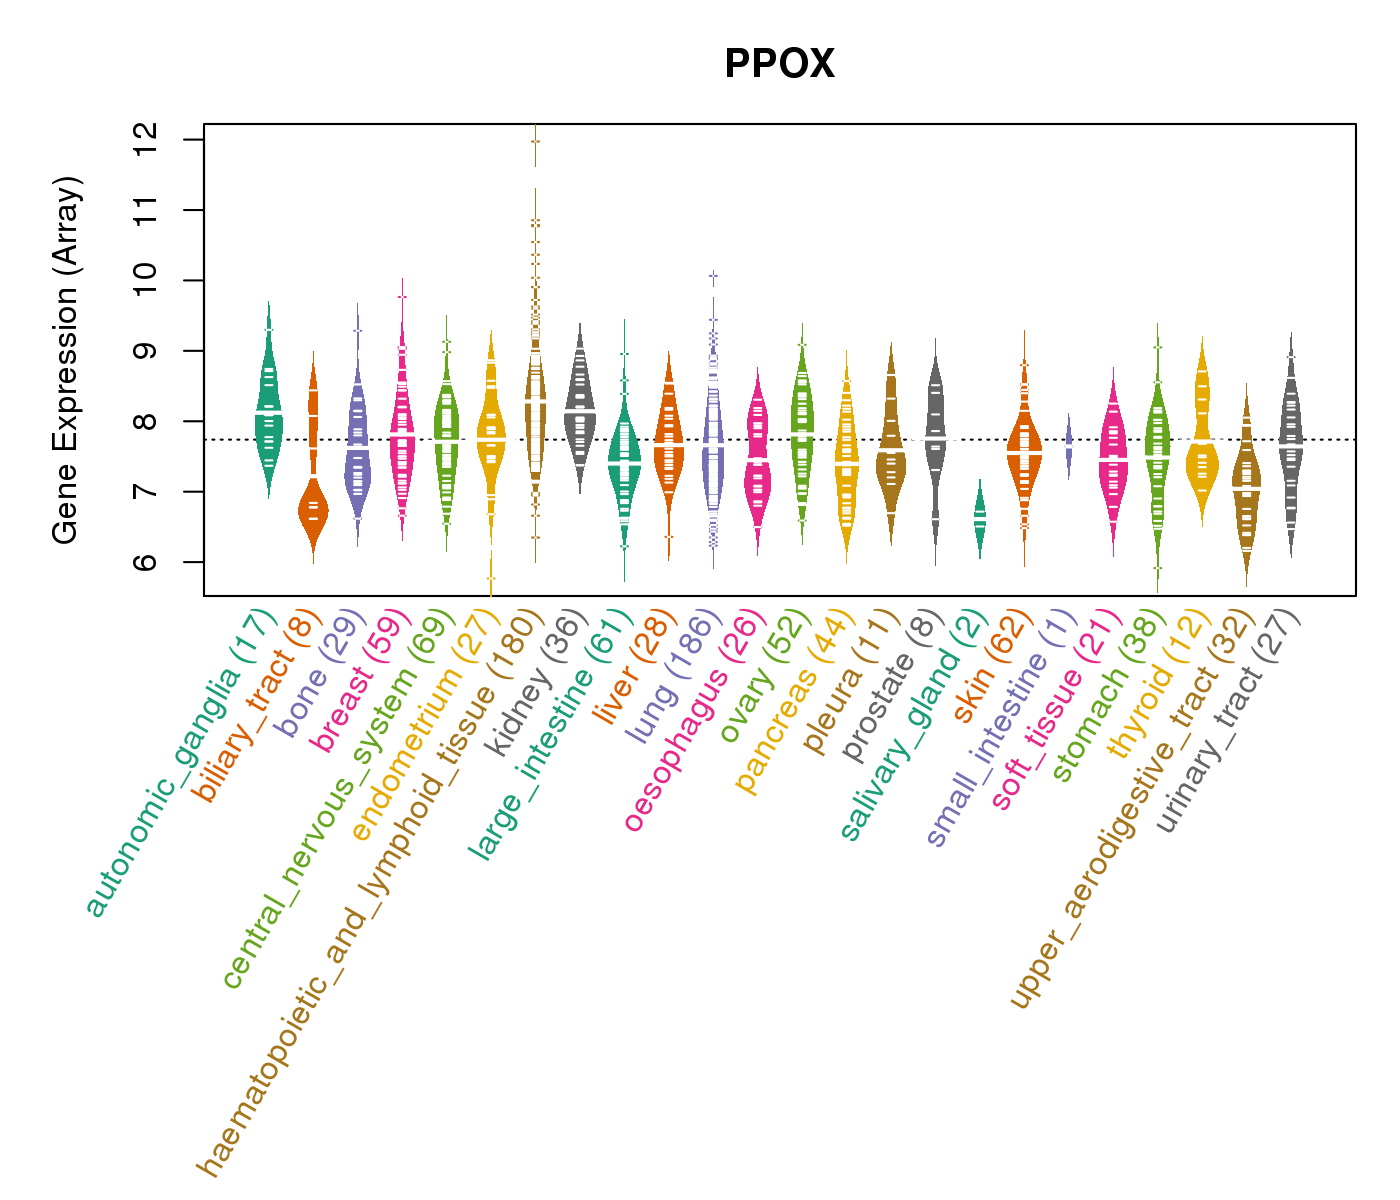
| * CCLE gene expression data were extracted from CCLE_Expression_Entrez_2012-10-18.res: Gene-centric RMA-normalized mRNA expression data. |
 |
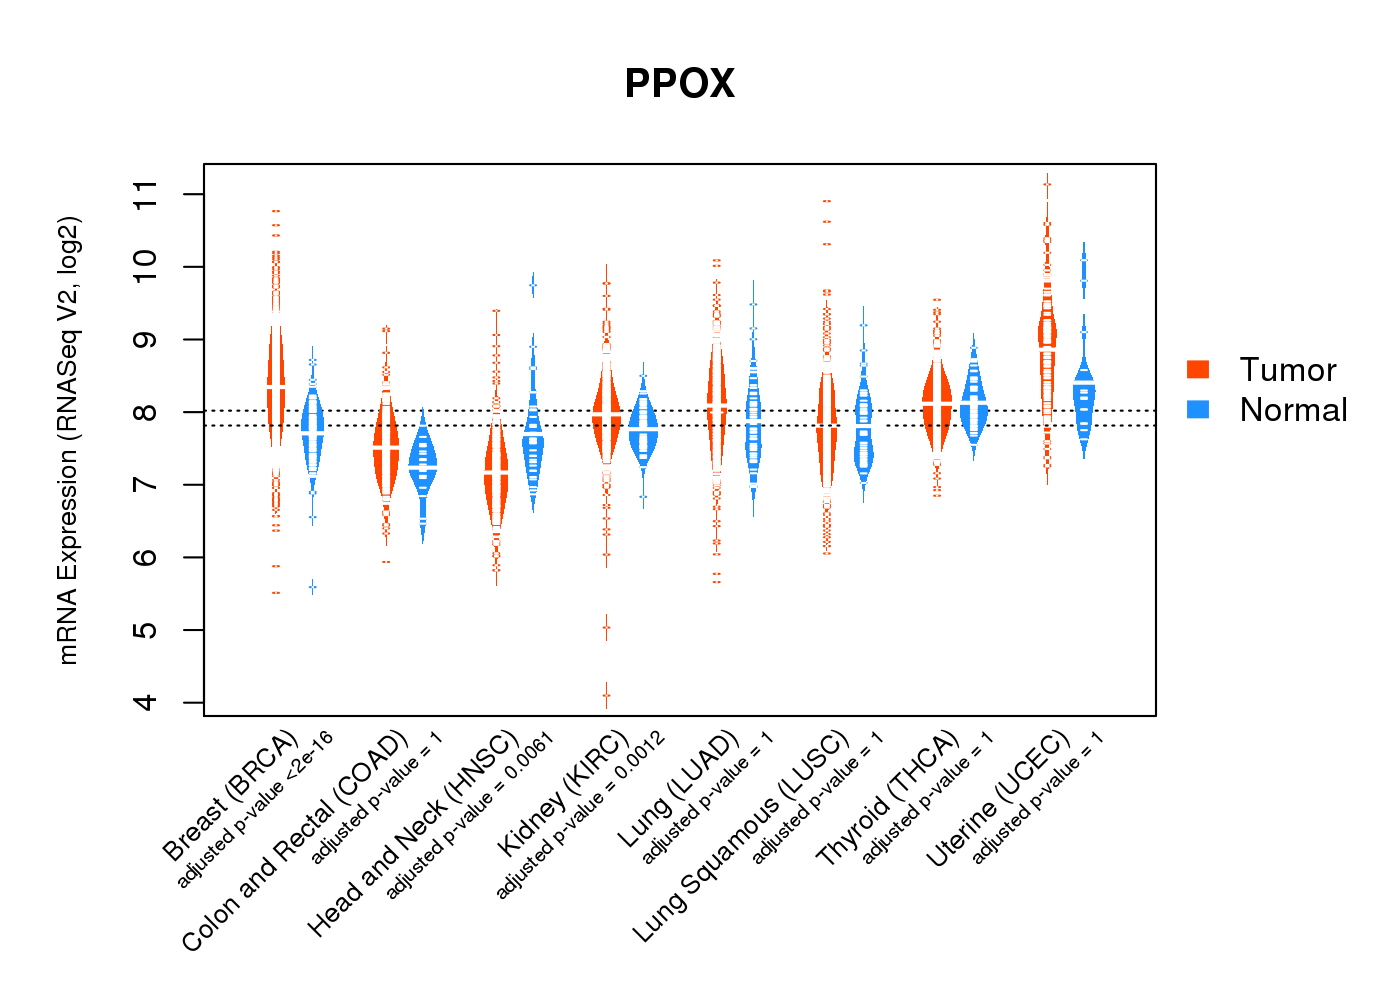
| * Normalized gene expression data of RNASeqV2 was extracted from TCGA using R package TCGA-Assembler. The URLs of all public data files on TCGA DCC data server were gathered at Jan-05-2015. Only eight cancer types have enough normal control samples for differential expression analysis. (t test, adjusted p<0.05 (using Benjamini-Hochberg FDR)) |
 |
| Top |
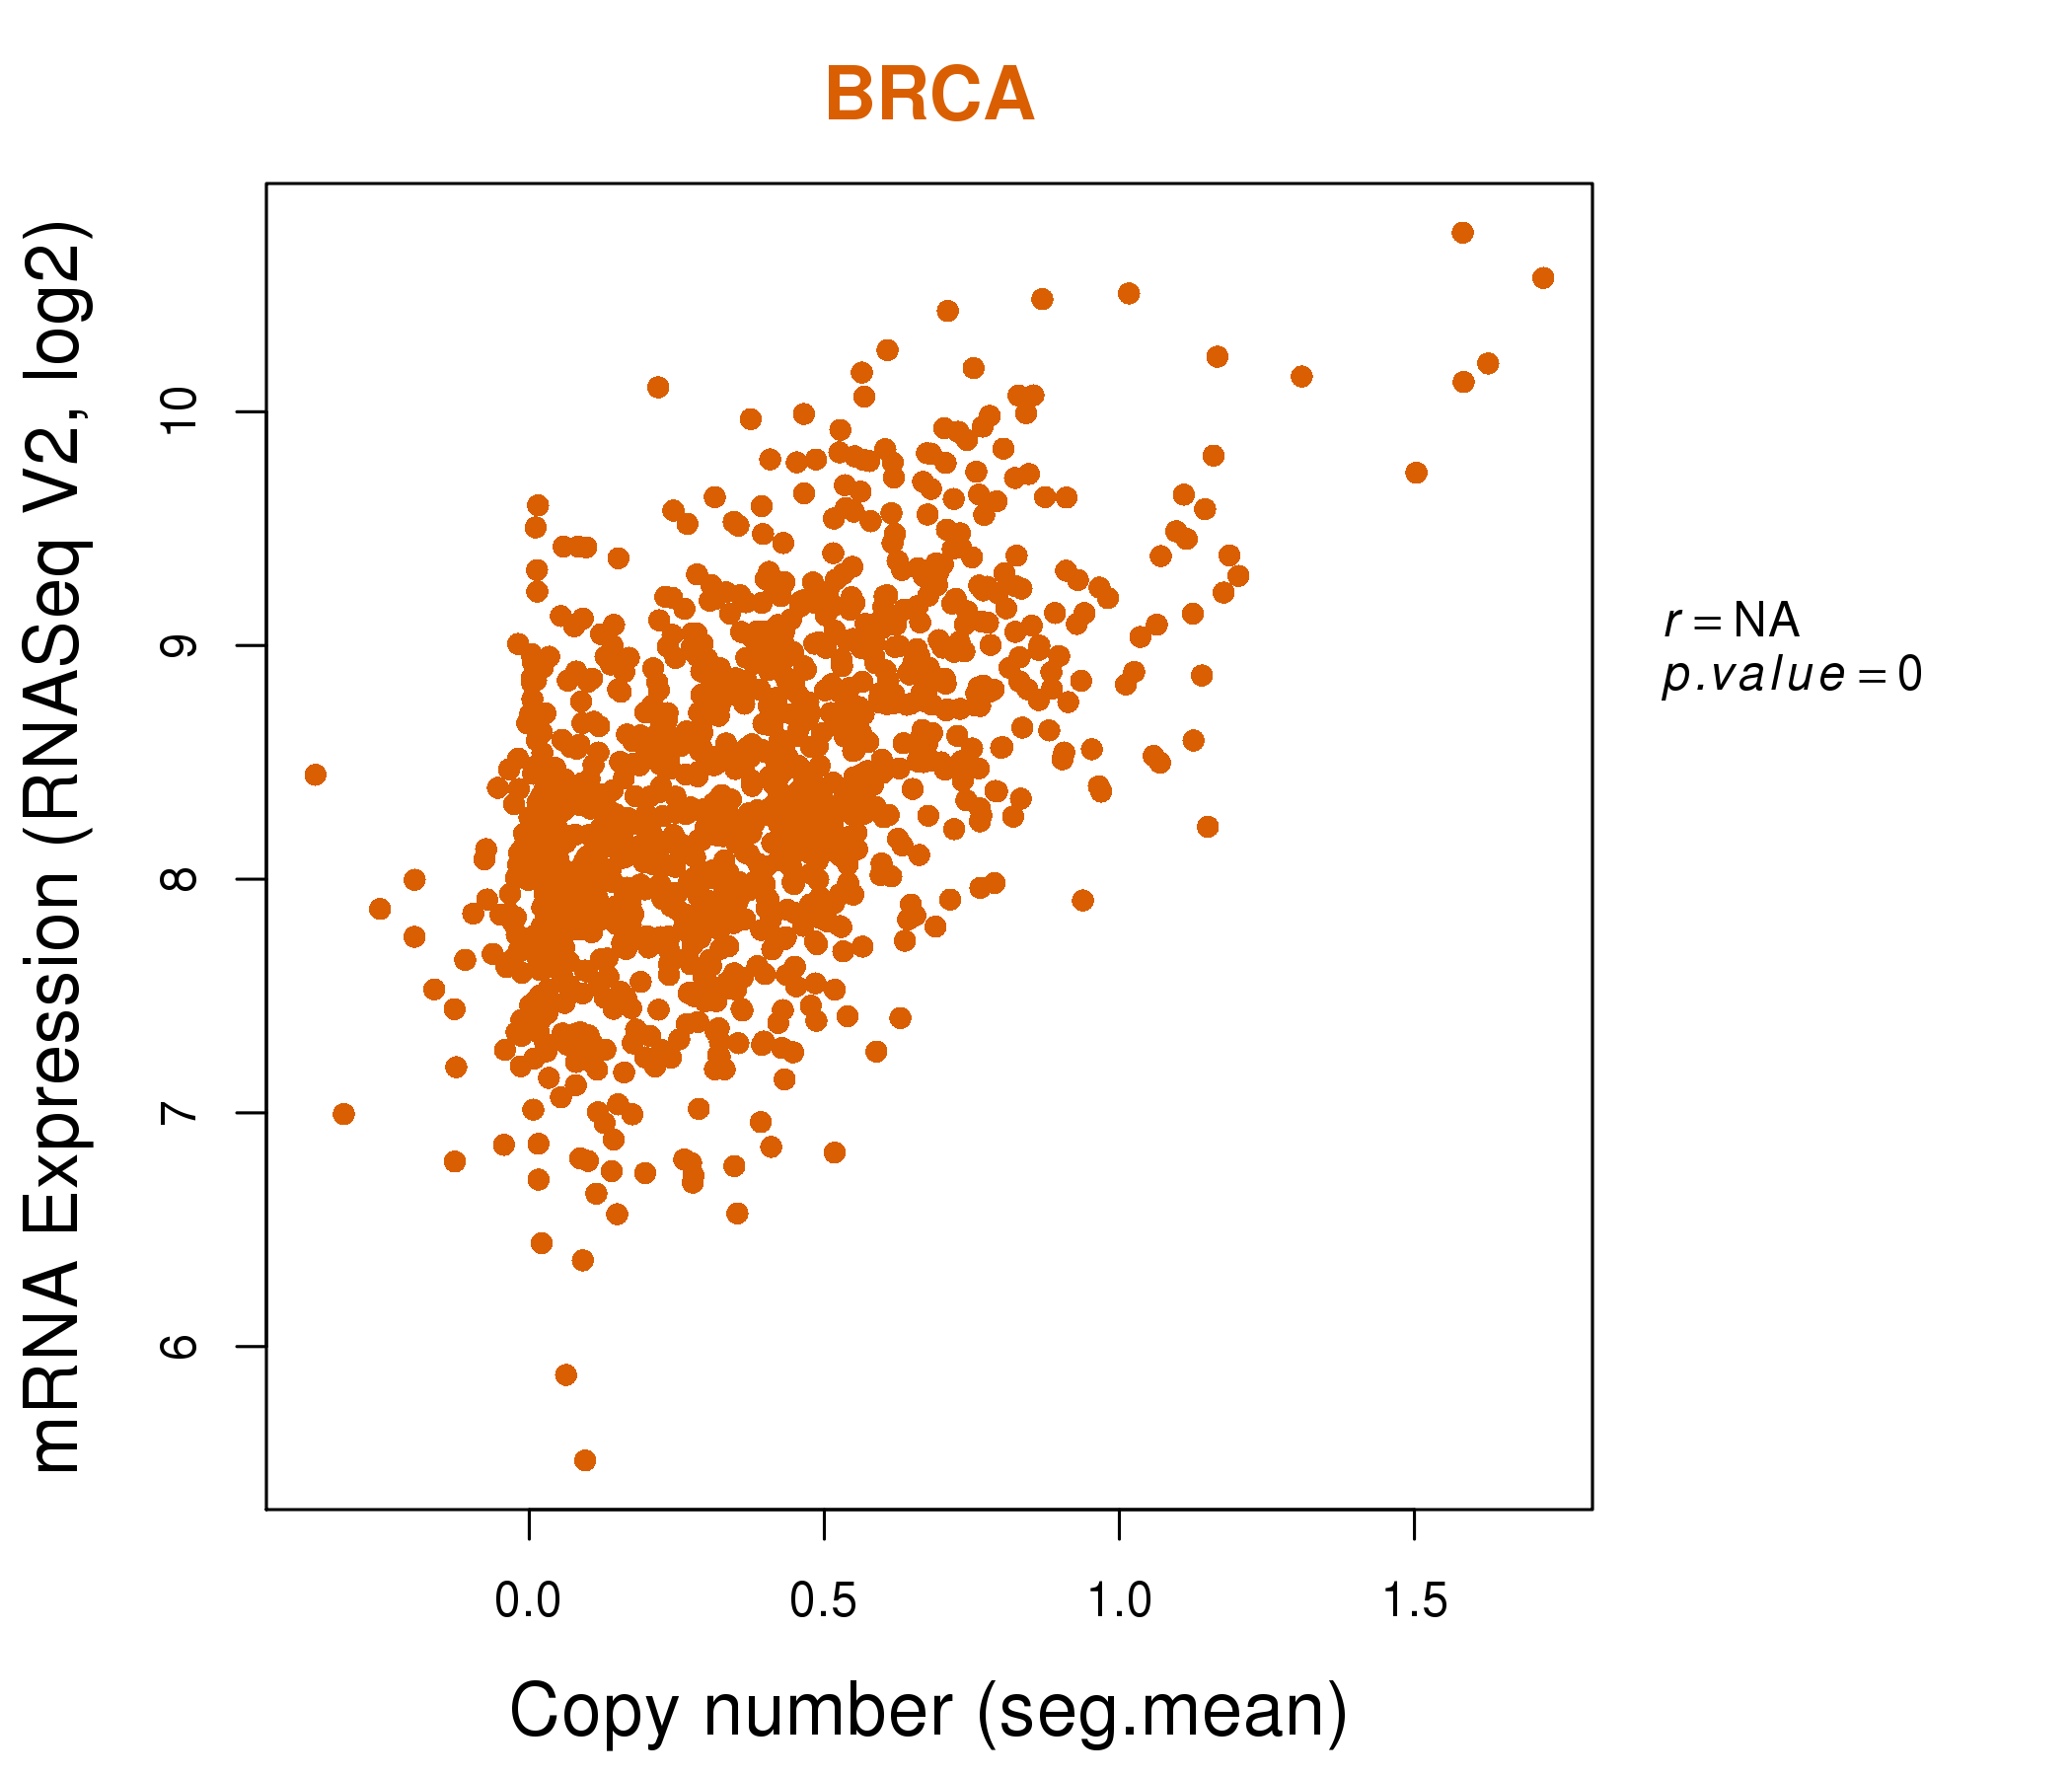
| * This plots show the correlation between CNV and gene expression. |
: Open all plots for all cancer types
 |
|
 |
|

| Top |
| Gene-Gene Network Information |
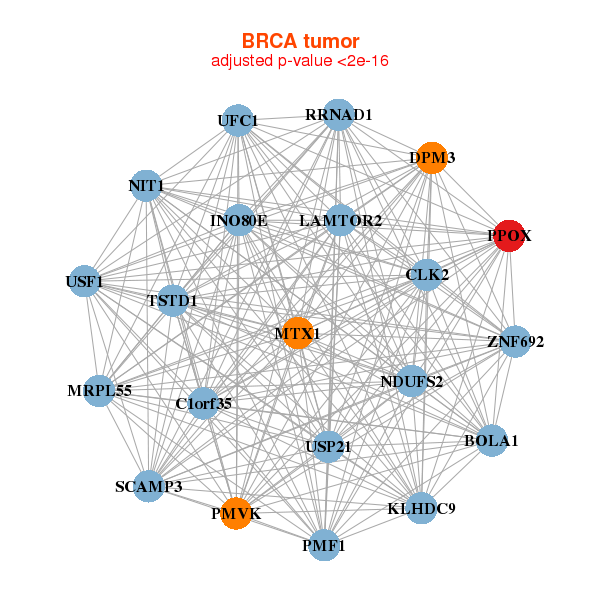
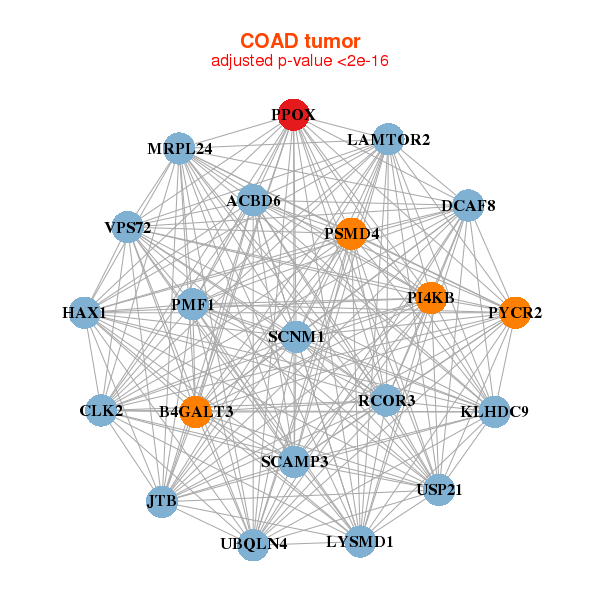
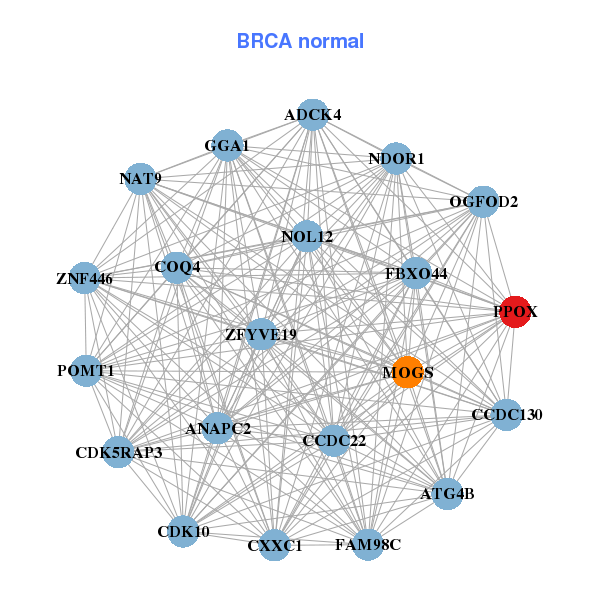
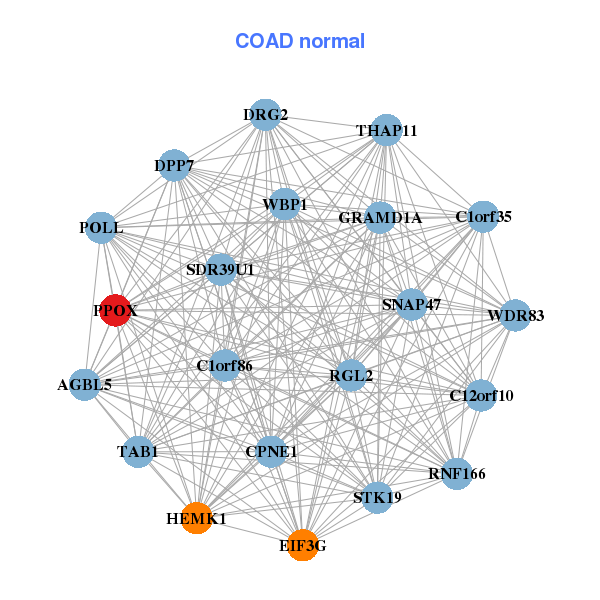
| * Co-Expression network figures were drawn using R package igraph. Only the top 20 genes with the highest correlations were shown. Red circle: input gene, orange circle: cell metabolism gene, sky circle: other gene |
: Open all plots for all cancer types
 |
| ||||
| BOLA1,C1orf35,RRNAD1,CLK2,DPM3,INO80E,KLHDC9, MRPL55,MTX1,NDUFS2,NIT1,PMF1,PMVK,PPOX, LAMTOR2,SCAMP3,TSTD1,UFC1,USF1,USP21,ZNF692 | ADCK4,ANAPC2,ATG4B,CCDC130,CCDC22,CDK10,CDK5RAP3, COQ4,CXXC1,FAM98C,FBXO44,GGA1,MOGS,NAT9, NDOR1,NOL12,OGFOD2,POMT1,PPOX,ZFYVE19,ZNF446 | ||||
 |
| ||||
| ACBD6,B4GALT3,CLK2,DCAF8,HAX1,JTB,KLHDC9, LYSMD1,MRPL24,PI4KB,PMF1,PPOX,PSMD4,PYCR2, RCOR3,LAMTOR2,SCAMP3,SCNM1,UBQLN4,USP21,VPS72 | AGBL5,C12orf10,C1orf35,C1orf86,CPNE1,DPP7,DRG2, EIF3G,GRAMD1A,HEMK1,POLL,PPOX,RGL2,RNF166, SDR39U1,SNAP47,STK19,TAB1,THAP11,WBP1,WDR83 |
| * Co-Expression network figures were drawn using R package igraph. Only the top 20 genes with the highest correlations were shown. Red circle: input gene, orange circle: cell metabolism gene, sky circle: other gene |
: Open all plots for all cancer types
| Top |
: Open all interacting genes' information including KEGG pathway for all interacting genes from DAVID
| Top |
| Pharmacological Information for PPOX |
| DB Category | DB Name | DB's ID and Url link |
| * Gene Centered Interaction Network. |
 |
| * Drug Centered Interaction Network. |
| DrugBank ID | Target Name | Drug Groups | Generic Name | Drug Centered Network | Drug Structure |
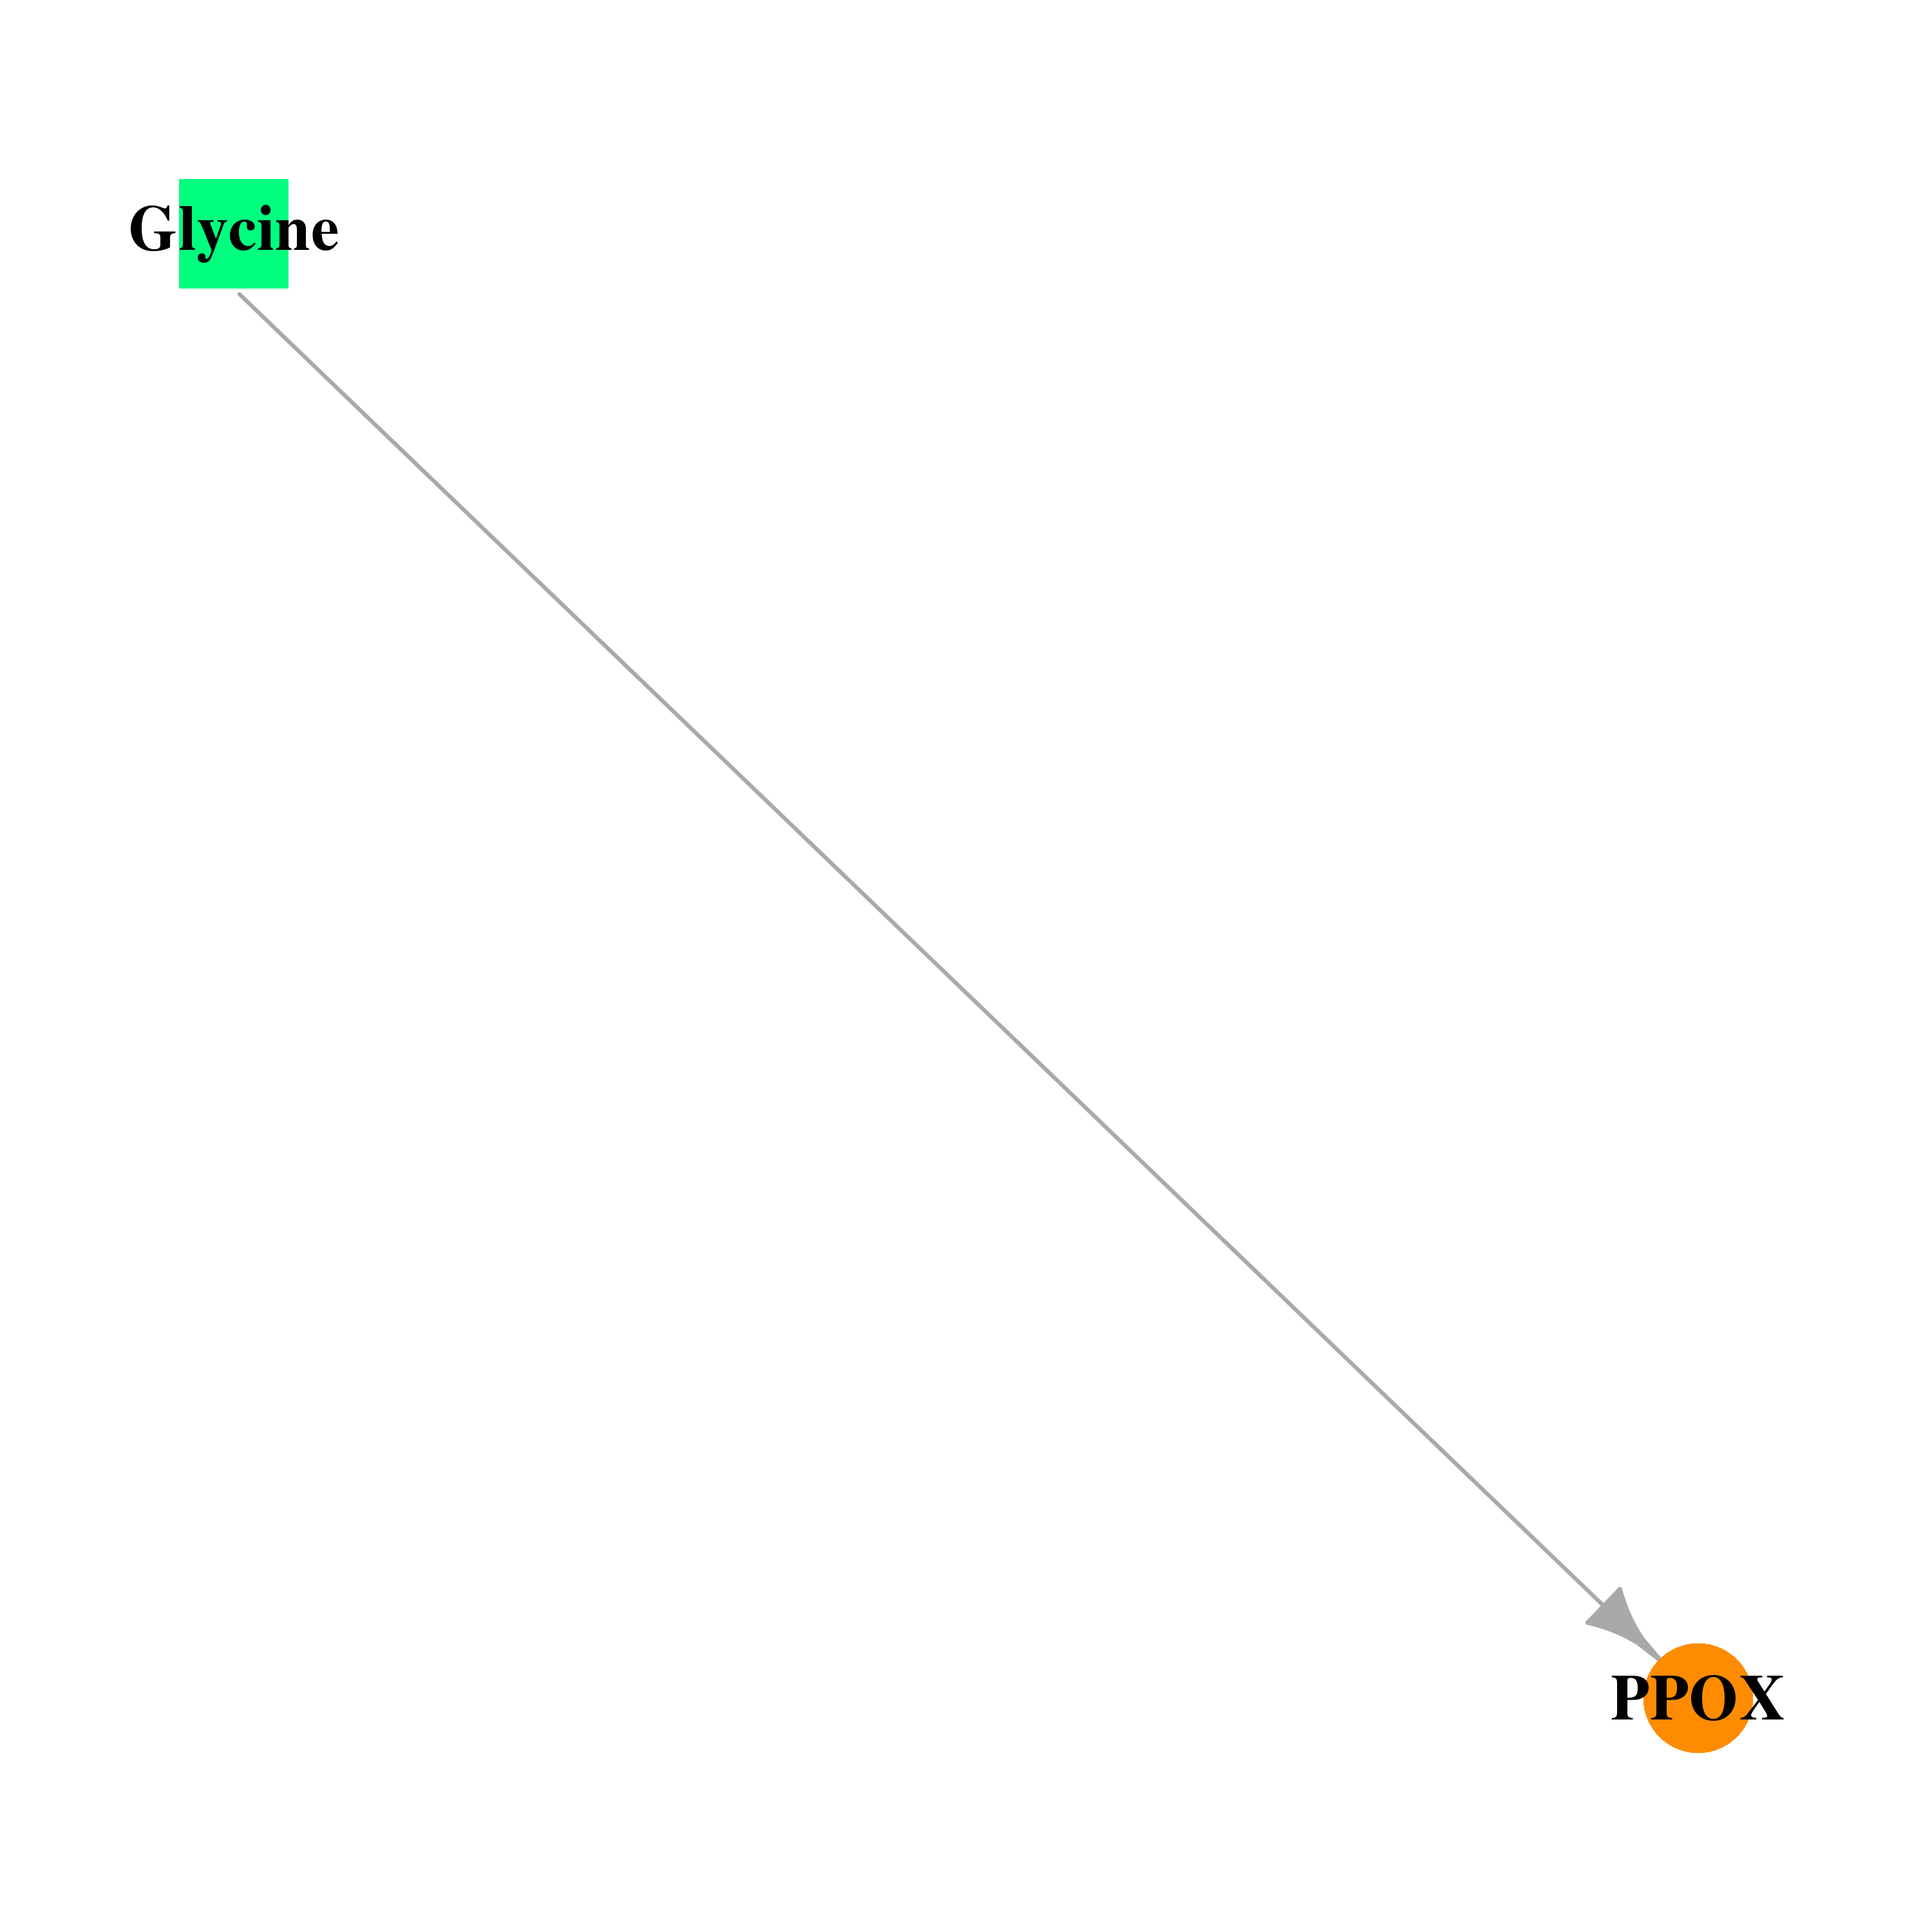
| DB00145 | protoporphyrinogen oxidase | approved; nutraceutical | Glycine |  |  |
| Top |
| Cross referenced IDs for PPOX |
| * We obtained these cross-references from Uniprot database. It covers 150 different DBs, 18 categories. http://www.uniprot.org/help/cross_references_section |
: Open all cross reference information
|
Copyright © 2016-Present - The Univsersity of Texas Health Science Center at Houston @ |