|
|||||||||||||||||||||||||||||||||||||||||||||||||||||||||||||||||||||||||||||||||||||||||||||||||||||||||||||||||||||||||||||||||||||||||||||||||||||||||||||||||||||||||||||||||||||||||||||||||||||||||||||||||||||||||||||||||||||||||||||||||||||||||||||||||||||||||||||||||||||||||||||||||||||||||||||||||||||||||||||||||||||||||||||||||||||||||
| |
| Phenotypic Information (metabolism pathway, cancer, disease, phenome) |
| |
| |
| Gene-Gene Network Information: Co-Expression Network, Interacting Genes & KEGG |
| |
|


| Gene Summary for PPP2R1A |
| Basic gene info. | Gene symbol | PPP2R1A |
| Gene name | protein phosphatase 2, regulatory subunit A, alpha | |
| Synonyms | PP2A-Aalpha|PP2AAALPHA|PR65A | |
| Cytomap | UCSC genome browser: 19q13.41 | |
| Genomic location | chr19 :52693054-52729678 | |
| Type of gene | protein-coding | |
| RefGenes | NM_014225.5, NR_033500.1, | |
| Ensembl id | ENSG00000105568 | |
| Description | PP2A subunit A isoform PR65-alphaPP2A subunit A isoform R1-alphamedium tumor antigen-associated 61 KDA proteinprotein phosphatase 2 (formerly 2A), regulatory subunit A (PR 65), alpha isoformserine/threonine protein phosphatase 2A, 65 kDa regulatory su | |
| Modification date | 20141207 | |
| dbXrefs | MIM : 605983 | |
| HGNC : HGNC | ||
| HPRD : 16184 | ||
| Protein | UniProt: P30153 go to UniProt's Cross Reference DB Table | |
| Expression | CleanEX: HS_PPP2R1A | |
| BioGPS: 5518 | ||
| Gene Expression Atlas: ENSG00000105568 | ||
| The Human Protein Atlas: ENSG00000105568 | ||
| Pathway | NCI Pathway Interaction Database: PPP2R1A | |
| KEGG: PPP2R1A | ||
| REACTOME: PPP2R1A | ||
| ConsensusPathDB | ||
| Pathway Commons: PPP2R1A | ||
| Metabolism | MetaCyc: PPP2R1A | |
| HUMANCyc: PPP2R1A | ||
| Regulation | Ensembl's Regulation: ENSG00000105568 | |
| miRBase: chr19 :52,693,054-52,729,678 | ||
| TargetScan: NM_014225 | ||
| cisRED: ENSG00000105568 | ||
| Context | iHOP: PPP2R1A | |
| cancer metabolism search in PubMed: PPP2R1A | ||
| UCL Cancer Institute: PPP2R1A | ||
| Assigned class in ccmGDB | A - This gene has a literature evidence and it belongs to cancer gene. | |
| References showing role of PPP2R1A in cancer cell metabolism | 1. Morvan D, Steyaert JM, Schwartz L, Israel M, Demidem A (2012) Normal human melanocytes exposed to chronic insulin and glucose supplementation undergo oncogenic changes and methyl group metabolism cellular redistribution. American Journal of Physiology-Endocrinology and Metabolism 302: E1407-E1418. go to article | |
| Top |
| Phenotypic Information for PPP2R1A(metabolism pathway, cancer, disease, phenome) |
| Cancer | CGAP: PPP2R1A |
| Familial Cancer Database: PPP2R1A | |
| * This gene is included in those cancer gene databases. |
|
|
|
|
|
|
| |||||||||||||||||||||||||||||||||||||||||||||||||||||||||||||||||||||||||||||||||||||||||||||||||||||||||||||||||||||||||||||||||||||||||||||||||||||||||||||||||||||||||||||||||||||||||||||||||||||||||||||||||||||||||||||||||||||||||||||||||||||||||||||||||||||||||||||||||||||||||||||||||||||||||||||||||||||||||||||||||||||||||||||||||||
Oncogene 1 | Significant driver gene in UCEC 6, | ||||||||||||||||||||||||||||||||||||||||||||||||||||||||||||||||||||||||||||||||||||||||||||||||||||||||||||||||||||||||||||||||||||||||||||||||||||||||||||||||||||||||||||||||||||||||||||||||||||||||||||||||||||||||||||||||||||||||||||||||||||||||||||||||||||||||||||||||||||||||||||||||||||||||||||||||||||||||||||||||||||||||||||||||||||||||
| cf) number; DB name 1 Oncogene; http://nar.oxfordjournals.org/content/35/suppl_1/D721.long, 2 Tumor Suppressor gene; https://bioinfo.uth.edu/TSGene/, 3 Cancer Gene Census; http://www.nature.com/nrc/journal/v4/n3/abs/nrc1299.html, 4 CancerGenes; http://nar.oxfordjournals.org/content/35/suppl_1/D721.long, 5 Network of Cancer Gene; http://ncg.kcl.ac.uk/index.php, 6 http://www.nature.com/nature/journal/v497/n7447/full/nature12113.html, 7Therapeutic Vulnerabilities in Cancer; http://cbio.mskcc.org/cancergenomics/statius/ |
| REACTOME_INTEGRATION_OF_ENERGY_METABOLISM REACTOME_METABOLISM_OF_MRNA REACTOME_METABOLISM_OF_RNA REACTOME_METABOLISM_OF_CARBOHYDRATES REACTOME_GLUCOSE_METABOLISM | |
| OMIM | 605983; gene. |
| Orphanet | |
| Disease | KEGG Disease: PPP2R1A |
| MedGen: PPP2R1A (Human Medical Genetics with Condition) | |
| ClinVar: PPP2R1A | |
| Phenotype | MGI: PPP2R1A (International Mouse Phenotyping Consortium) |
| PhenomicDB: PPP2R1A | |
| Mutations for PPP2R1A |
| * Under tables are showing count per each tissue to give us broad intuition about tissue specific mutation patterns.You can go to the detailed page for each mutation database's web site. |
| - Statistics for Tissue and Mutation type | Top |
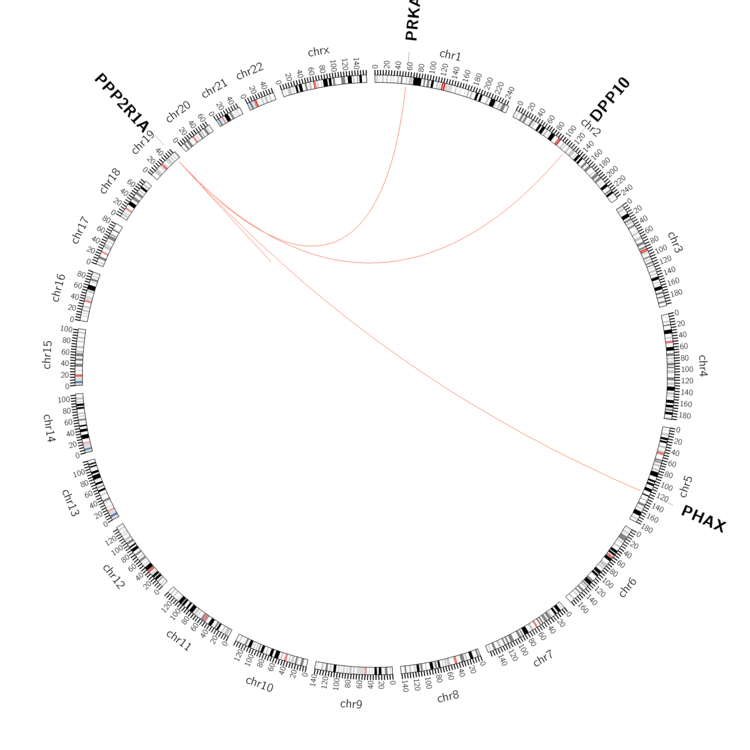 |
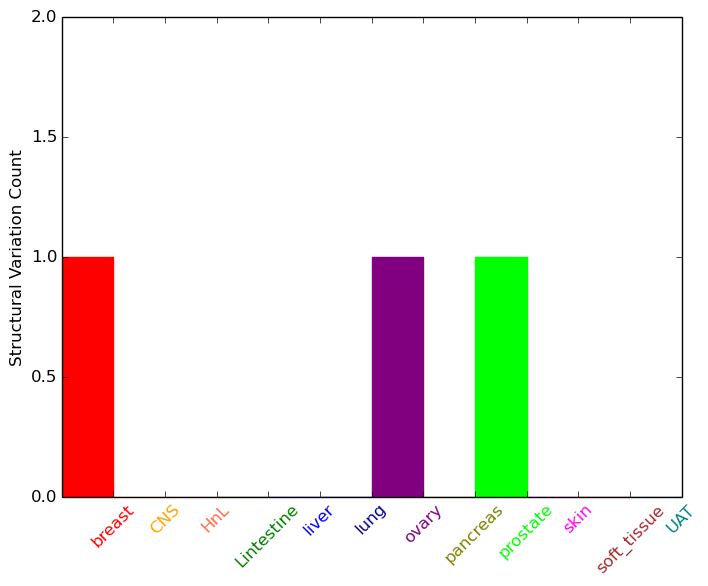
| - For Inter-chromosomal Variations |
| * Inter-chromosomal variantions includes 'interchromosomal amplicon to amplicon', 'interchromosomal amplicon to non-amplified dna', 'interchromosomal insertion', 'Interchromosomal unknown type'. |
 |
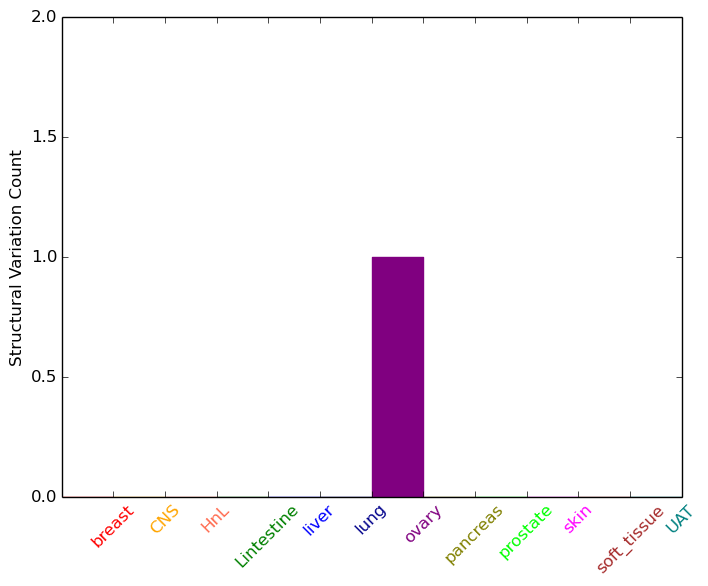
| - For Intra-chromosomal Variations |
| * Intra-chromosomal variantions includes 'intrachromosomal amplicon to amplicon', 'intrachromosomal amplicon to non-amplified dna', 'intrachromosomal deletion', 'intrachromosomal fold-back inversion', 'intrachromosomal inversion', 'intrachromosomal tandem duplication', 'Intrachromosomal unknown type', 'intrachromosomal with inverted orientation', 'intrachromosomal with non-inverted orientation'. |
 |
| Sample | Symbol_a | Chr_a | Start_a | End_a | Symbol_b | Chr_b | Start_b | End_b |
| ovary | PPP2R1A | chr19 | 52700117 | 52700137 | PPP2R1A | chr19 | 52713471 | 52713491 |
| cf) Tissue number; Tissue name (1;Breast, 2;Central_nervous_system, 3;Haematopoietic_and_lymphoid_tissue, 4;Large_intestine, 5;Liver, 6;Lung, 7;Ovary, 8;Pancreas, 9;Prostate, 10;Skin, 11;Soft_tissue, 12;Upper_aerodigestive_tract) |
| * From mRNA Sanger sequences, Chitars2.0 arranged chimeric transcripts. This table shows PPP2R1A related fusion information. |
| ID | Head Gene | Tail Gene | Accession | Gene_a | qStart_a | qEnd_a | Chromosome_a | tStart_a | tEnd_a | Gene_a | qStart_a | qEnd_a | Chromosome_a | tStart_a | tEnd_a |
| AW473090 | PPP2R1A | 9 | 166 | 19 | 52716252 | 52719077 | PPP2R1A | 163 | 615 | 19 | 52719071 | 52723114 | |
| CN418097 | PPP2R1A | 10 | 89 | 19 | 52724244 | 52724323 | PPP2R1A | 86 | 610 | 19 | 52716038 | 52719916 | |
| AI419727 | WNT5B | 3 | 251 | 12 | 1756150 | 1756398 | PPP2R1A | 248 | 404 | 19 | 52719277 | 52719887 | |
| W48816 | RPL32 | 1 | 98 | 3 | 12877548 | 12877645 | PPP2R1A | 94 | 407 | 19 | 52716331 | 52719874 | |
| AL709013 | ADAM12 | 5 | 290 | 10 | 127829031 | 127829315 | PPP2R1A | 273 | 384 | 19 | 52729560 | 52729671 | |
| Top |
| Mutation type/ Tissue ID | brca | cns | cerv | endome | haematopo | kidn | Lintest | liver | lung | ns | ovary | pancre | prost | skin | stoma | thyro | urina | |||
| Total # sample | 1 | 1 | 1 | |||||||||||||||||
| GAIN (# sample) | 1 | 1 | 1 | |||||||||||||||||
| LOSS (# sample) |
| cf) Tissue ID; Tissue type (1; Breast, 2; Central_nervous_system, 3; Cervix, 4; Endometrium, 5; Haematopoietic_and_lymphoid_tissue, 6; Kidney, 7; Large_intestine, 8; Liver, 9; Lung, 10; NS, 11; Ovary, 12; Pancreas, 13; Prostate, 14; Skin, 15; Stomach, 16; Thyroid, 17; Urinary_tract) |
| Top |
|
 |
| Top |
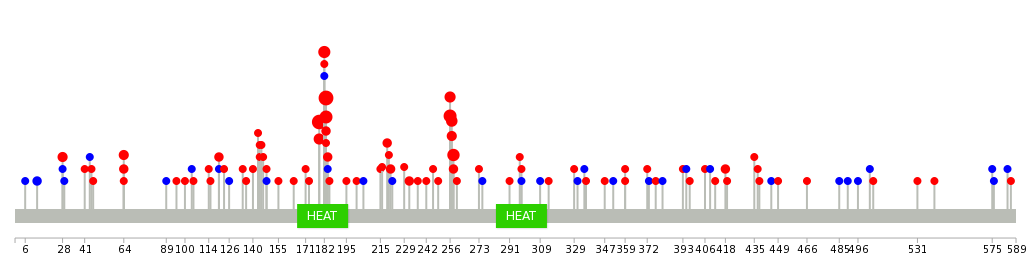
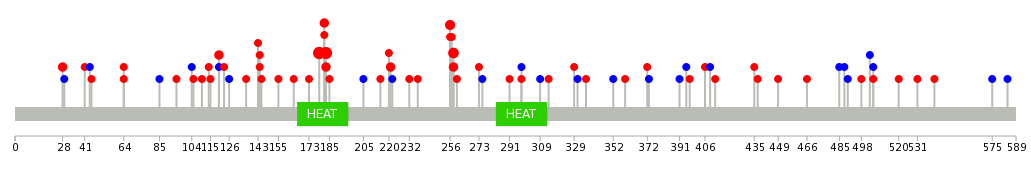
| Stat. for Non-Synonymous SNVs (# total SNVs=176) | (# total SNVs=23) |
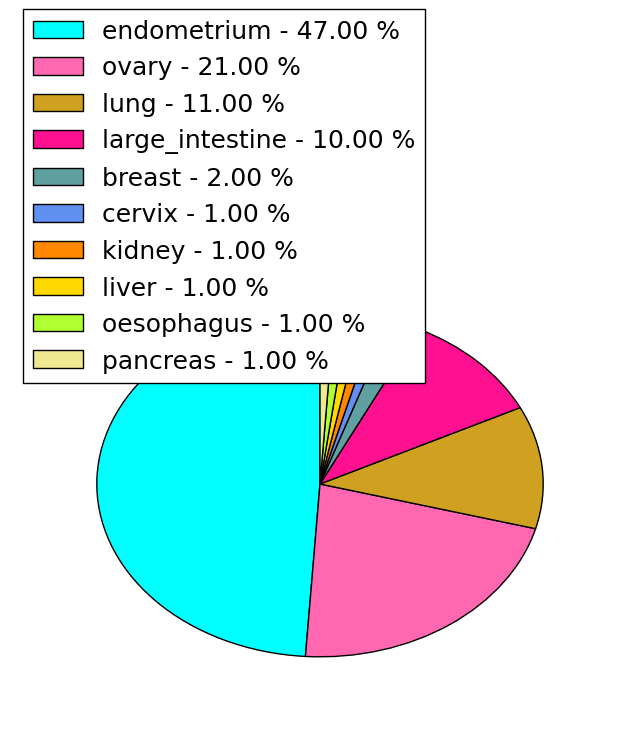 | 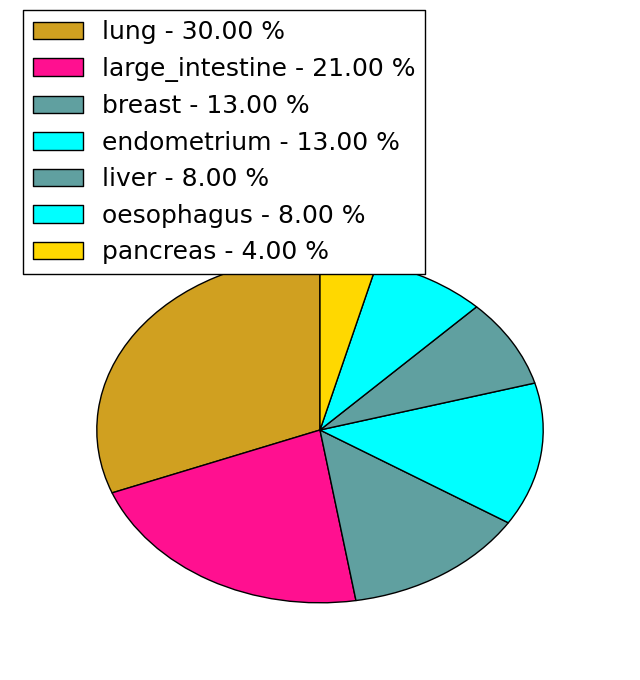 |
(# total SNVs=3) | (# total SNVs=1) |
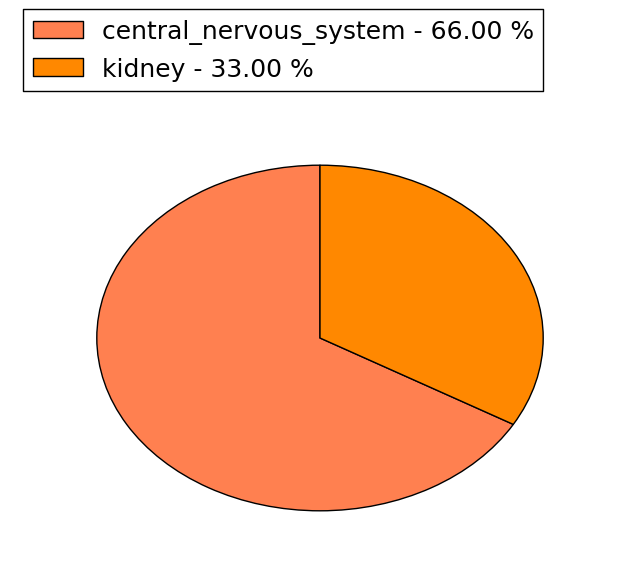 | 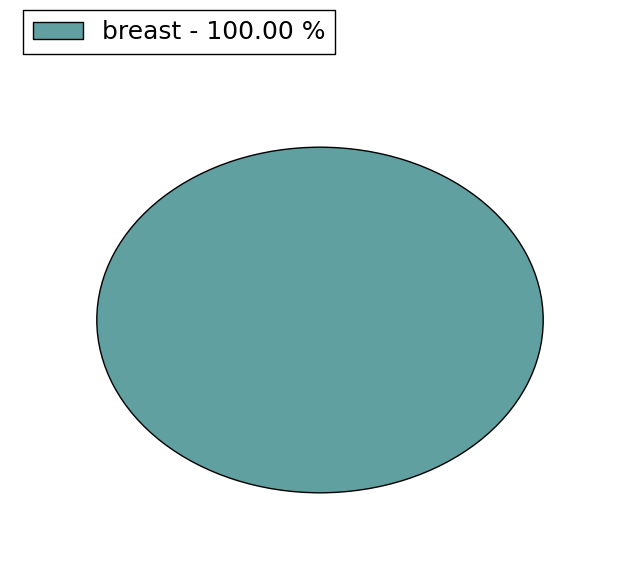 |
| Top |
| * When you move the cursor on each content, you can see more deailed mutation information on the Tooltip. Those are primary_site,primary_histology,mutation(aa),pubmedID. |
| GRCh37 position | Mutation(aa) | Unique sampleID count |
| chr19:52715971-52715971 | p.P179R | 31 |
| chr19:52715982-52715982 | p.R183W | 31 |
| chr19:52716323-52716323 | p.S256Y | 17 |
| chr19:52715983-52715983 | p.R183Q | 13 |
| chr19:52716329-52716329 | p.R258H | 9 |
| chr19:52715979-52715979 | p.R182W | 8 |
| chr19:52716327-52716327 | p.W257C | 6 |
| chr19:52709237-52709237 | p.E64G | 3 |
| chr19:52716325-52716325 | p.W257G | 3 |
| chr19:52709238-52709238 | p.E64D | 3 |
| Top |
|
 |
| Point Mutation/ Tissue ID | 1 | 2 | 3 | 4 | 5 | 6 | 7 | 8 | 9 | 10 | 11 | 12 | 13 | 14 | 15 | 16 | 17 | 18 | 19 | 20 |
| # sample | 3 | 3 | 2 | 18 | 5 | 1 | 6 | 10 | 4 | 4 | 11 | 2 | 28 | |||||||
| # mutation | 3 | 3 | 2 | 13 | 5 | 1 | 6 | 10 | 4 | 5 | 12 | 2 | 20 | |||||||
| nonsynonymous SNV | 1 | 1 | 2 | 9 | 2 | 1 | 5 | 7 | 4 | 2 | 10 | 2 | 17 | |||||||
| synonymous SNV | 2 | 2 | 4 | 3 | 1 | 3 | 3 | 2 | 3 |
| cf) Tissue ID; Tissue type (1; BLCA[Bladder Urothelial Carcinoma], 2; BRCA[Breast invasive carcinoma], 3; CESC[Cervical squamous cell carcinoma and endocervical adenocarcinoma], 4; COAD[Colon adenocarcinoma], 5; GBM[Glioblastoma multiforme], 6; Glioma Low Grade, 7; HNSC[Head and Neck squamous cell carcinoma], 8; KICH[Kidney Chromophobe], 9; KIRC[Kidney renal clear cell carcinoma], 10; KIRP[Kidney renal papillary cell carcinoma], 11; LAML[Acute Myeloid Leukemia], 12; LUAD[Lung adenocarcinoma], 13; LUSC[Lung squamous cell carcinoma], 14; OV[Ovarian serous cystadenocarcinoma ], 15; PAAD[Pancreatic adenocarcinoma], 16; PRAD[Prostate adenocarcinoma], 17; SKCM[Skin Cutaneous Melanoma], 18:STAD[Stomach adenocarcinoma], 19:THCA[Thyroid carcinoma], 20:UCEC[Uterine Corpus Endometrial Carcinoma]) |
| Top |
| * We represented just top 10 SNVs. When you move the cursor on each content, you can see more deailed mutation information on the Tooltip. Those are primary_site, primary_histology, mutation(aa), pubmedID. |
| Genomic Position | Mutation(aa) | Unique sampleID count |
| chr19:52715971 | p.P179R | 9 |
| chr19:52715982 | p.R183W | 8 |
| chr19:52716329 | p.R258H | 4 |
| chr19:52716323 | p.S256F | 4 |
| chr19:52715983 | p.R258C | 2 |
| chr19:52716328 | p.R182W | 2 |
| chr19:52705200 | p.S120L | 2 |
| chr19:52716217 | p.R183Q | 2 |
| chr19:52714601 | p.R28C | 2 |
| chr19:52715979 | p.R221W | 2 |
| * Copy number data were extracted from TCGA using R package TCGA-Assembler. The URLs of all public data files on TCGA DCC data server were gathered on Jan-05-2015. Function ProcessCNAData in TCGA-Assembler package was used to obtain gene-level copy number value which is calculated as the average copy number of the genomic region of a gene. |
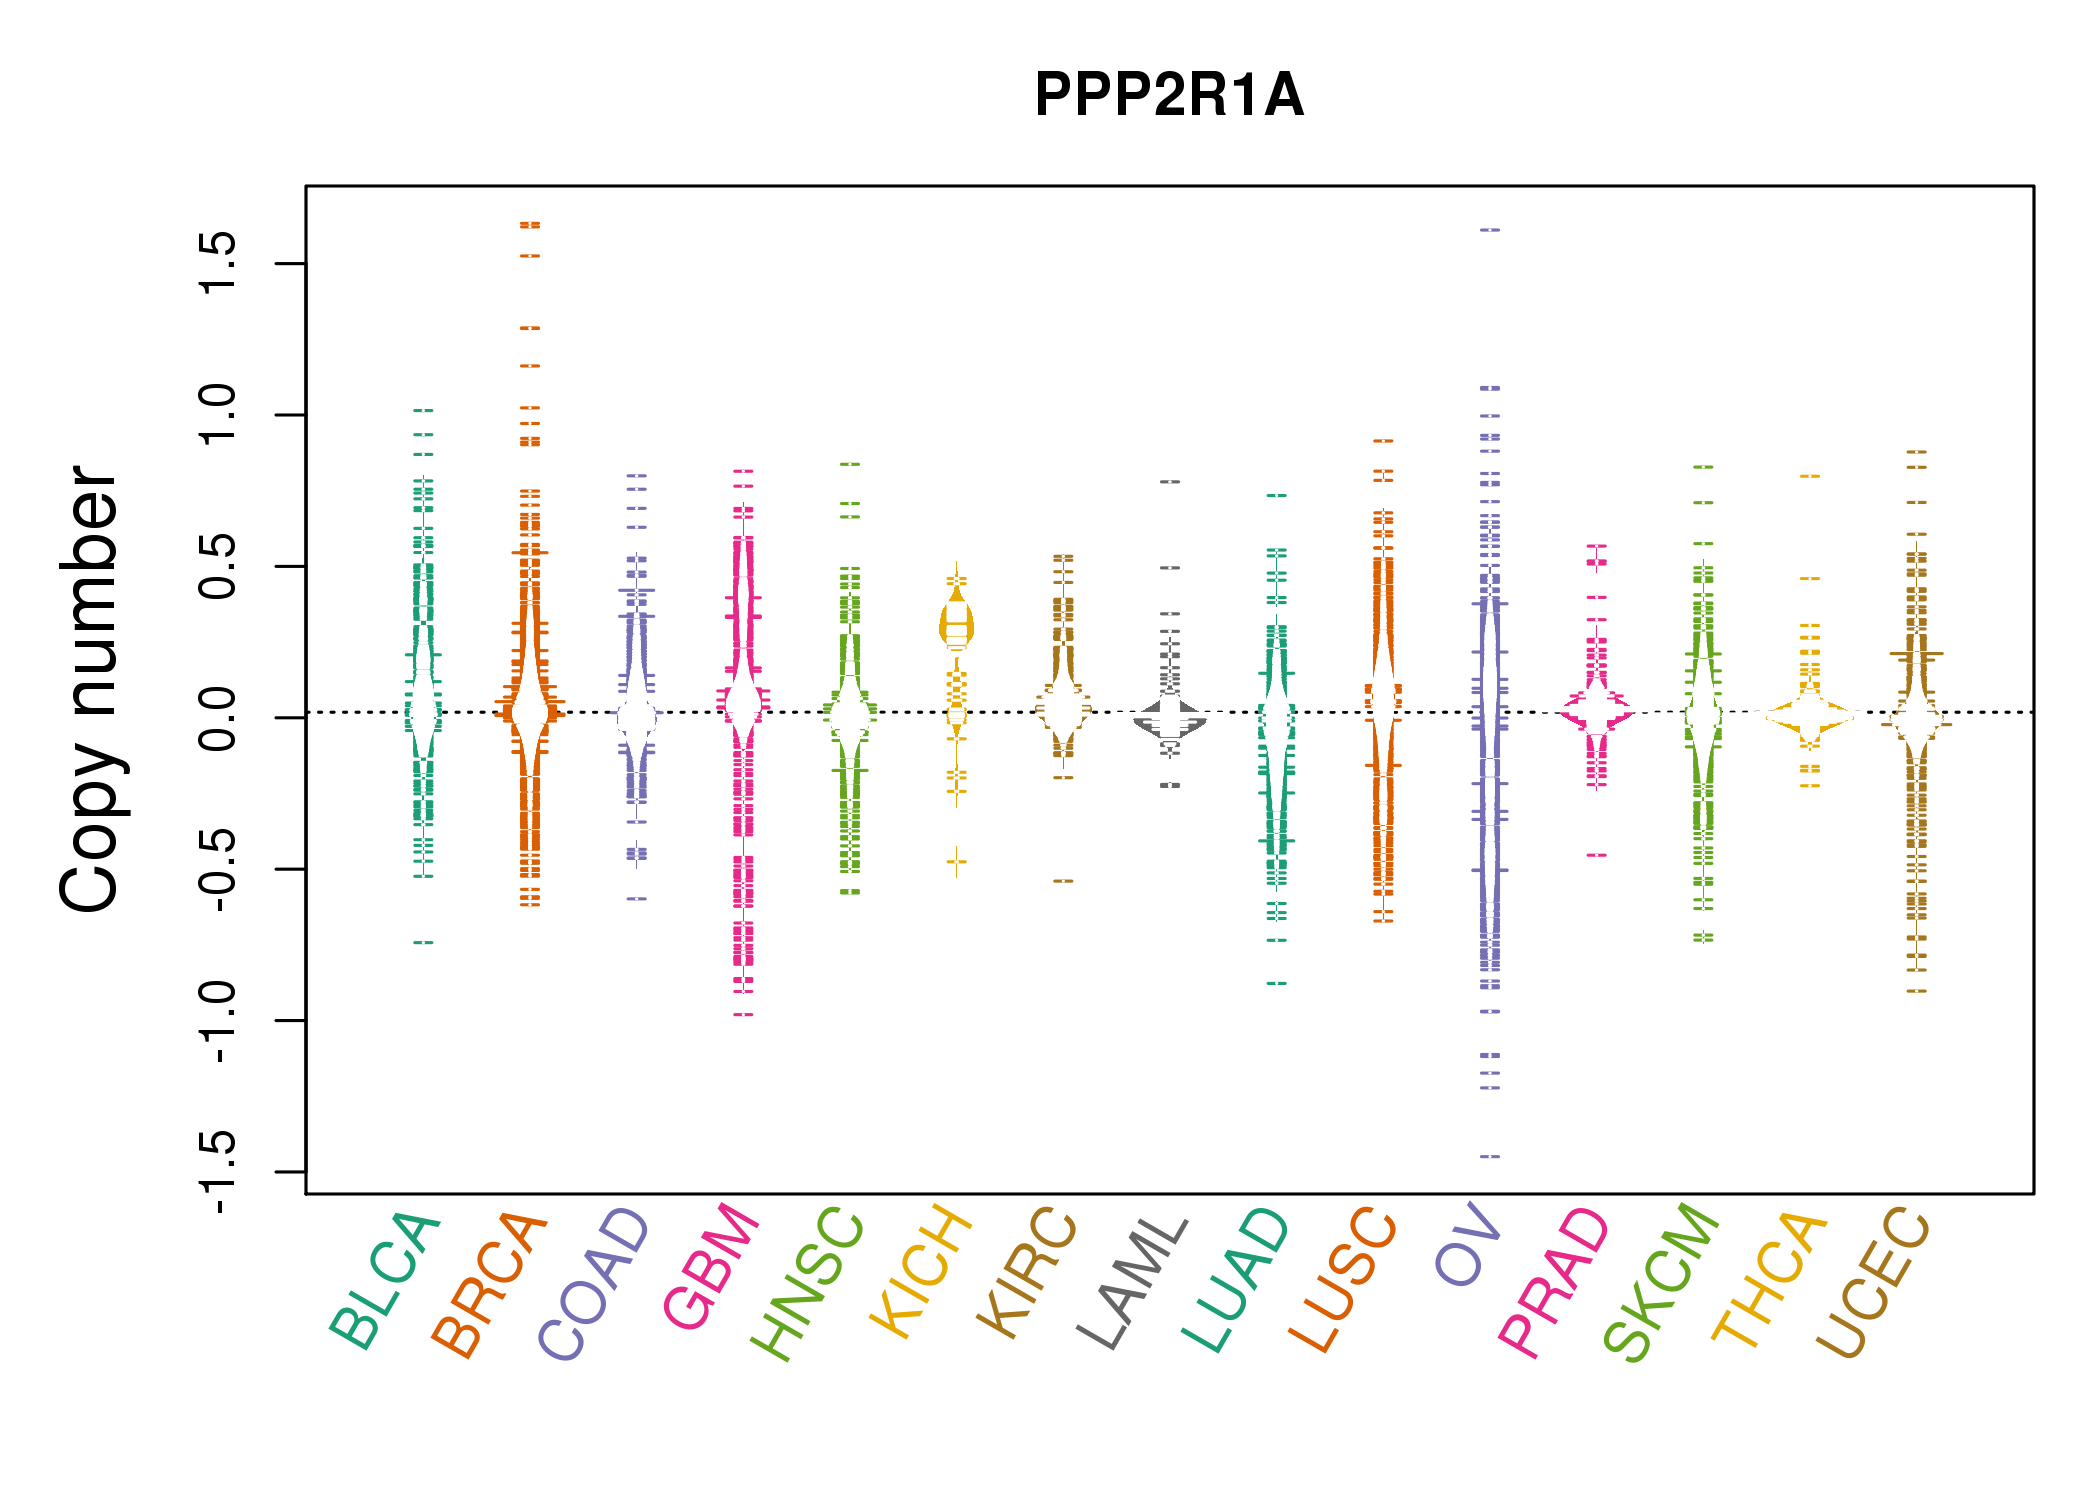 |
| cf) Tissue ID[Tissue type]: BLCA[Bladder Urothelial Carcinoma], BRCA[Breast invasive carcinoma], CESC[Cervical squamous cell carcinoma and endocervical adenocarcinoma], COAD[Colon adenocarcinoma], GBM[Glioblastoma multiforme], Glioma Low Grade, HNSC[Head and Neck squamous cell carcinoma], KICH[Kidney Chromophobe], KIRC[Kidney renal clear cell carcinoma], KIRP[Kidney renal papillary cell carcinoma], LAML[Acute Myeloid Leukemia], LUAD[Lung adenocarcinoma], LUSC[Lung squamous cell carcinoma], OV[Ovarian serous cystadenocarcinoma ], PAAD[Pancreatic adenocarcinoma], PRAD[Prostate adenocarcinoma], SKCM[Skin Cutaneous Melanoma], STAD[Stomach adenocarcinoma], THCA[Thyroid carcinoma], UCEC[Uterine Corpus Endometrial Carcinoma] |
| Top |
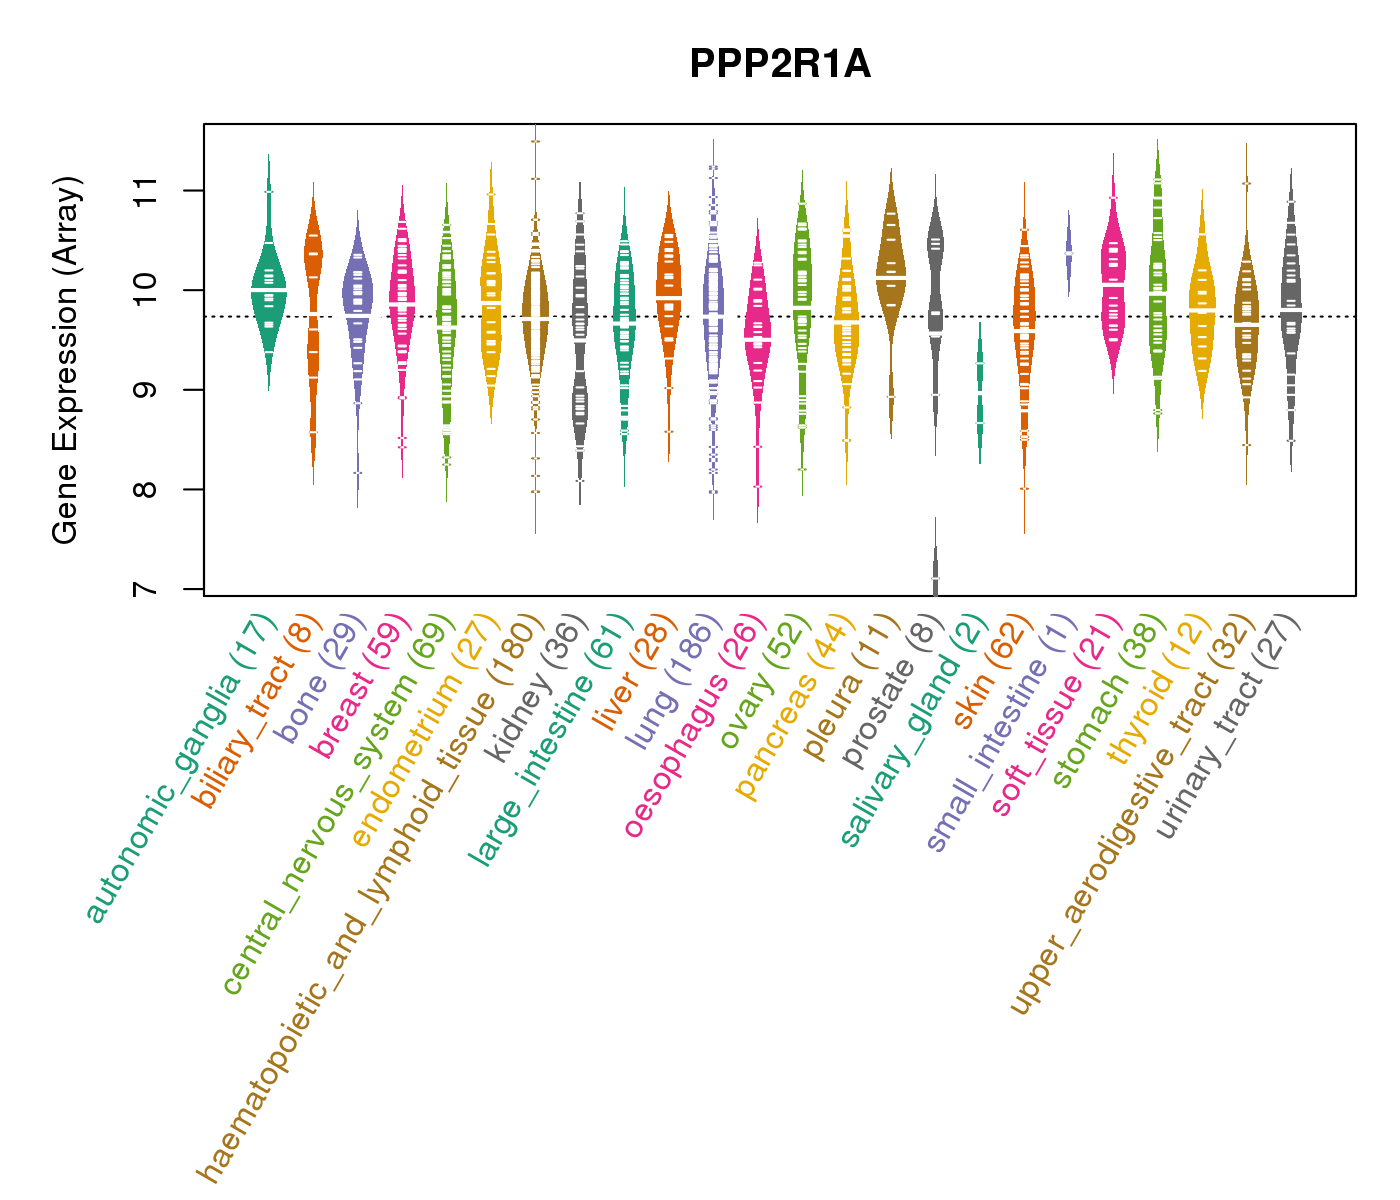
| Gene Expression for PPP2R1A |
| * CCLE gene expression data were extracted from CCLE_Expression_Entrez_2012-10-18.res: Gene-centric RMA-normalized mRNA expression data. |
 |
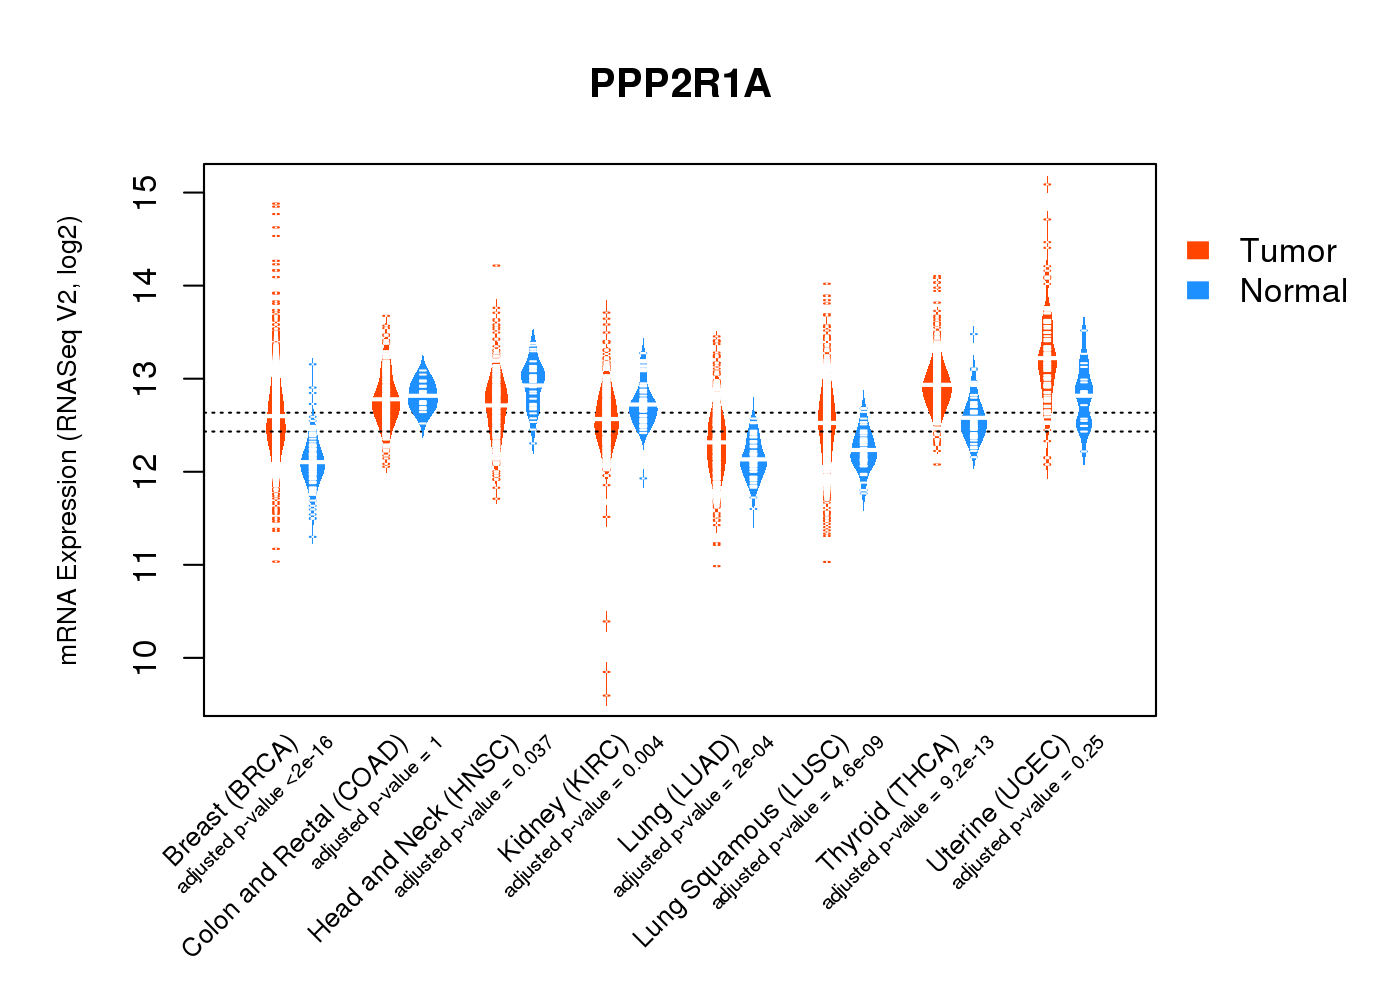
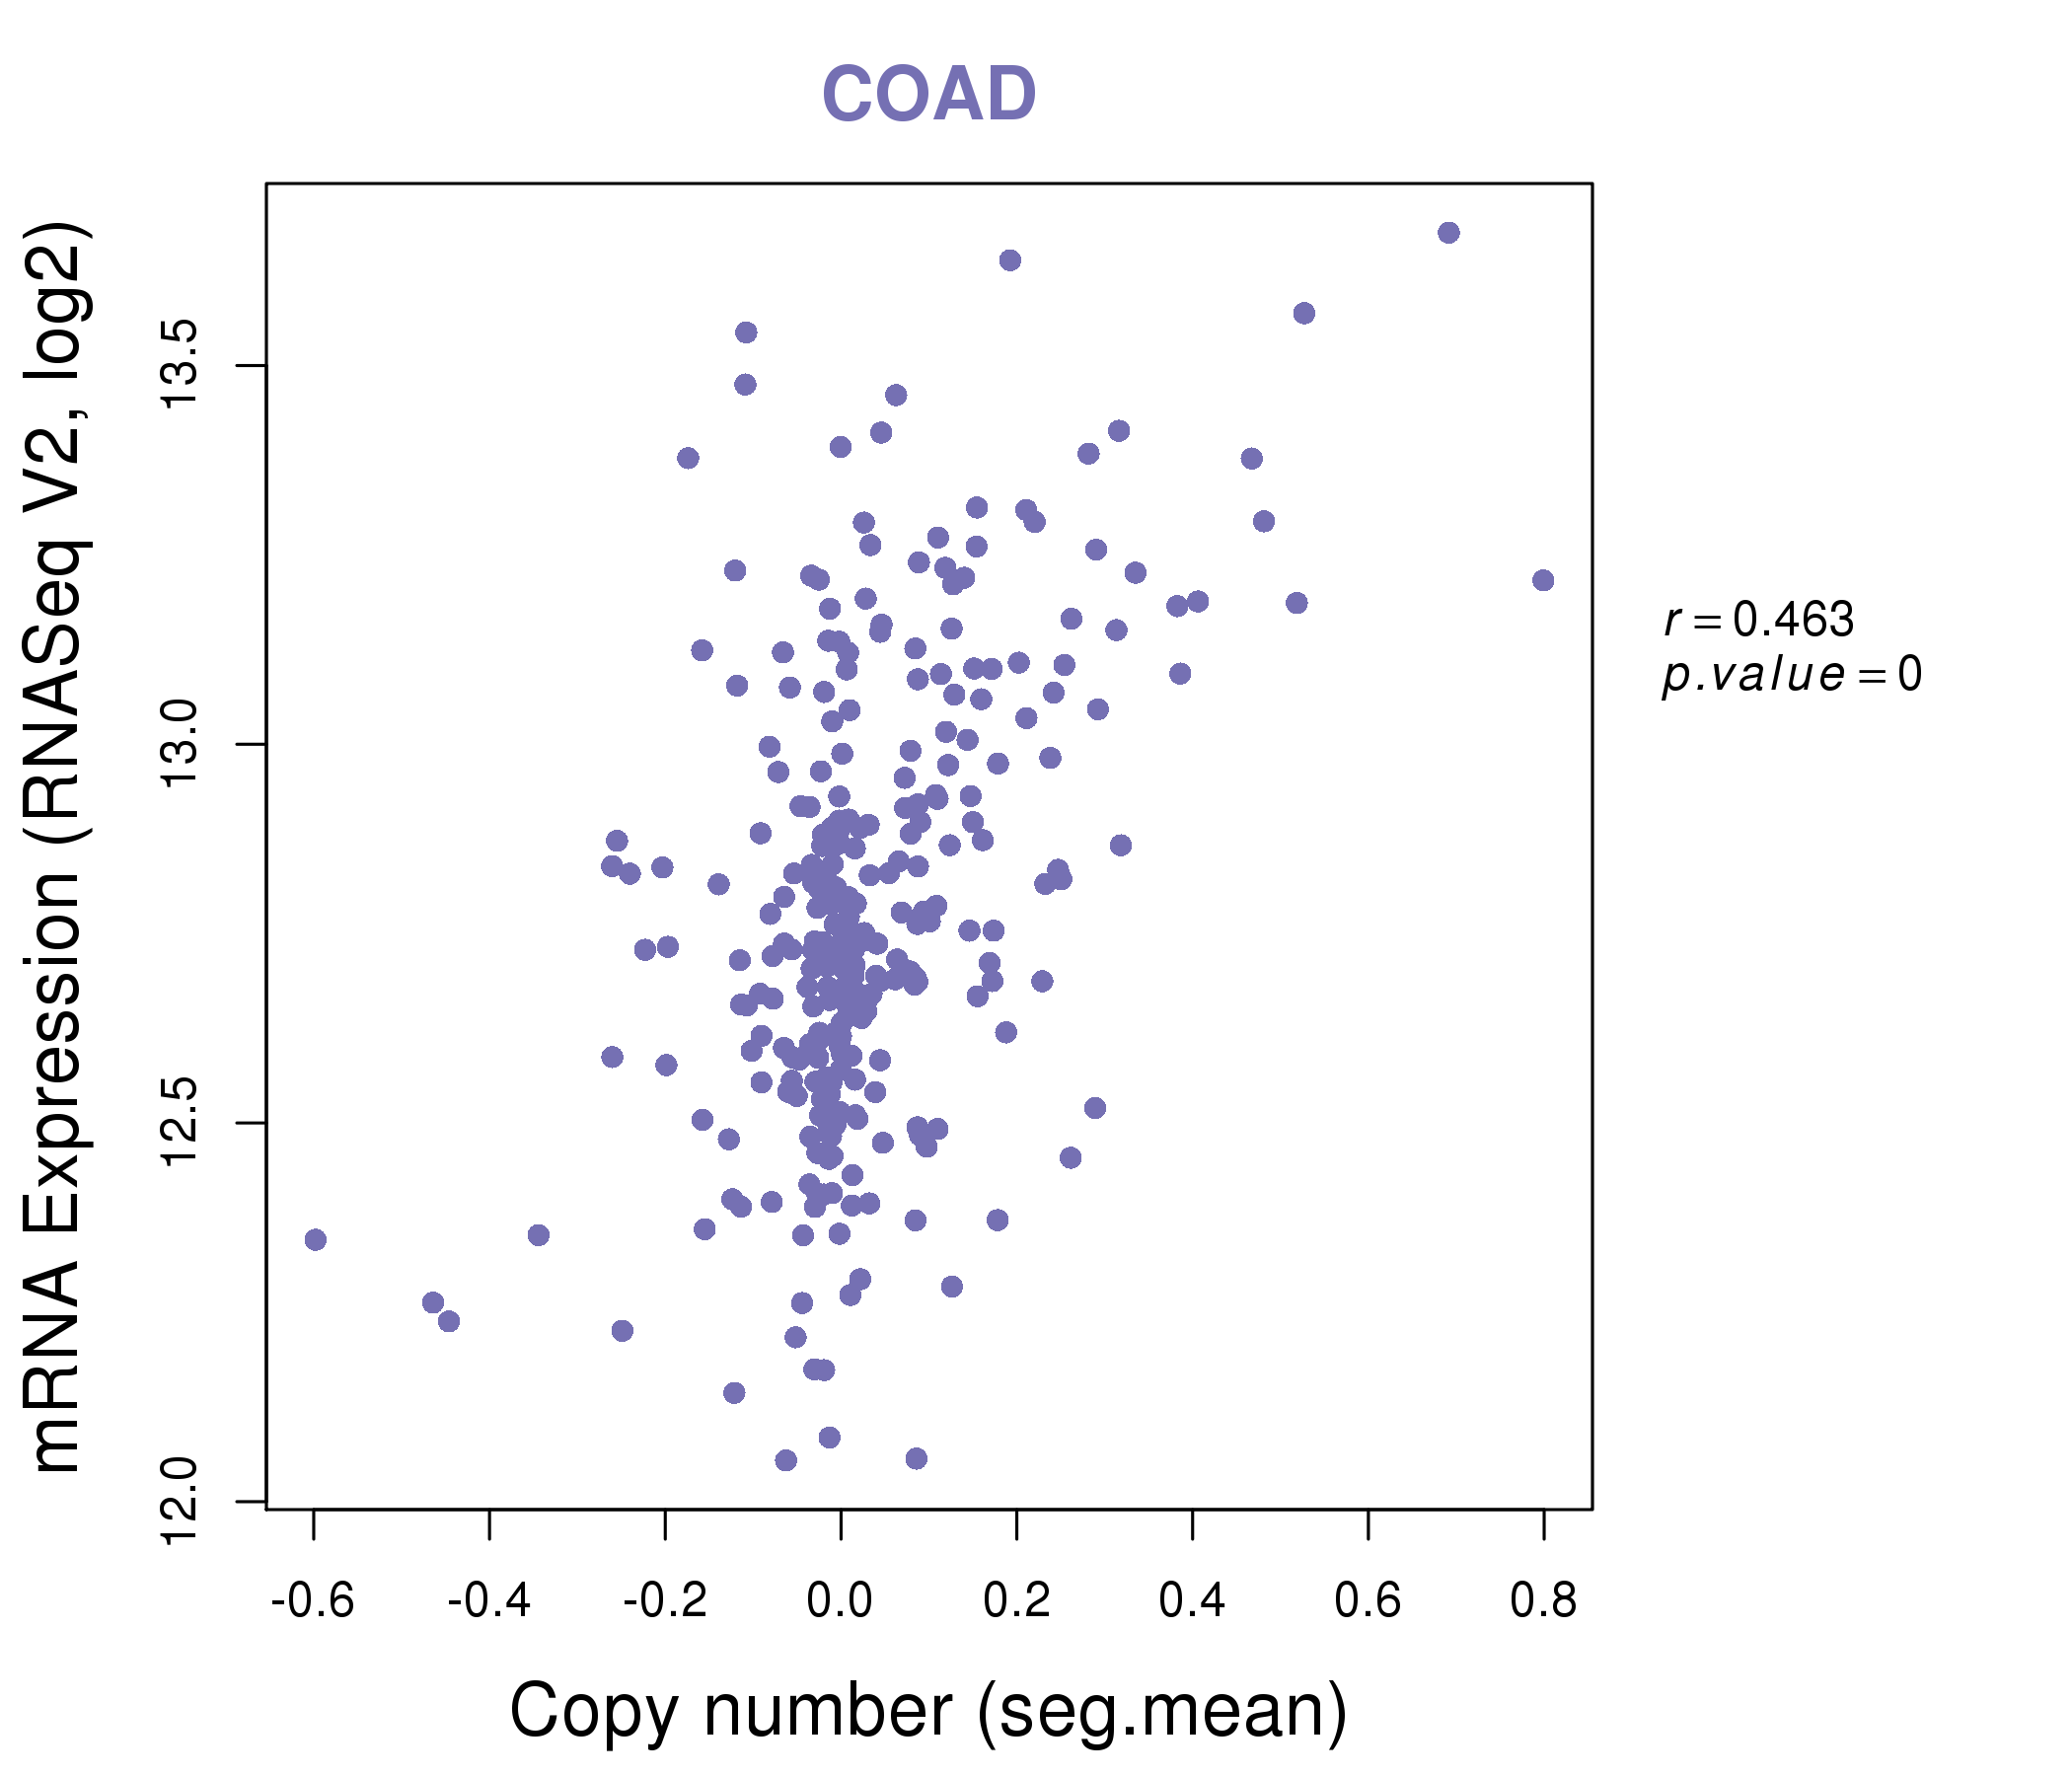
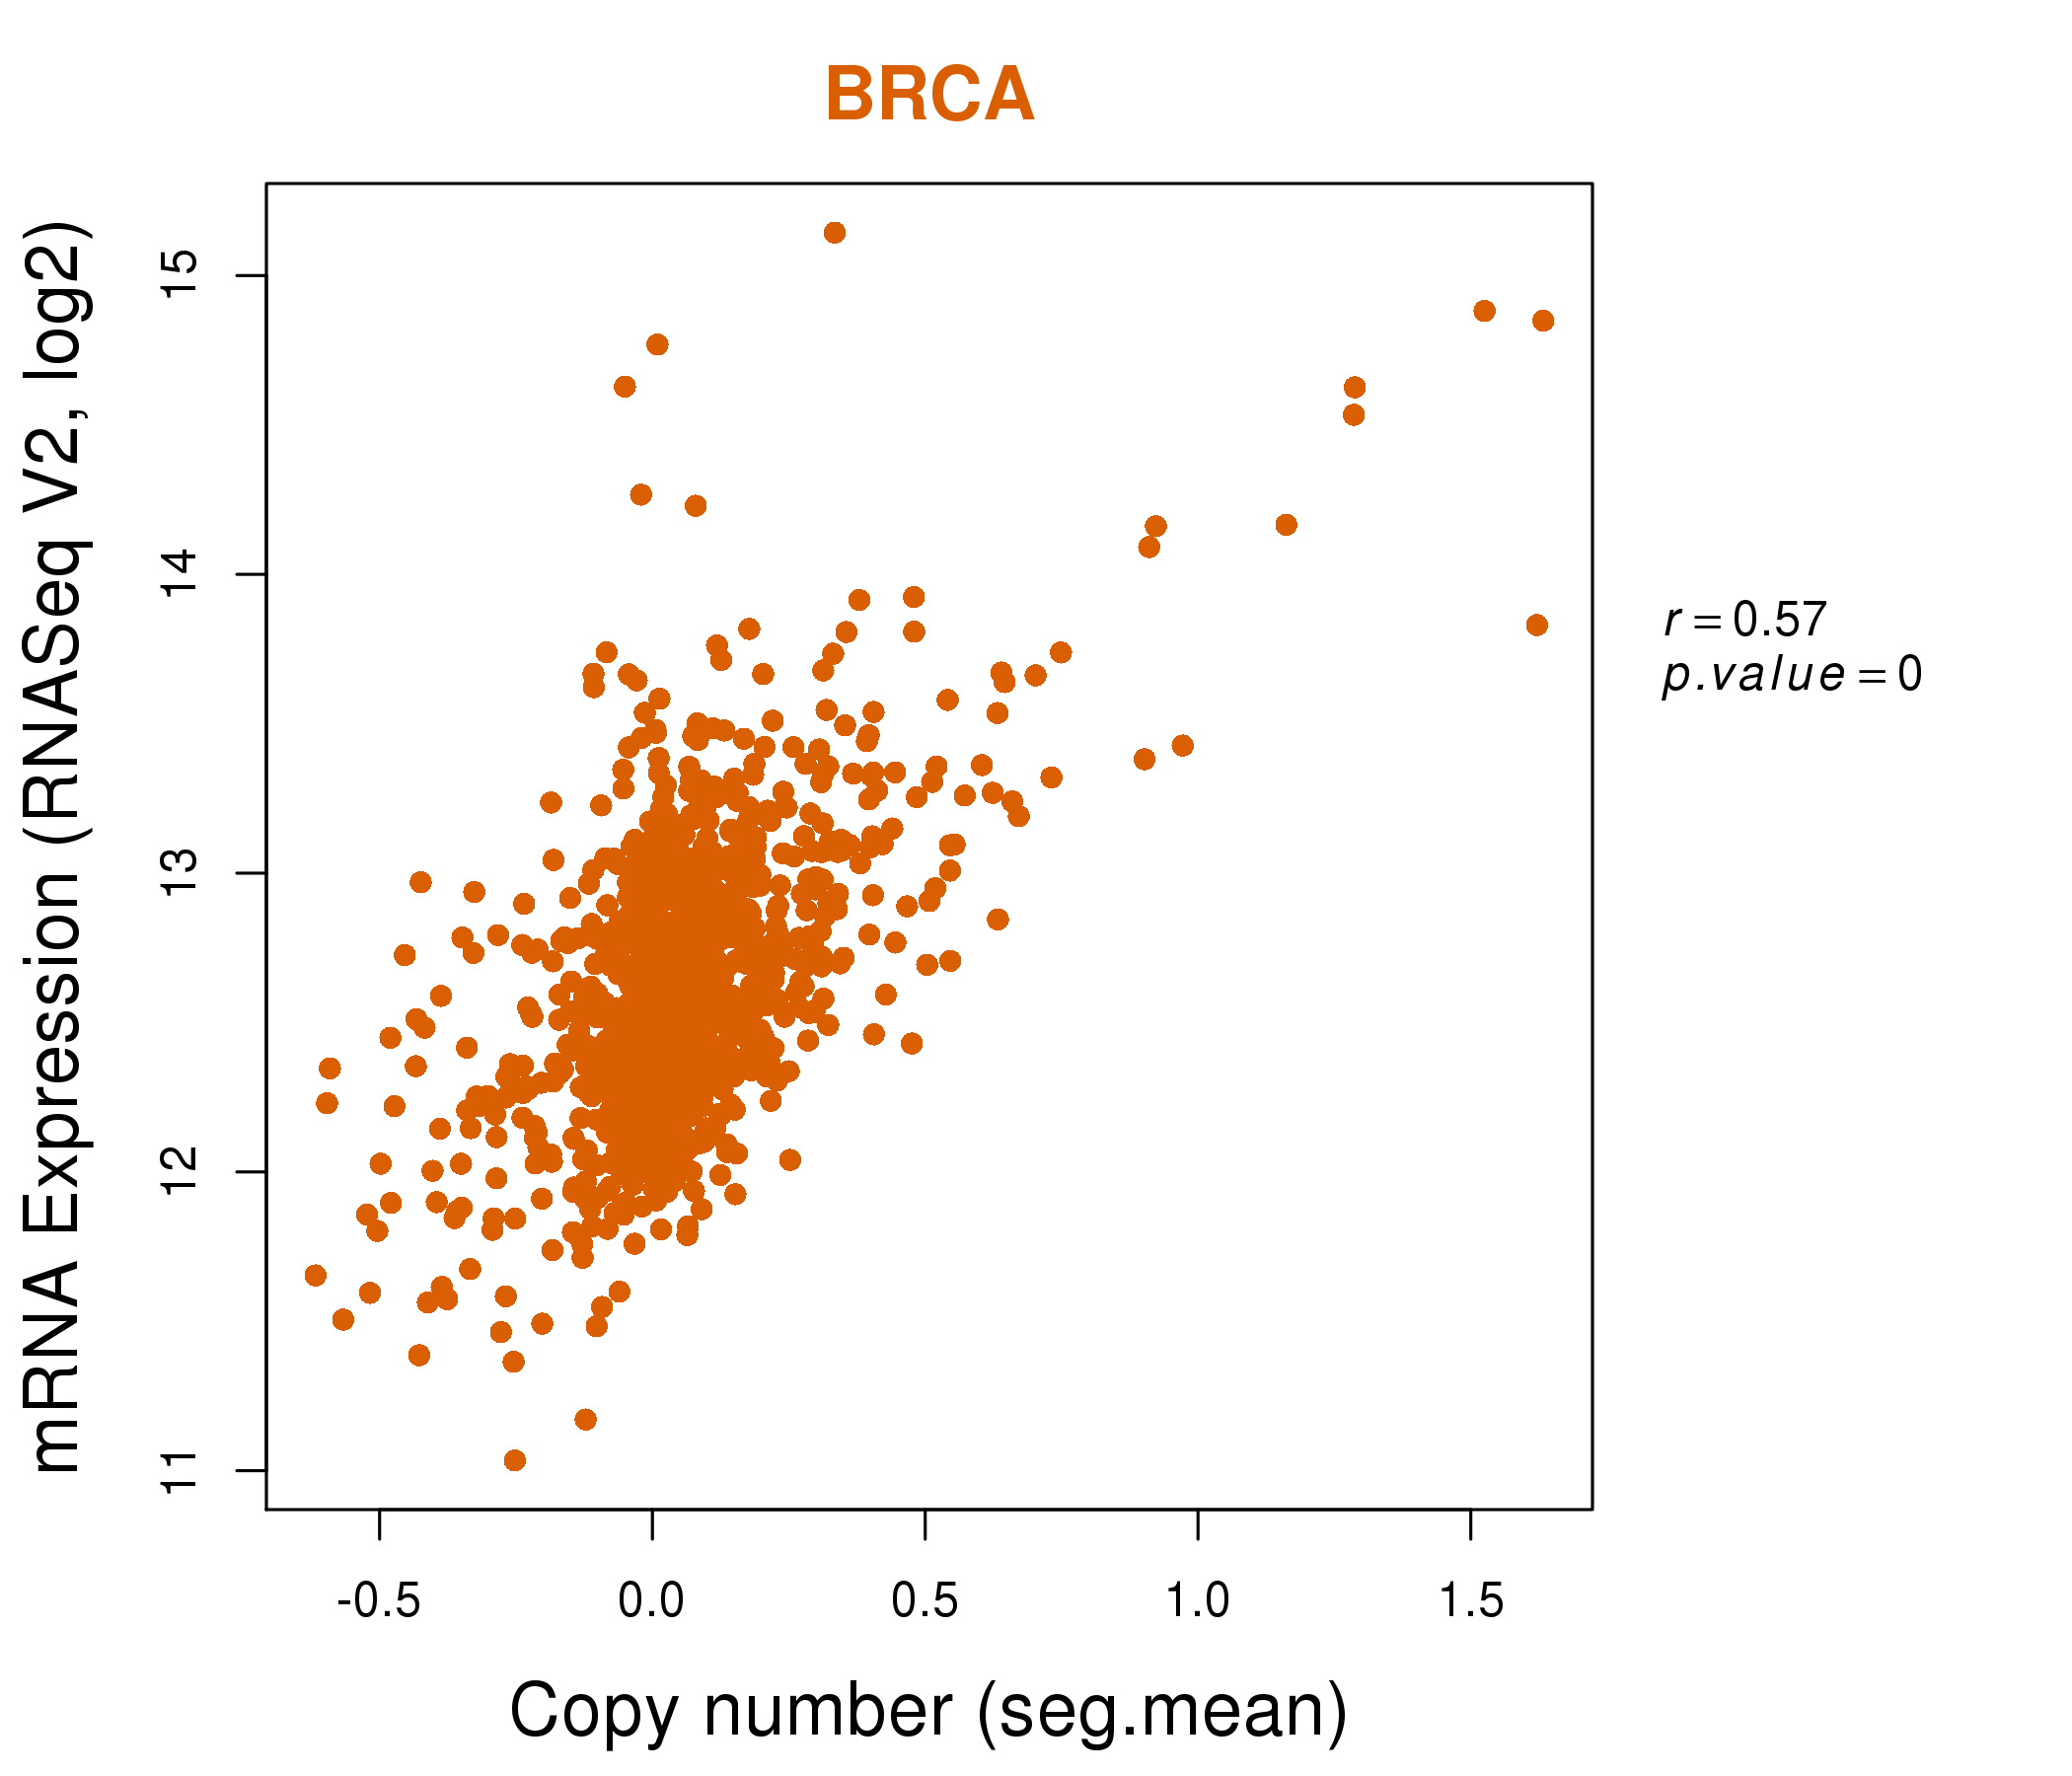
| * Normalized gene expression data of RNASeqV2 was extracted from TCGA using R package TCGA-Assembler. The URLs of all public data files on TCGA DCC data server were gathered at Jan-05-2015. Only eight cancer types have enough normal control samples for differential expression analysis. (t test, adjusted p<0.05 (using Benjamini-Hochberg FDR)) |
 |
| Top |
| * This plots show the correlation between CNV and gene expression. |
: Open all plots for all cancer types
 |
|
 |
|

| Top |
| Gene-Gene Network Information |
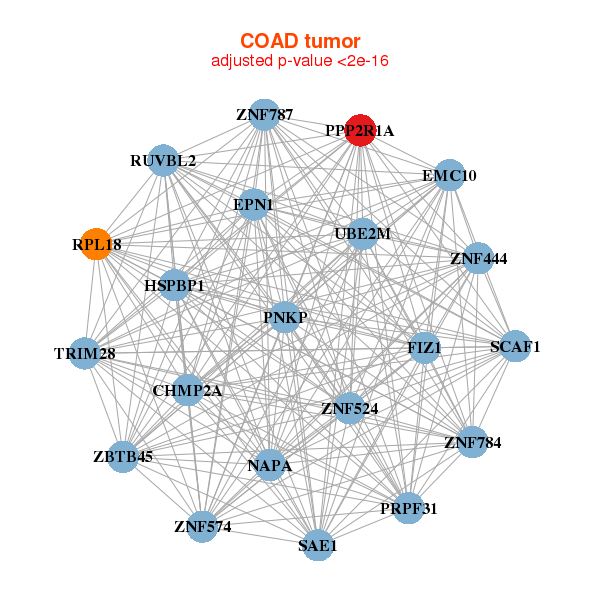
| * Co-Expression network figures were drawn using R package igraph. Only the top 20 genes with the highest correlations were shown. Red circle: input gene, orange circle: cell metabolism gene, sky circle: other gene |
: Open all plots for all cancer types
 |
| ||||
| AKT1S1,EMC10,EPN1,HSPBP1,LENG1,MED25,NAT14, NOSIP,NR1H2,PNKP,PPP2R1A,PRPF31,PTOV1,RUVBL2, SCAF1,TBC1D17,TFPT,UBE2M,VRK3,ZNF444,ZNF579 | ARF5,CHMP6,DRG2,EEFSEC,HSPBP1,MCRS1,MRPL4, MRPS12,NOC4L,NSUN5,NUDT22,OTUB1,PPP1CA,PPP2R1A, PTOV1,RNF187,SGTA,SSSCA1,TBL3,TIMM17B,TMEM134 | ||||
 |
| ||||
| EMC10,CHMP2A,EPN1,FIZ1,HSPBP1,NAPA,PNKP, PPP2R1A,PRPF31,RPL18,RUVBL2,SAE1,SCAF1,TRIM28, UBE2M,ZBTB45,ZNF444,ZNF524,ZNF574,ZNF784,ZNF787 | ALDOA,ATP5D,AP5S1,CHCHD10,FAM129B,CPTP,GTF3C5, HIGD2A,IDH3G,LGALS4,NDUFV1,PGLS,PGM1,PPDPF, PPP2R1A,RAB1B,RCE1,SDSL,THAP4,UQCRC1,ZDHHC12 |
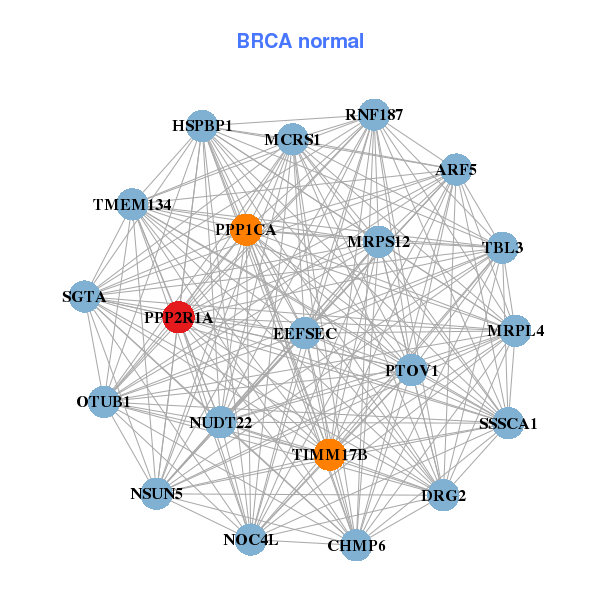
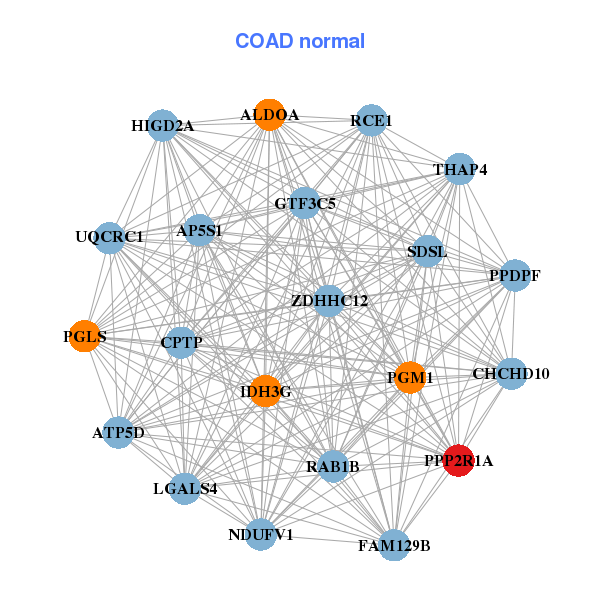
| * Co-Expression network figures were drawn using R package igraph. Only the top 20 genes with the highest correlations were shown. Red circle: input gene, orange circle: cell metabolism gene, sky circle: other gene |
: Open all plots for all cancer types
| Top |
: Open all interacting genes' information including KEGG pathway for all interacting genes from DAVID
| Top |
| Pharmacological Information for PPP2R1A |
| DB Category | DB Name | DB's ID and Url link |
| Organism-specific databases | PharmGKB | PA33666; -. |
| Organism-specific databases | CTD | 5518; -. |
| * Gene Centered Interaction Network. |
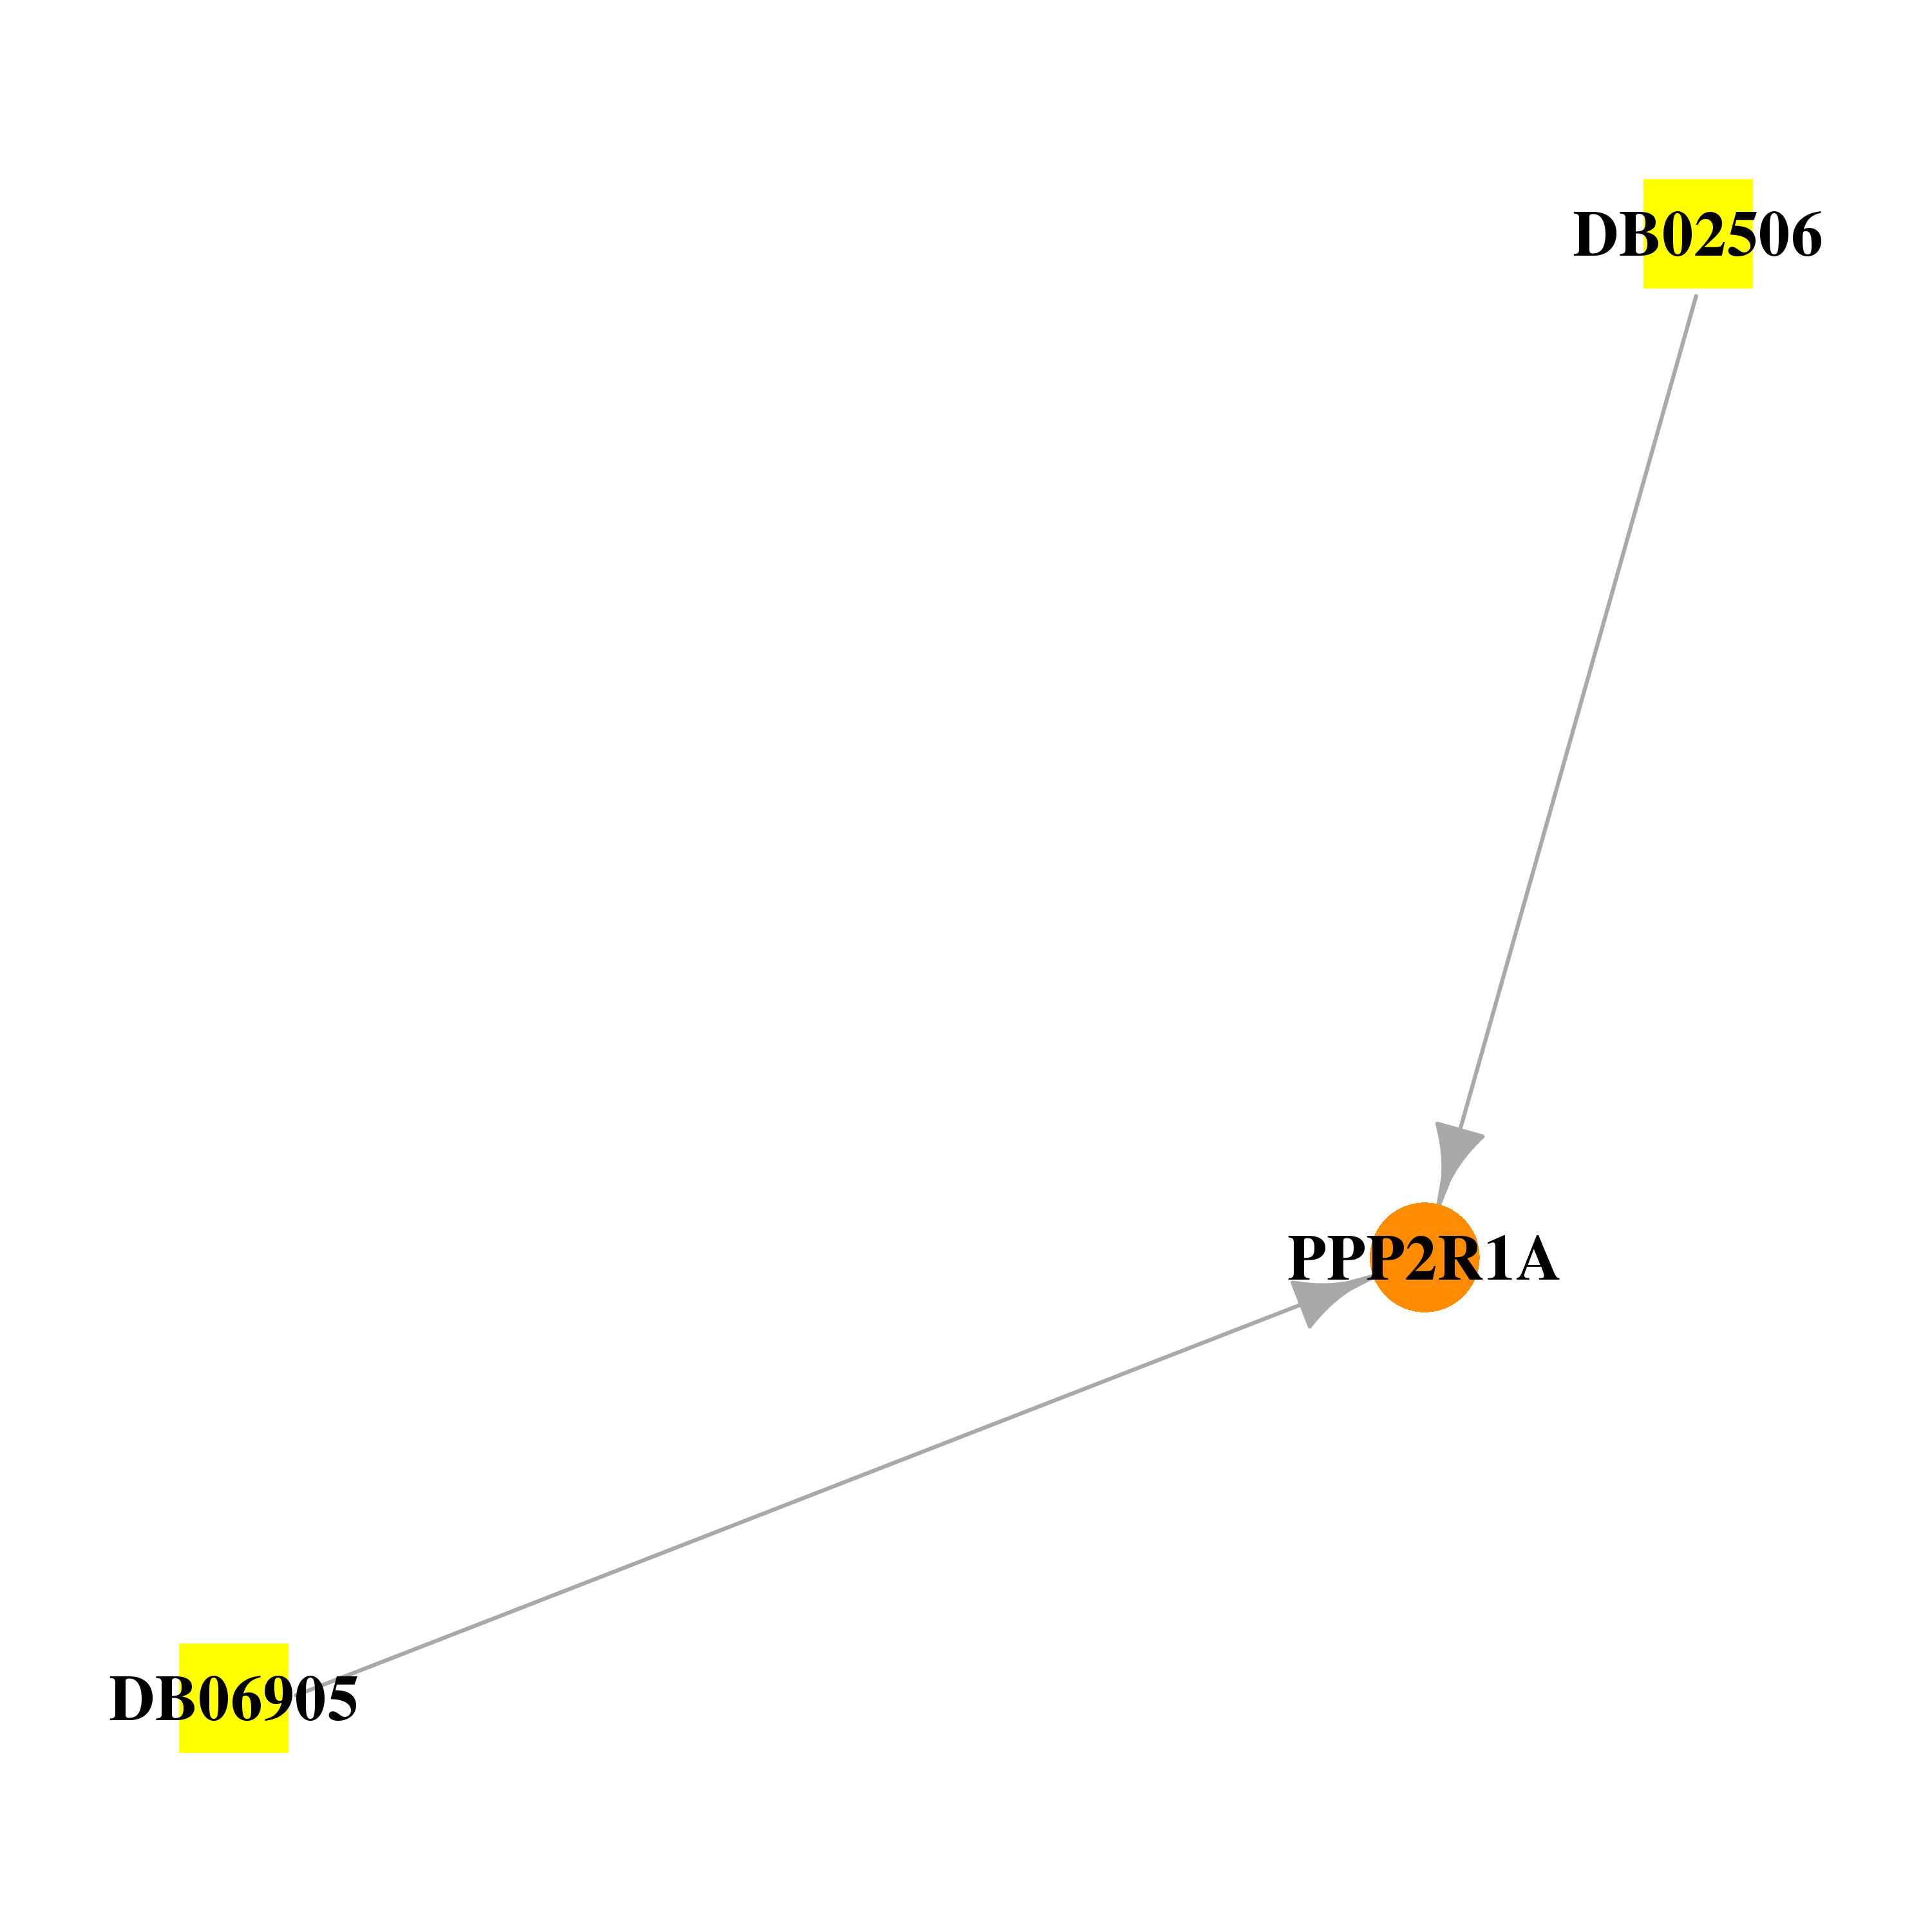 |
| * Drug Centered Interaction Network. |
| DrugBank ID | Target Name | Drug Groups | Generic Name | Drug Centered Network | Drug Structure |
| DB02506 | protein phosphatase 2, regulatory subunit A, alpha | experimental | 2,6,8-Trimethyl-3-Amino-9-Benzyl-9-Methoxynonanoic Acid | 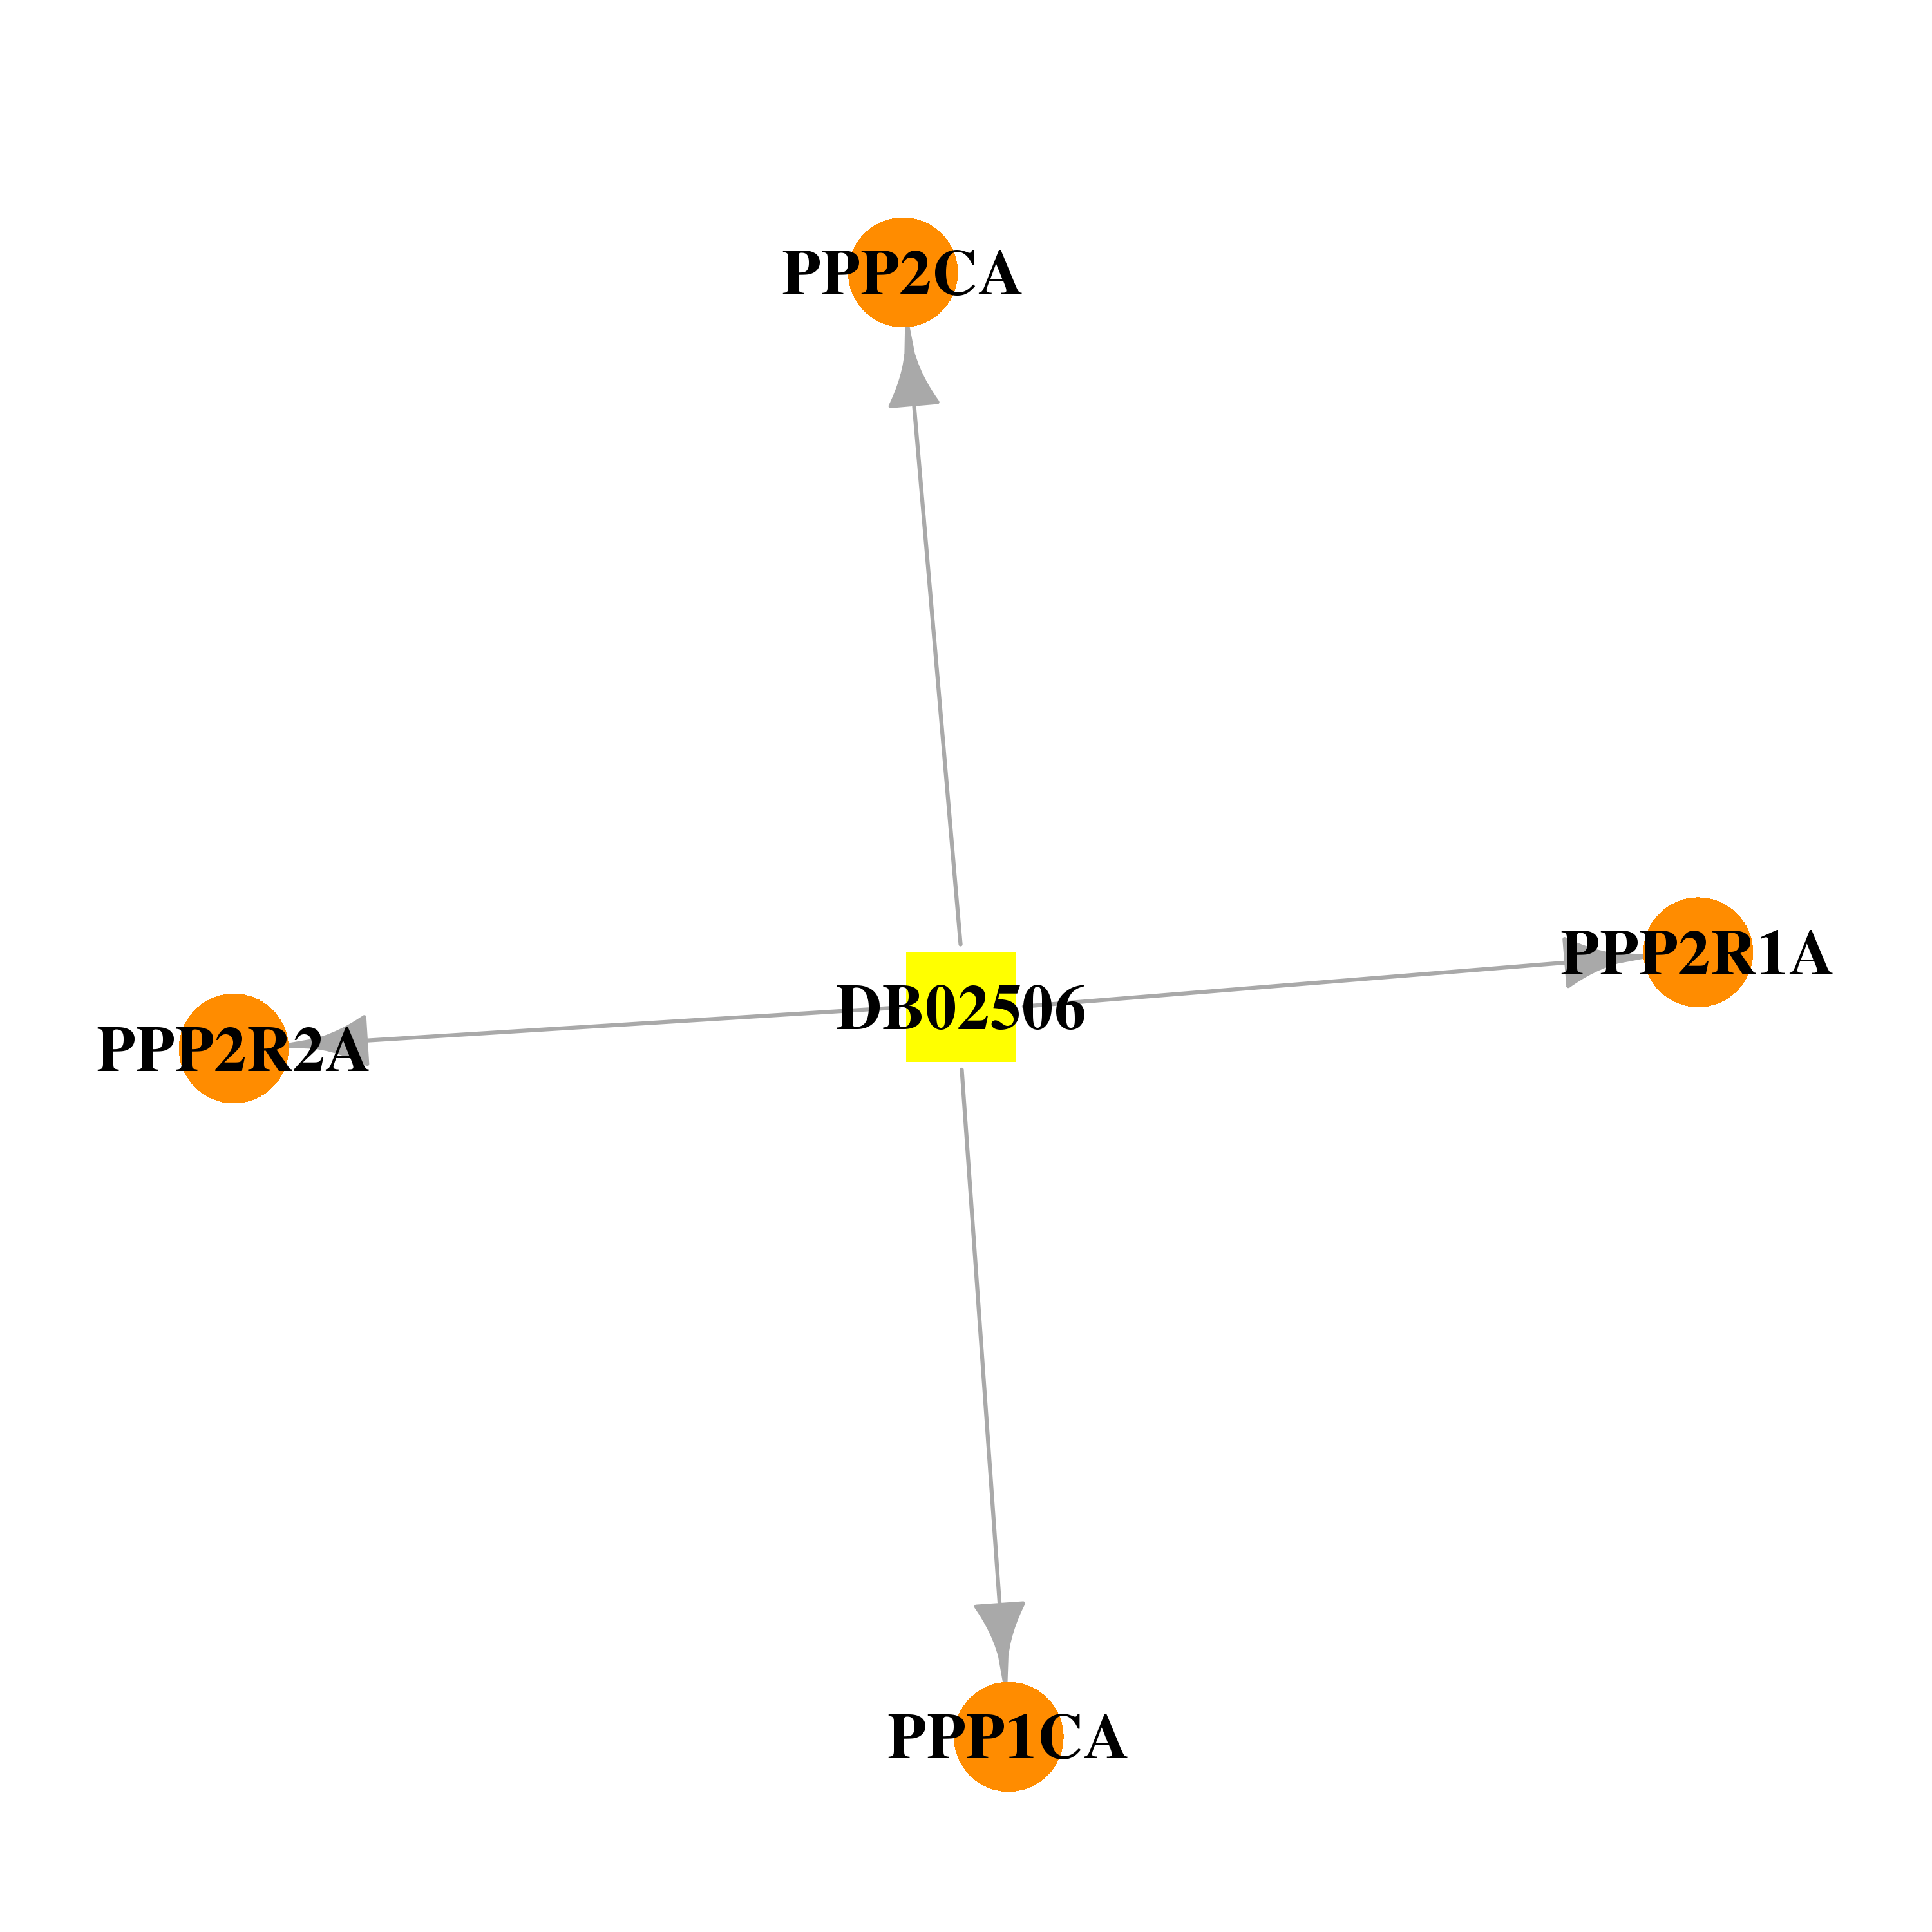 | 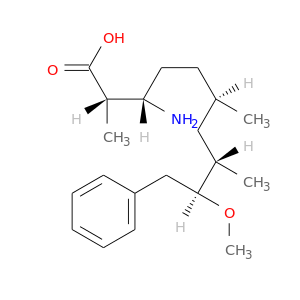 |
| DB06905 | protein phosphatase 2, regulatory subunit A, alpha | experimental | (2S,3S,4E,6E,8S,9S)-3-amino-9-methoxy-2,6,8-trimethyl-10-phenyldeca-4,6-dienoic acid | 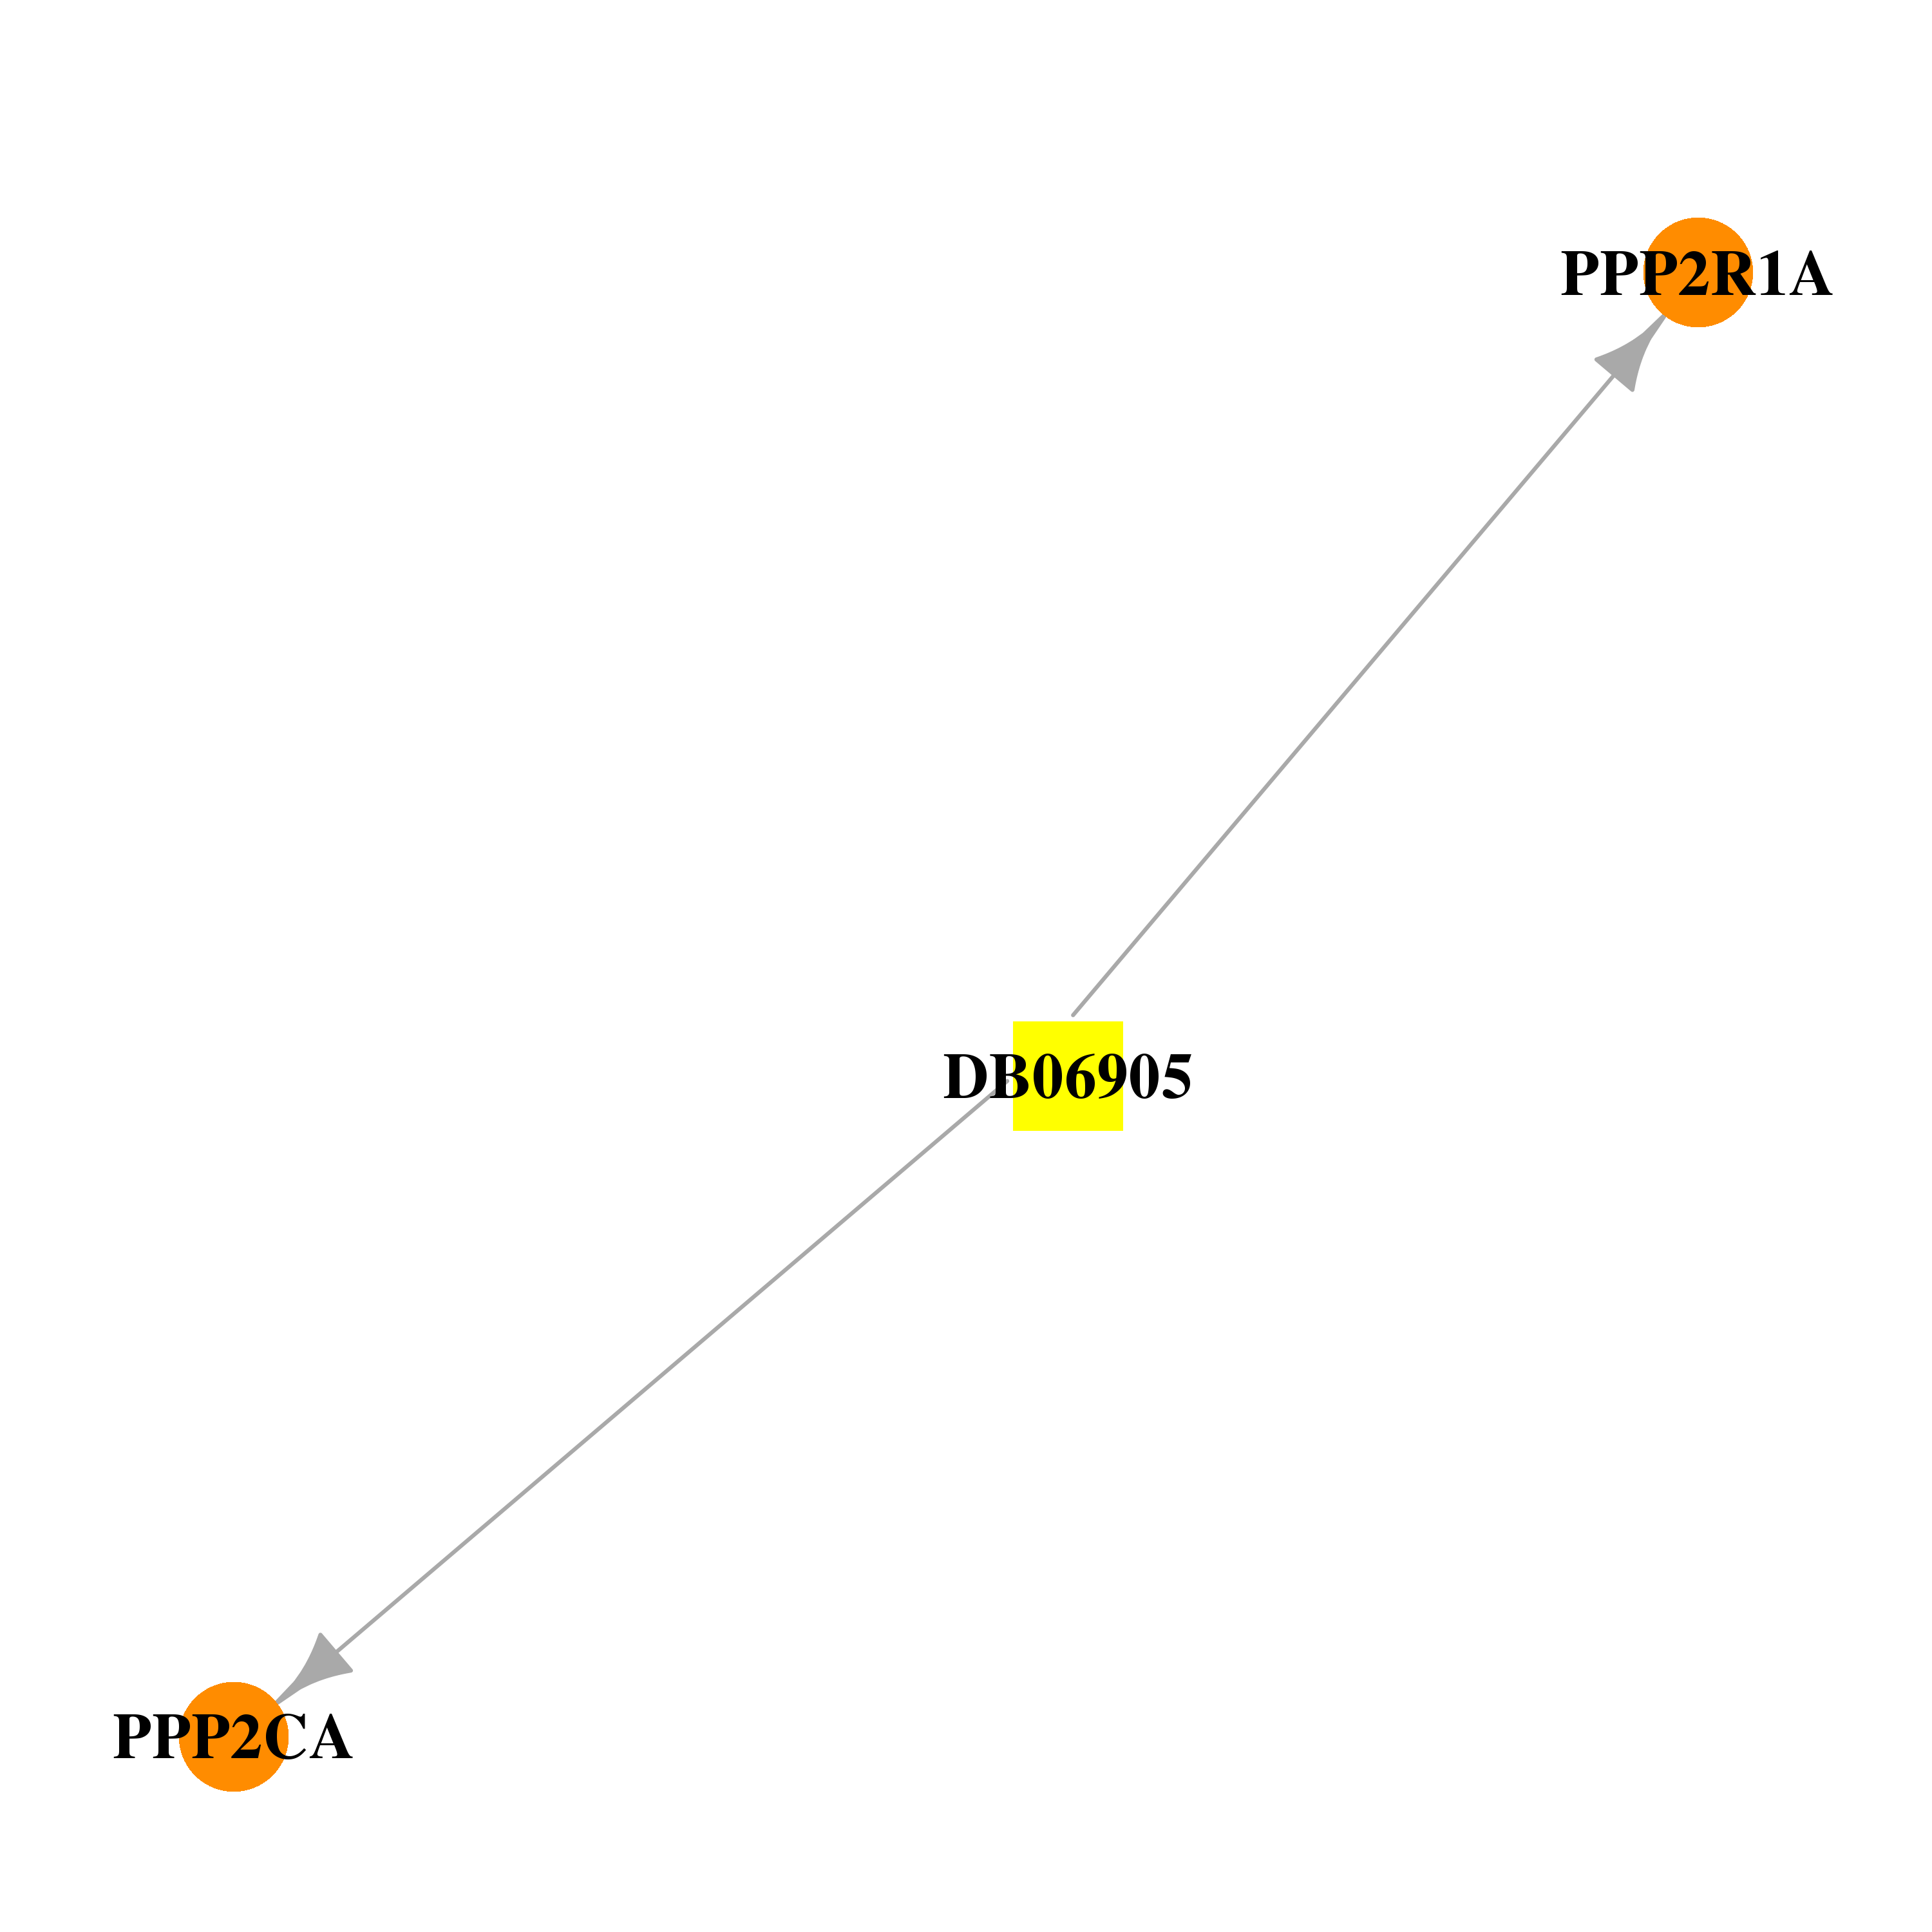 | 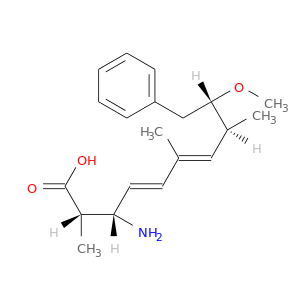 |
| Top |
| Cross referenced IDs for PPP2R1A |
| * We obtained these cross-references from Uniprot database. It covers 150 different DBs, 18 categories. http://www.uniprot.org/help/cross_references_section |
: Open all cross reference information
|
Copyright © 2016-Present - The Univsersity of Texas Health Science Center at Houston @ |