|
||||||||||||||||||||||||||||||||||||||||||||||||||||||||||||||||||||||||||||||||||||||||||||||||||||||||||||||||||||||||||||||||||||||||||||||||||||||||||||||||||||||||||||||||||||||||||||||||||||||||||||||||||||||||||||||||||||||||||||||||||||||||||||||||||||||||||||||||||||||||||||||||||||||||||||||||||||||||||
| |
| Phenotypic Information (metabolism pathway, cancer, disease, phenome) |
| |
| |
| Gene-Gene Network Information: Co-Expression Network, Interacting Genes & KEGG |
| |
|


| Gene Summary for PPP2R1B |
| Basic gene info. | Gene symbol | PPP2R1B |
| Gene name | protein phosphatase 2, regulatory subunit A, beta | |
| Synonyms | PP2A-Abeta|PR65B | |
| Cytomap | UCSC genome browser: 11q23.2 | |
| Genomic location | chr11 :111597631-111637169 | |
| Type of gene | protein-coding | |
| RefGenes | NM_001177562.1, NM_001177563.1,NM_002716.4,NM_181699.2,NM_181700.1, | |
| Ensembl id | ENSG00000262764 | |
| Description | PP2A, subunit A, PR65-beta isoformPP2A, subunit A, R1-beta isoformprotein phosphatase 2 (formerly 2A), regulatory subunit A, beta isoformprotein phosphatase 2, structural/regulatory subunit A, betaserine/threonine-protein phosphatase 2A 65 kDa regulat | |
| Modification date | 20141207 | |
| dbXrefs | MIM : 603113 | |
| HGNC : HGNC | ||
| Ensembl : ENSG00000137713 | ||
| HPRD : 04384 | ||
| Vega : OTTHUMG00000166741 | ||
| Protein | UniProt: P30154 go to UniProt's Cross Reference DB Table | |
| Expression | CleanEX: HS_PPP2R1B | |
| BioGPS: 5519 | ||
| Gene Expression Atlas: ENSG00000262764 | ||
| The Human Protein Atlas: ENSG00000262764 | ||
| Pathway | NCI Pathway Interaction Database: PPP2R1B | |
| KEGG: PPP2R1B | ||
| REACTOME: PPP2R1B | ||
| ConsensusPathDB | ||
| Pathway Commons: PPP2R1B | ||
| Metabolism | MetaCyc: PPP2R1B | |
| HUMANCyc: PPP2R1B | ||
| Regulation | Ensembl's Regulation: ENSG00000262764 | |
| miRBase: chr11 :111,597,631-111,637,169 | ||
| TargetScan: NM_001177562 | ||
| cisRED: ENSG00000262764 | ||
| Context | iHOP: PPP2R1B | |
| cancer metabolism search in PubMed: PPP2R1B | ||
| UCL Cancer Institute: PPP2R1B | ||
| Assigned class in ccmGDB | B - This gene belongs to cancer gene. | |
| Top |
| Phenotypic Information for PPP2R1B(metabolism pathway, cancer, disease, phenome) |
| Cancer | CGAP: PPP2R1B |
| Familial Cancer Database: PPP2R1B | |
| * This gene is included in those cancer gene databases. |
|
|
|
|
|
|
| ||||||||||||||||||||||||||||||||||||||||||||||||||||||||||||||||||||||||||||||||||||||||||||||||||||||||||||||||||||||||||||||||||||||||||||||||||||||||||||||||||||||||||||||||||||||||||||||||||||||||||||||||||||||||||||||||||||||||||||||||||||||||||||||||||||||||||||||||||||||||||||||||||||||||||||||||||||
Oncogene 1 | Significant driver gene in | |||||||||||||||||||||||||||||||||||||||||||||||||||||||||||||||||||||||||||||||||||||||||||||||||||||||||||||||||||||||||||||||||||||||||||||||||||||||||||||||||||||||||||||||||||||||||||||||||||||||||||||||||||||||||||||||||||||||||||||||||||||||||||||||||||||||||||||||||||||||||||||||||||||||||||||||||||||||||
| cf) number; DB name 1 Oncogene; http://nar.oxfordjournals.org/content/35/suppl_1/D721.long, 2 Tumor Suppressor gene; https://bioinfo.uth.edu/TSGene/, 3 Cancer Gene Census; http://www.nature.com/nrc/journal/v4/n3/abs/nrc1299.html, 4 CancerGenes; http://nar.oxfordjournals.org/content/35/suppl_1/D721.long, 5 Network of Cancer Gene; http://ncg.kcl.ac.uk/index.php, 1Therapeutic Vulnerabilities in Cancer; http://cbio.mskcc.org/cancergenomics/statius/ |
| REACTOME_INTEGRATION_OF_ENERGY_METABOLISM REACTOME_METABOLISM_OF_CARBOHYDRATES REACTOME_GLUCOSE_METABOLISM | |
| OMIM | 603113; gene. 603113; gene. |
| Orphanet | |
| Disease | KEGG Disease: PPP2R1B |
| MedGen: PPP2R1B (Human Medical Genetics with Condition) | |
| ClinVar: PPP2R1B | |
| Phenotype | MGI: PPP2R1B (International Mouse Phenotyping Consortium) |
| PhenomicDB: PPP2R1B | |
| Mutations for PPP2R1B |
| * Under tables are showing count per each tissue to give us broad intuition about tissue specific mutation patterns.You can go to the detailed page for each mutation database's web site. |
| There's no structural variation information in COSMIC data for this gene. |
| * From mRNA Sanger sequences, Chitars2.0 arranged chimeric transcripts. This table shows PPP2R1B related fusion information. |
| ID | Head Gene | Tail Gene | Accession | Gene_a | qStart_a | qEnd_a | Chromosome_a | tStart_a | tEnd_a | Gene_a | qStart_a | qEnd_a | Chromosome_a | tStart_a | tEnd_a |
| BG562569 | TAT | 1 | 339 | 16 | 71601286 | 71601625 | PPP2R1B | 333 | 781 | 11 | 111610550 | 111611006 | |
| BQ329687 | PPP2R1B | 18 | 114 | 11 | 111610247 | 111610344 | NHP2L1 | 108 | 366 | 22 | 42070195 | 42070449 | |
| BE564406 | LAD1 | 1 | 62 | 1 | 201355560 | 201355621 | PPP2R1B | 50 | 596 | 11 | 111611769 | 111612317 | |
| Top |
| Mutation type/ Tissue ID | brca | cns | cerv | endome | haematopo | kidn | Lintest | liver | lung | ns | ovary | pancre | prost | skin | stoma | thyro | urina | |||
| Total # sample | 1 | |||||||||||||||||||
| GAIN (# sample) | 1 | |||||||||||||||||||
| LOSS (# sample) |
| cf) Tissue ID; Tissue type (1; Breast, 2; Central_nervous_system, 3; Cervix, 4; Endometrium, 5; Haematopoietic_and_lymphoid_tissue, 6; Kidney, 7; Large_intestine, 8; Liver, 9; Lung, 10; NS, 11; Ovary, 12; Pancreas, 13; Prostate, 14; Skin, 15; Stomach, 16; Thyroid, 17; Urinary_tract) |
| Top |
|
 |
| Top |
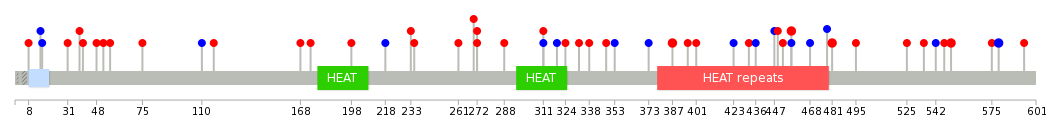
| Stat. for Non-Synonymous SNVs (# total SNVs=36) | (# total SNVs=11) |
 |  |
(# total SNVs=1) | (# total SNVs=0) |
 |
| Top |
| * When you move the cursor on each content, you can see more deailed mutation information on the Tooltip. Those are primary_site,primary_histology,mutation(aa),pubmedID. |
| GRCh37 position | Mutation(aa) | Unique sampleID count |
| chr11:111614213-111614213 | p.L481V | 2 |
| chr11:111612831-111612831 | p.L579L | 2 |
| chr11:111624171-111624171 | p.D387G | 2 |
| chr11:111613292-111613292 | p.N551S | 2 |
| chr11:111618707-111618707 | p.S457F | 2 |
| chr11:111597721-111597721 | p.E658K | 1 |
| chr11:111624289-111624289 | p.D348N | 1 |
| chr11:111613318-111613318 | p.G542G | 1 |
| chr11:111626080-111626080 | p.R261L | 1 |
| chr11:111618731-111618731 | p.E449A | 1 |
| Top |
|
 |
| Point Mutation/ Tissue ID | 1 | 2 | 3 | 4 | 5 | 6 | 7 | 8 | 9 | 10 | 11 | 12 | 13 | 14 | 15 | 16 | 17 | 18 | 19 | 20 |
| # sample | 4 | 1 | 5 | 2 | 2 | 4 | 7 | 3 | 1 | 1 | 3 | 7 | 1 | 5 | ||||||
| # mutation | 4 | 1 | 5 | 2 | 2 | 4 | 9 | 3 | 1 | 1 | 3 | 8 | 1 | 7 | ||||||
| nonsynonymous SNV | 3 | 4 | 2 | 2 | 1 | 5 | 2 | 1 | 1 | 3 | 4 | 5 | ||||||||
| synonymous SNV | 1 | 1 | 1 | 3 | 4 | 1 | 4 | 1 | 2 |
| cf) Tissue ID; Tissue type (1; BLCA[Bladder Urothelial Carcinoma], 2; BRCA[Breast invasive carcinoma], 3; CESC[Cervical squamous cell carcinoma and endocervical adenocarcinoma], 4; COAD[Colon adenocarcinoma], 5; GBM[Glioblastoma multiforme], 6; Glioma Low Grade, 7; HNSC[Head and Neck squamous cell carcinoma], 8; KICH[Kidney Chromophobe], 9; KIRC[Kidney renal clear cell carcinoma], 10; KIRP[Kidney renal papillary cell carcinoma], 11; LAML[Acute Myeloid Leukemia], 12; LUAD[Lung adenocarcinoma], 13; LUSC[Lung squamous cell carcinoma], 14; OV[Ovarian serous cystadenocarcinoma ], 15; PAAD[Pancreatic adenocarcinoma], 16; PRAD[Prostate adenocarcinoma], 17; SKCM[Skin Cutaneous Melanoma], 18:STAD[Stomach adenocarcinoma], 19:THCA[Thyroid carcinoma], 20:UCEC[Uterine Corpus Endometrial Carcinoma]) |
| Top |
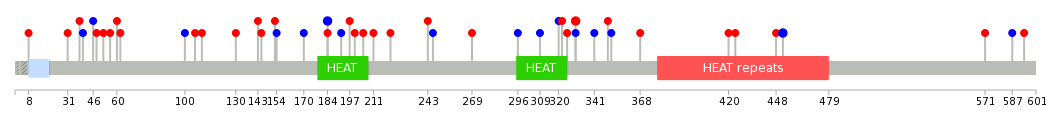
| * We represented just top 10 SNVs. When you move the cursor on each content, you can see more deailed mutation information on the Tooltip. Those are primary_site, primary_histology, mutation(aa), pubmedID. |
| Genomic Position | Mutation(aa) | Unique sampleID count |
| chr11:111612831 | p.L452L,PPP2R1B | 2 |
| chr11:111625731 | p.S330F,PPP2R1B | 2 |
| chr11:111618707 | p.R184R,PPP2R1B | 2 |
| chr11:111608179 | p.T246T,PPP2R1B | 1 |
| chr11:111630561 | p.R130P,PPP2R1B | 1 |
| chr11:111618723 | p.V448A,PPP2R1B | 1 |
| chr11:111636973 | p.K243R,PPP2R1B | 1 |
| chr11:111625273 | p.V110L,PPP2R1B | 1 |
| chr11:111630634 | p.N424S,PPP2R1B | 1 |
| chr11:111618731 | p.D221Y,PPP2R1B | 1 |
| * Copy number data were extracted from TCGA using R package TCGA-Assembler. The URLs of all public data files on TCGA DCC data server were gathered on Jan-05-2015. Function ProcessCNAData in TCGA-Assembler package was used to obtain gene-level copy number value which is calculated as the average copy number of the genomic region of a gene. |
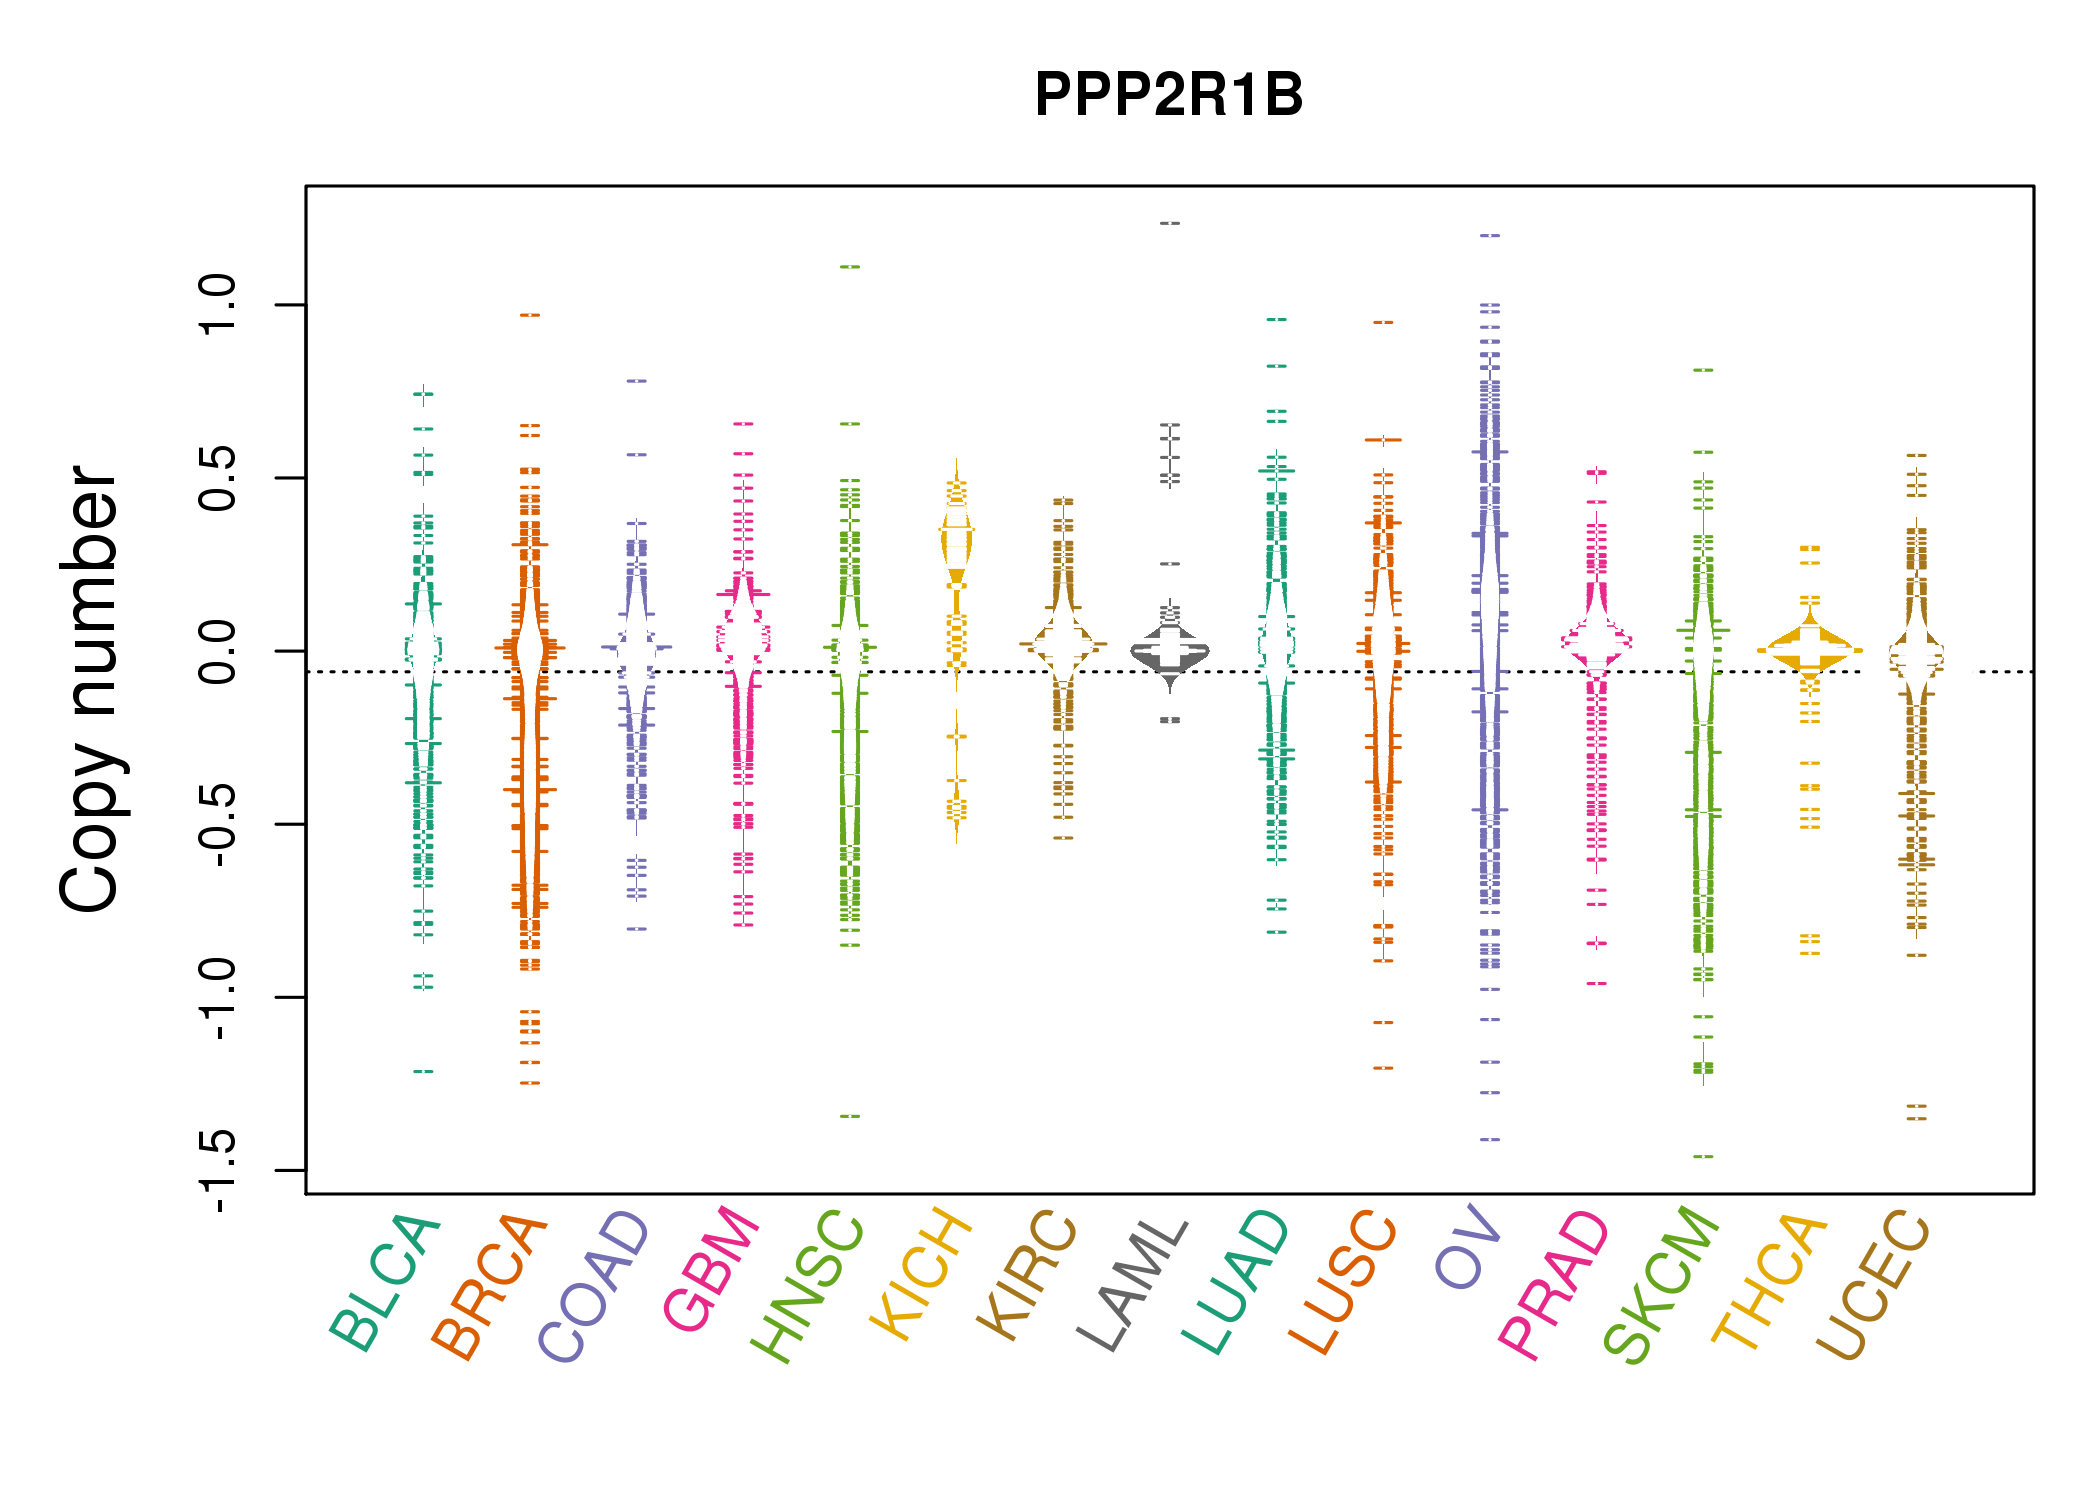 |
| cf) Tissue ID[Tissue type]: BLCA[Bladder Urothelial Carcinoma], BRCA[Breast invasive carcinoma], CESC[Cervical squamous cell carcinoma and endocervical adenocarcinoma], COAD[Colon adenocarcinoma], GBM[Glioblastoma multiforme], Glioma Low Grade, HNSC[Head and Neck squamous cell carcinoma], KICH[Kidney Chromophobe], KIRC[Kidney renal clear cell carcinoma], KIRP[Kidney renal papillary cell carcinoma], LAML[Acute Myeloid Leukemia], LUAD[Lung adenocarcinoma], LUSC[Lung squamous cell carcinoma], OV[Ovarian serous cystadenocarcinoma ], PAAD[Pancreatic adenocarcinoma], PRAD[Prostate adenocarcinoma], SKCM[Skin Cutaneous Melanoma], STAD[Stomach adenocarcinoma], THCA[Thyroid carcinoma], UCEC[Uterine Corpus Endometrial Carcinoma] |
| Top |
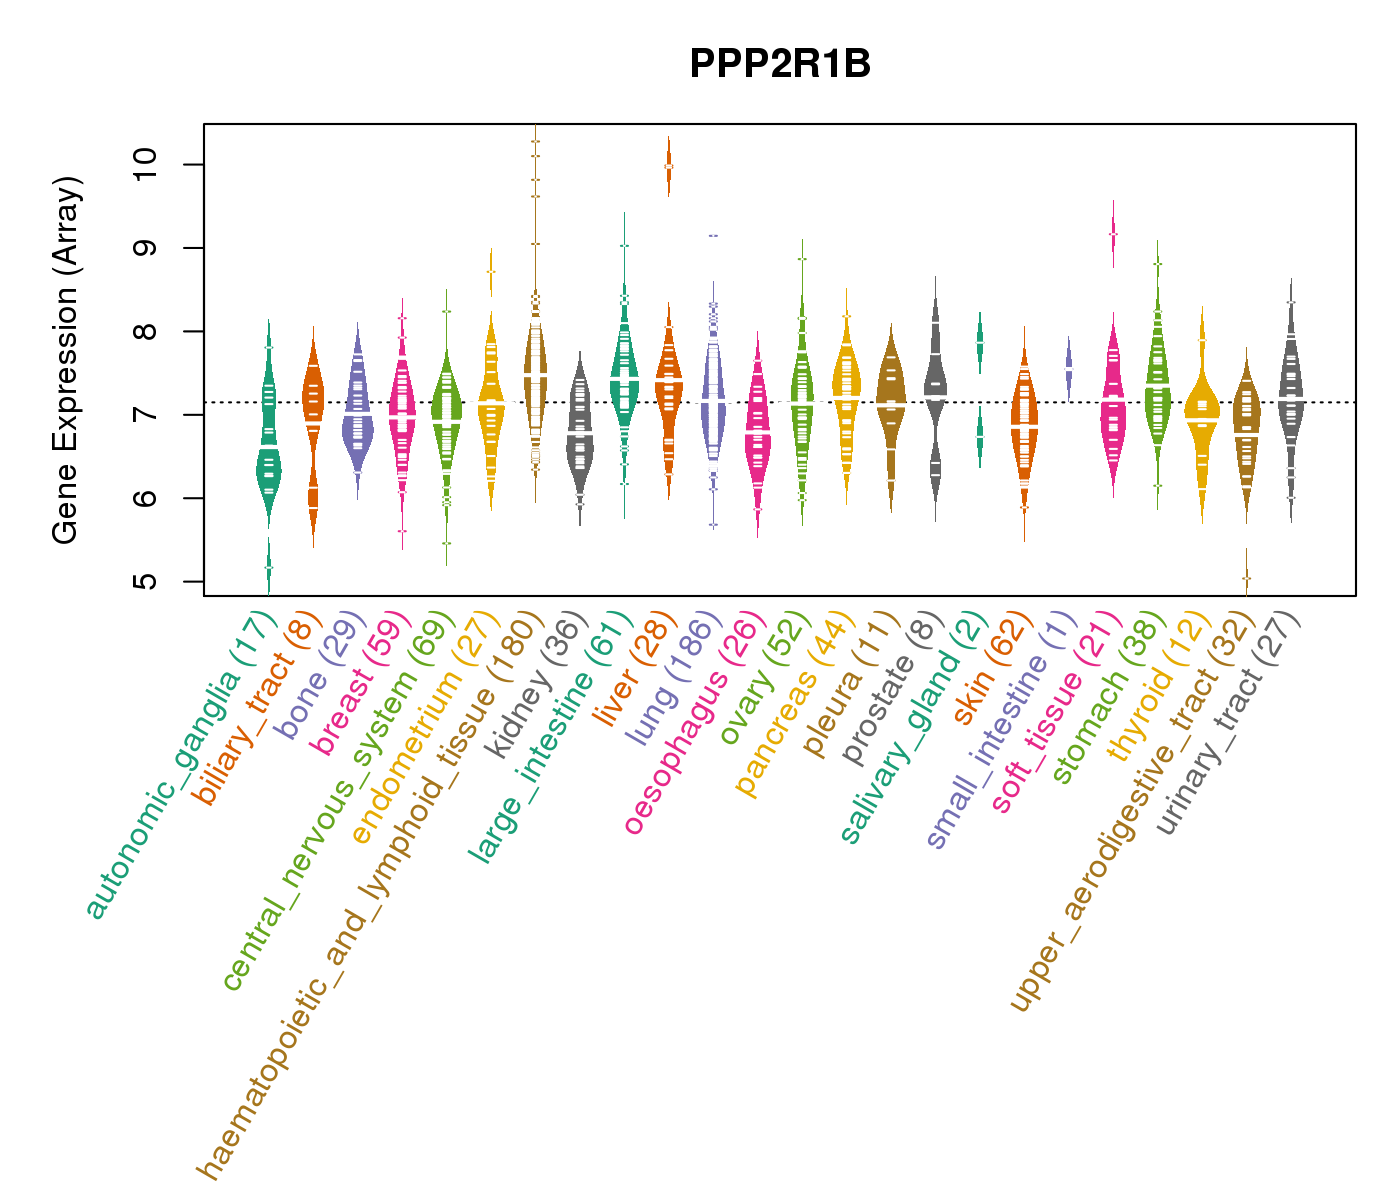
| Gene Expression for PPP2R1B |
| * CCLE gene expression data were extracted from CCLE_Expression_Entrez_2012-10-18.res: Gene-centric RMA-normalized mRNA expression data. |
 |
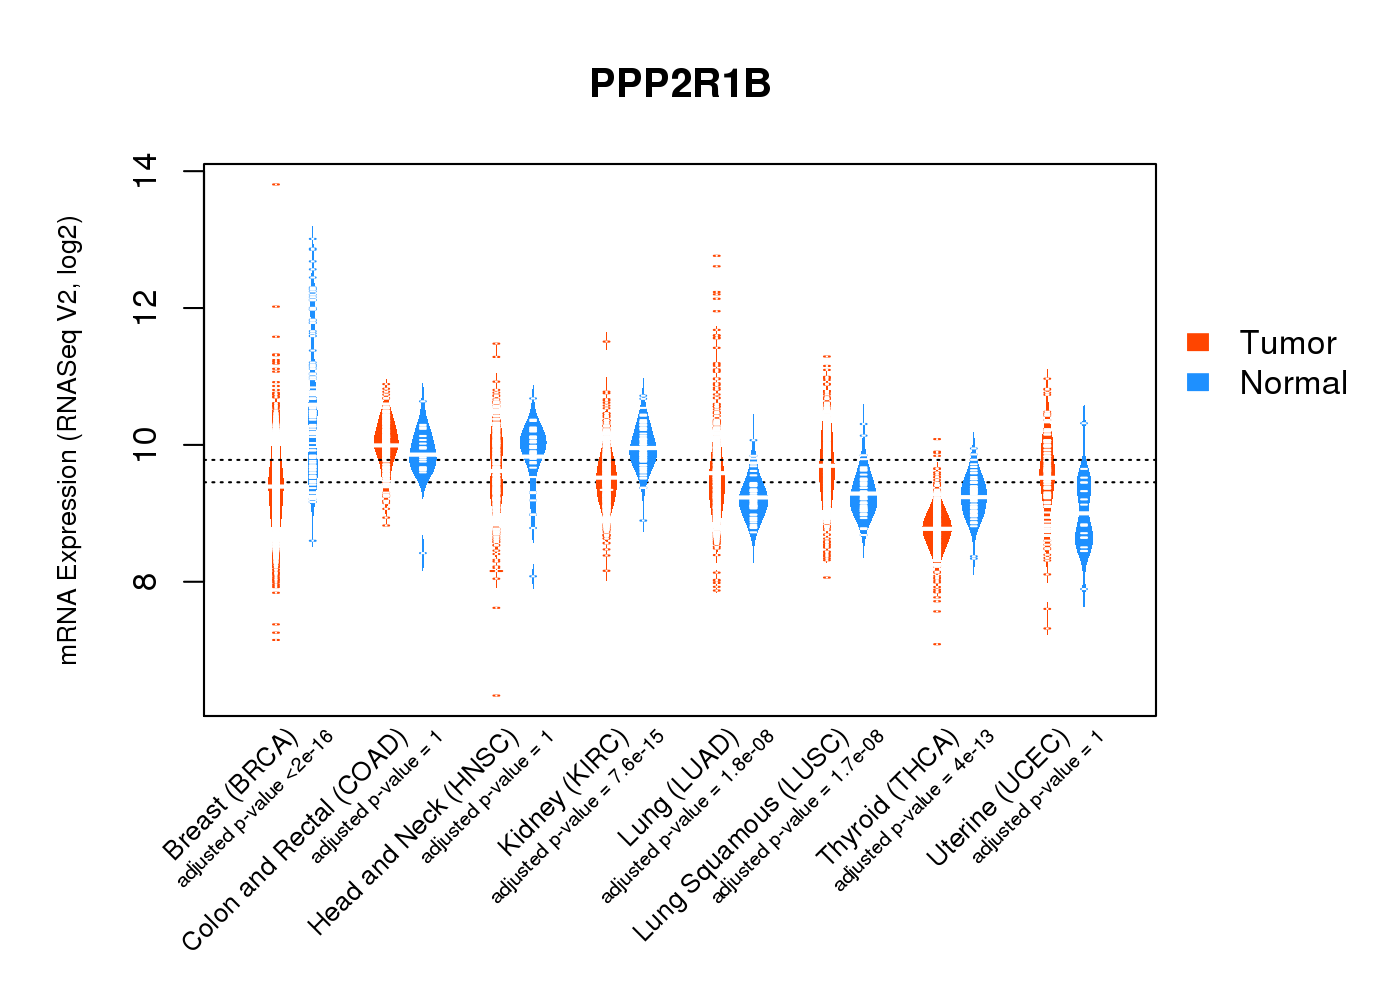
| * Normalized gene expression data of RNASeqV2 was extracted from TCGA using R package TCGA-Assembler. The URLs of all public data files on TCGA DCC data server were gathered at Jan-05-2015. Only eight cancer types have enough normal control samples for differential expression analysis. (t test, adjusted p<0.05 (using Benjamini-Hochberg FDR)) |
 |
| Top |
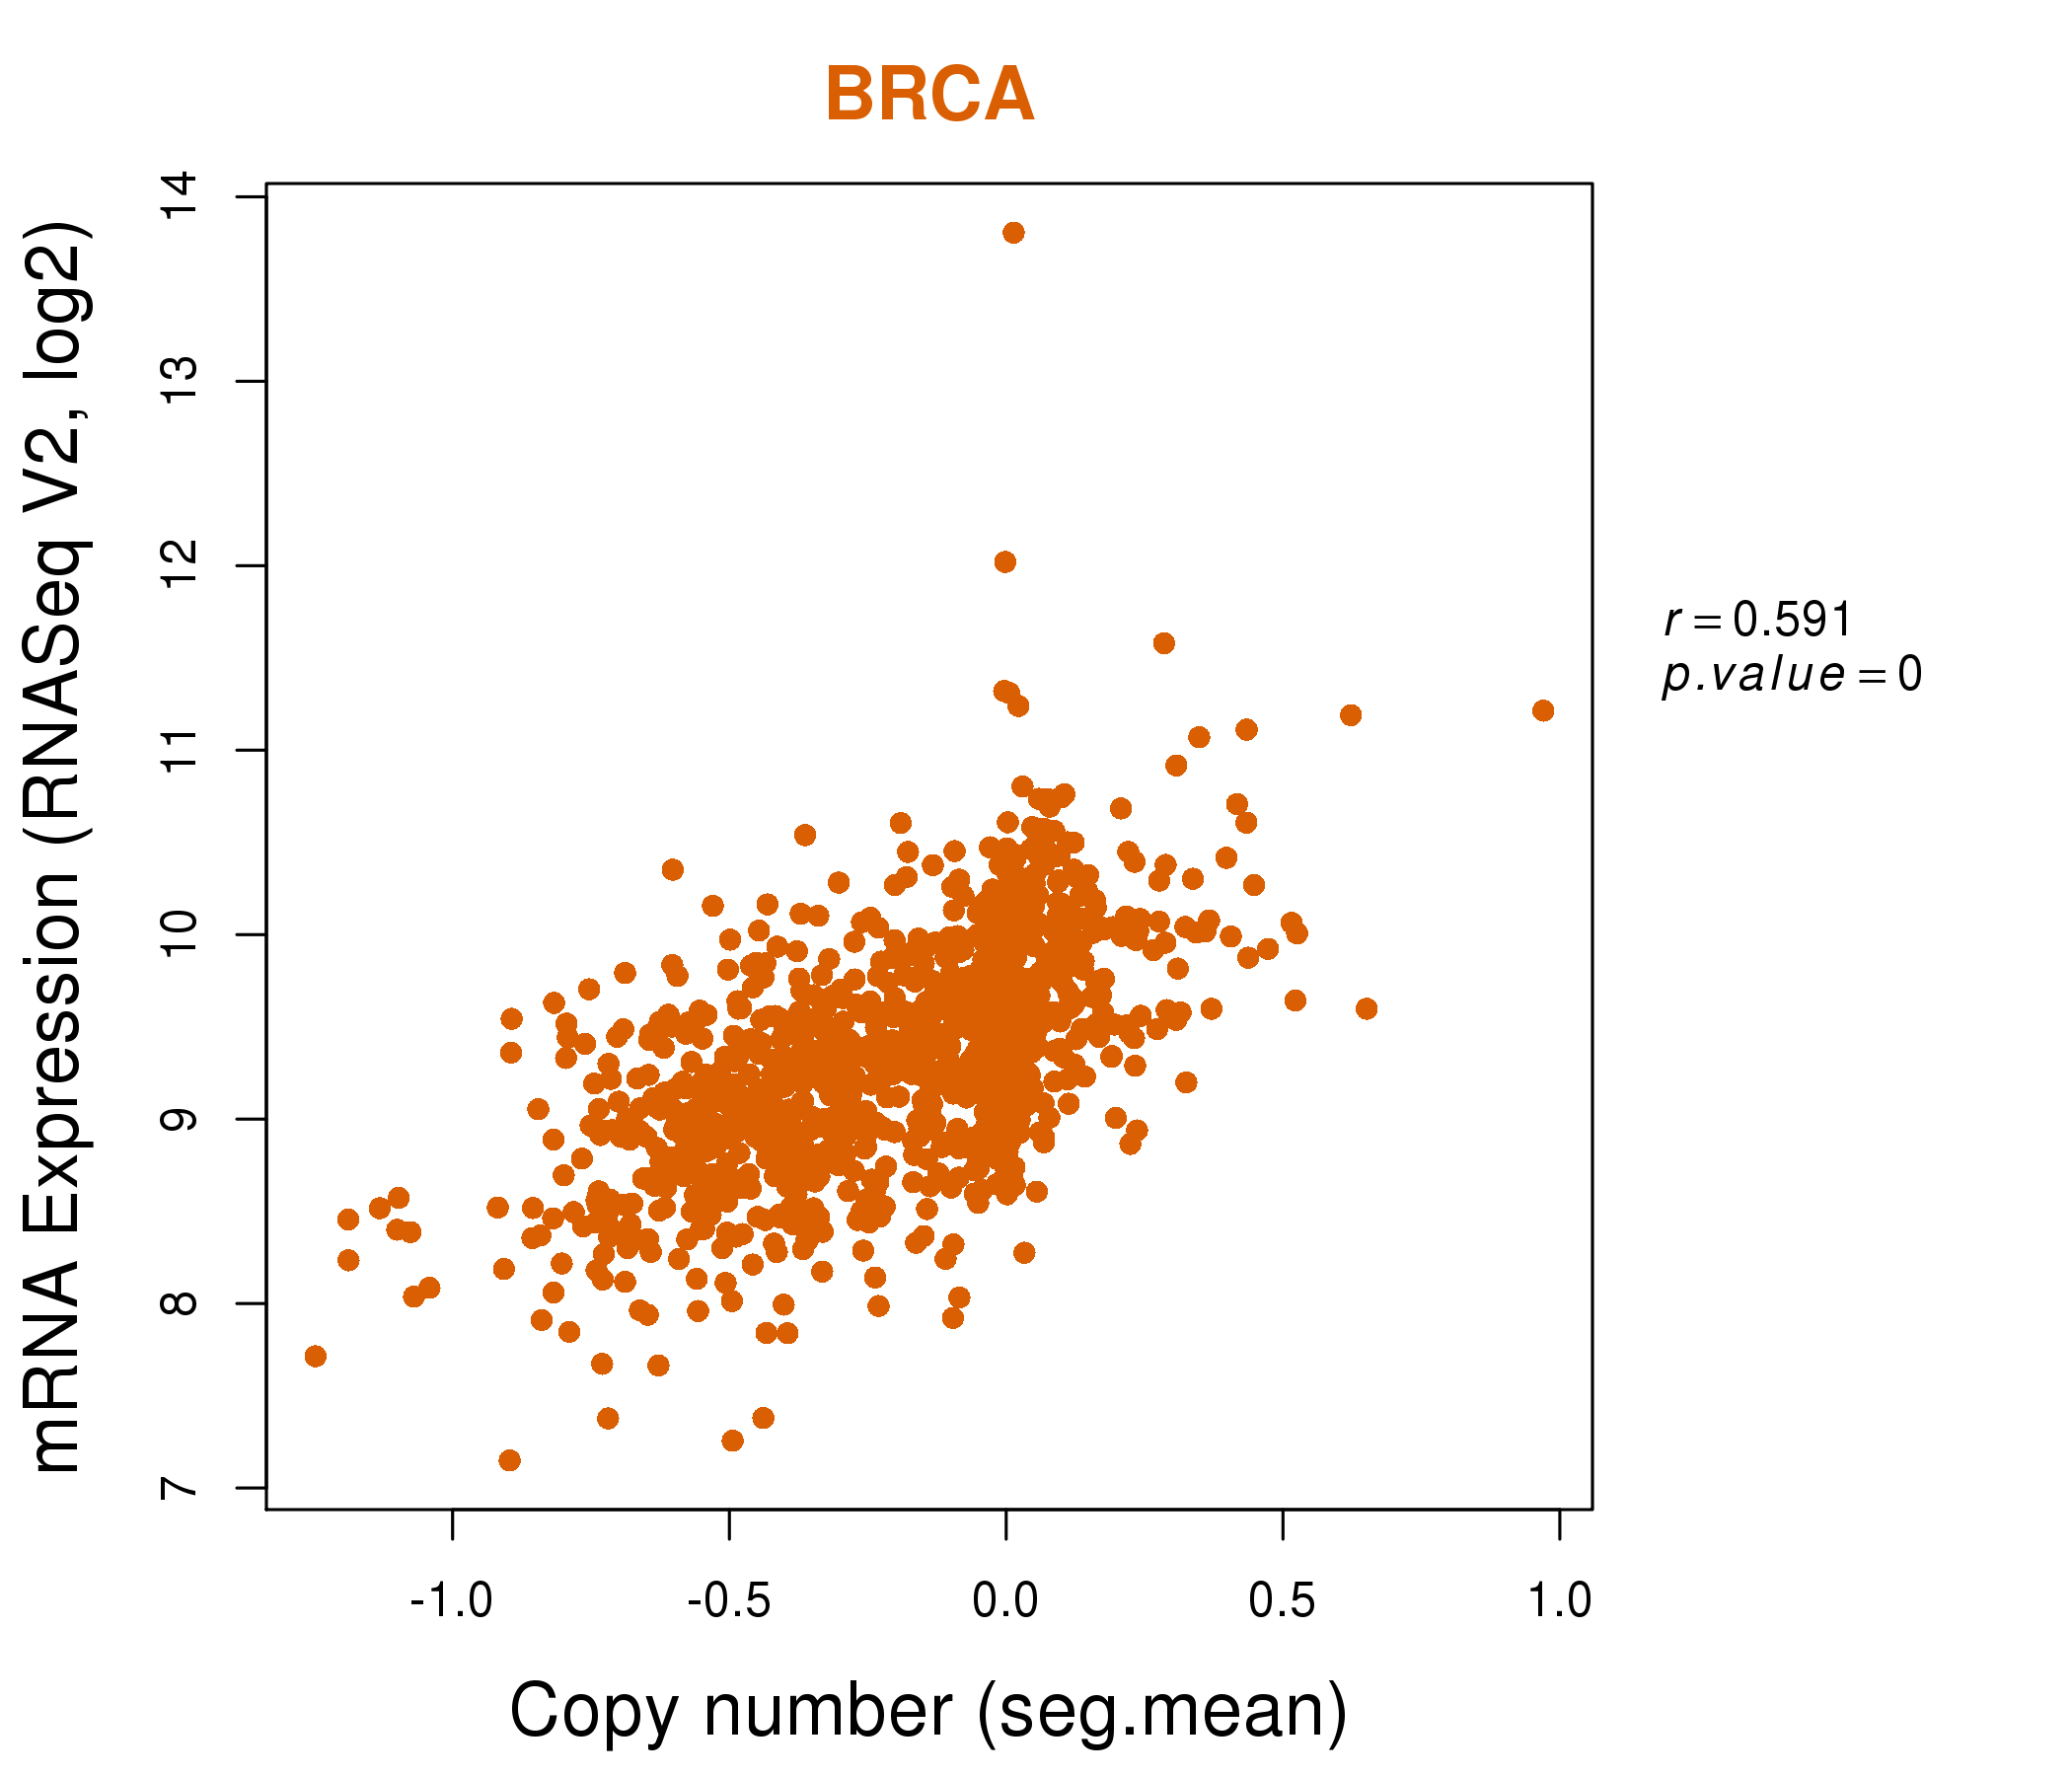
| * This plots show the correlation between CNV and gene expression. |
: Open all plots for all cancer types
 |
|
 |
|

| Top |
| Gene-Gene Network Information |
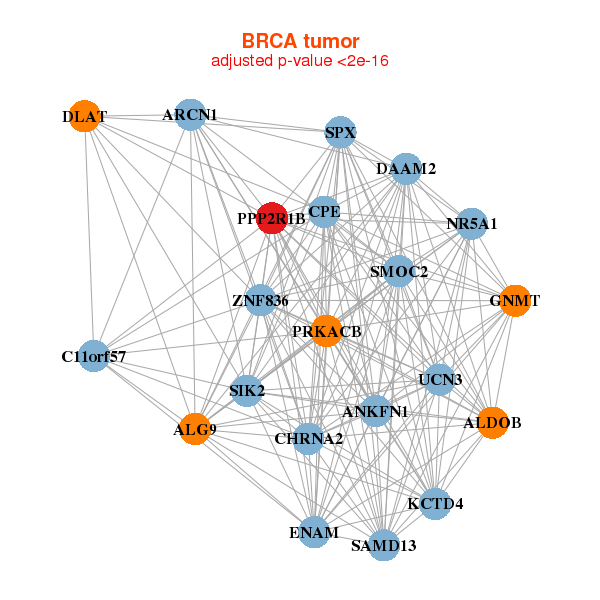
| * Co-Expression network figures were drawn using R package igraph. Only the top 20 genes with the highest correlations were shown. Red circle: input gene, orange circle: cell metabolism gene, sky circle: other gene |
: Open all plots for all cancer types
 |
|
| ALDOB,ALG9,ANKFN1,ARCN1,C11orf57,SPX,CHRNA2, CPE,DAAM2,DLAT,ENAM,GNMT,KCTD4,NR5A1, PPP2R1B,PRKACB,SAMD13,SIK2,SMOC2,UCN3,ZNF836 | APOL6,CLMP,ASPA,BTD,DMGDH,DOCK11,EHBP1, FERMT2,GLYAT,HRASLS5,LAMA4,LOC339524,MMD,MRAS, PALMD,PPP2R1B,SAR1A,SEPT11,SORBS1,TSPAN3,VKORC1L1 |
 |
|
| AASDHPPT,ALG9,C11orf54,C11orf57,CHEK1,CUL5,DLAT, EED,FAM76B,MPZL2,NPAT,NUP160,PPP2R1B,PPP6R3, SC5D,SDHD,THUMPD3,TMEM135,UBE4A,USP28,ZW10 | ACTR2,AP1G1,CDH17,CEBPG,CMAS,CORO2A,EPCAM, F11R,GPD2,KIF16B,LIMA1,MYO6,NIPA2,PDCD6IP, PPP2R1B,RAB14,RBM47,RNF6,PTBP3,VDAC1,YWHAB |

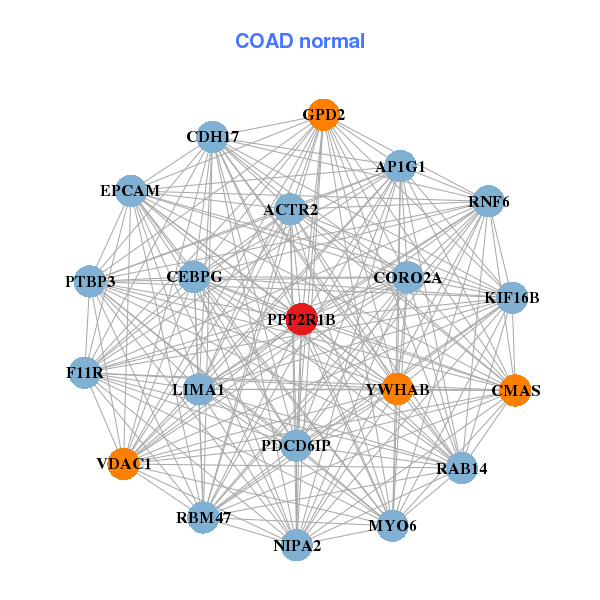
| * Co-Expression network figures were drawn using R package igraph. Only the top 20 genes with the highest correlations were shown. Red circle: input gene, orange circle: cell metabolism gene, sky circle: other gene |
: Open all plots for all cancer types
| Top |
: Open all interacting genes' information including KEGG pathway for all interacting genes from DAVID
| Top |
| Pharmacological Information for PPP2R1B |
| There's no related Drug. |
| Top |
| Cross referenced IDs for PPP2R1B |
| * We obtained these cross-references from Uniprot database. It covers 150 different DBs, 18 categories. http://www.uniprot.org/help/cross_references_section |
: Open all cross reference information
|
Copyright © 2016-Present - The Univsersity of Texas Health Science Center at Houston @ |