|
||||||||||||||||||||||||||||||||||||||||||||||||||||||||||||||||||||||||||||||||||||||||||||||||||||||||||||||||||||||||||||||||||||||||||||||||||||||||||||||||||||||||||||||||||||||||||||||||||||||||||||||||||||||||||||||||||||||||||||||||||||||||||||||||||||||||||||||||||||||||||||||||||||||||||||||||||||||||||
| |
| Phenotypic Information (metabolism pathway, cancer, disease, phenome) |
| |
| |
| Gene-Gene Network Information: Co-Expression Network, Interacting Genes & KEGG |
| |
|


| Gene Summary for ADI1 |
| Basic gene info. | Gene symbol | ADI1 |
| Gene name | acireductone dioxygenase 1 | |
| Synonyms | APL1|ARD|Fe-ARD|MTCBP1|Ni-ARD|SIPL|mtnD | |
| Cytomap | UCSC genome browser: 2p25.3 | |
| Genomic location | chr2 :3501689-3523350 | |
| Type of gene | protein-coding | |
| RefGenes | NM_018269.3, | |
| Ensembl id | ENSG00000182551 | |
| Description | 1,2-dihydroxy-3-keto-5-methylthiopentene dioxygenaseARDMT1-MMP cytoplasmic tail-binding protein-1MTCBP-1acireductone dioxygenase (Fe(2+)-requiring)acireductone dioxygenase (Ni(2+)-requiring)fe-ARDmembrane-type 1 matrix metalloproteinase cytoplasmic | |
| Modification date | 20141207 | |
| dbXrefs | MIM : 613400 | |
| HGNC : HGNC | ||
| Ensembl : ENSG00000182551 | ||
| HPRD : 17607 | ||
| Vega : OTTHUMG00000112441 | ||
| Protein | UniProt: go to UniProt's Cross Reference DB Table | |
| Expression | CleanEX: HS_ADI1 | |
| BioGPS: 55256 | ||
| Gene Expression Atlas: ENSG00000182551 | ||
| The Human Protein Atlas: ENSG00000182551 | ||
| Pathway | NCI Pathway Interaction Database: ADI1 | |
| KEGG: ADI1 | ||
| REACTOME: ADI1 | ||
| ConsensusPathDB | ||
| Pathway Commons: ADI1 | ||
| Metabolism | MetaCyc: ADI1 | |
| HUMANCyc: ADI1 | ||
| Regulation | Ensembl's Regulation: ENSG00000182551 | |
| miRBase: chr2 :3,501,689-3,523,350 | ||
| TargetScan: NM_018269 | ||
| cisRED: ENSG00000182551 | ||
| Context | iHOP: ADI1 | |
| cancer metabolism search in PubMed: ADI1 | ||
| UCL Cancer Institute: ADI1 | ||
| Assigned class in ccmGDB | C | |
| Top |
| Phenotypic Information for ADI1(metabolism pathway, cancer, disease, phenome) |
| Cancer | CGAP: ADI1 |
| Familial Cancer Database: ADI1 | |
| * This gene is included in those cancer gene databases. |
|
|
|
|
|
| . | ||||||||||||||||||||||||||||||||||||||||||||||||||||||||||||||||||||||||||||||||||||||||||||||||||||||||||||||||||||||||||||||||||||||||||||||||||||||||||||||||||||||||||||||||||||||||||||||||||||||||||||||||||||||||||||||||||||||||||||||||||||||||||||||||||||||||||||||||||||||||||||||||||||||||||||||||||||
Oncogene 1 | Significant driver gene in | |||||||||||||||||||||||||||||||||||||||||||||||||||||||||||||||||||||||||||||||||||||||||||||||||||||||||||||||||||||||||||||||||||||||||||||||||||||||||||||||||||||||||||||||||||||||||||||||||||||||||||||||||||||||||||||||||||||||||||||||||||||||||||||||||||||||||||||||||||||||||||||||||||||||||||||||||||||||||
| cf) number; DB name 1 Oncogene; http://nar.oxfordjournals.org/content/35/suppl_1/D721.long, 2 Tumor Suppressor gene; https://bioinfo.uth.edu/TSGene/, 3 Cancer Gene Census; http://www.nature.com/nrc/journal/v4/n3/abs/nrc1299.html, 4 CancerGenes; http://nar.oxfordjournals.org/content/35/suppl_1/D721.long, 5 Network of Cancer Gene; http://ncg.kcl.ac.uk/index.php, 1Therapeutic Vulnerabilities in Cancer; http://cbio.mskcc.org/cancergenomics/statius/ |
| KEGG_CYSTEINE_AND_METHIONINE_METABOLISM REACTOME_SULFUR_AMINO_ACID_METABOLISM REACTOME_METABOLISM_OF_AMINO_ACIDS_AND_DERIVATIVES REACTOME_METABOLISM_OF_POLYAMINES | |
| OMIM | |
| Orphanet | |
| Disease | KEGG Disease: ADI1 |
| MedGen: ADI1 (Human Medical Genetics with Condition) | |
| ClinVar: ADI1 | |
| Phenotype | MGI: ADI1 (International Mouse Phenotyping Consortium) |
| PhenomicDB: ADI1 | |
| Mutations for ADI1 |
| * Under tables are showing count per each tissue to give us broad intuition about tissue specific mutation patterns.You can go to the detailed page for each mutation database's web site. |
| - Statistics for Tissue and Mutation type | Top |
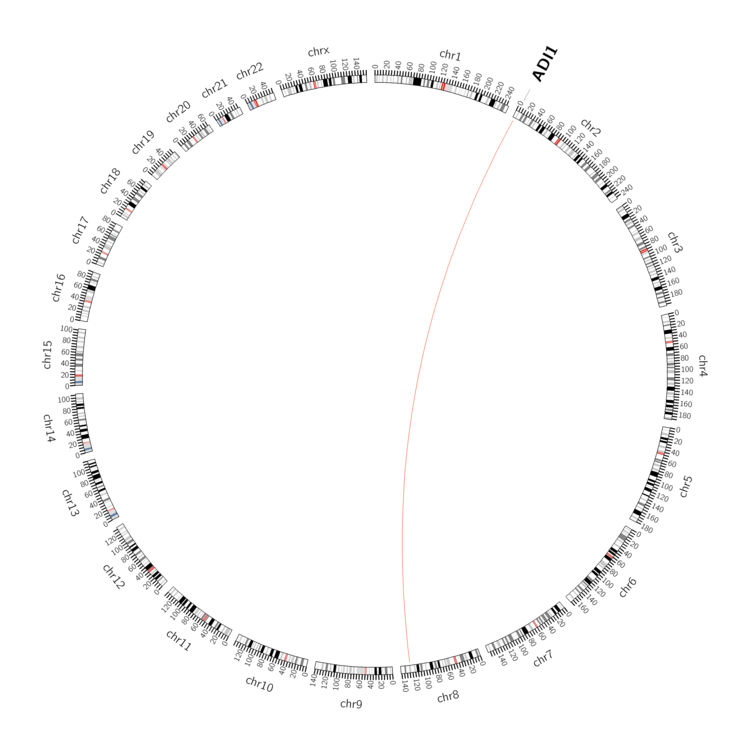 |
| - For Inter-chromosomal Variations |
| * Inter-chromosomal variantions includes 'interchromosomal amplicon to amplicon', 'interchromosomal amplicon to non-amplified dna', 'interchromosomal insertion', 'Interchromosomal unknown type'. |
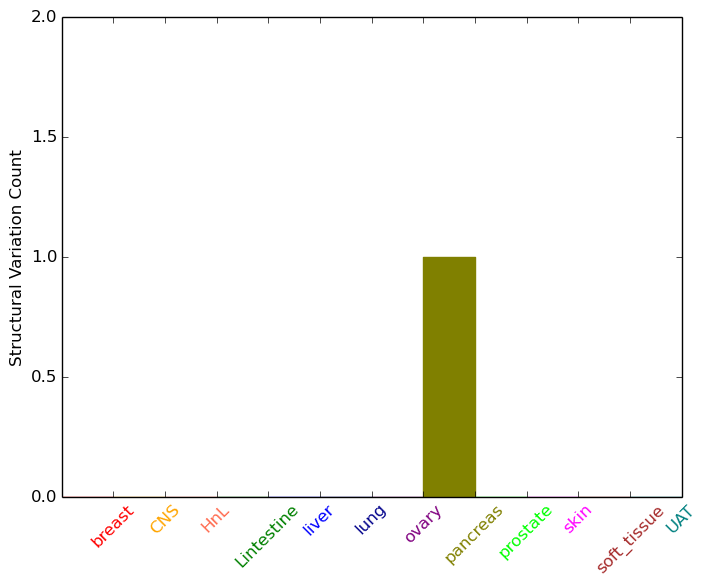 |
| - For Intra-chromosomal Variations |
| There's no intra-chromosomal structural variation. |
| Sample | Symbol_a | Chr_a | Start_a | End_a | Symbol_b | Chr_b | Start_b | End_b |
| pancreas | ADI1 | chr2 | 3521582 | 3521602 | chr8 | 128759951 | 128759971 |
| cf) Tissue number; Tissue name (1;Breast, 2;Central_nervous_system, 3;Haematopoietic_and_lymphoid_tissue, 4;Large_intestine, 5;Liver, 6;Lung, 7;Ovary, 8;Pancreas, 9;Prostate, 10;Skin, 11;Soft_tissue, 12;Upper_aerodigestive_tract) |
| * From mRNA Sanger sequences, Chitars2.0 arranged chimeric transcripts. This table shows ADI1 related fusion information. |
| ID | Head Gene | Tail Gene | Accession | Gene_a | qStart_a | qEnd_a | Chromosome_a | tStart_a | tEnd_a | Gene_a | qStart_a | qEnd_a | Chromosome_a | tStart_a | tEnd_a |
| BM353985 | ADI1 | 12 | 72 | 2 | 3502395 | 3502455 | ADI1 | 70 | 181 | 2 | 3502303 | 3502414 | |
| AA351447 | ZNF626 | 1 | 90 | 19 | 20844250 | 20844339 | ADI1 | 90 | 406 | 2 | 3504625 | 3518634 | |
| BF095880 | ADI1 | 1 | 432 | 2 | 3502501 | 3504659 | TUBB6 | 429 | 487 | 18 | 12326076 | 12326134 | |
| CK904967 | ADI1 | 1 | 189 | 2 | 3502226 | 3502414 | ADI1 | 187 | 247 | 2 | 3502395 | 3502455 | |
| CV569358 | ADI1 | 44 | 478 | 2 | 3502350 | 3502784 | ADI1 | 472 | 588 | 2 | 3502224 | 3502339 | |
| BM456873 | ADI1 | 2 | 77 | 2 | 3523204 | 3523279 | TRIM14 | 70 | 877 | 9 | 100848713 | 100849516 | |
| Top |
| Mutation type/ Tissue ID | brca | cns | cerv | endome | haematopo | kidn | Lintest | liver | lung | ns | ovary | pancre | prost | skin | stoma | thyro | urina | |||
| Total # sample | 1 | |||||||||||||||||||
| GAIN (# sample) | 1 | |||||||||||||||||||
| LOSS (# sample) |
| cf) Tissue ID; Tissue type (1; Breast, 2; Central_nervous_system, 3; Cervix, 4; Endometrium, 5; Haematopoietic_and_lymphoid_tissue, 6; Kidney, 7; Large_intestine, 8; Liver, 9; Lung, 10; NS, 11; Ovary, 12; Pancreas, 13; Prostate, 14; Skin, 15; Stomach, 16; Thyroid, 17; Urinary_tract) |
| Top |
|
 |
| Top |
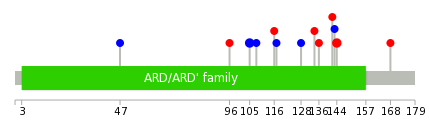
| Stat. for Non-Synonymous SNVs (# total SNVs=6) | (# total SNVs=11) |
 |  |
(# total SNVs=0) | (# total SNVs=0) |
| Top |
| * When you move the cursor on each content, you can see more deailed mutation information on the Tooltip. Those are primary_site,primary_histology,mutation(aa),pubmedID. |
| GRCh37 position | Mutation(aa) | Unique sampleID count |
| chr2:3504687-3504687 | p.D106D | 3 |
| chr2:3502845-3502845 | p.T143T | 3 |
| chr2:3517712-3517712 | p.L52L | 2 |
| chr2:3502844-3502844 | p.K144E | 2 |
| chr2:3504598-3504598 | p.T136M | 1 |
| chr2:3517727-3517727 | p.E47E | 1 |
| chr2:3504605-3504605 | p.R134C | 1 |
| chr2:3504619-3504619 | p.A129V | 1 |
| chr2:3504621-3504621 | p.P128P | 1 |
| chr2:3504627-3504627 | p.T126T | 1 |
| Top |
|
 |
| Point Mutation/ Tissue ID | 1 | 2 | 3 | 4 | 5 | 6 | 7 | 8 | 9 | 10 | 11 | 12 | 13 | 14 | 15 | 16 | 17 | 18 | 19 | 20 |
| # sample | 3 | 1 | 1 | 3 | 1 | 3 | 1 | 1 | ||||||||||||
| # mutation | 3 | 1 | 1 | 3 | 1 | 3 | 1 | 1 | ||||||||||||
| nonsynonymous SNV | 2 | 1 | 1 | 1 | 2 | 1 | ||||||||||||||
| synonymous SNV | 1 | 1 | 2 | 1 | 1 |
| cf) Tissue ID; Tissue type (1; BLCA[Bladder Urothelial Carcinoma], 2; BRCA[Breast invasive carcinoma], 3; CESC[Cervical squamous cell carcinoma and endocervical adenocarcinoma], 4; COAD[Colon adenocarcinoma], 5; GBM[Glioblastoma multiforme], 6; Glioma Low Grade, 7; HNSC[Head and Neck squamous cell carcinoma], 8; KICH[Kidney Chromophobe], 9; KIRC[Kidney renal clear cell carcinoma], 10; KIRP[Kidney renal papillary cell carcinoma], 11; LAML[Acute Myeloid Leukemia], 12; LUAD[Lung adenocarcinoma], 13; LUSC[Lung squamous cell carcinoma], 14; OV[Ovarian serous cystadenocarcinoma ], 15; PAAD[Pancreatic adenocarcinoma], 16; PRAD[Prostate adenocarcinoma], 17; SKCM[Skin Cutaneous Melanoma], 18:STAD[Stomach adenocarcinoma], 19:THCA[Thyroid carcinoma], 20:UCEC[Uterine Corpus Endometrial Carcinoma]) |
| Top |
| * We represented just top 10 SNVs. When you move the cursor on each content, you can see more deailed mutation information on the Tooltip. Those are primary_site, primary_histology, mutation(aa), pubmedID. |
| Genomic Position | Mutation(aa) | Unique sampleID count |
| chr2:3504690 | p.F105F | 2 |
| chr2:3502844 | p.K144E | 2 |
| chr2:3504598 | p.P128P | 1 |
| chr2:3504605 | p.I117I | 1 |
| chr2:3504621 | p.R116Q | 1 |
| chr2:3504654 | p.R108R | 1 |
| chr2:3504658 | p.R96S | 1 |
| chr2:3504681 | p.E47E | 1 |
| chr2:3502771 | p.R168L | 1 |
| chr2:3504719 | p.T143T | 1 |
| * Copy number data were extracted from TCGA using R package TCGA-Assembler. The URLs of all public data files on TCGA DCC data server were gathered on Jan-05-2015. Function ProcessCNAData in TCGA-Assembler package was used to obtain gene-level copy number value which is calculated as the average copy number of the genomic region of a gene. |
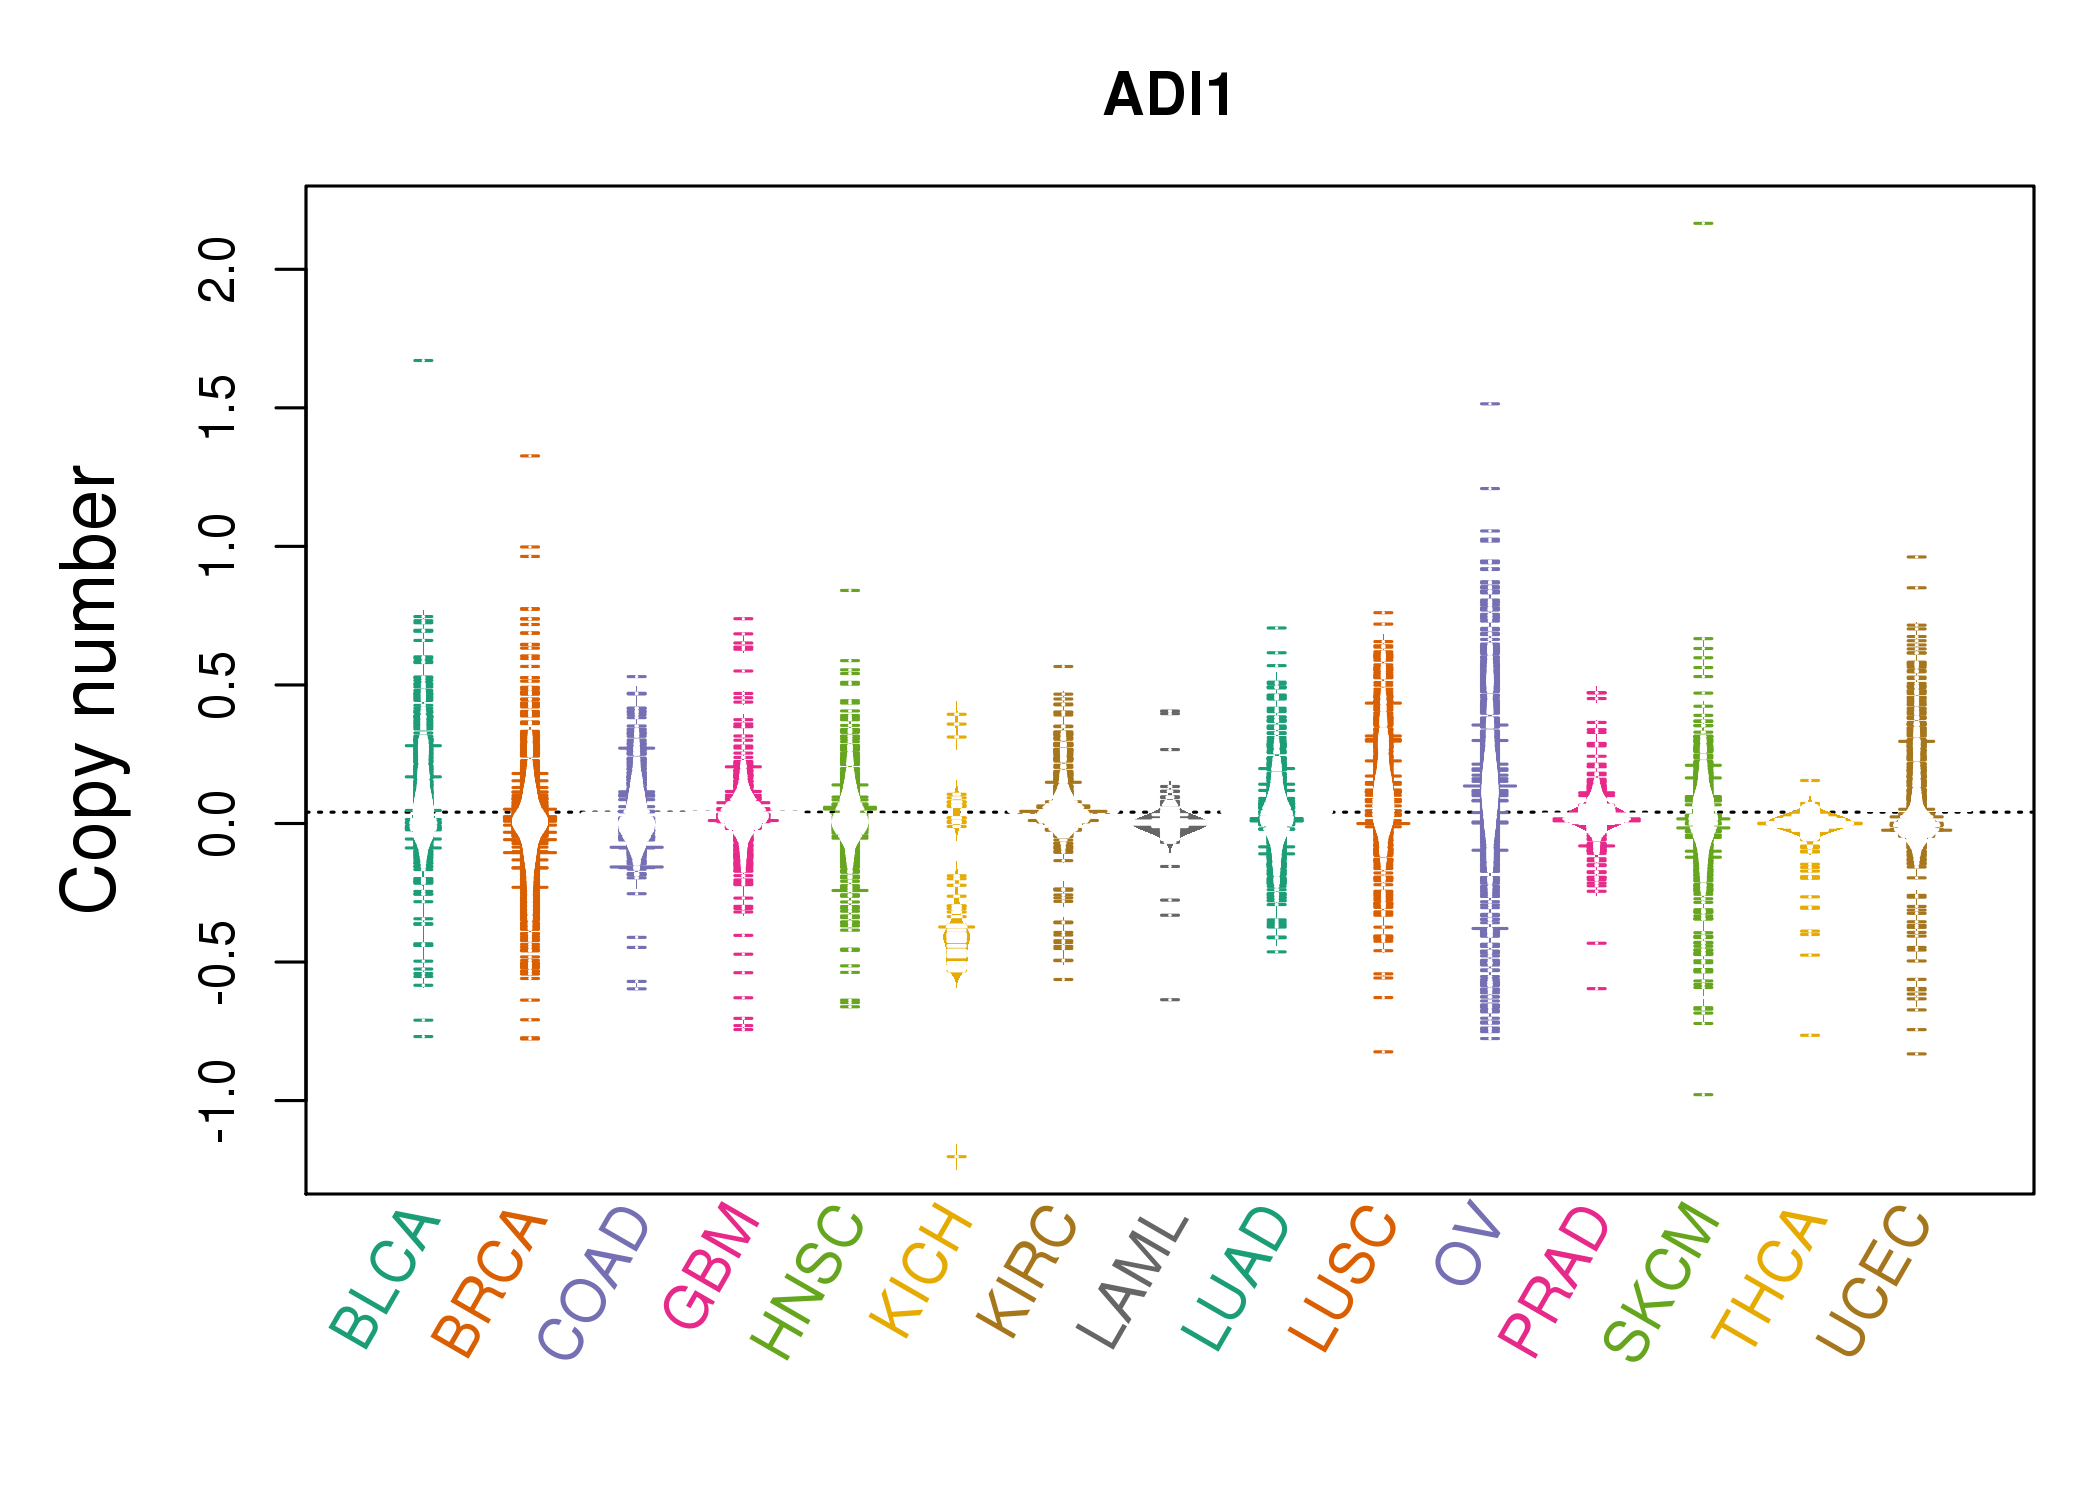 |
| cf) Tissue ID[Tissue type]: BLCA[Bladder Urothelial Carcinoma], BRCA[Breast invasive carcinoma], CESC[Cervical squamous cell carcinoma and endocervical adenocarcinoma], COAD[Colon adenocarcinoma], GBM[Glioblastoma multiforme], Glioma Low Grade, HNSC[Head and Neck squamous cell carcinoma], KICH[Kidney Chromophobe], KIRC[Kidney renal clear cell carcinoma], KIRP[Kidney renal papillary cell carcinoma], LAML[Acute Myeloid Leukemia], LUAD[Lung adenocarcinoma], LUSC[Lung squamous cell carcinoma], OV[Ovarian serous cystadenocarcinoma ], PAAD[Pancreatic adenocarcinoma], PRAD[Prostate adenocarcinoma], SKCM[Skin Cutaneous Melanoma], STAD[Stomach adenocarcinoma], THCA[Thyroid carcinoma], UCEC[Uterine Corpus Endometrial Carcinoma] |
| Top |
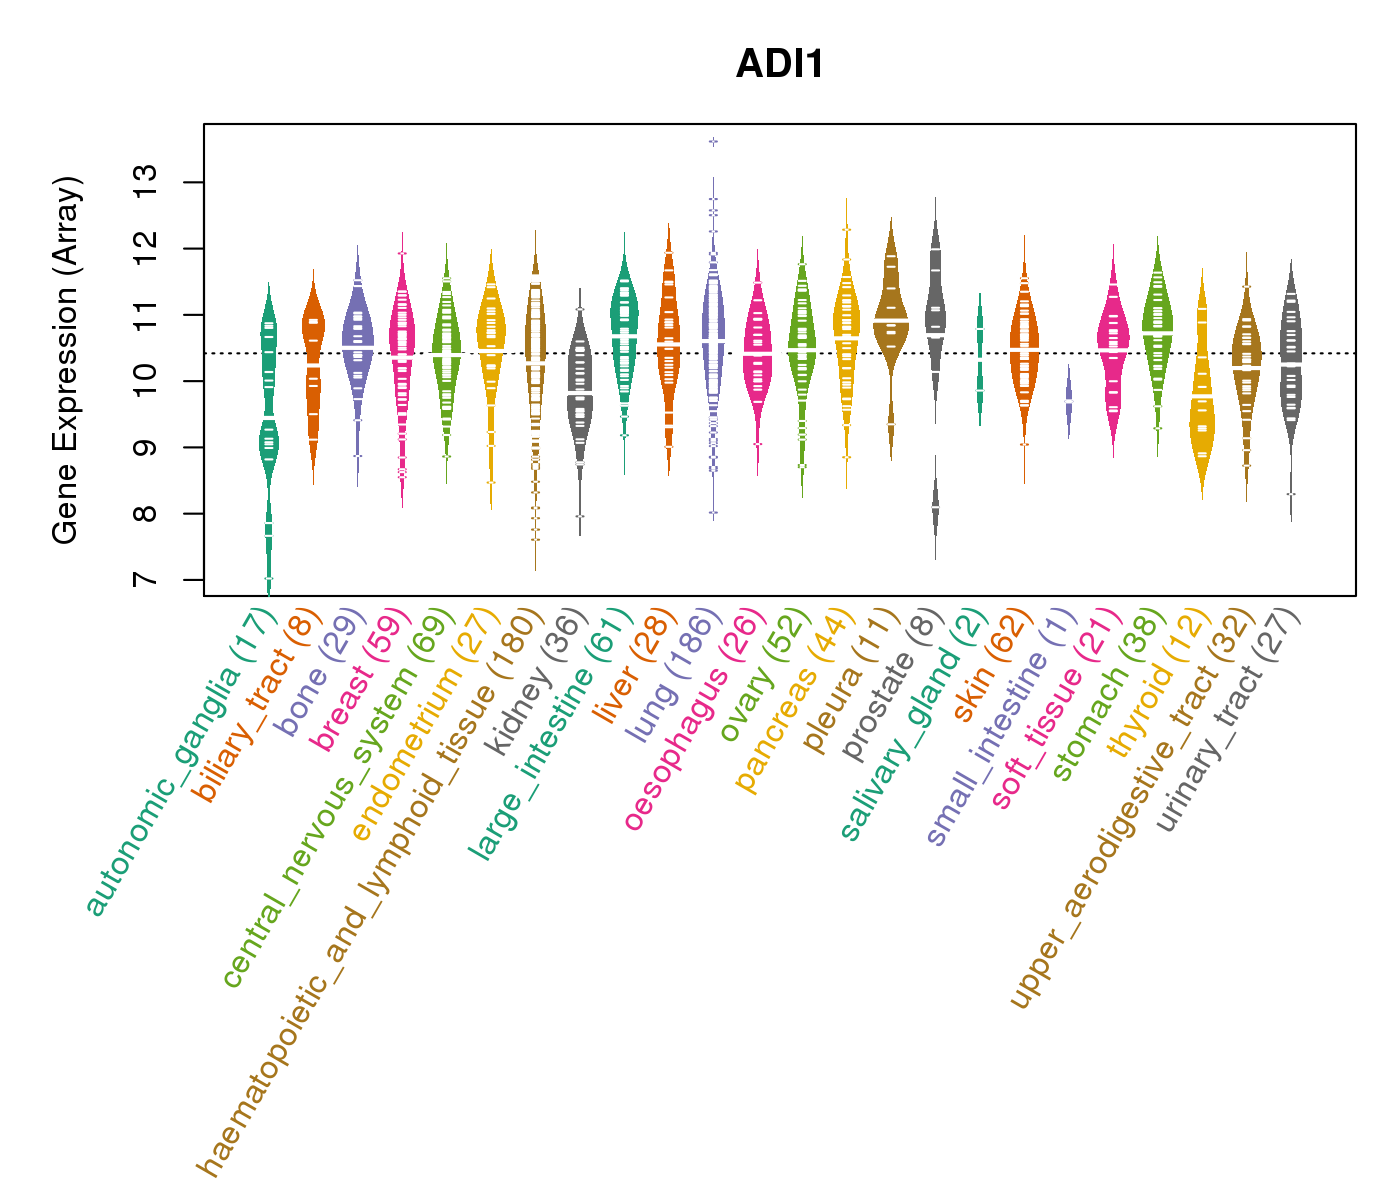
| Gene Expression for ADI1 |
| * CCLE gene expression data were extracted from CCLE_Expression_Entrez_2012-10-18.res: Gene-centric RMA-normalized mRNA expression data. |
 |
| * Normalized gene expression data of RNASeqV2 was extracted from TCGA using R package TCGA-Assembler. The URLs of all public data files on TCGA DCC data server were gathered at Jan-05-2015. Only eight cancer types have enough normal control samples for differential expression analysis. (t test, adjusted p<0.05 (using Benjamini-Hochberg FDR)) |
 |
| Top |
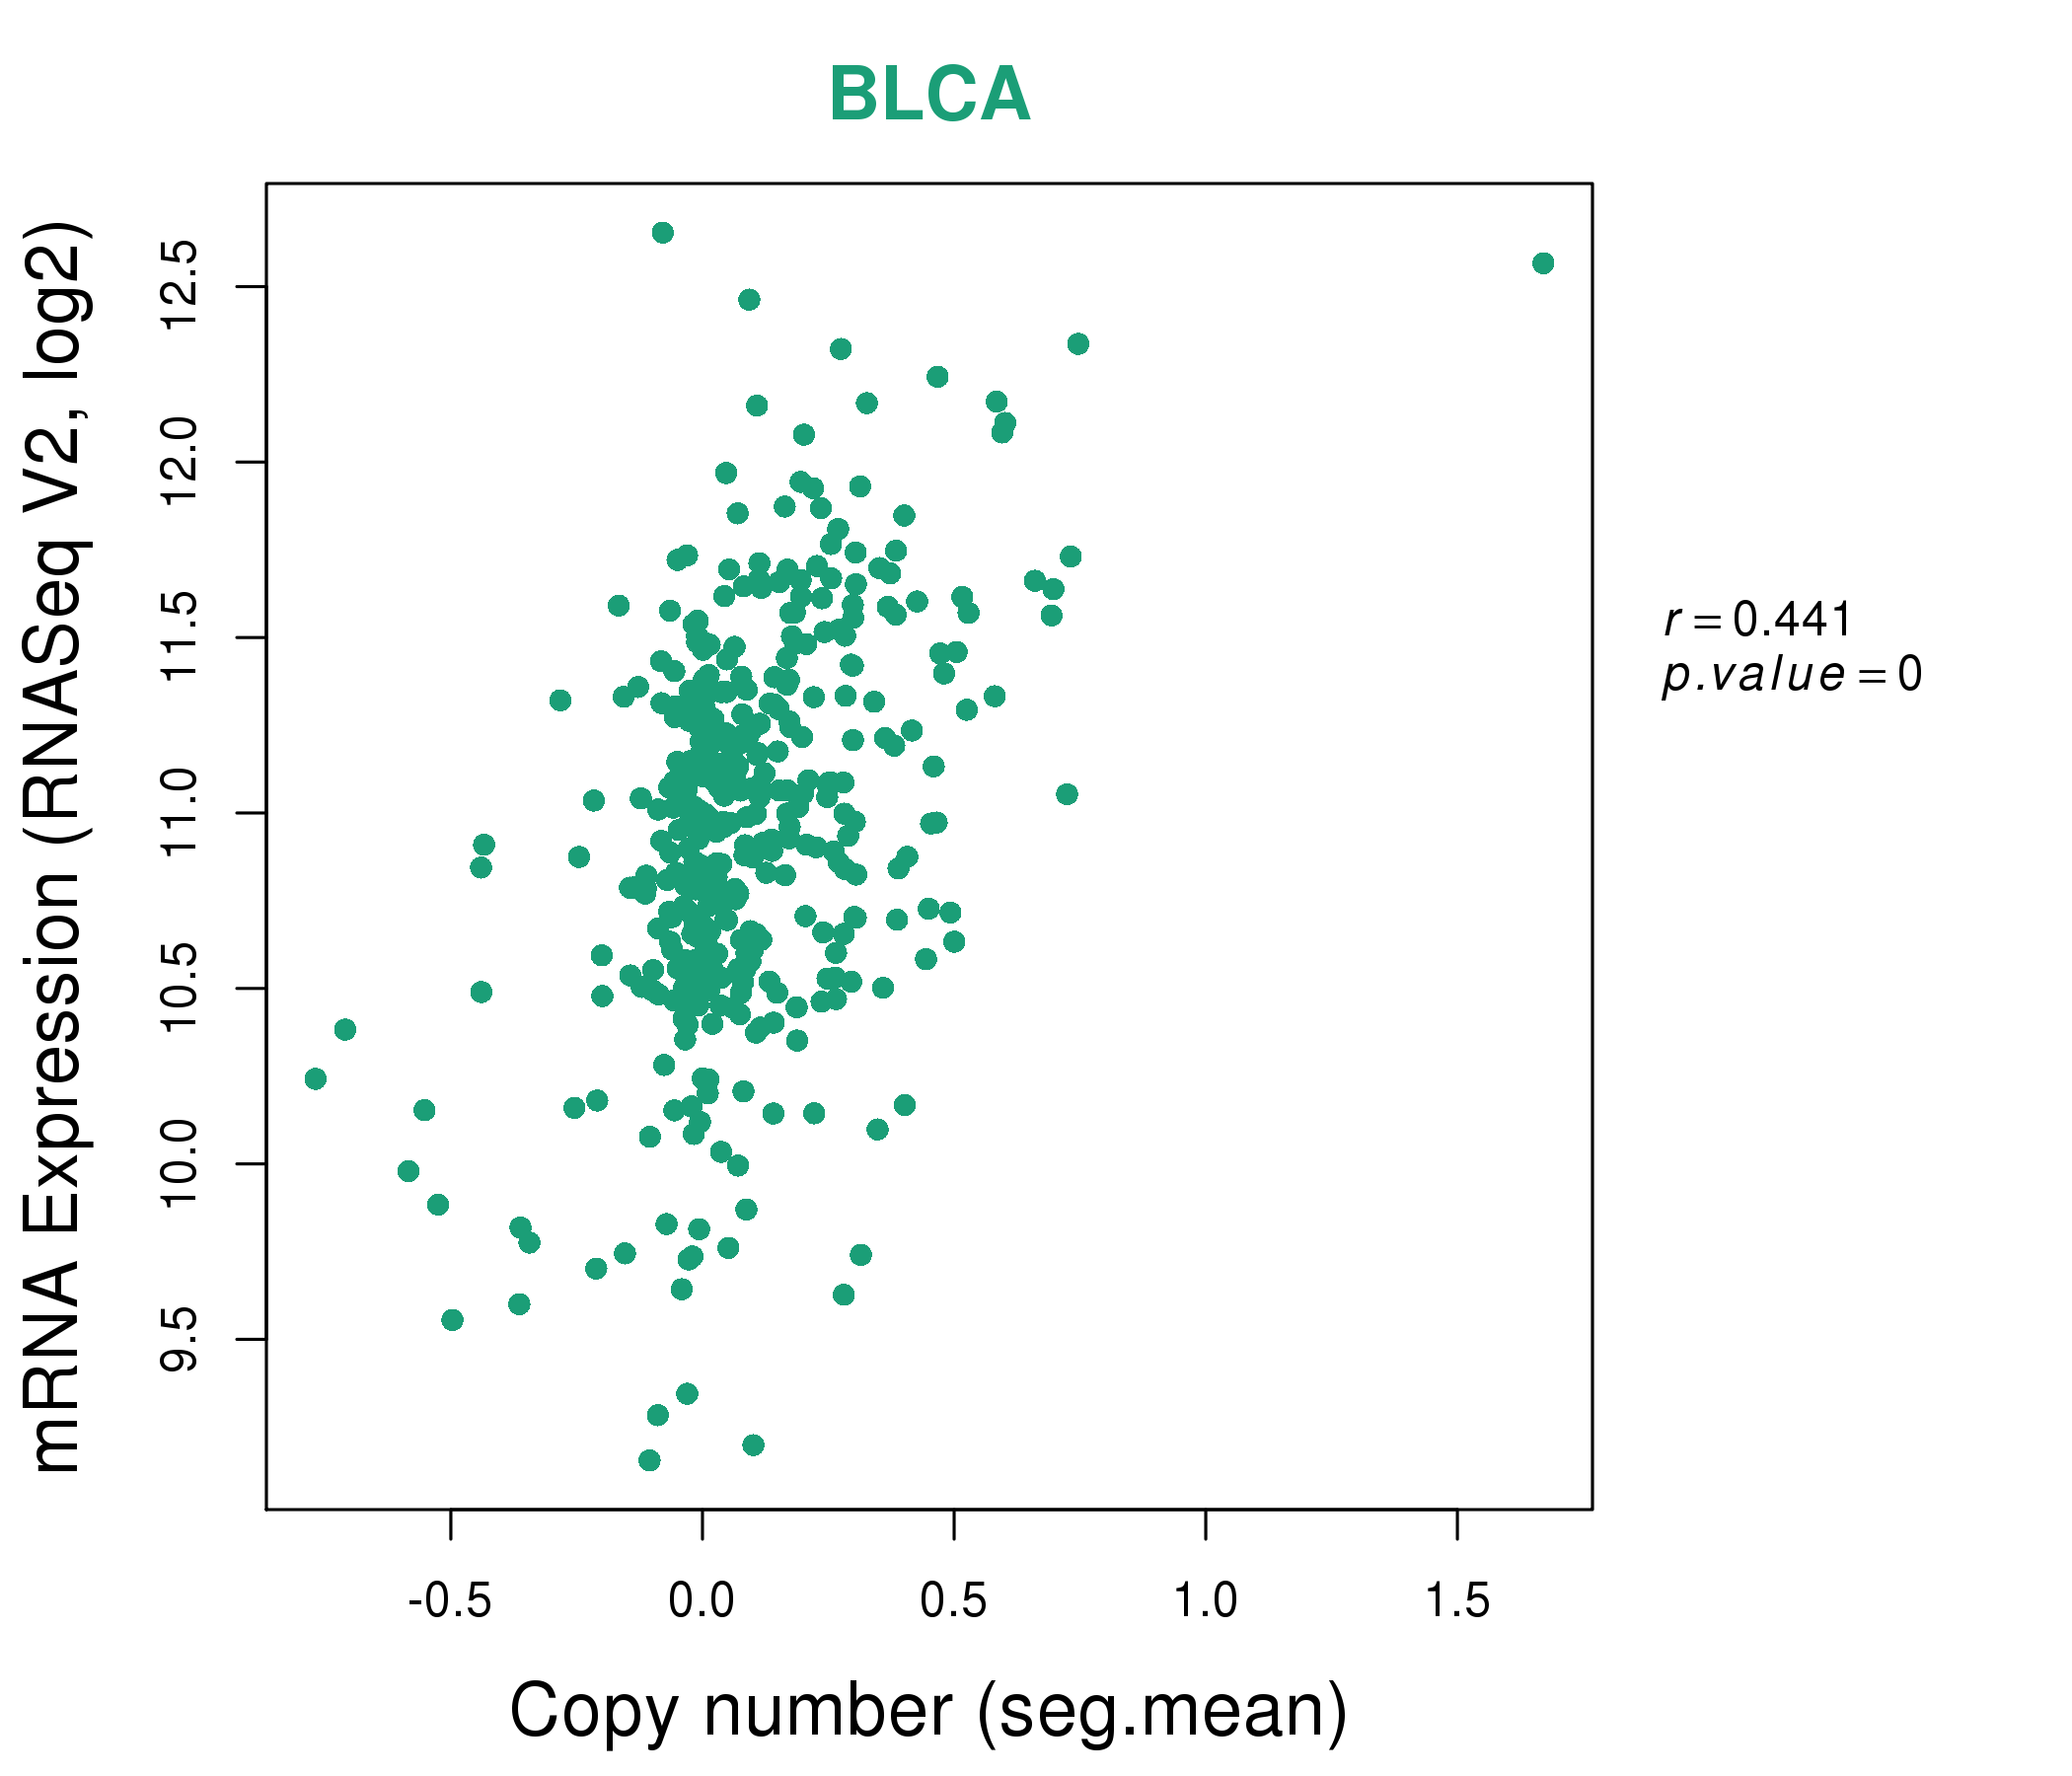
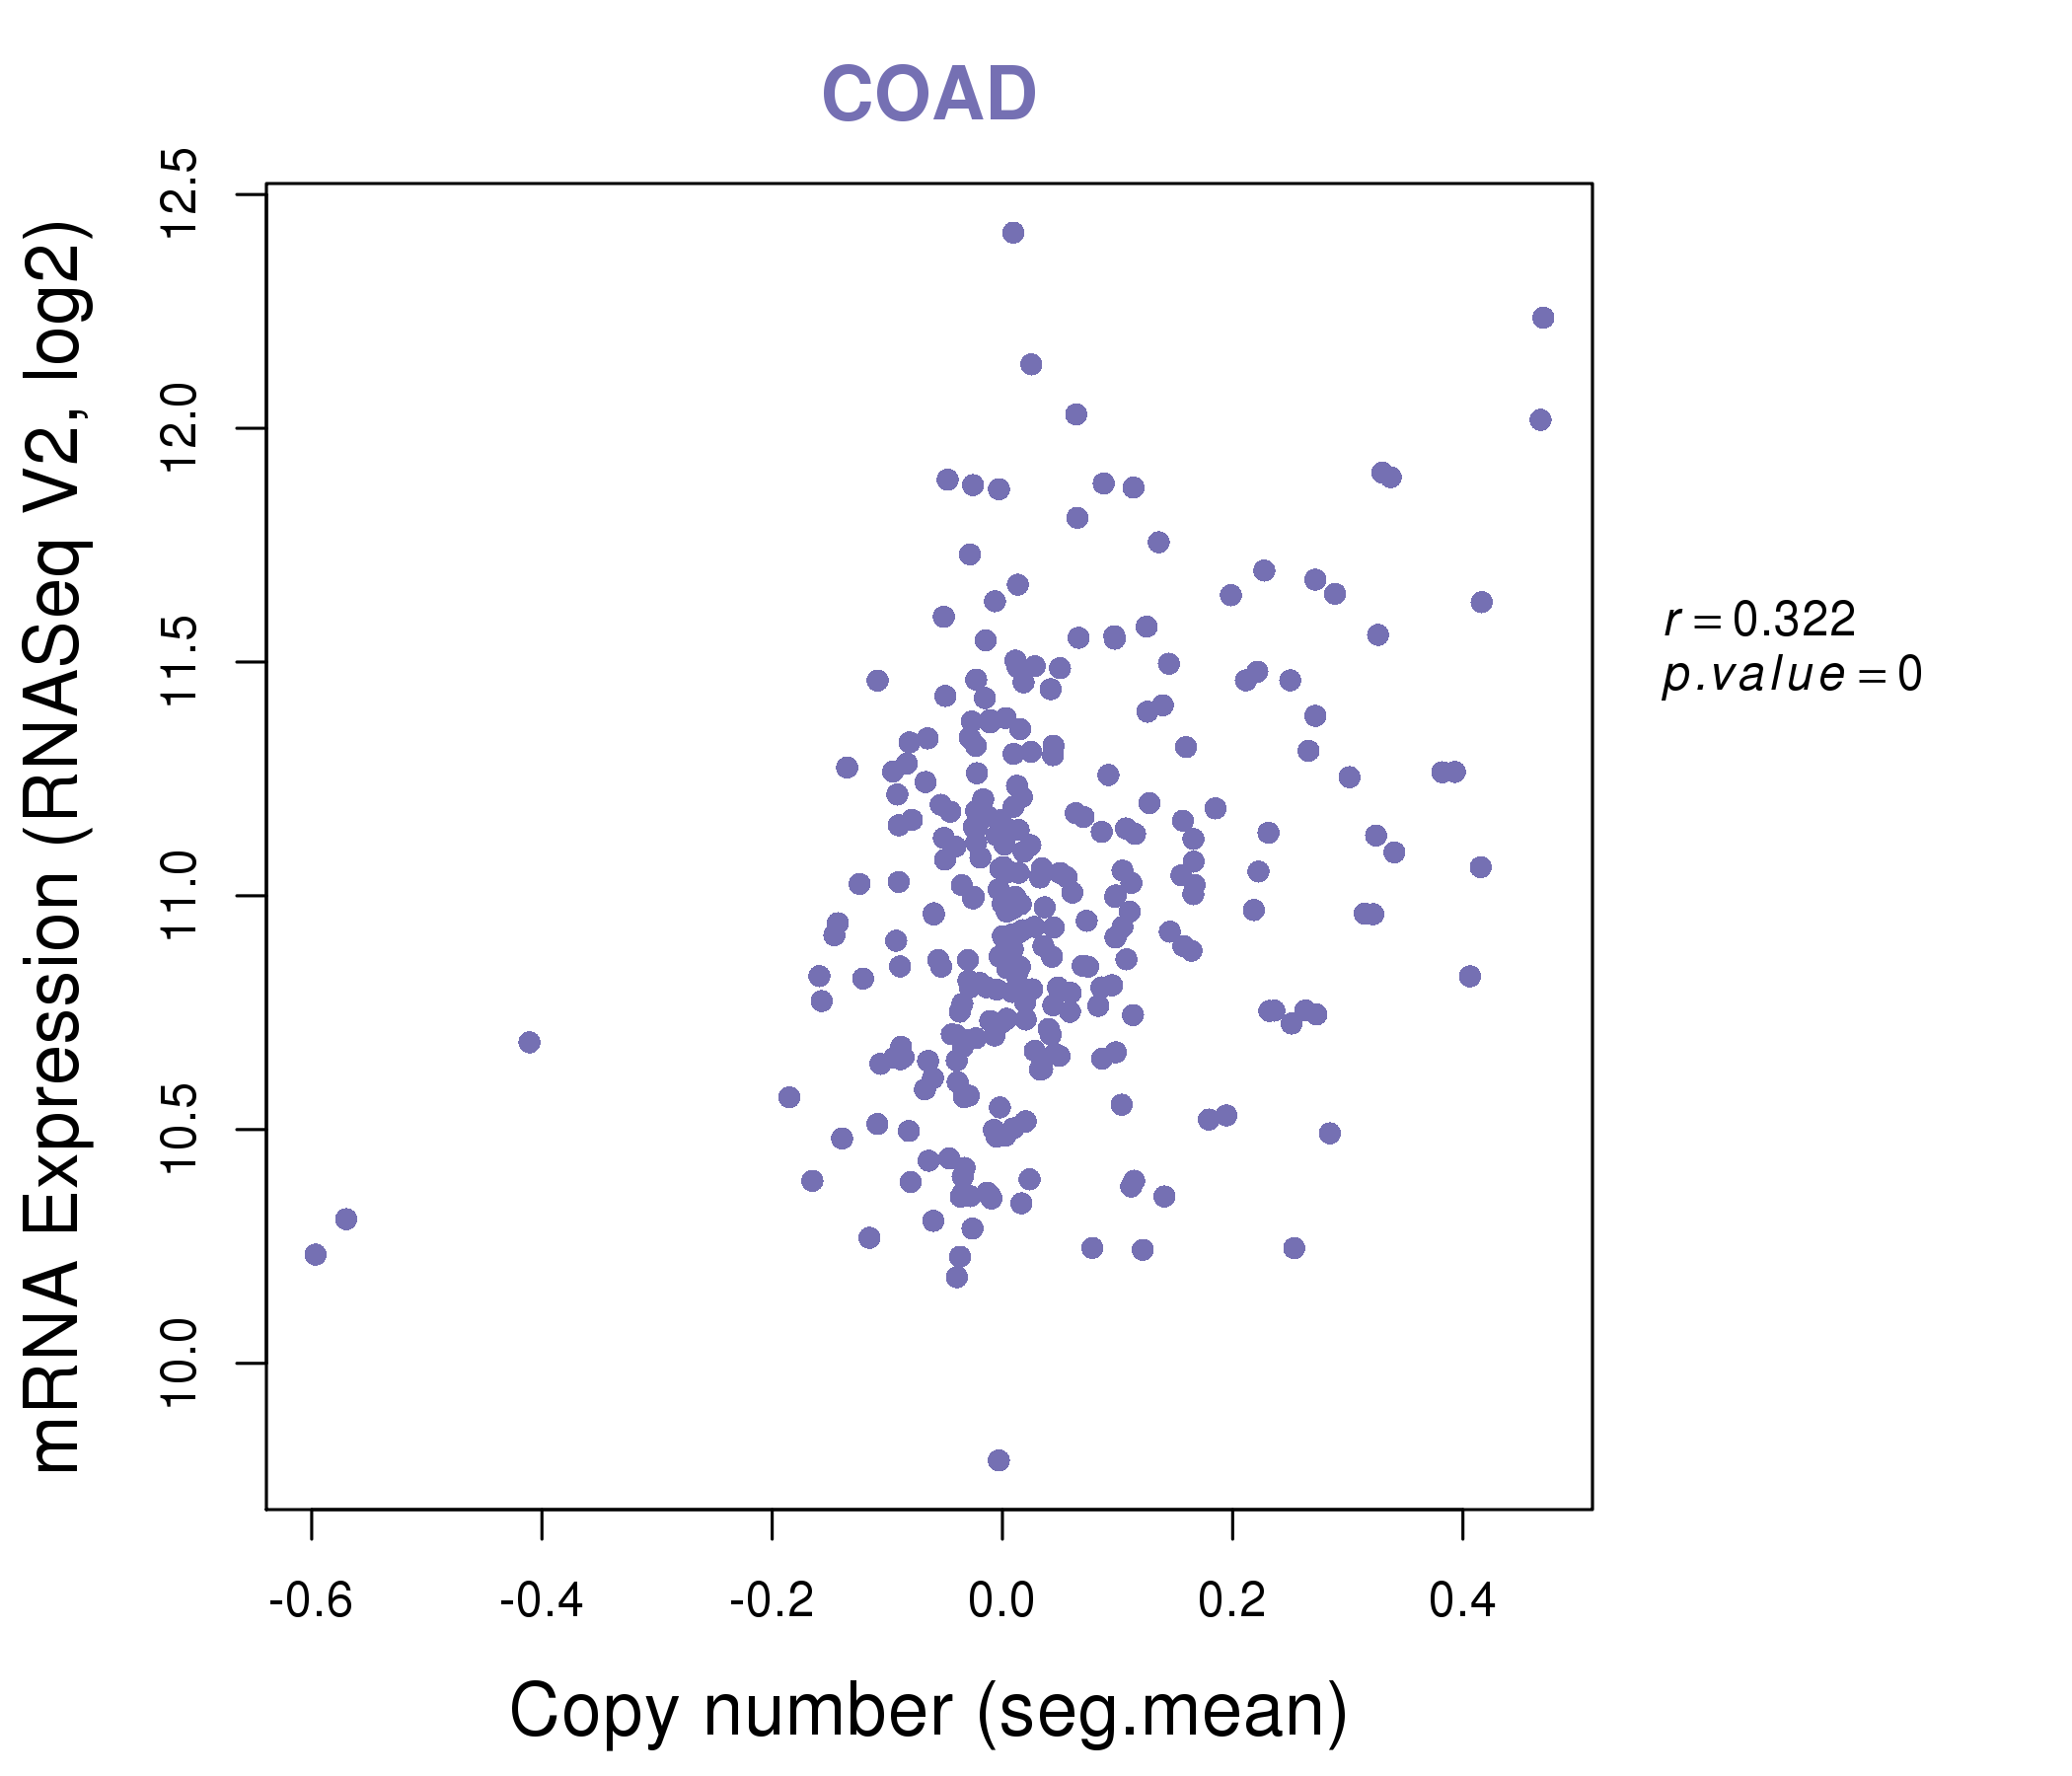
| * This plots show the correlation between CNV and gene expression. |
: Open all plots for all cancer types
 |
|
 |
|


| Top |
| Gene-Gene Network Information |
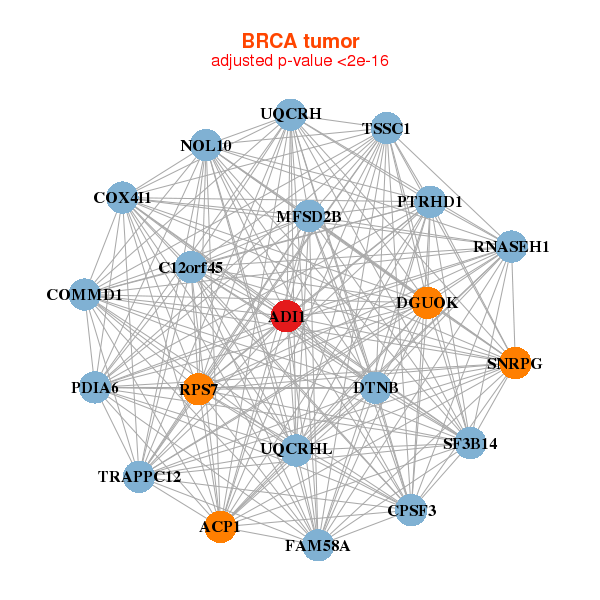
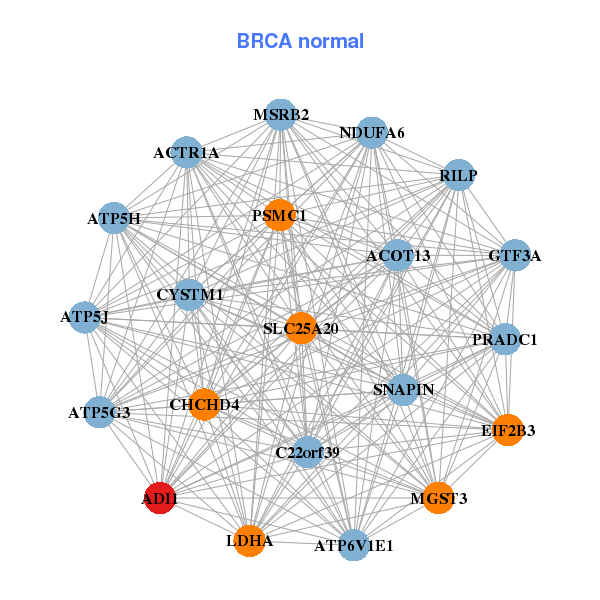
| * Co-Expression network figures were drawn using R package igraph. Only the top 20 genes with the highest correlations were shown. Red circle: input gene, orange circle: cell metabolism gene, sky circle: other gene |
: Open all plots for all cancer types
 |
|
| ACP1,ADI1,C12orf45,PTRHD1,COMMD1,COX4I1,CPSF3, DGUOK,DTNB,FAM58A,MFSD2B,NOL10,PDIA6,RNASEH1, RPS7,SF3B14,SNRPG,TSSC1,TRAPPC12,UQCRH,UQCRHL | ACOT13,ACTR1A,ADI1,ATP5G3,ATP5H,ATP5J,ATP6V1E1, C22orf39,PRADC1,CYSTM1,CHCHD4,EIF2B3,GTF3A,LDHA, MGST3,MSRB2,NDUFA6,PSMC1,RILP,SLC25A20,SNAPIN |
 |
|
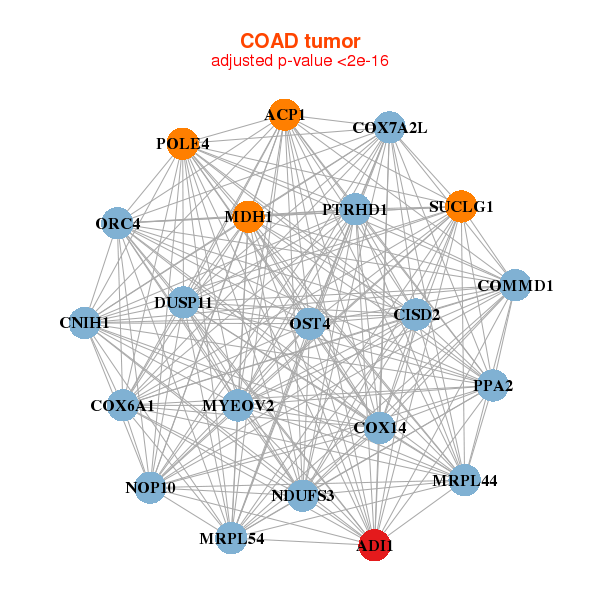
| ACP1,ADI1,COX14,PTRHD1,CISD2,CNIH1,COMMD1, COX6A1,COX7A2L,DUSP11,MDH1,MRPL44,MRPL54,MYEOV2, NDUFS3,NOP10,ORC4,OST4,POLE4,PPA2,SUCLG1 | ADI1,BDH2,LINC00324,TMEM256,SMIM20,CCNG1,CENPV, CRADD,DERA,DGCR6,ETV2,GLOD4,HACL1,HOXB7, IGBP1,LOC201651,NDFIP1,PIGH,RARS2,RNF141,TMEM219 |
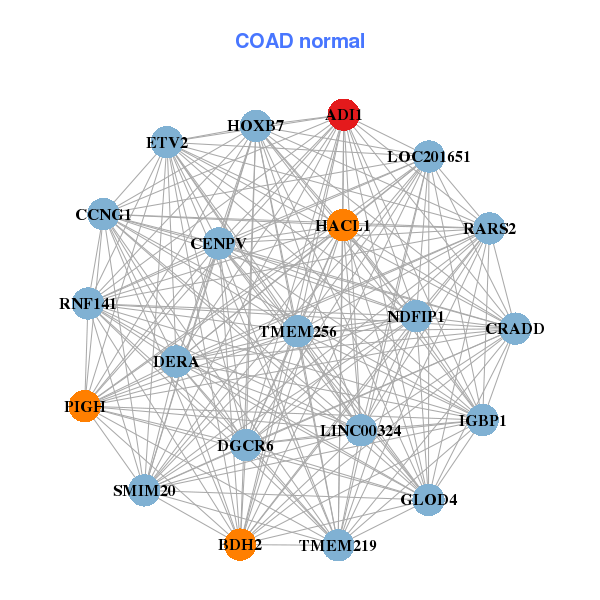
| * Co-Expression network figures were drawn using R package igraph. Only the top 20 genes with the highest correlations were shown. Red circle: input gene, orange circle: cell metabolism gene, sky circle: other gene |
: Open all plots for all cancer types
| Top |
: Open all interacting genes' information including KEGG pathway for all interacting genes from DAVID
| Top |
| Pharmacological Information for ADI1 |
| There's no related Drug. |
| Top |
| Cross referenced IDs for ADI1 |
| * We obtained these cross-references from Uniprot database. It covers 150 different DBs, 18 categories. http://www.uniprot.org/help/cross_references_section |
: Open all cross reference information
|
Copyright © 2016-Present - The Univsersity of Texas Health Science Center at Houston @ |