|
|||||||||||||||||||||||||||||||||||||||||||||||||||||||||||||||||||||||||||||||||||||||||||||||||||||||||||||||||||||||||||||||||||||||||||||||||||||||||||||||||||||||||||||||||||||||||||||||||||||||||||||||||||||||||||||||||||||||||||||||||||||||||||||||||||||||||||||||||||||||||||||||||||||||||||||||||||||||||||||||||||||||||||||||||||
| |
| Phenotypic Information (metabolism pathway, cancer, disease, phenome) |
| |
| |
| Gene-Gene Network Information: Co-Expression Network, Interacting Genes & KEGG |
| |
|


| Gene Summary for FBXW7 |
| Basic gene info. | Gene symbol | FBXW7 |
| Gene name | F-box and WD repeat domain containing 7, E3 ubiquitin protein ligase | |
| Synonyms | AGO|CDC4|FBW6|FBW7|FBX30|FBXO30|FBXW6|SEL-10|SEL10|hAgo|hCdc4 | |
| Cytomap | UCSC genome browser: 4q31.3 | |
| Genomic location | chr4 :153332311-153456393 | |
| Type of gene | protein-coding | |
| RefGenes | NM_001013415.1, NM_001257069.1,NM_018315.4,NM_033632.3, | |
| Ensembl id | ENSG00000109670 | |
| Description | F-box and WD-40 domain protein 7 (archipelago homolog, Drosophila)F-box protein FBW7F-box protein FBX30F-box protein SEL-10F-box/WD repeat-containing protein 7archipelagohomolog of C elegans sel-10 | |
| Modification date | 20141222 | |
| dbXrefs | MIM : 606278 | |
| HGNC : HGNC | ||
| Ensembl : ENSG00000109670 | ||
| HPRD : 05888 | ||
| Vega : OTTHUMG00000185246 | ||
| Protein | UniProt: Q969H0 go to UniProt's Cross Reference DB Table | |
| Expression | CleanEX: HS_FBXW7 | |
| BioGPS: 55294 | ||
| Gene Expression Atlas: ENSG00000109670 | ||
| The Human Protein Atlas: ENSG00000109670 | ||
| Pathway | NCI Pathway Interaction Database: FBXW7 | |
| KEGG: FBXW7 | ||
| REACTOME: FBXW7 | ||
| ConsensusPathDB | ||
| Pathway Commons: FBXW7 | ||
| Metabolism | MetaCyc: FBXW7 | |
| HUMANCyc: FBXW7 | ||
| Regulation | Ensembl's Regulation: ENSG00000109670 | |
| miRBase: chr4 :153,332,311-153,456,393 | ||
| TargetScan: NM_001013415 | ||
| cisRED: ENSG00000109670 | ||
| Context | iHOP: FBXW7 | |
| cancer metabolism search in PubMed: FBXW7 | ||
| UCL Cancer Institute: FBXW7 | ||
| Assigned class in ccmGDB | A - This gene has a literature evidence and it belongs to cancer gene. | |
| References showing role of FBXW7 in cancer cell metabolism | 1. Okazaki H, Matsunaga N, Fujioka T, Okazaki F, Akagawa Y, et al. (2014) Circadian regulation of mTOR by the ubiquitin pathway in renal cell carcinoma. Cancer Res 74: 543-551. doi: 10.1158/0008-5472.CAN-12-3241. go to article 2. Xu Y, Swartz KL, Siu KT, Bhattacharyya M, Minella AC (2014) Fbw7-dependent cyclin E regulation ensures terminal maturation of bone marrow erythroid cells by restraining oxidative metabolism. Oncogene 33: 3161-3171. doi: 10.1038/onc.2013.289. pmid: 3939062. go to article 3. Li S, Oh YT, Yue P, Khuri FR, Sun SY (2015) Inhibition of mTOR complex 2 induces GSK3/FBXW7-dependent degradation of sterol regulatory element-binding protein 1 (SREBP1) and suppresses lipogenesis in cancer cells. Oncogene. doi: 10.1038/onc.2015.123. go to article | |
| Top |
| Phenotypic Information for FBXW7(metabolism pathway, cancer, disease, phenome) |
| Cancer | CGAP: FBXW7 |
| Familial Cancer Database: FBXW7 | |
| * This gene is included in those cancer gene databases. |
|
|
|
|
|
| . | |||||||||||||||||||||||||||||||||||||||||||||||||||||||||||||||||||||||||||||||||||||||||||||||||||||||||||||||||||||||||||||||||||||||||||||||||||||||||||||||||||||||||||||||||||||||||||||||||||||||||||||||||||||||||||||||||||||||||||||||||||||||||||||||||||||||||||||||||||||||||||||||||||||||||||||||||||||||||||||||||||||||||||||
Oncogene 1 | Significant driver gene in BLCA 6, COAD 7, CRC 8, LUSC 9, UCEC 10, STAD 11, | ||||||||||||||||||||||||||||||||||||||||||||||||||||||||||||||||||||||||||||||||||||||||||||||||||||||||||||||||||||||||||||||||||||||||||||||||||||||||||||||||||||||||||||||||||||||||||||||||||||||||||||||||||||||||||||||||||||||||||||||||||||||||||||||||||||||||||||||||||||||||||||||||||||||||||||||||||||||||||||||||||||||||||||||||||
| cf) number; DB name 1 Oncogene; http://nar.oxfordjournals.org/content/35/suppl_1/D721.long, 2 Tumor Suppressor gene; https://bioinfo.uth.edu/TSGene/, 3 Cancer Gene Census; http://www.nature.com/nrc/journal/v4/n3/abs/nrc1299.html, 4 CancerGenes; http://nar.oxfordjournals.org/content/35/suppl_1/D721.long, 5 Network of Cancer Gene; http://ncg.kcl.ac.uk/index.php, 6 http://www.nature.com/nature/journal/vaop/ncurrent/full/nature12965.html, 7 http://www.nature.com/nature/journal/v487/n7407/full/nature11252.html, 8 http://www.nature.com/nature/journal/v505/n7484/full/nature12912.html, 9 http://www.nature.com/nature/journal/v489/n7417/full/nature11404.html, 10 http://www.nature.com/nature/journal/v497/n7447/full/nature12113.html, 11 http://www.nature.com/nature/journal/v513/n7517/full/nature13480.html, 12Therapeutic Vulnerabilities in Cancer; http://cbio.mskcc.org/cancergenomics/statius/ |
| REACTOME_METABOLISM_OF_PROTEINS | |
| OMIM | 606278; gene. |
| Orphanet | |
| Disease | KEGG Disease: FBXW7 |
| MedGen: FBXW7 (Human Medical Genetics with Condition) | |
| ClinVar: FBXW7 | |
| Phenotype | MGI: FBXW7 (International Mouse Phenotyping Consortium) |
| PhenomicDB: FBXW7 | |
| Mutations for FBXW7 |
| * Under tables are showing count per each tissue to give us broad intuition about tissue specific mutation patterns.You can go to the detailed page for each mutation database's web site. |
| - Statistics for Tissue and Mutation type | Top |
 |
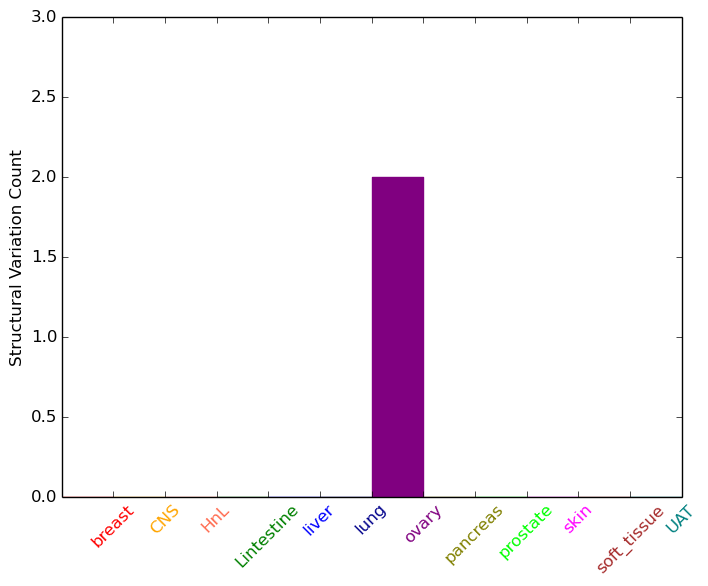
| - For Inter-chromosomal Variations |
| * Inter-chromosomal variantions includes 'interchromosomal amplicon to amplicon', 'interchromosomal amplicon to non-amplified dna', 'interchromosomal insertion', 'Interchromosomal unknown type'. |
 |
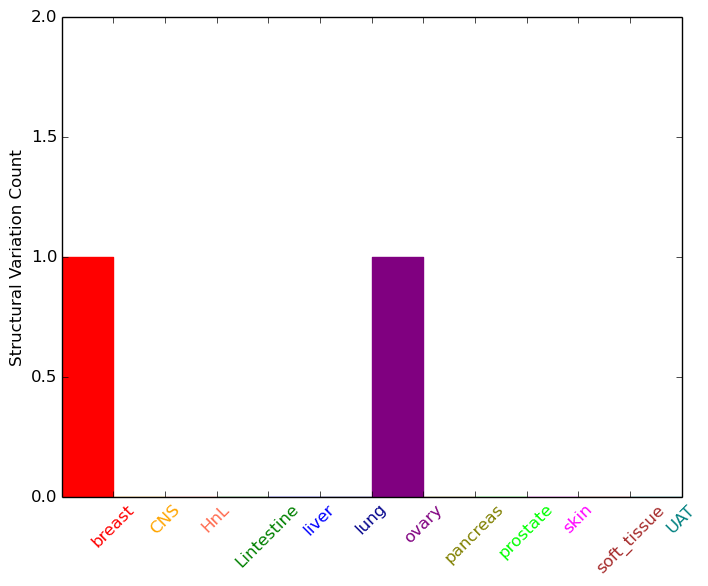
| - For Intra-chromosomal Variations |
| * Intra-chromosomal variantions includes 'intrachromosomal amplicon to amplicon', 'intrachromosomal amplicon to non-amplified dna', 'intrachromosomal deletion', 'intrachromosomal fold-back inversion', 'intrachromosomal inversion', 'intrachromosomal tandem duplication', 'Intrachromosomal unknown type', 'intrachromosomal with inverted orientation', 'intrachromosomal with non-inverted orientation'. |
 |
| Sample | Symbol_a | Chr_a | Start_a | End_a | Symbol_b | Chr_b | Start_b | End_b |
| breast | FBXW7 | chr4 | 153417751 | 153417751 | chr4 | 153462101 | 153462101 | |
| ovary | FBXW7 | chr4 | 153390842 | 153390862 | chr19 | 523678 | 523698 | |
| ovary | FBXW7 | chr4 | 153390842 | 153390862 | chr19 | 523680 | 523700 | |
| ovary | FBXW7 | chr4 | 153440103 | 153440123 | FBXW7 | chr4 | 153375517 | 153375537 |
| cf) Tissue number; Tissue name (1;Breast, 2;Central_nervous_system, 3;Haematopoietic_and_lymphoid_tissue, 4;Large_intestine, 5;Liver, 6;Lung, 7;Ovary, 8;Pancreas, 9;Prostate, 10;Skin, 11;Soft_tissue, 12;Upper_aerodigestive_tract) |
| * From mRNA Sanger sequences, Chitars2.0 arranged chimeric transcripts. This table shows FBXW7 related fusion information. |
| ID | Head Gene | Tail Gene | Accession | Gene_a | qStart_a | qEnd_a | Chromosome_a | tStart_a | tEnd_a | Gene_a | qStart_a | qEnd_a | Chromosome_a | tStart_a | tEnd_a |
| DQ177302 | RUNX1 | 1 | 275 | 21 | 36219767 | 36220044 | FBXW7 | 259 | 279 | 4 | 153332704 | 153332724 | |
| AI133397 | FBXW7 | 8 | 607 | 4 | 153250162 | 153250761 | KLF12 | 599 | 820 | 13 | 74683445 | 74683666 | |
| BF089643 | FBXW7 | 22 | 206 | 4 | 153244074 | 153244258 | PRR4 | 197 | 406 | 12 | 10998476 | 10999779 | |
| Top |
| Mutation type/ Tissue ID | brca | cns | cerv | endome | haematopo | kidn | Lintest | liver | lung | ns | ovary | pancre | prost | skin | stoma | thyro | urina | |||
| Total # sample | 1 | 2 | ||||||||||||||||||
| GAIN (# sample) | 1 | |||||||||||||||||||
| LOSS (# sample) | 1 | 1 |
| cf) Tissue ID; Tissue type (1; Breast, 2; Central_nervous_system, 3; Cervix, 4; Endometrium, 5; Haematopoietic_and_lymphoid_tissue, 6; Kidney, 7; Large_intestine, 8; Liver, 9; Lung, 10; NS, 11; Ovary, 12; Pancreas, 13; Prostate, 14; Skin, 15; Stomach, 16; Thyroid, 17; Urinary_tract) |
| Top |
|
 |
| Top |
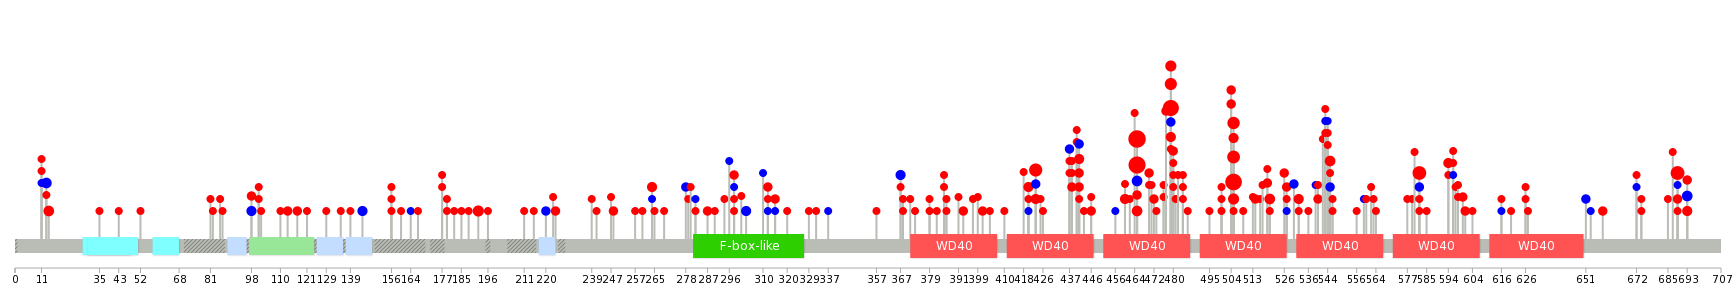
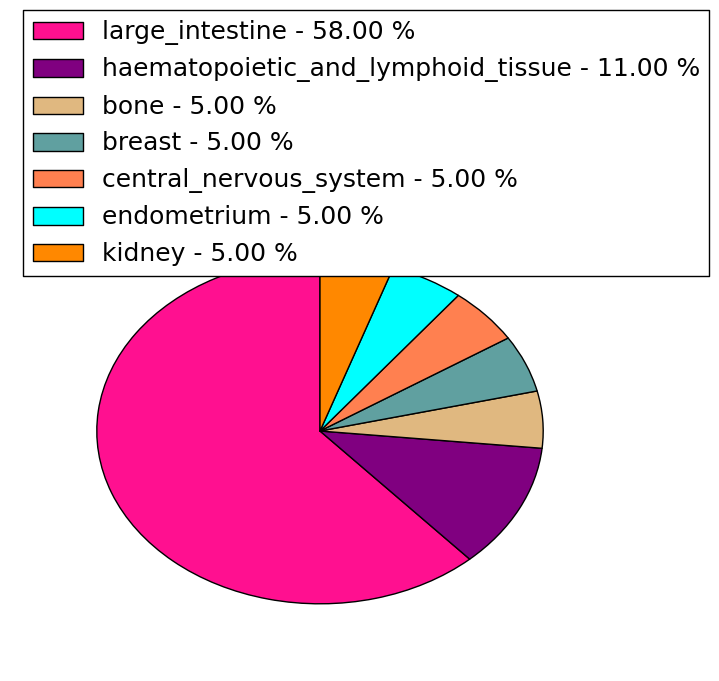
| Stat. for Non-Synonymous SNVs (# total SNVs=722) | (# total SNVs=60) |
 | 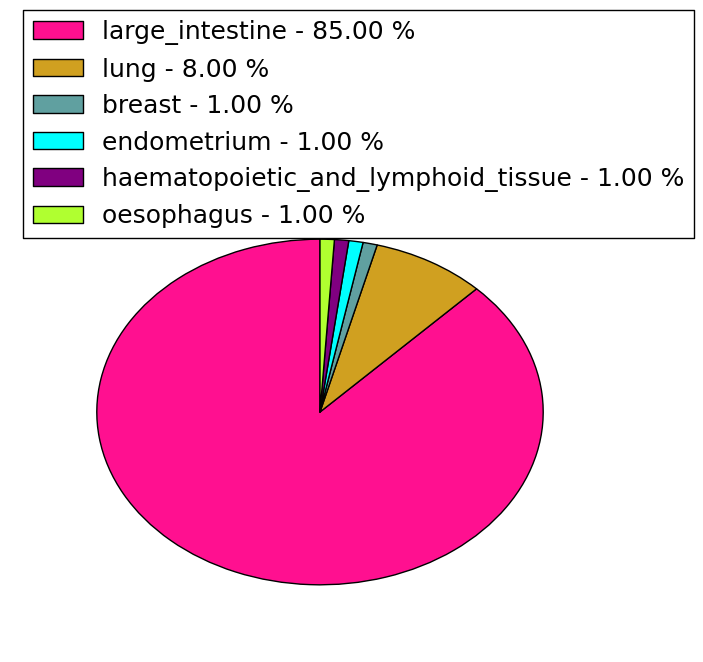 |
(# total SNVs=17) | (# total SNVs=16) |
 | 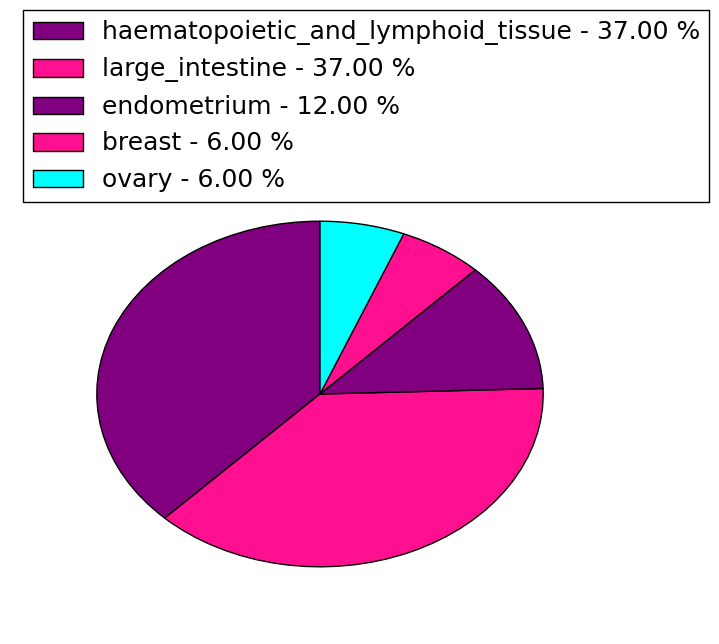 |
| Top |
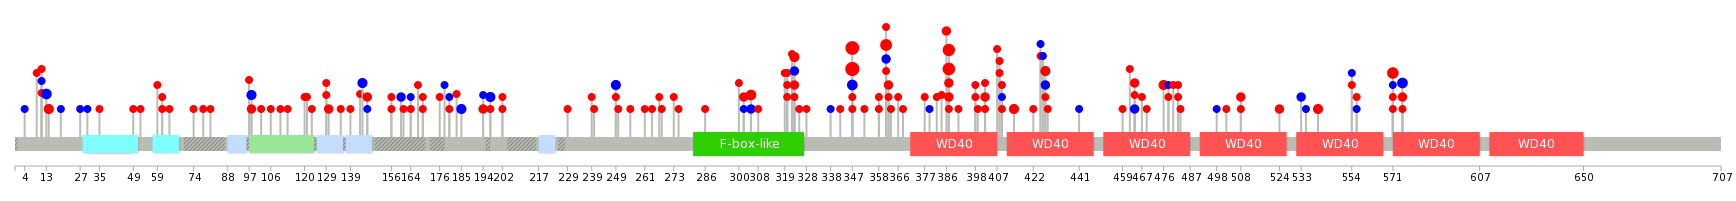
| * When you move the cursor on each content, you can see more deailed mutation information on the Tooltip. Those are primary_site,primary_histology,mutation(aa),pubmedID. |
| GRCh37 position | Mutation(aa) | Unique sampleID count |
| chr4:153249385-153249385 | p.R465C | 94 |
| chr4:153249384-153249384 | p.R465H | 81 |
| chr4:153247289-153247289 | p.R505S | 80 |
| chr4:153247366-153247366 | p.R479L | 53 |
| chr4:153247288-153247288 | p.R505L | 27 |
| chr4:153244092-153244092 | p.R689W | 18 |
| chr4:153245446-153245446 | p.S582L | 17 |
| chr4:153251907-153251907 | p.R367* | 15 |
| chr4:153258983-153258983 | p.R278* | 13 |
| chr4:153244185-153244185 | p.R658* | 10 |
| Top |
|
 |
| Point Mutation/ Tissue ID | 1 | 2 | 3 | 4 | 5 | 6 | 7 | 8 | 9 | 10 | 11 | 12 | 13 | 14 | 15 | 16 | 17 | 18 | 19 | 20 |
| # sample | 7 | 5 | 1 | 130 | 1 | 13 | 1 | 3 | 1 | 9 | 10 | 6 | 1 | 9 | 19 | 1 | 36 | |||
| # mutation | 6 | 5 | 1 | 97 | 1 | 11 | 1 | 3 | 1 | 9 | 8 | 6 | 1 | 10 | 12 | 1 | 24 | |||
| nonsynonymous SNV | 6 | 5 | 1 | 69 | 1 | 10 | 1 | 2 | 1 | 6 | 5 | 5 | 1 | 9 | 11 | 1 | 23 | |||
| synonymous SNV | 30 | 1 | 1 | 3 | 3 | 1 | 1 | 1 | 1 |
| cf) Tissue ID; Tissue type (1; BLCA[Bladder Urothelial Carcinoma], 2; BRCA[Breast invasive carcinoma], 3; CESC[Cervical squamous cell carcinoma and endocervical adenocarcinoma], 4; COAD[Colon adenocarcinoma], 5; GBM[Glioblastoma multiforme], 6; Glioma Low Grade, 7; HNSC[Head and Neck squamous cell carcinoma], 8; KICH[Kidney Chromophobe], 9; KIRC[Kidney renal clear cell carcinoma], 10; KIRP[Kidney renal papillary cell carcinoma], 11; LAML[Acute Myeloid Leukemia], 12; LUAD[Lung adenocarcinoma], 13; LUSC[Lung squamous cell carcinoma], 14; OV[Ovarian serous cystadenocarcinoma ], 15; PAAD[Pancreatic adenocarcinoma], 16; PRAD[Prostate adenocarcinoma], 17; SKCM[Skin Cutaneous Melanoma], 18:STAD[Stomach adenocarcinoma], 19:THCA[Thyroid carcinoma], 20:UCEC[Uterine Corpus Endometrial Carcinoma]) |
| Top |
| * We represented just top 10 SNVs. When you move the cursor on each content, you can see more deailed mutation information on the Tooltip. Those are primary_site, primary_histology, mutation(aa), pubmedID. |
| Genomic Position | Mutation(aa) | Unique sampleID count |
| chr4:153249385 | p.R347C,FBXW7 | 22 |
| chr4:153247289 | p.R387G,FBXW7 | 20 |
| chr4:153249384 | p.R347H,FBXW7 | 18 |
| chr4:153247366 | p.R361P,FBXW7 | 8 |
| chr4:153244092 | p.R571W,FBXW7 | 6 |
| chr4:153249457 | p.R323W,FBXW7 | 5 |
| chr4:153249383 | p.R13R,FBXW7 | 4 |
| chr4:153332917 | p.D402Y,FBXW7 | 4 |
| chr4:153247288 | p.E575E,FBXW7 | 4 |
| chr4:153244078 | p.R387H,FBXW7 | 4 |
| * Copy number data were extracted from TCGA using R package TCGA-Assembler. The URLs of all public data files on TCGA DCC data server were gathered on Jan-05-2015. Function ProcessCNAData in TCGA-Assembler package was used to obtain gene-level copy number value which is calculated as the average copy number of the genomic region of a gene. |
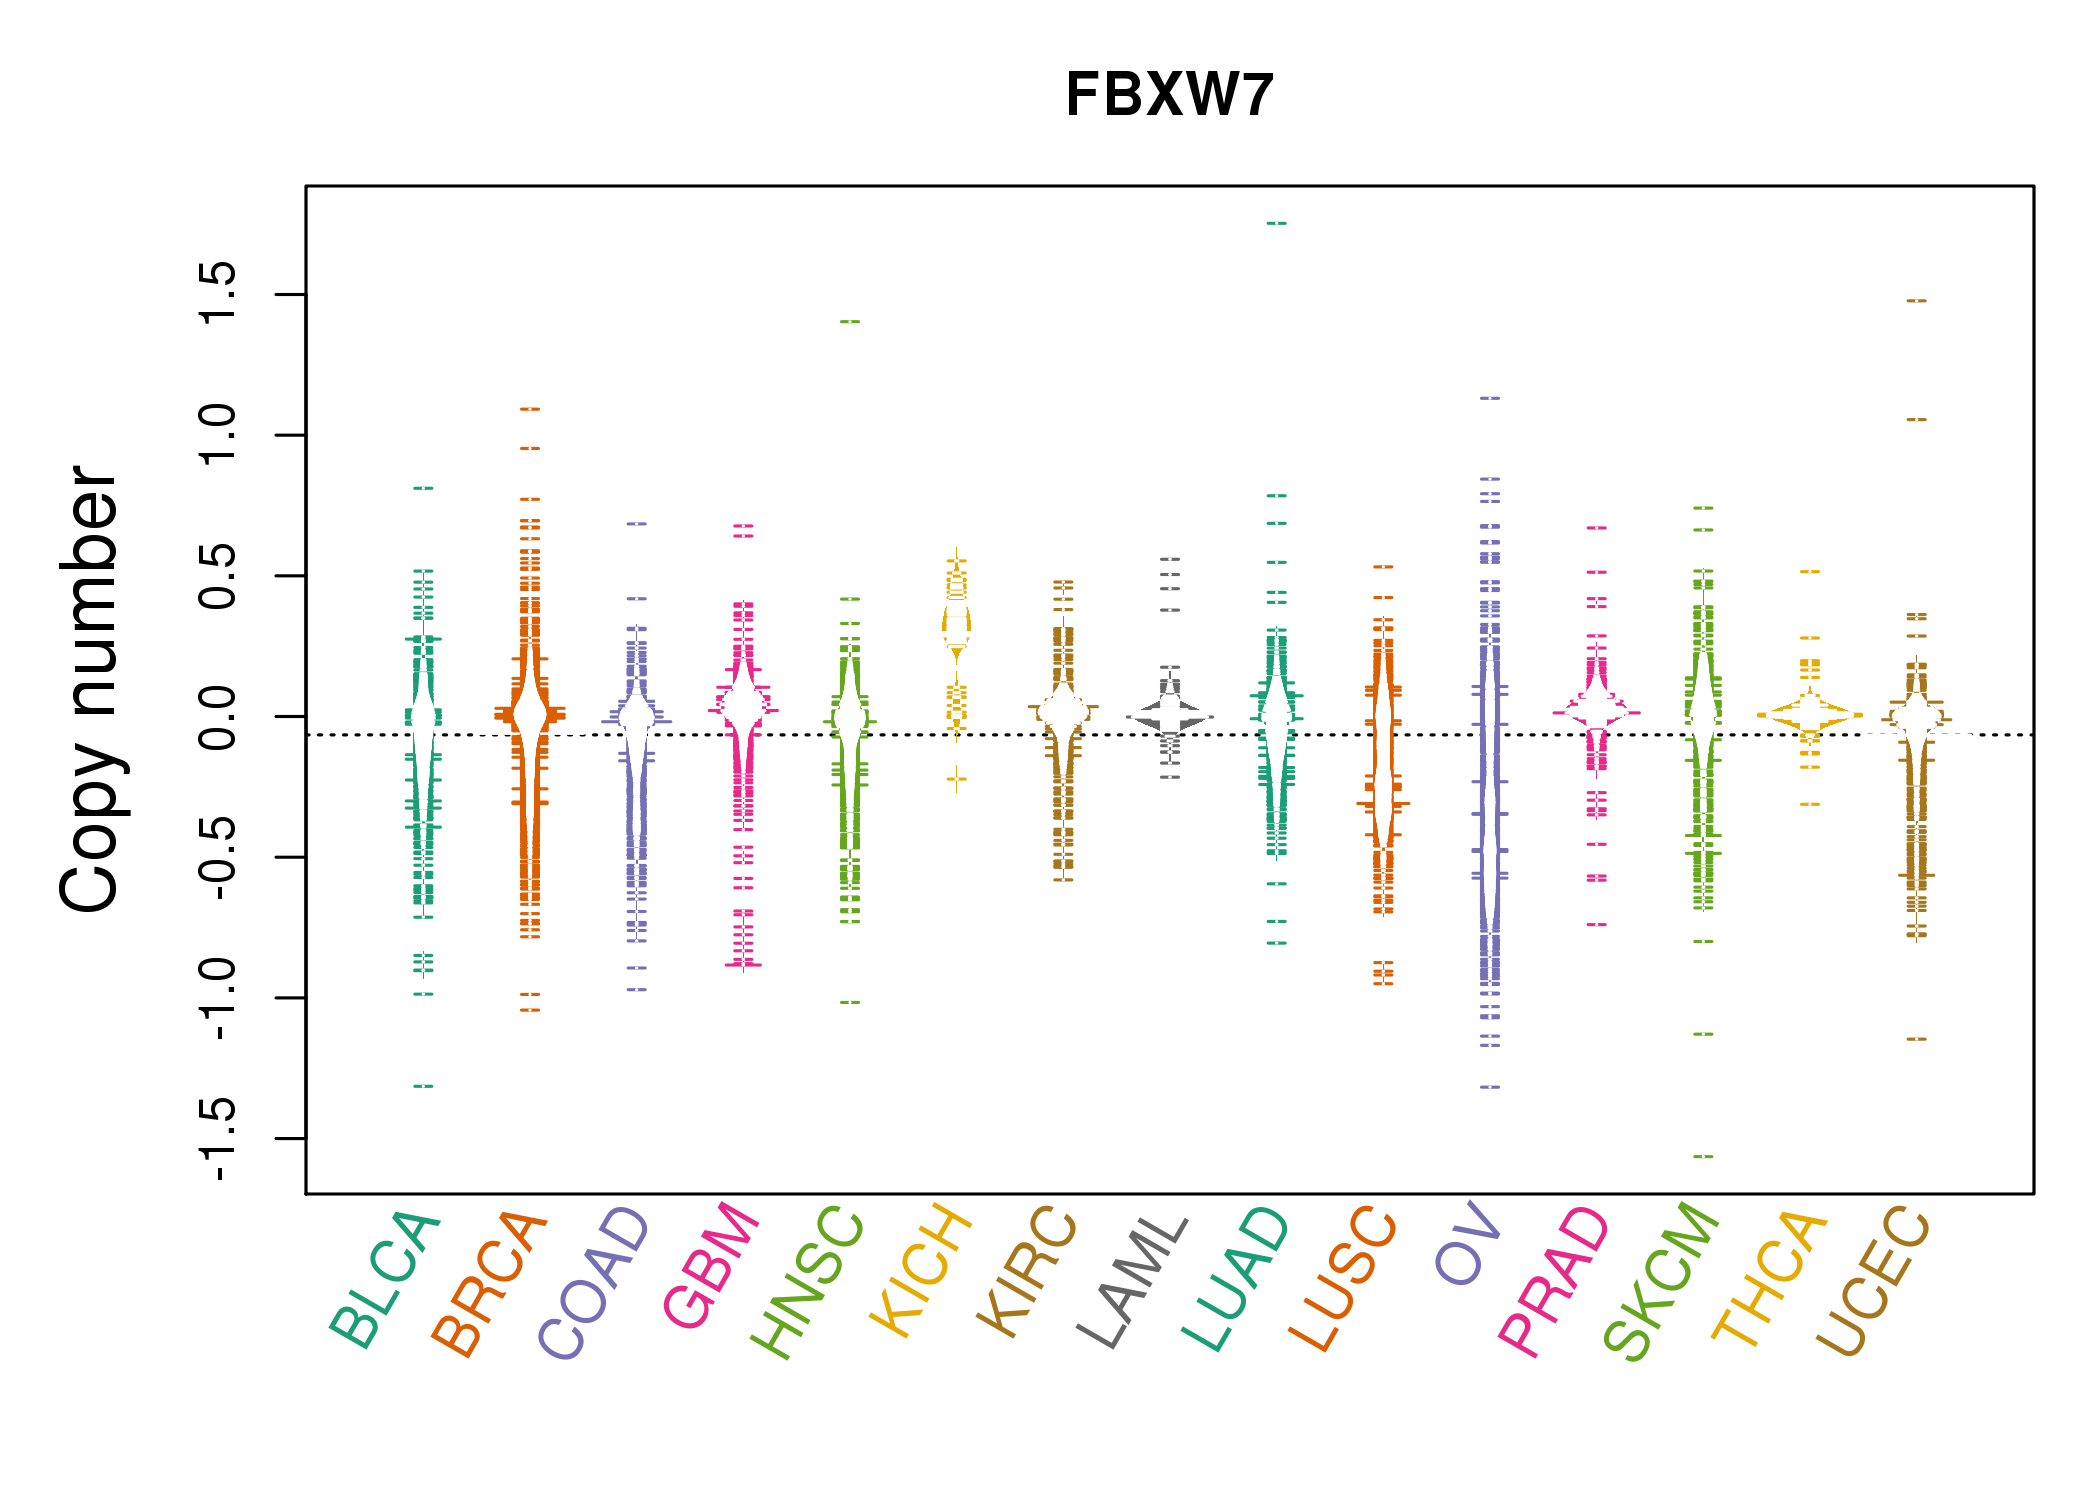 |
| cf) Tissue ID[Tissue type]: BLCA[Bladder Urothelial Carcinoma], BRCA[Breast invasive carcinoma], CESC[Cervical squamous cell carcinoma and endocervical adenocarcinoma], COAD[Colon adenocarcinoma], GBM[Glioblastoma multiforme], Glioma Low Grade, HNSC[Head and Neck squamous cell carcinoma], KICH[Kidney Chromophobe], KIRC[Kidney renal clear cell carcinoma], KIRP[Kidney renal papillary cell carcinoma], LAML[Acute Myeloid Leukemia], LUAD[Lung adenocarcinoma], LUSC[Lung squamous cell carcinoma], OV[Ovarian serous cystadenocarcinoma ], PAAD[Pancreatic adenocarcinoma], PRAD[Prostate adenocarcinoma], SKCM[Skin Cutaneous Melanoma], STAD[Stomach adenocarcinoma], THCA[Thyroid carcinoma], UCEC[Uterine Corpus Endometrial Carcinoma] |
| Top |
| Gene Expression for FBXW7 |
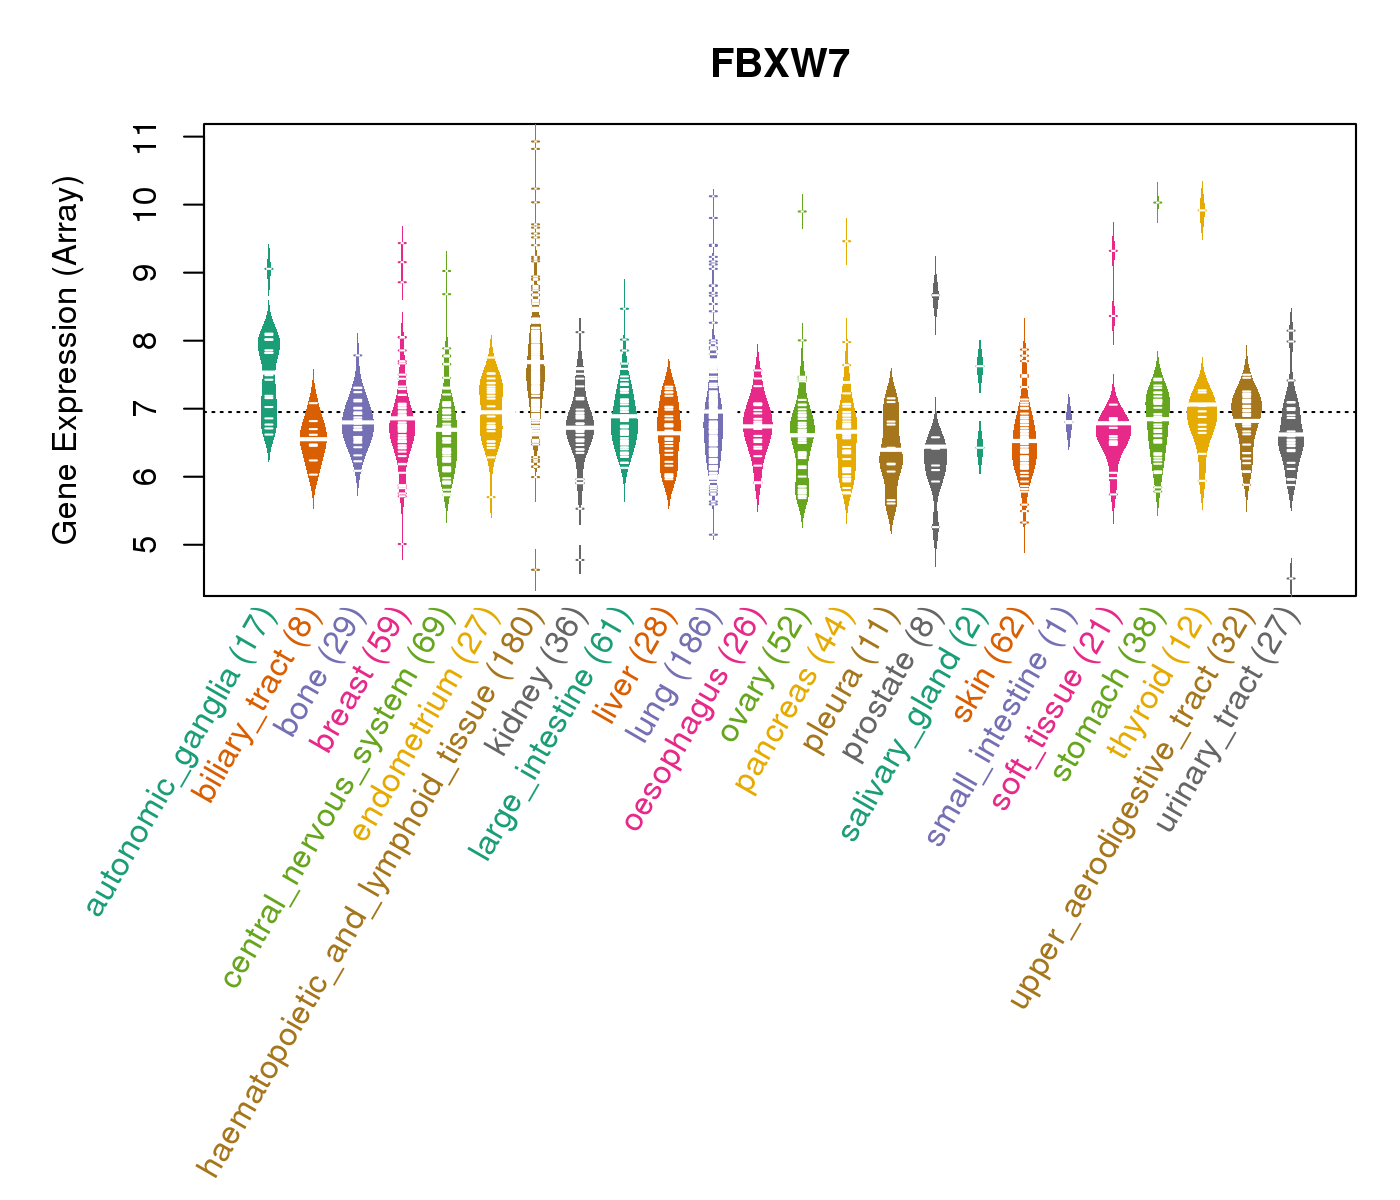
| * CCLE gene expression data were extracted from CCLE_Expression_Entrez_2012-10-18.res: Gene-centric RMA-normalized mRNA expression data. |
 |
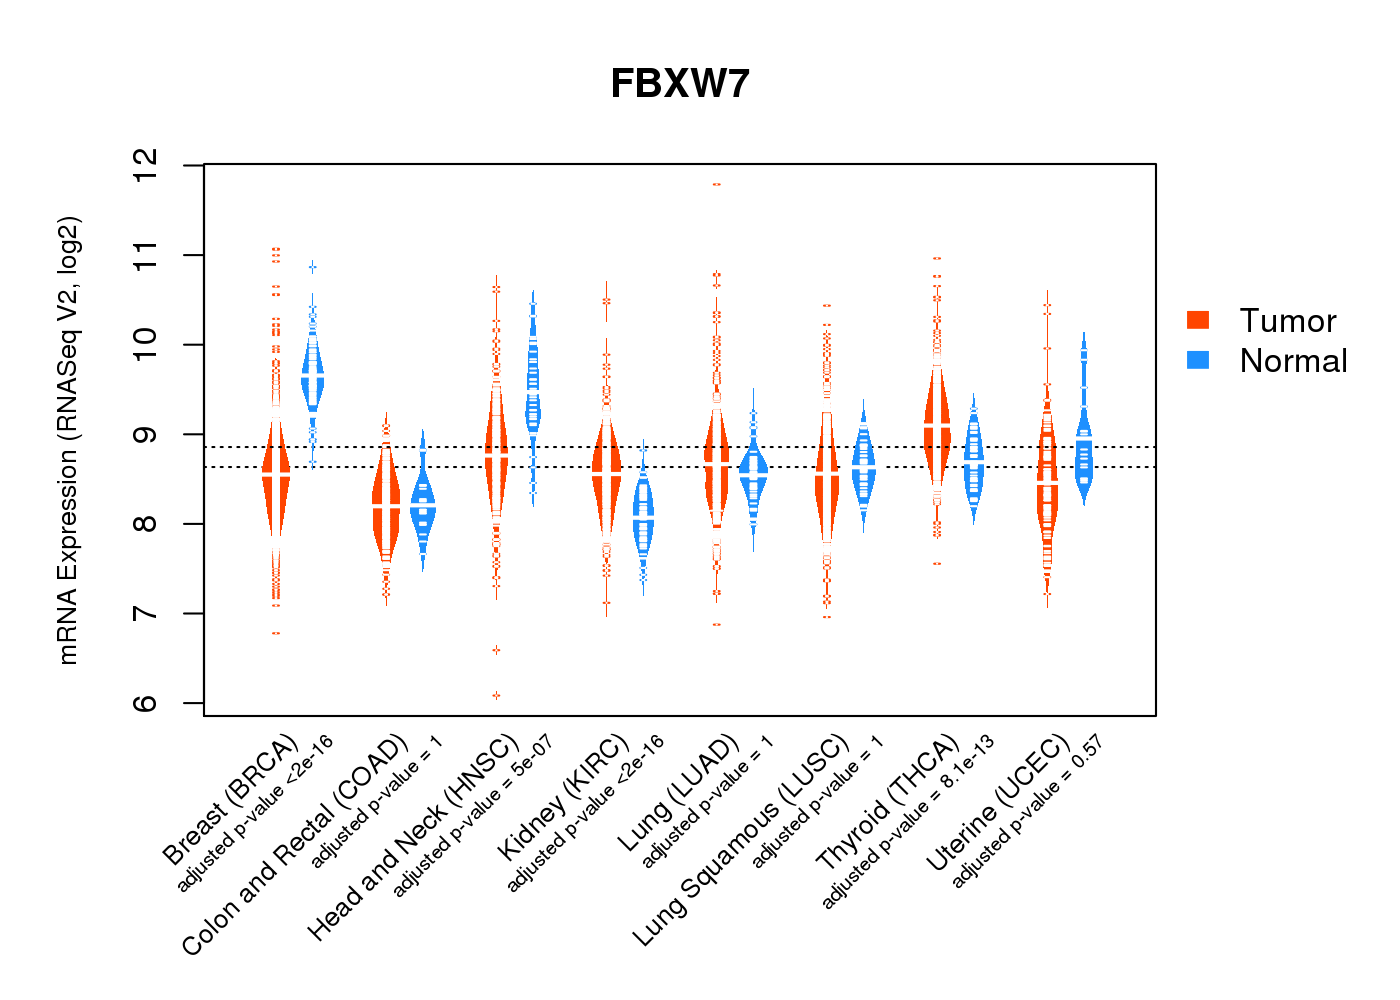
| * Normalized gene expression data of RNASeqV2 was extracted from TCGA using R package TCGA-Assembler. The URLs of all public data files on TCGA DCC data server were gathered at Jan-05-2015. Only eight cancer types have enough normal control samples for differential expression analysis. (t test, adjusted p<0.05 (using Benjamini-Hochberg FDR)) |
 |
| Top |
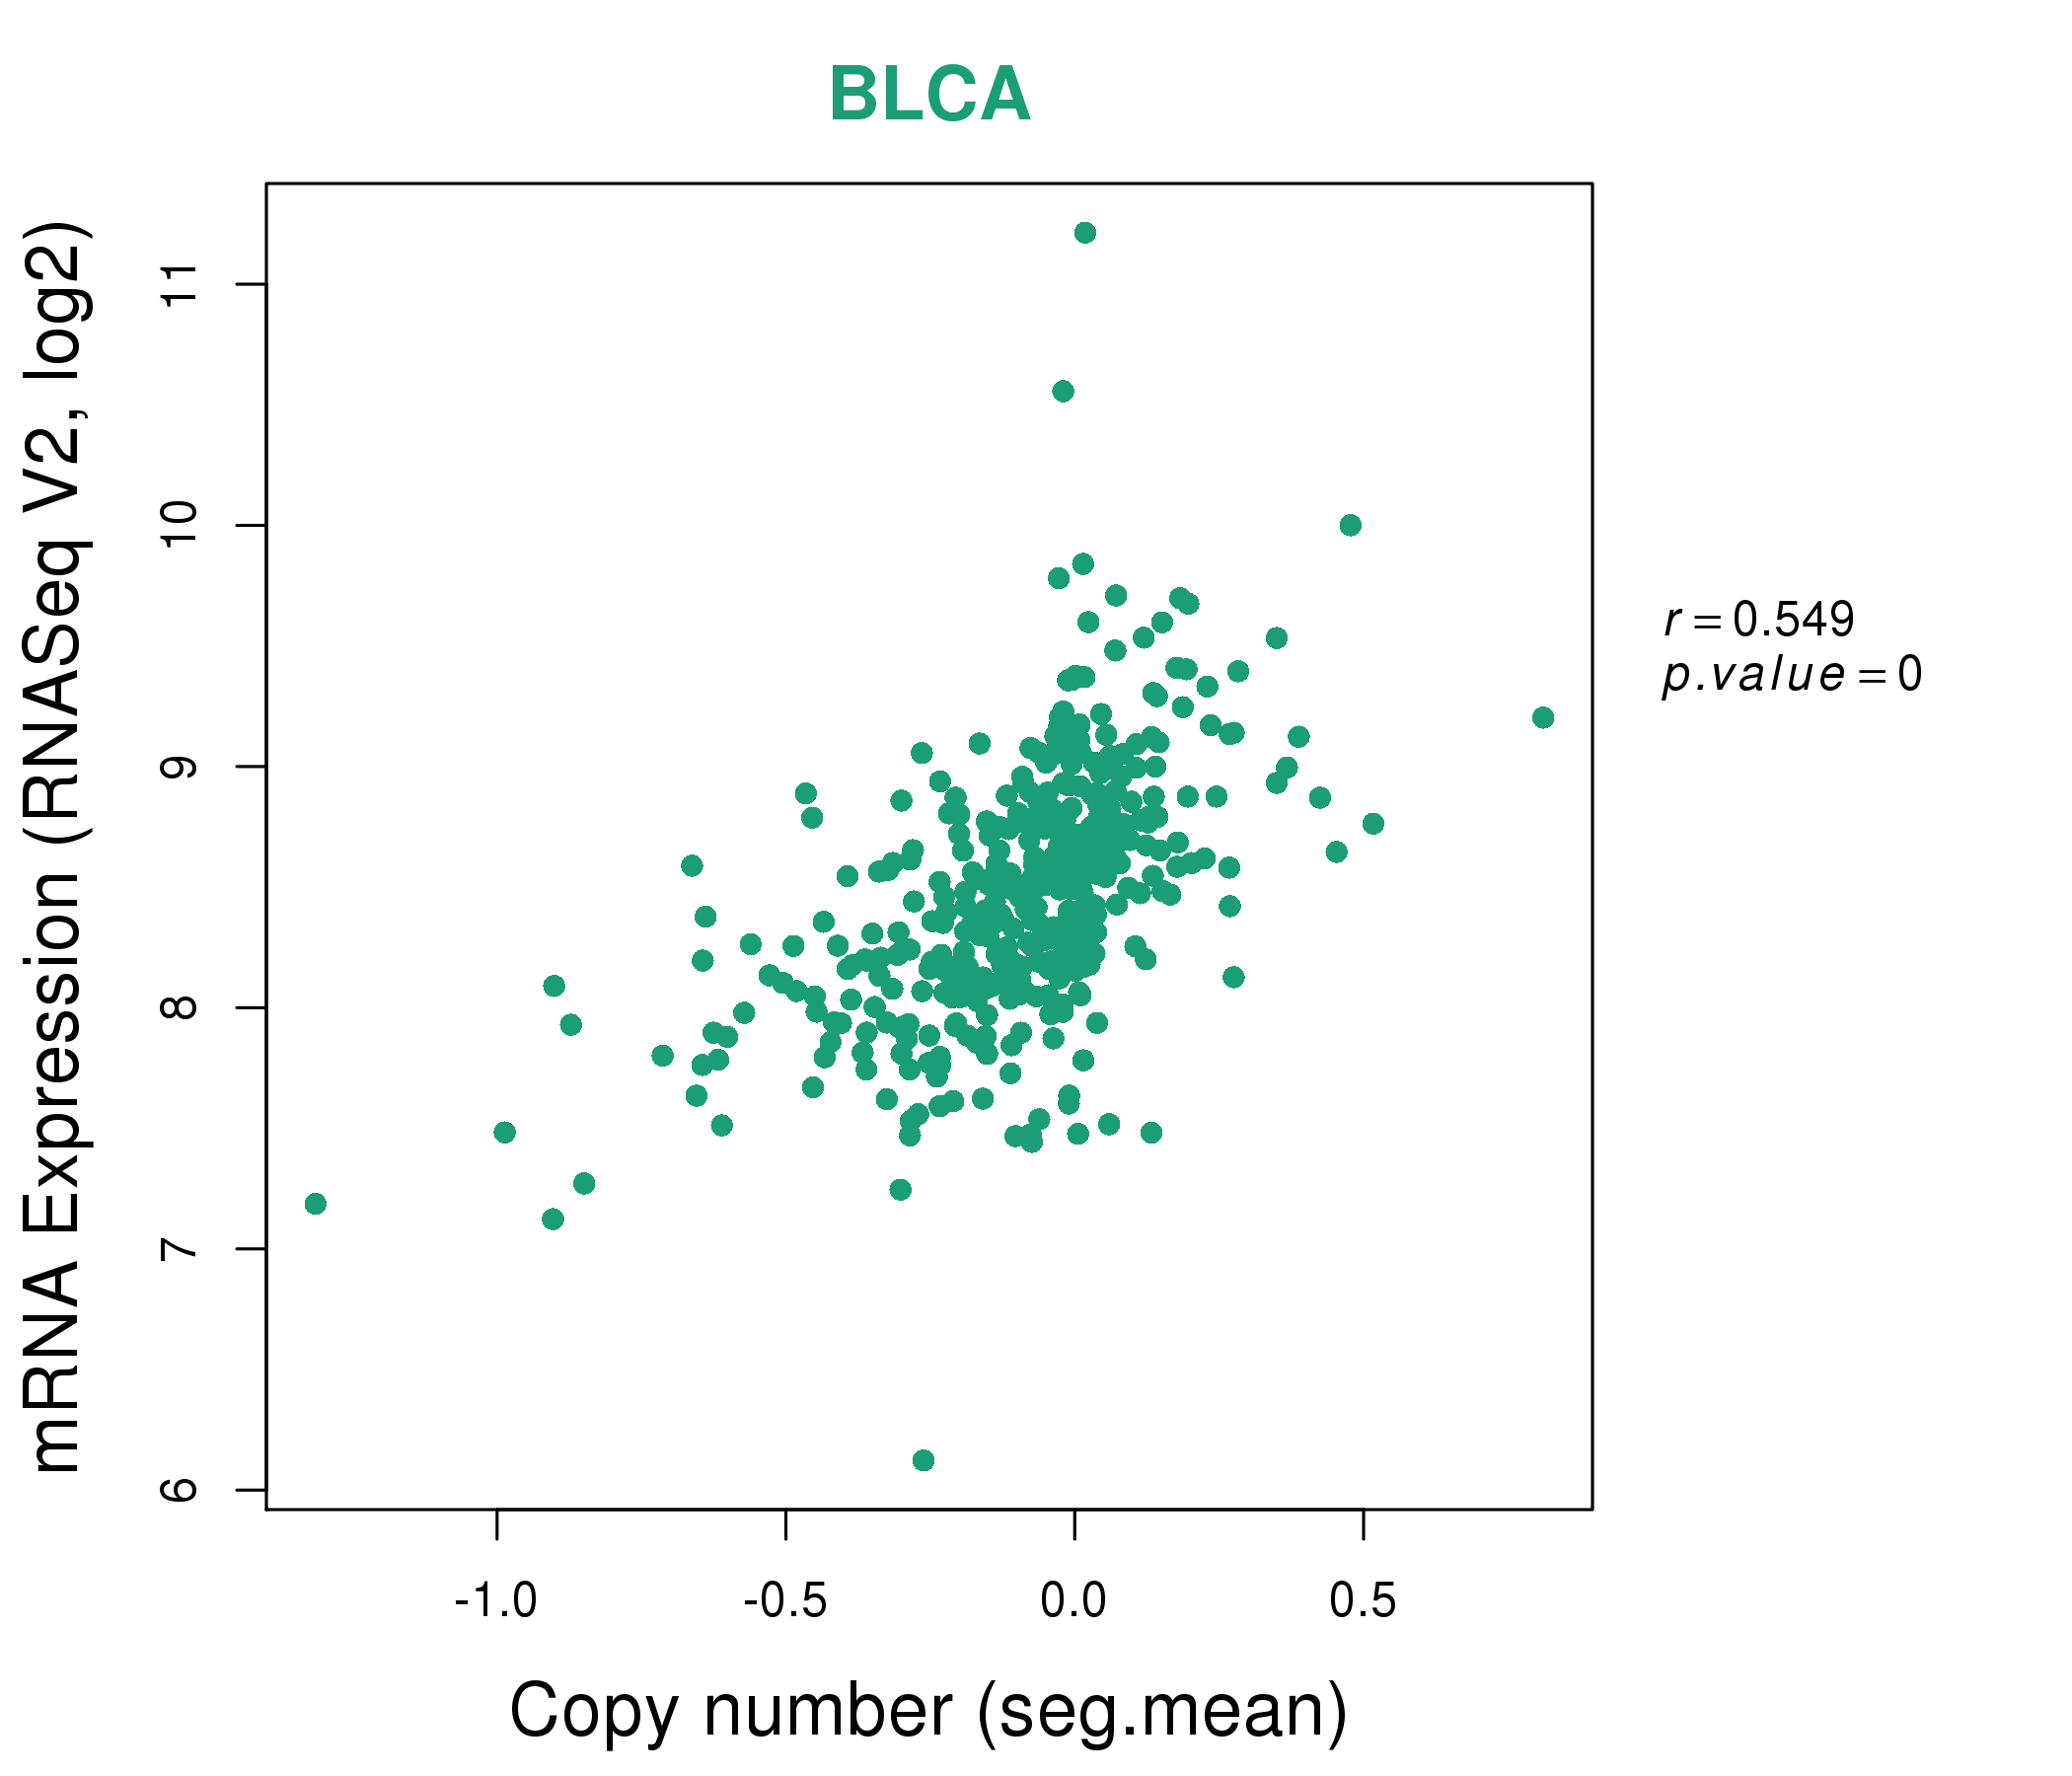
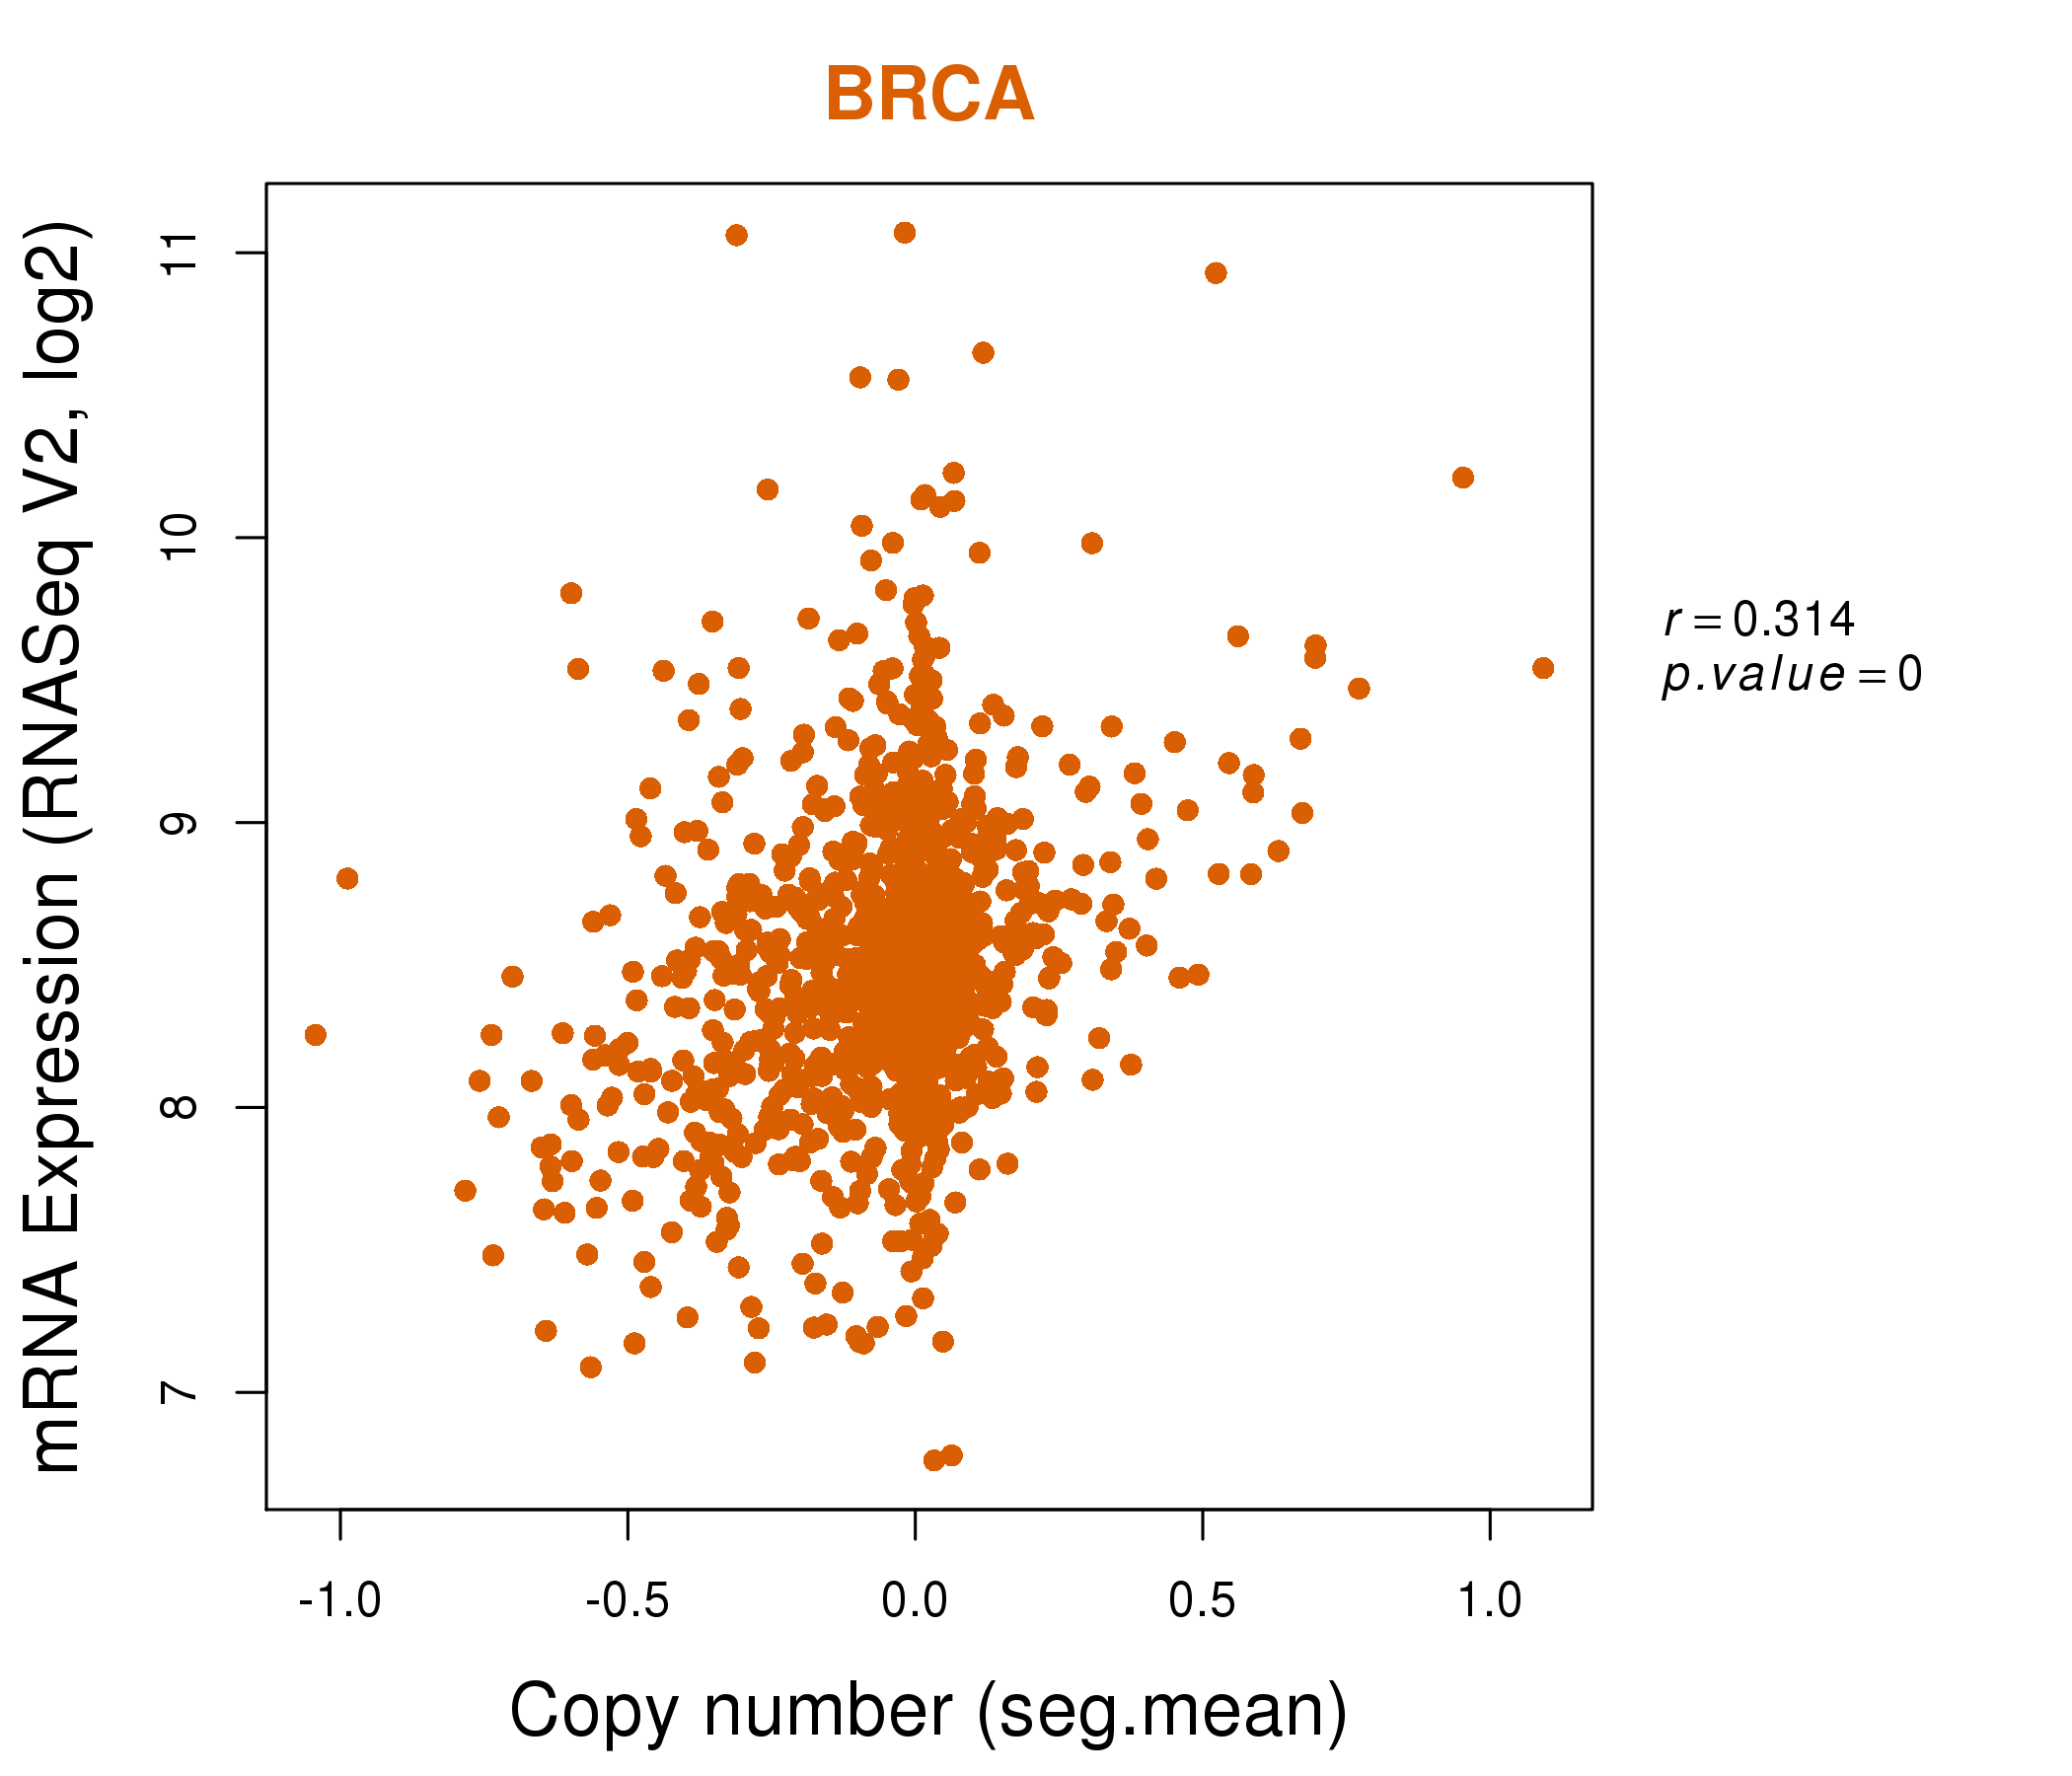
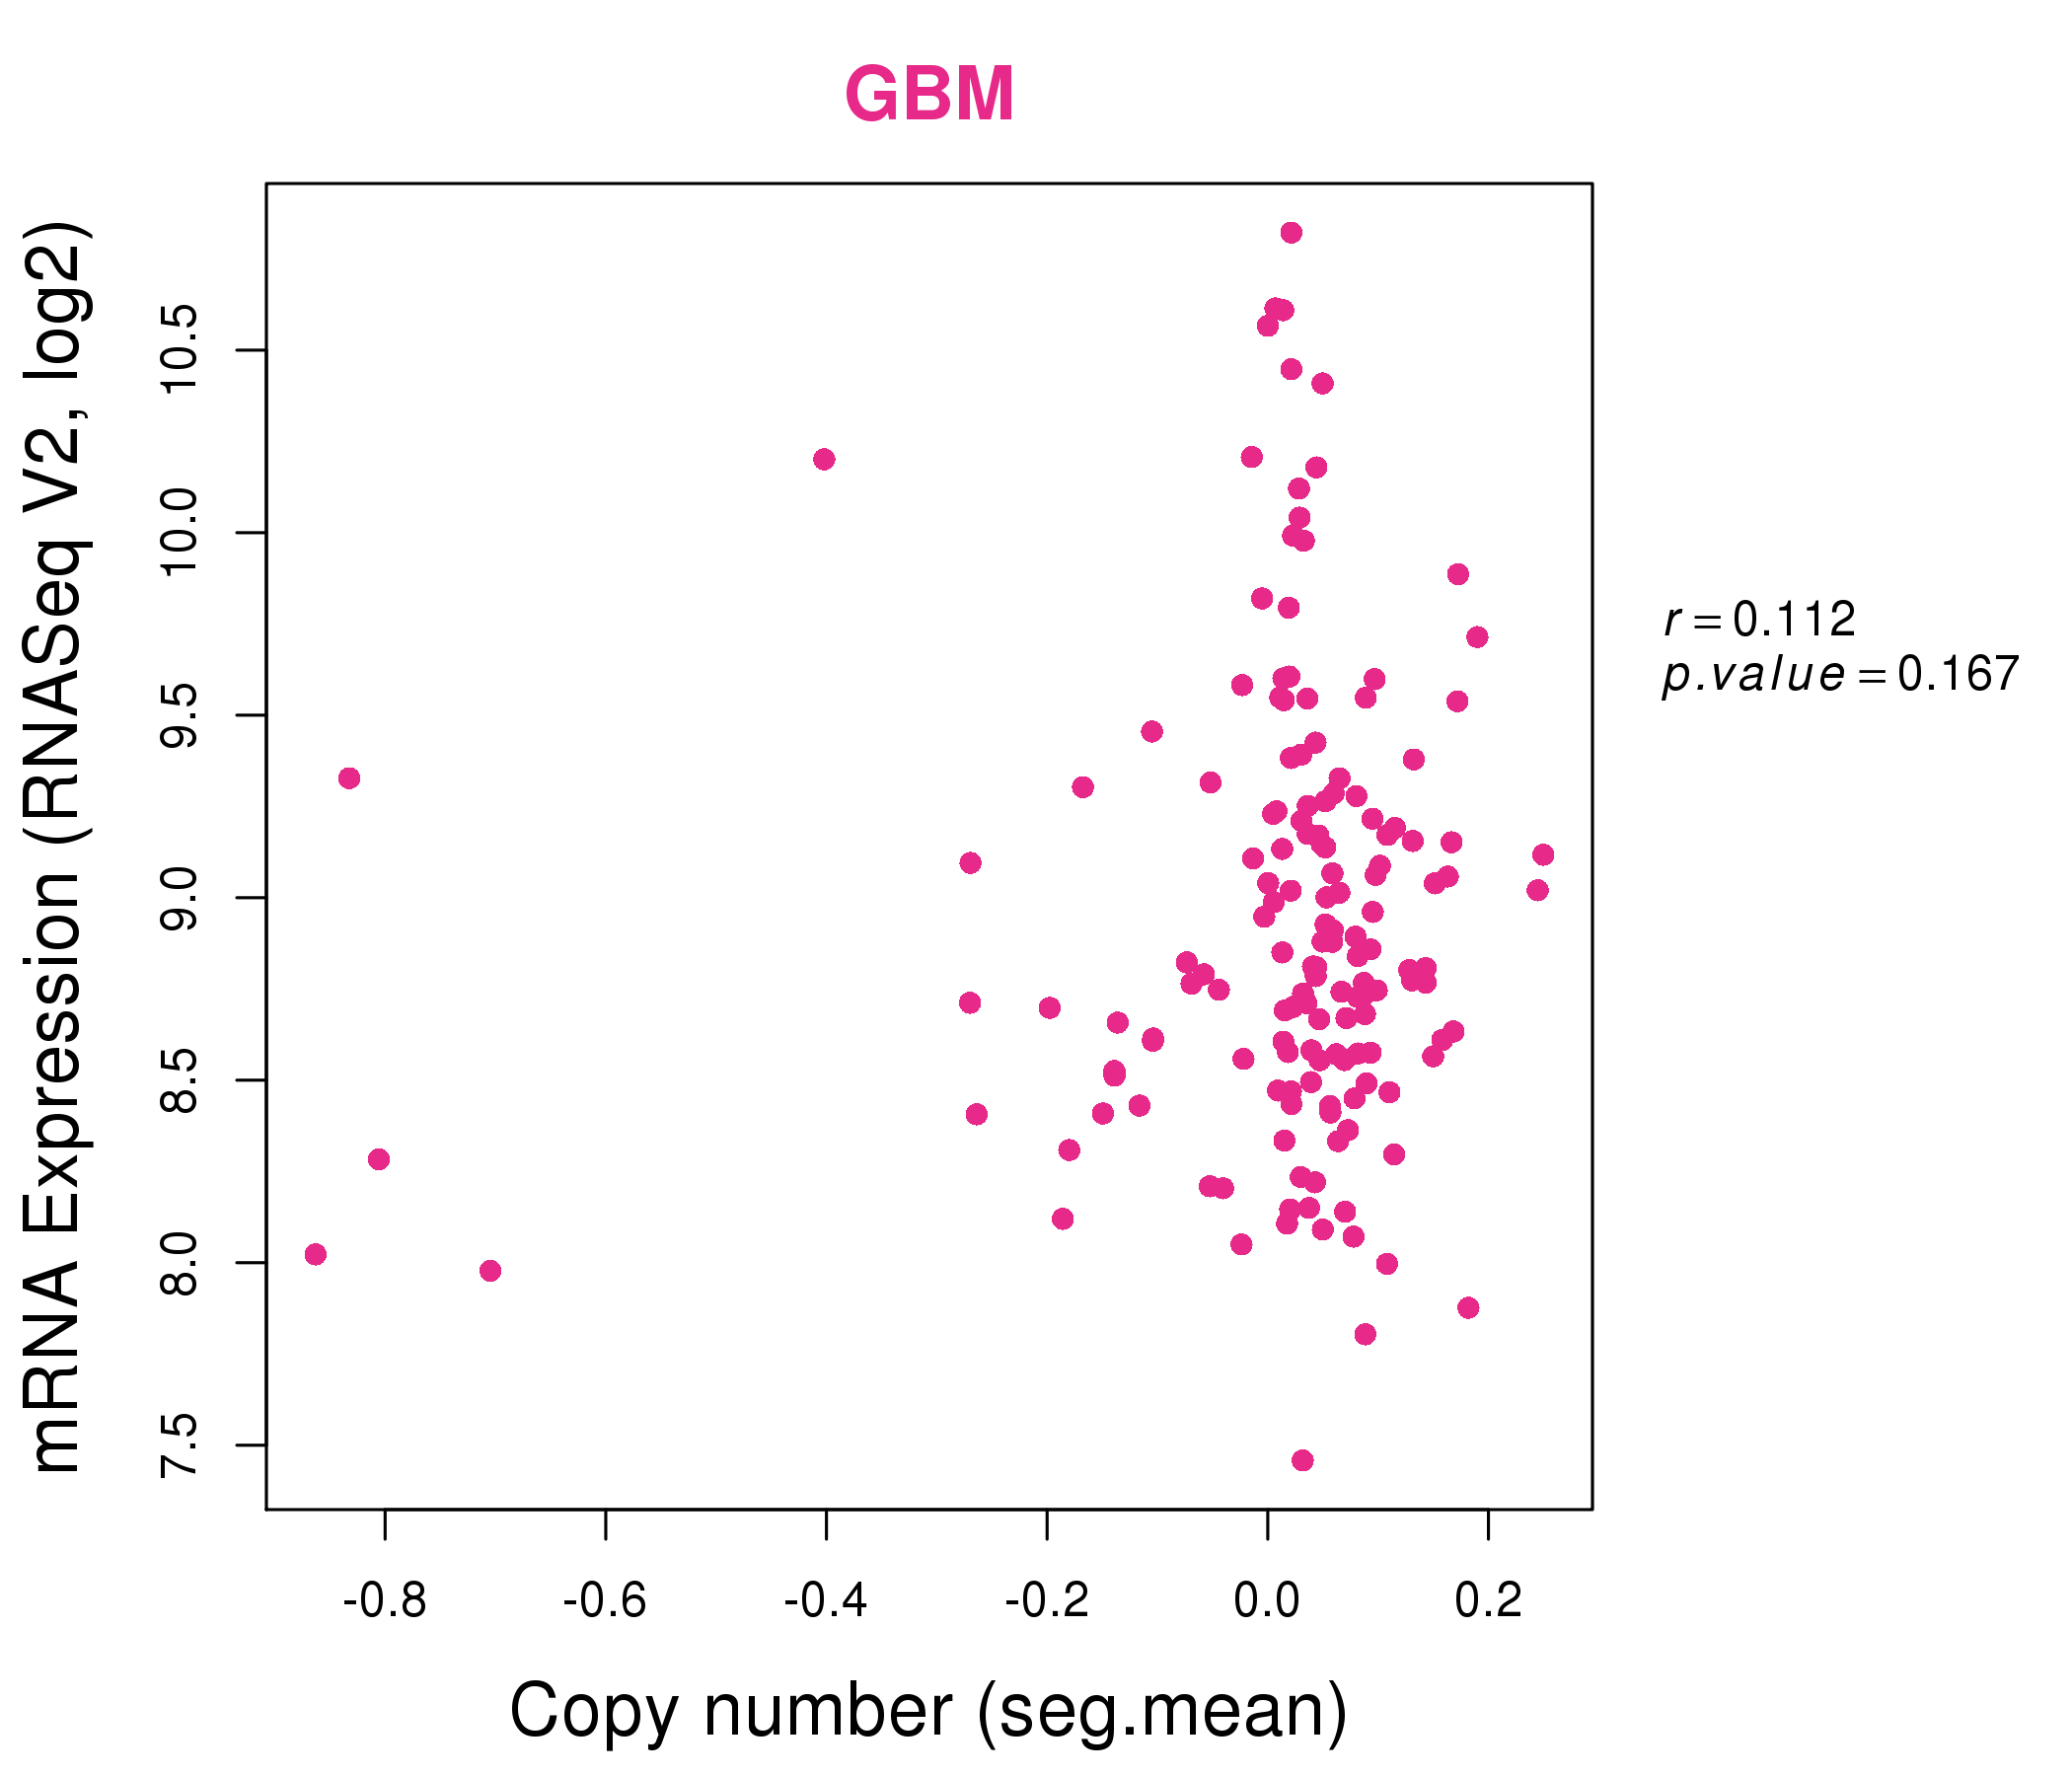
| * This plots show the correlation between CNV and gene expression. |
: Open all plots for all cancer types
 |
|
 |
|
| Top |
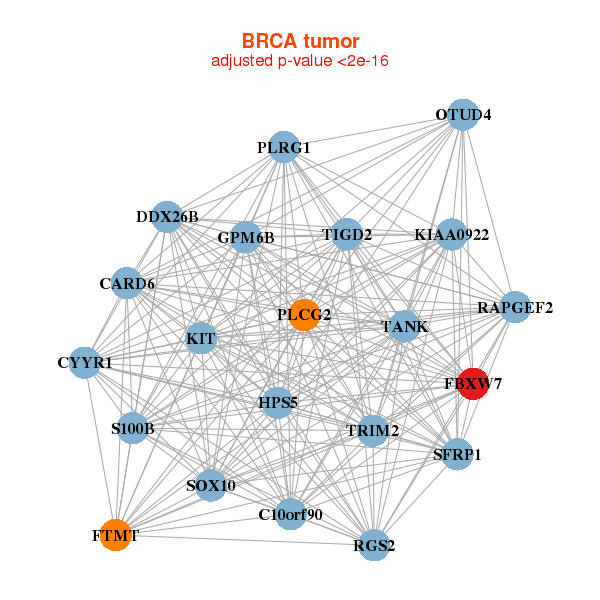
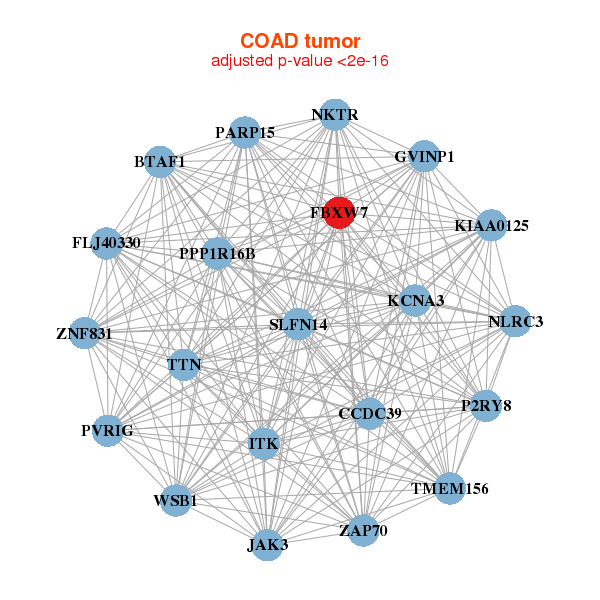
| Gene-Gene Network Information |
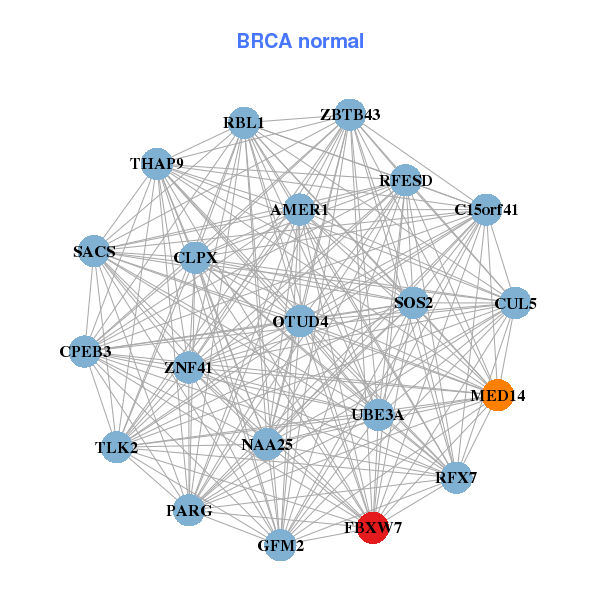
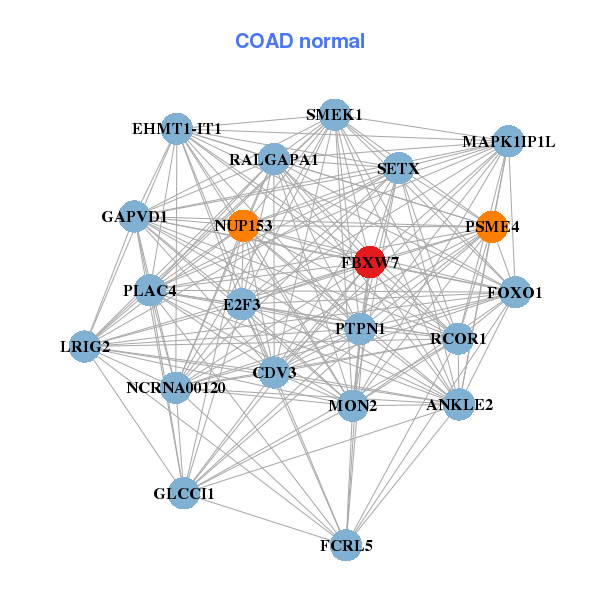
| * Co-Expression network figures were drawn using R package igraph. Only the top 20 genes with the highest correlations were shown. Red circle: input gene, orange circle: cell metabolism gene, sky circle: other gene |
: Open all plots for all cancer types
 |
| ||||
| C10orf90,CARD6,CYYR1,DDX26B,FBXW7,FTMT,GPM6B, HPS5,KIAA0922,KIT,OTUD4,PLCG2,PLRG1,RAPGEF2, RGS2,S100B,SFRP1,SOX10,TANK,TIGD2,TRIM2 | C15orf41,CLPX,CPEB3,CUL5,AMER1,FBXW7,GFM2, MED14,NAA25,OTUD4,PARG,RBL1,RFESD,RFX7, SACS,SOS2,THAP9,TLK2,UBE3A,ZBTB43,ZNF41 | ||||
 |
| ||||
| BTAF1,CCDC39,FBXW7,FLJ40330,GVINP1,ITK,JAK3, KCNA3,KIAA0125,NKTR,NLRC3,P2RY8,PARP15,PPP1R16B, PVRIG,SLFN14,TMEM156,TTN,WSB1,ZAP70,ZNF831 | ANKLE2,CDV3,E2F3,FBXW7,FCRL5,EHMT1-IT1,FOXO1, GAPVD1,GLCCI1,LRIG2,MAPK1IP1L,MON2,NCRNA00120,NUP153, PLAC4,PSME4,PTPN1,RALGAPA1,RCOR1,SETX,SMEK1 |
| * Co-Expression network figures were drawn using R package igraph. Only the top 20 genes with the highest correlations were shown. Red circle: input gene, orange circle: cell metabolism gene, sky circle: other gene |
: Open all plots for all cancer types
| Top |
: Open all interacting genes' information including KEGG pathway for all interacting genes from DAVID
| Top |
| Pharmacological Information for FBXW7 |
| DB Category | DB Name | DB's ID and Url link |
| Organism-specific databases | PharmGKB | PA28054; -. |
| Organism-specific databases | CTD | 55294; -. |
| * Gene Centered Interaction Network. |
 |
| * Drug Centered Interaction Network. |
| DrugBank ID | Target Name | Drug Groups | Generic Name | Drug Centered Network | Drug Structure |
| DB00877 | F-box and WD repeat domain containing 7, E3 ubiquitin protein ligase | approved; investigational | Sirolimus | 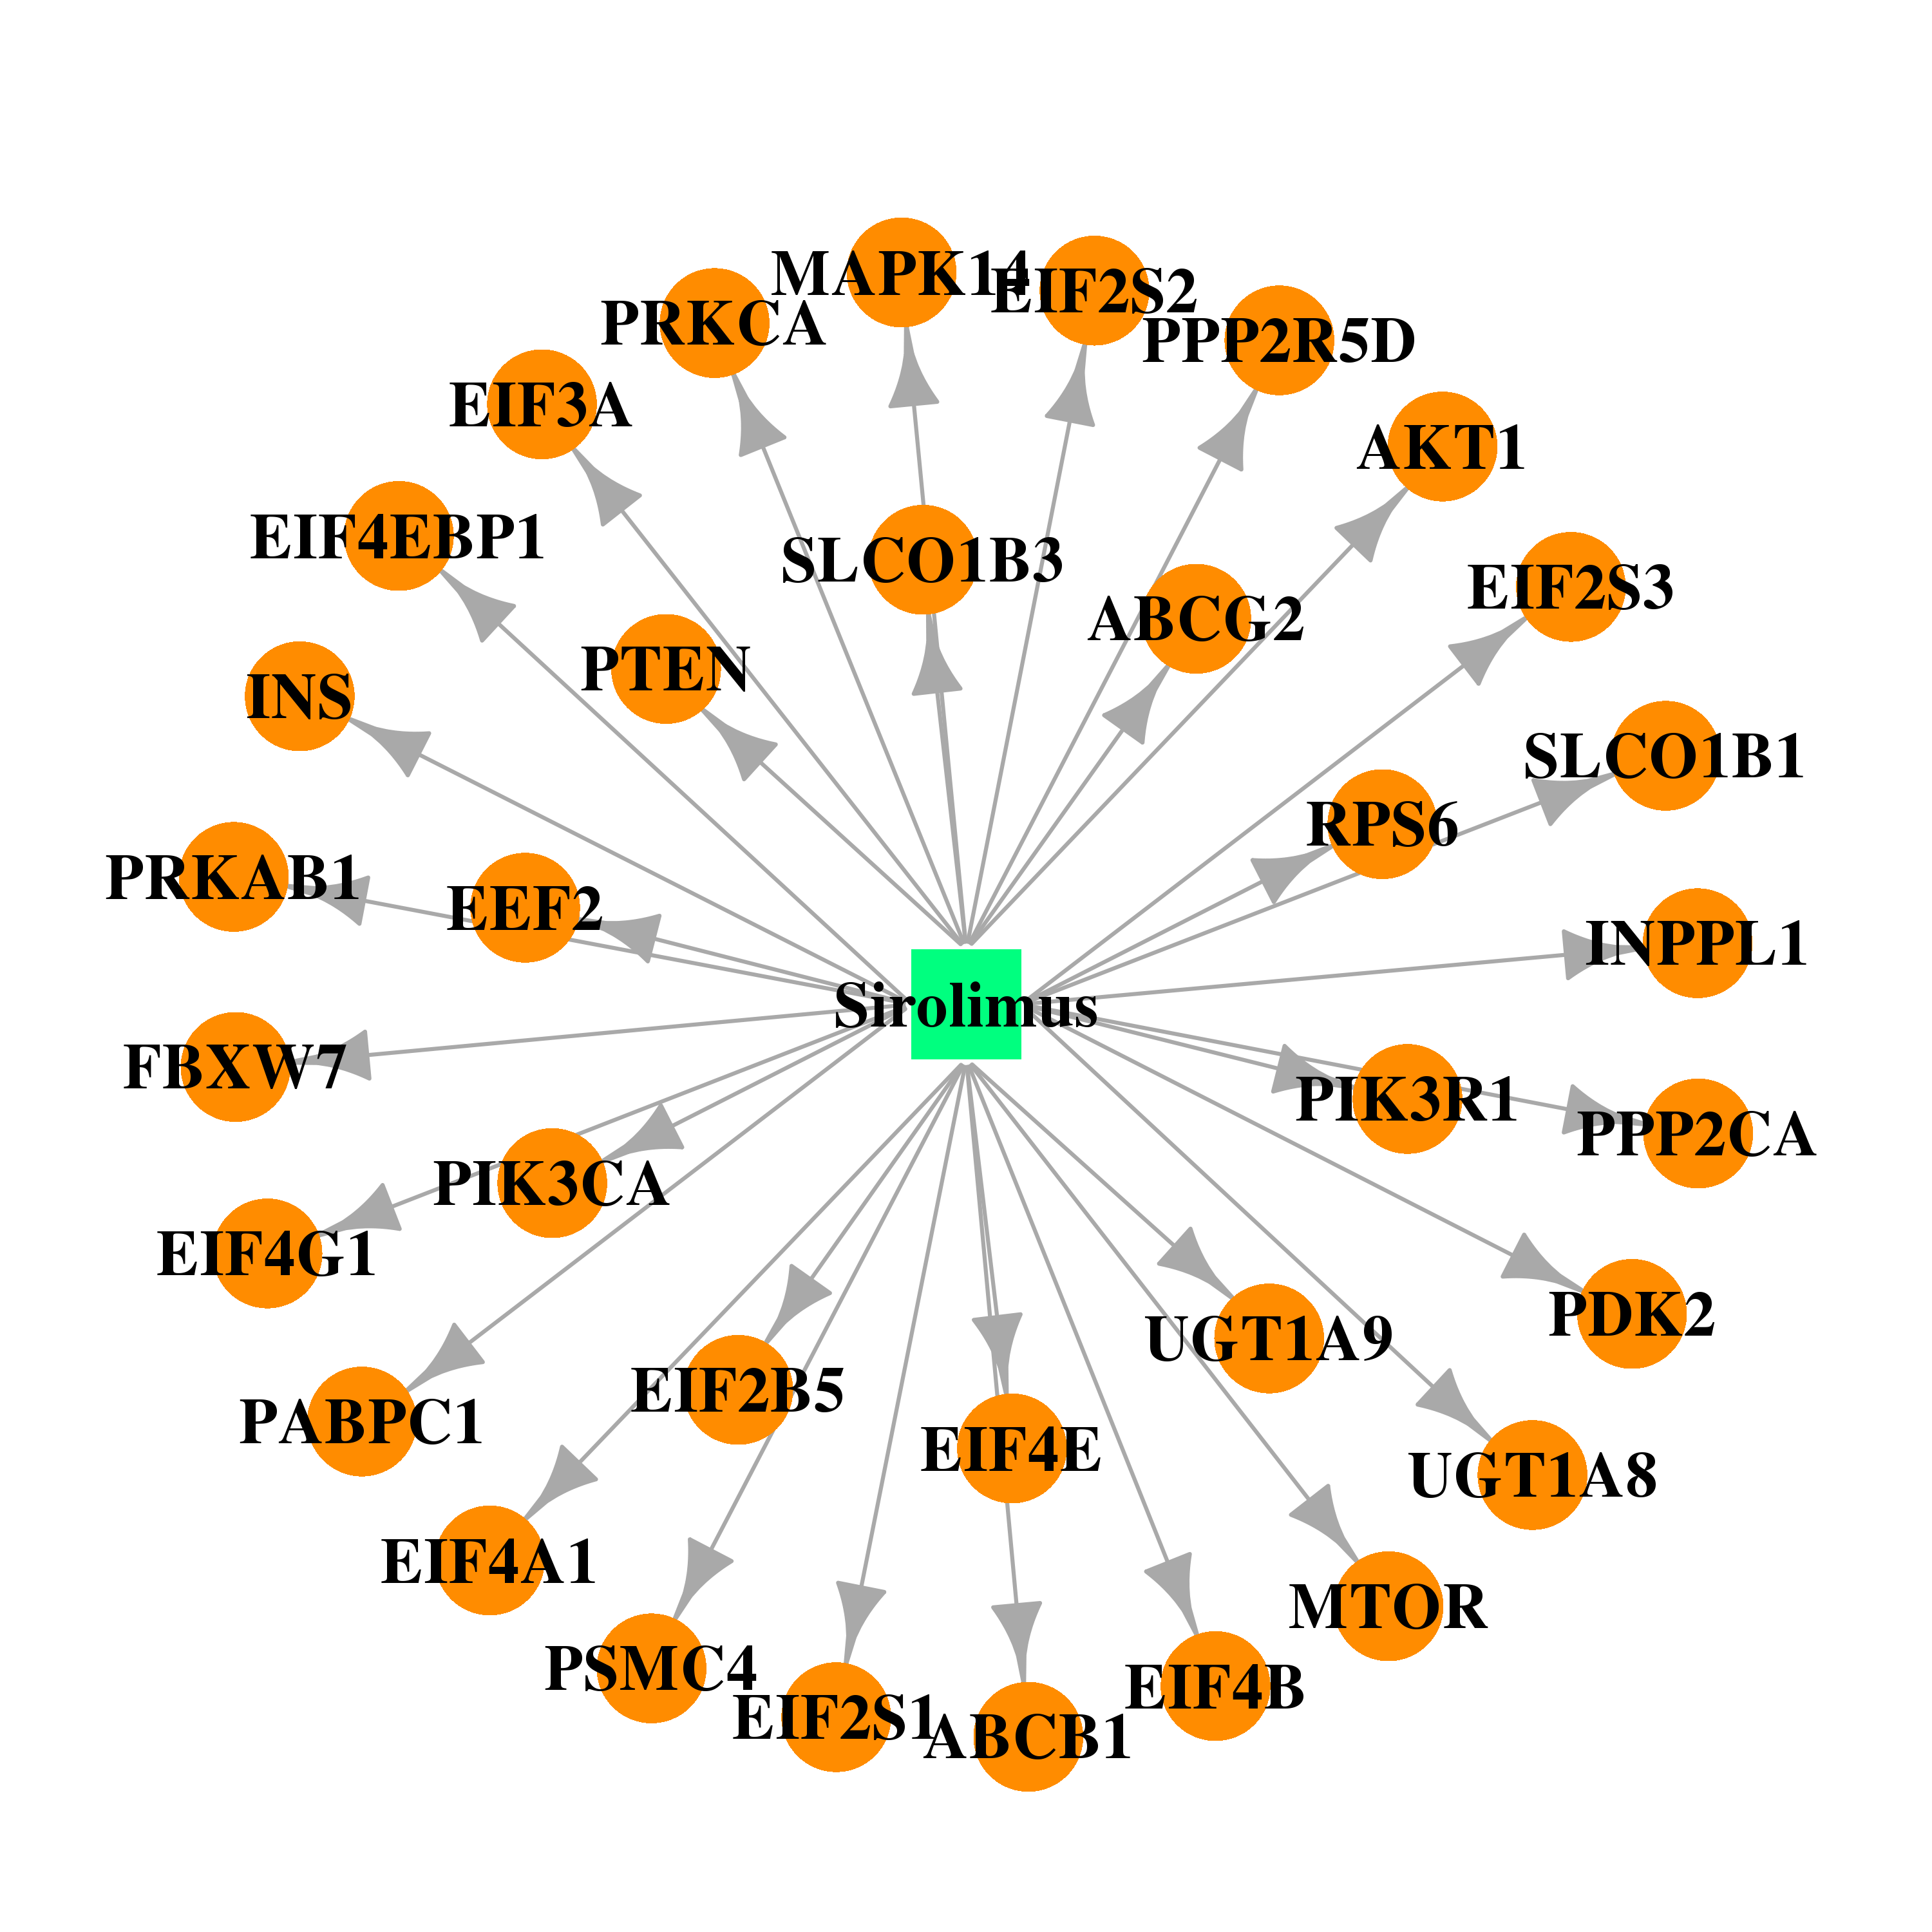 | 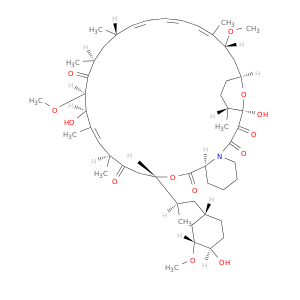 |
| Top |
| Cross referenced IDs for FBXW7 |
| * We obtained these cross-references from Uniprot database. It covers 150 different DBs, 18 categories. http://www.uniprot.org/help/cross_references_section |
: Open all cross reference information
|
Copyright © 2016-Present - The Univsersity of Texas Health Science Center at Houston @ |