|
||||||||||||||||||||
| |
| Phenotypic Information (metabolism pathway, cancer, disease, phenome) |
| |
| |
| Gene-Gene Network Information: Co-Expression Network, Interacting Genes & KEGG |
| |
|


| Gene Summary for PI4K2A |
| Top |
| Phenotypic Information for PI4K2A(metabolism pathway, cancer, disease, phenome) |
| Cancer | CGAP: PI4K2A |
| Familial Cancer Database: PI4K2A | |
| * This gene is included in those cancer gene databases. |
|
|
|
|
|
|
| ||||||||||||||
Oncogene 1 | Significant driver gene in | |||||||||||||||||||
| cf) number; DB name 1 Oncogene; http://nar.oxfordjournals.org/content/35/suppl_1/D721.long, 2 Tumor Suppressor gene; https://bioinfo.uth.edu/TSGene/, 3 Cancer Gene Census; http://www.nature.com/nrc/journal/v4/n3/abs/nrc1299.html, 4 CancerGenes; http://nar.oxfordjournals.org/content/35/suppl_1/D721.long, 5 Network of Cancer Gene; http://ncg.kcl.ac.uk/index.php, 1Therapeutic Vulnerabilities in Cancer; http://cbio.mskcc.org/cancergenomics/statius/ |
| REACTOME_PHOSPHOLIPID_METABOLISM REACTOME_PI_METABOLISM REACTOME_METABOLISM_OF_LIPIDS_AND_LIPOPROTEINS | |
| OMIM | |
| Orphanet | |
| Disease | KEGG Disease: PI4K2A |
| MedGen: PI4K2A (Human Medical Genetics with Condition) | |
| ClinVar: PI4K2A | |
| Phenotype | MGI: PI4K2A (International Mouse Phenotyping Consortium) |
| PhenomicDB: PI4K2A | |
| Mutations for PI4K2A |
| * Under tables are showing count per each tissue to give us broad intuition about tissue specific mutation patterns.You can go to the detailed page for each mutation database's web site. |
| - Statistics for Tissue and Mutation type | Top |
 |
| - For Inter-chromosomal Variations |
| There's no inter-chromosomal structural variation. |
| - For Intra-chromosomal Variations |
| * Intra-chromosomal variantions includes 'intrachromosomal amplicon to amplicon', 'intrachromosomal amplicon to non-amplified dna', 'intrachromosomal deletion', 'intrachromosomal fold-back inversion', 'intrachromosomal inversion', 'intrachromosomal tandem duplication', 'Intrachromosomal unknown type', 'intrachromosomal with inverted orientation', 'intrachromosomal with non-inverted orientation'. |
 |
| Sample | Symbol_a | Chr_a | Start_a | End_a | Symbol_b | Chr_b | Start_b | End_b |
| ovary | PI4K2A | chr10 | 99401662 | 99401682 | PI4K2A | chr10 | 99402083 | 99402103 |
| ovary | PI4K2A | chr10 | 99423176 | 99423196 | PI4K2A | chr10 | 99405699 | 99405719 |
| cf) Tissue number; Tissue name (1;Breast, 2;Central_nervous_system, 3;Haematopoietic_and_lymphoid_tissue, 4;Large_intestine, 5;Liver, 6;Lung, 7;Ovary, 8;Pancreas, 9;Prostate, 10;Skin, 11;Soft_tissue, 12;Upper_aerodigestive_tract) |
| * From mRNA Sanger sequences, Chitars2.0 arranged chimeric transcripts. This table shows PI4K2A related fusion information. |
| ID | Head Gene | Tail Gene | Accession | Gene_a | qStart_a | qEnd_a | Chromosome_a | tStart_a | tEnd_a | Gene_a | qStart_a | qEnd_a | Chromosome_a | tStart_a | tEnd_a |
| CA307215 | PI4K2A | 18 | 537 | 10 | 99435289 | 99435808 | PFDN5 | 534 | 725 | 12 | 53691852 | 53693162 | |
| AK129943 | PI4K2A | 1 | 172 | 10 | 99374243 | 99374414 | ALDH3B1 | 168 | 1786 | 11 | 67787229 | 67796143 | |
| Top |
| There's no copy number variation information in COSMIC data for this gene. |
| Top |
|
 |
| Top |
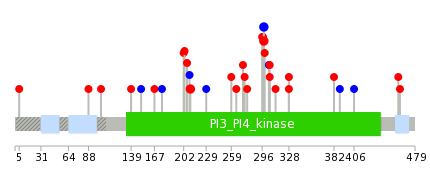
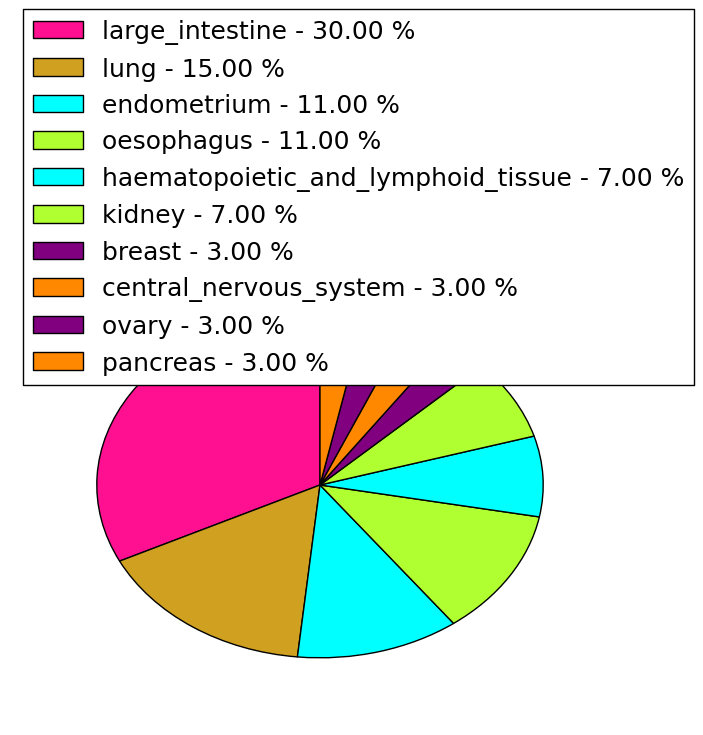
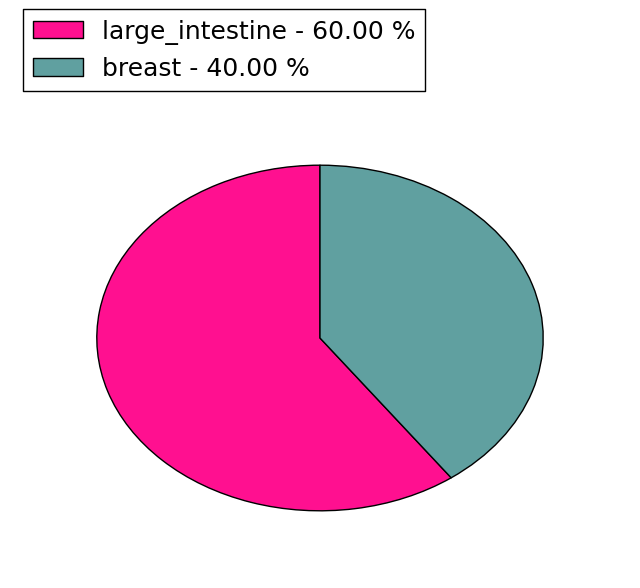
| Stat. for Non-Synonymous SNVs (# total SNVs=26) | (# total SNVs=5) |
 |  |
(# total SNVs=0) | (# total SNVs=0) |
| Top |
| * When you move the cursor on each content, you can see more deailed mutation information on the Tooltip. Those are primary_site,primary_histology,mutation(aa),pubmedID. |
| GRCh37 position | Mutation(aa) | Unique sampleID count |
| chr10:99416701-99416701 | p.V298M | 2 |
| chr10:99410891-99410891 | p.R210H | 2 |
| chr10:99416703-99416703 | p.V298V | 2 |
| chr10:99422724-99422724 | p.R328Q | 1 |
| chr10:99410870-99410870 | p.L203P | 1 |
| chr10:99416695-99416695 | p.R296W | 1 |
| chr10:99426254-99426254 | p.D382Y | 1 |
| chr10:99410880-99410880 | p.N206K | 1 |
| chr10:99416699-99416699 | p.L297S | 1 |
| chr10:99400513-99400513 | p.S5N | 1 |
| Top |
|
 |
| Point Mutation/ Tissue ID | 1 | 2 | 3 | 4 | 5 | 6 | 7 | 8 | 9 | 10 | 11 | 12 | 13 | 14 | 15 | 16 | 17 | 18 | 19 | 20 |
| # sample | 2 | 2 | 9 | 1 | 1 | 1 | 3 | 1 | 1 | 2 | 3 | 3 | ||||||||
| # mutation | 2 | 2 | 8 | 1 | 1 | 1 | 3 | 1 | 1 | 2 | 3 | 3 | ||||||||
| nonsynonymous SNV | 1 | 1 | 6 | 1 | 1 | 1 | 3 | 1 | 1 | 3 | 3 | |||||||||
| synonymous SNV | 1 | 1 | 2 | 1 | 1 |
| cf) Tissue ID; Tissue type (1; BLCA[Bladder Urothelial Carcinoma], 2; BRCA[Breast invasive carcinoma], 3; CESC[Cervical squamous cell carcinoma and endocervical adenocarcinoma], 4; COAD[Colon adenocarcinoma], 5; GBM[Glioblastoma multiforme], 6; Glioma Low Grade, 7; HNSC[Head and Neck squamous cell carcinoma], 8; KICH[Kidney Chromophobe], 9; KIRC[Kidney renal clear cell carcinoma], 10; KIRP[Kidney renal papillary cell carcinoma], 11; LAML[Acute Myeloid Leukemia], 12; LUAD[Lung adenocarcinoma], 13; LUSC[Lung squamous cell carcinoma], 14; OV[Ovarian serous cystadenocarcinoma ], 15; PAAD[Pancreatic adenocarcinoma], 16; PRAD[Prostate adenocarcinoma], 17; SKCM[Skin Cutaneous Melanoma], 18:STAD[Stomach adenocarcinoma], 19:THCA[Thyroid carcinoma], 20:UCEC[Uterine Corpus Endometrial Carcinoma]) |
| Top |
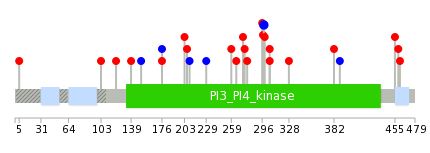
| * We represented just top 10 SNVs. When you move the cursor on each content, you can see more deailed mutation information on the Tooltip. Those are primary_site, primary_histology, mutation(aa), pubmedID. |
| Genomic Position | Mutation(aa) | Unique sampleID count |
| chr10:99416703 | p.V298V | 2 |
| chr10:99410889 | p.W273R | 1 |
| chr10:99416722 | p.R275Q | 1 |
| chr10:99416092 | p.E278K | 1 |
| chr10:99416723 | p.S5N | 1 |
| chr10:99400513 | p.R296W | 1 |
| chr10:99416585 | p.E103K | 1 |
| chr10:99422723 | p.L297S | 1 |
| chr10:99400806 | p.I121M | 1 |
| chr10:99416602 | p.F139V | 1 |
| * Copy number data were extracted from TCGA using R package TCGA-Assembler. The URLs of all public data files on TCGA DCC data server were gathered on Jan-05-2015. Function ProcessCNAData in TCGA-Assembler package was used to obtain gene-level copy number value which is calculated as the average copy number of the genomic region of a gene. |
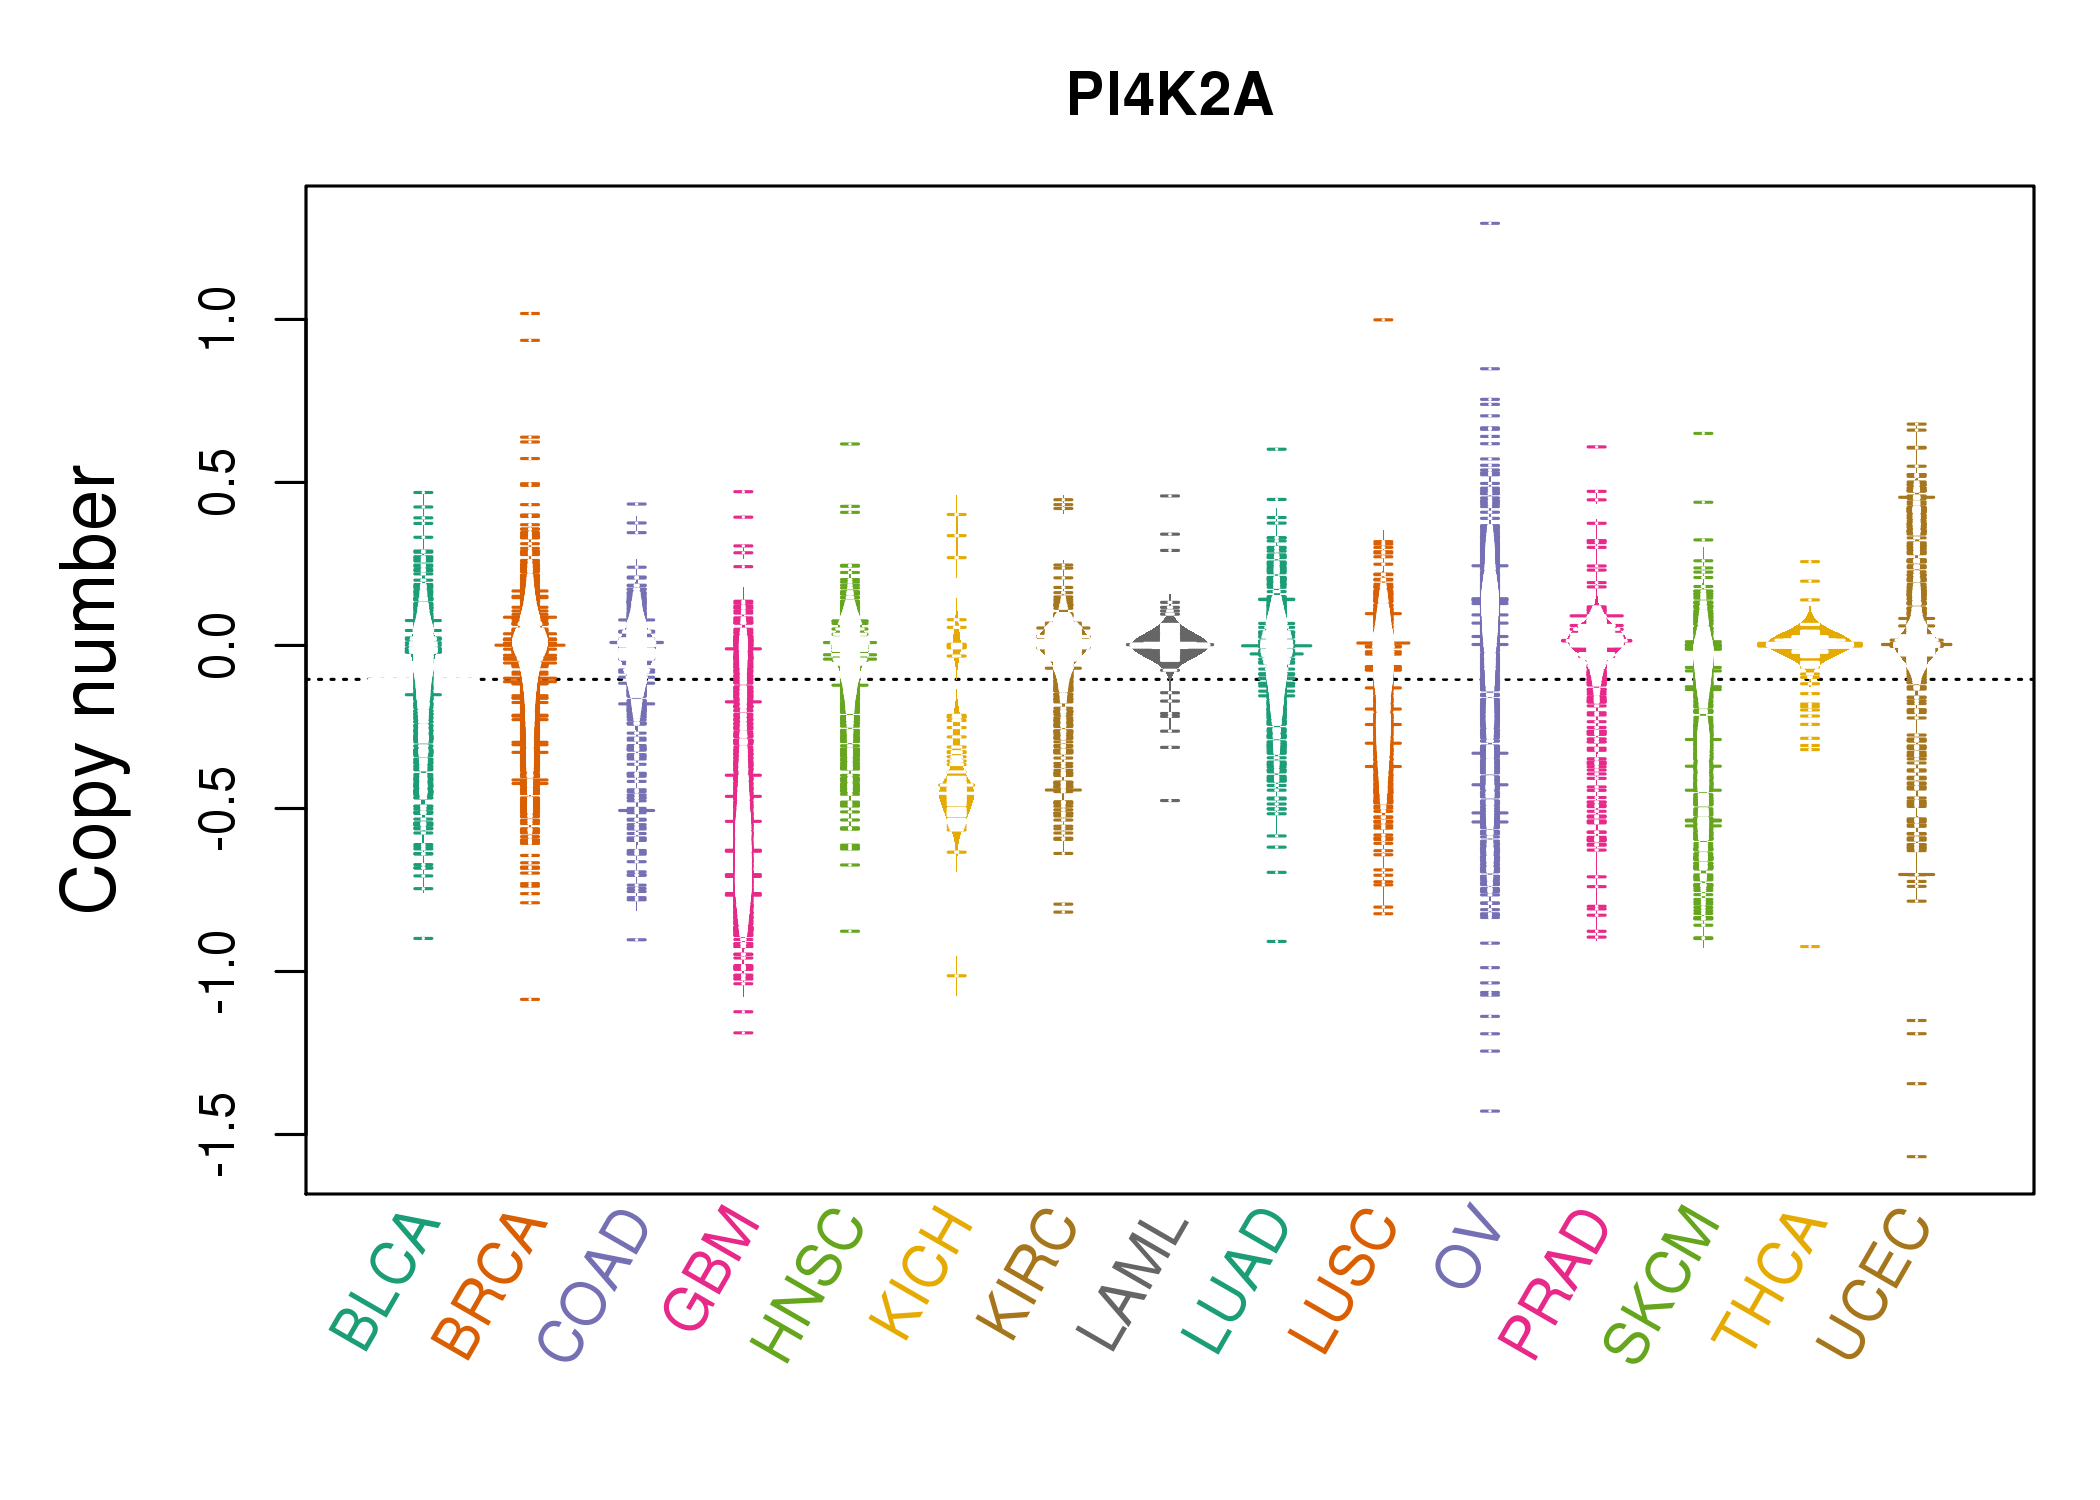 |
| cf) Tissue ID[Tissue type]: BLCA[Bladder Urothelial Carcinoma], BRCA[Breast invasive carcinoma], CESC[Cervical squamous cell carcinoma and endocervical adenocarcinoma], COAD[Colon adenocarcinoma], GBM[Glioblastoma multiforme], Glioma Low Grade, HNSC[Head and Neck squamous cell carcinoma], KICH[Kidney Chromophobe], KIRC[Kidney renal clear cell carcinoma], KIRP[Kidney renal papillary cell carcinoma], LAML[Acute Myeloid Leukemia], LUAD[Lung adenocarcinoma], LUSC[Lung squamous cell carcinoma], OV[Ovarian serous cystadenocarcinoma ], PAAD[Pancreatic adenocarcinoma], PRAD[Prostate adenocarcinoma], SKCM[Skin Cutaneous Melanoma], STAD[Stomach adenocarcinoma], THCA[Thyroid carcinoma], UCEC[Uterine Corpus Endometrial Carcinoma] |
| Top |
| Gene Expression for PI4K2A |
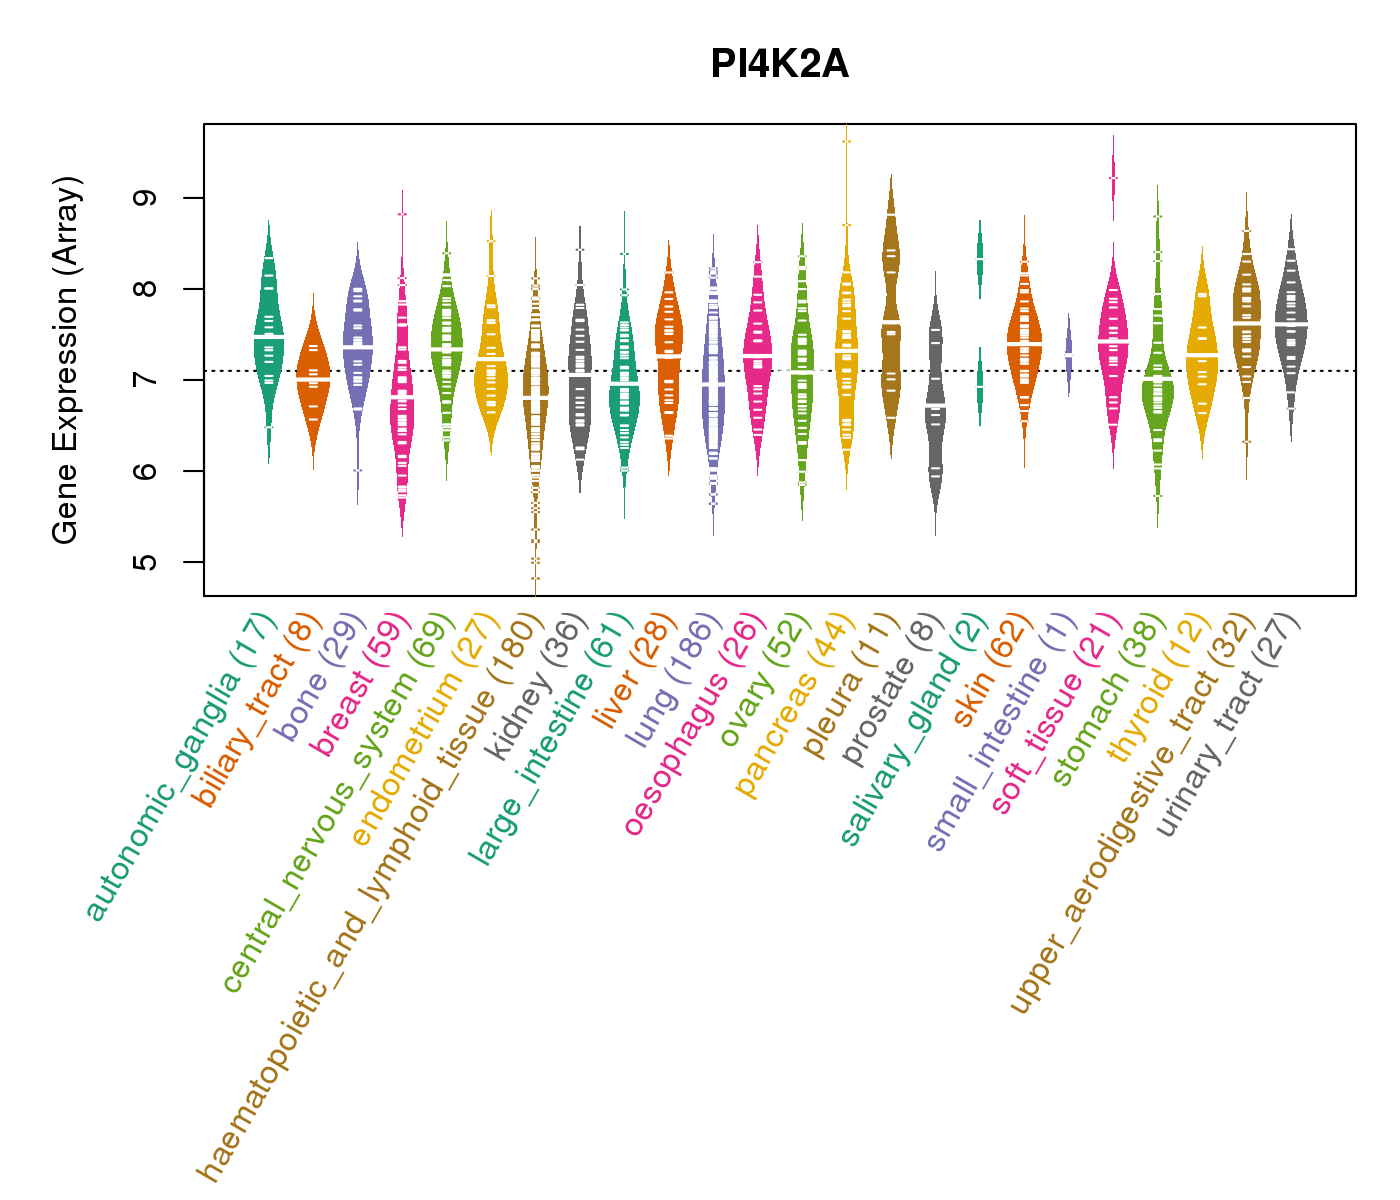
| * CCLE gene expression data were extracted from CCLE_Expression_Entrez_2012-10-18.res: Gene-centric RMA-normalized mRNA expression data. |
 |
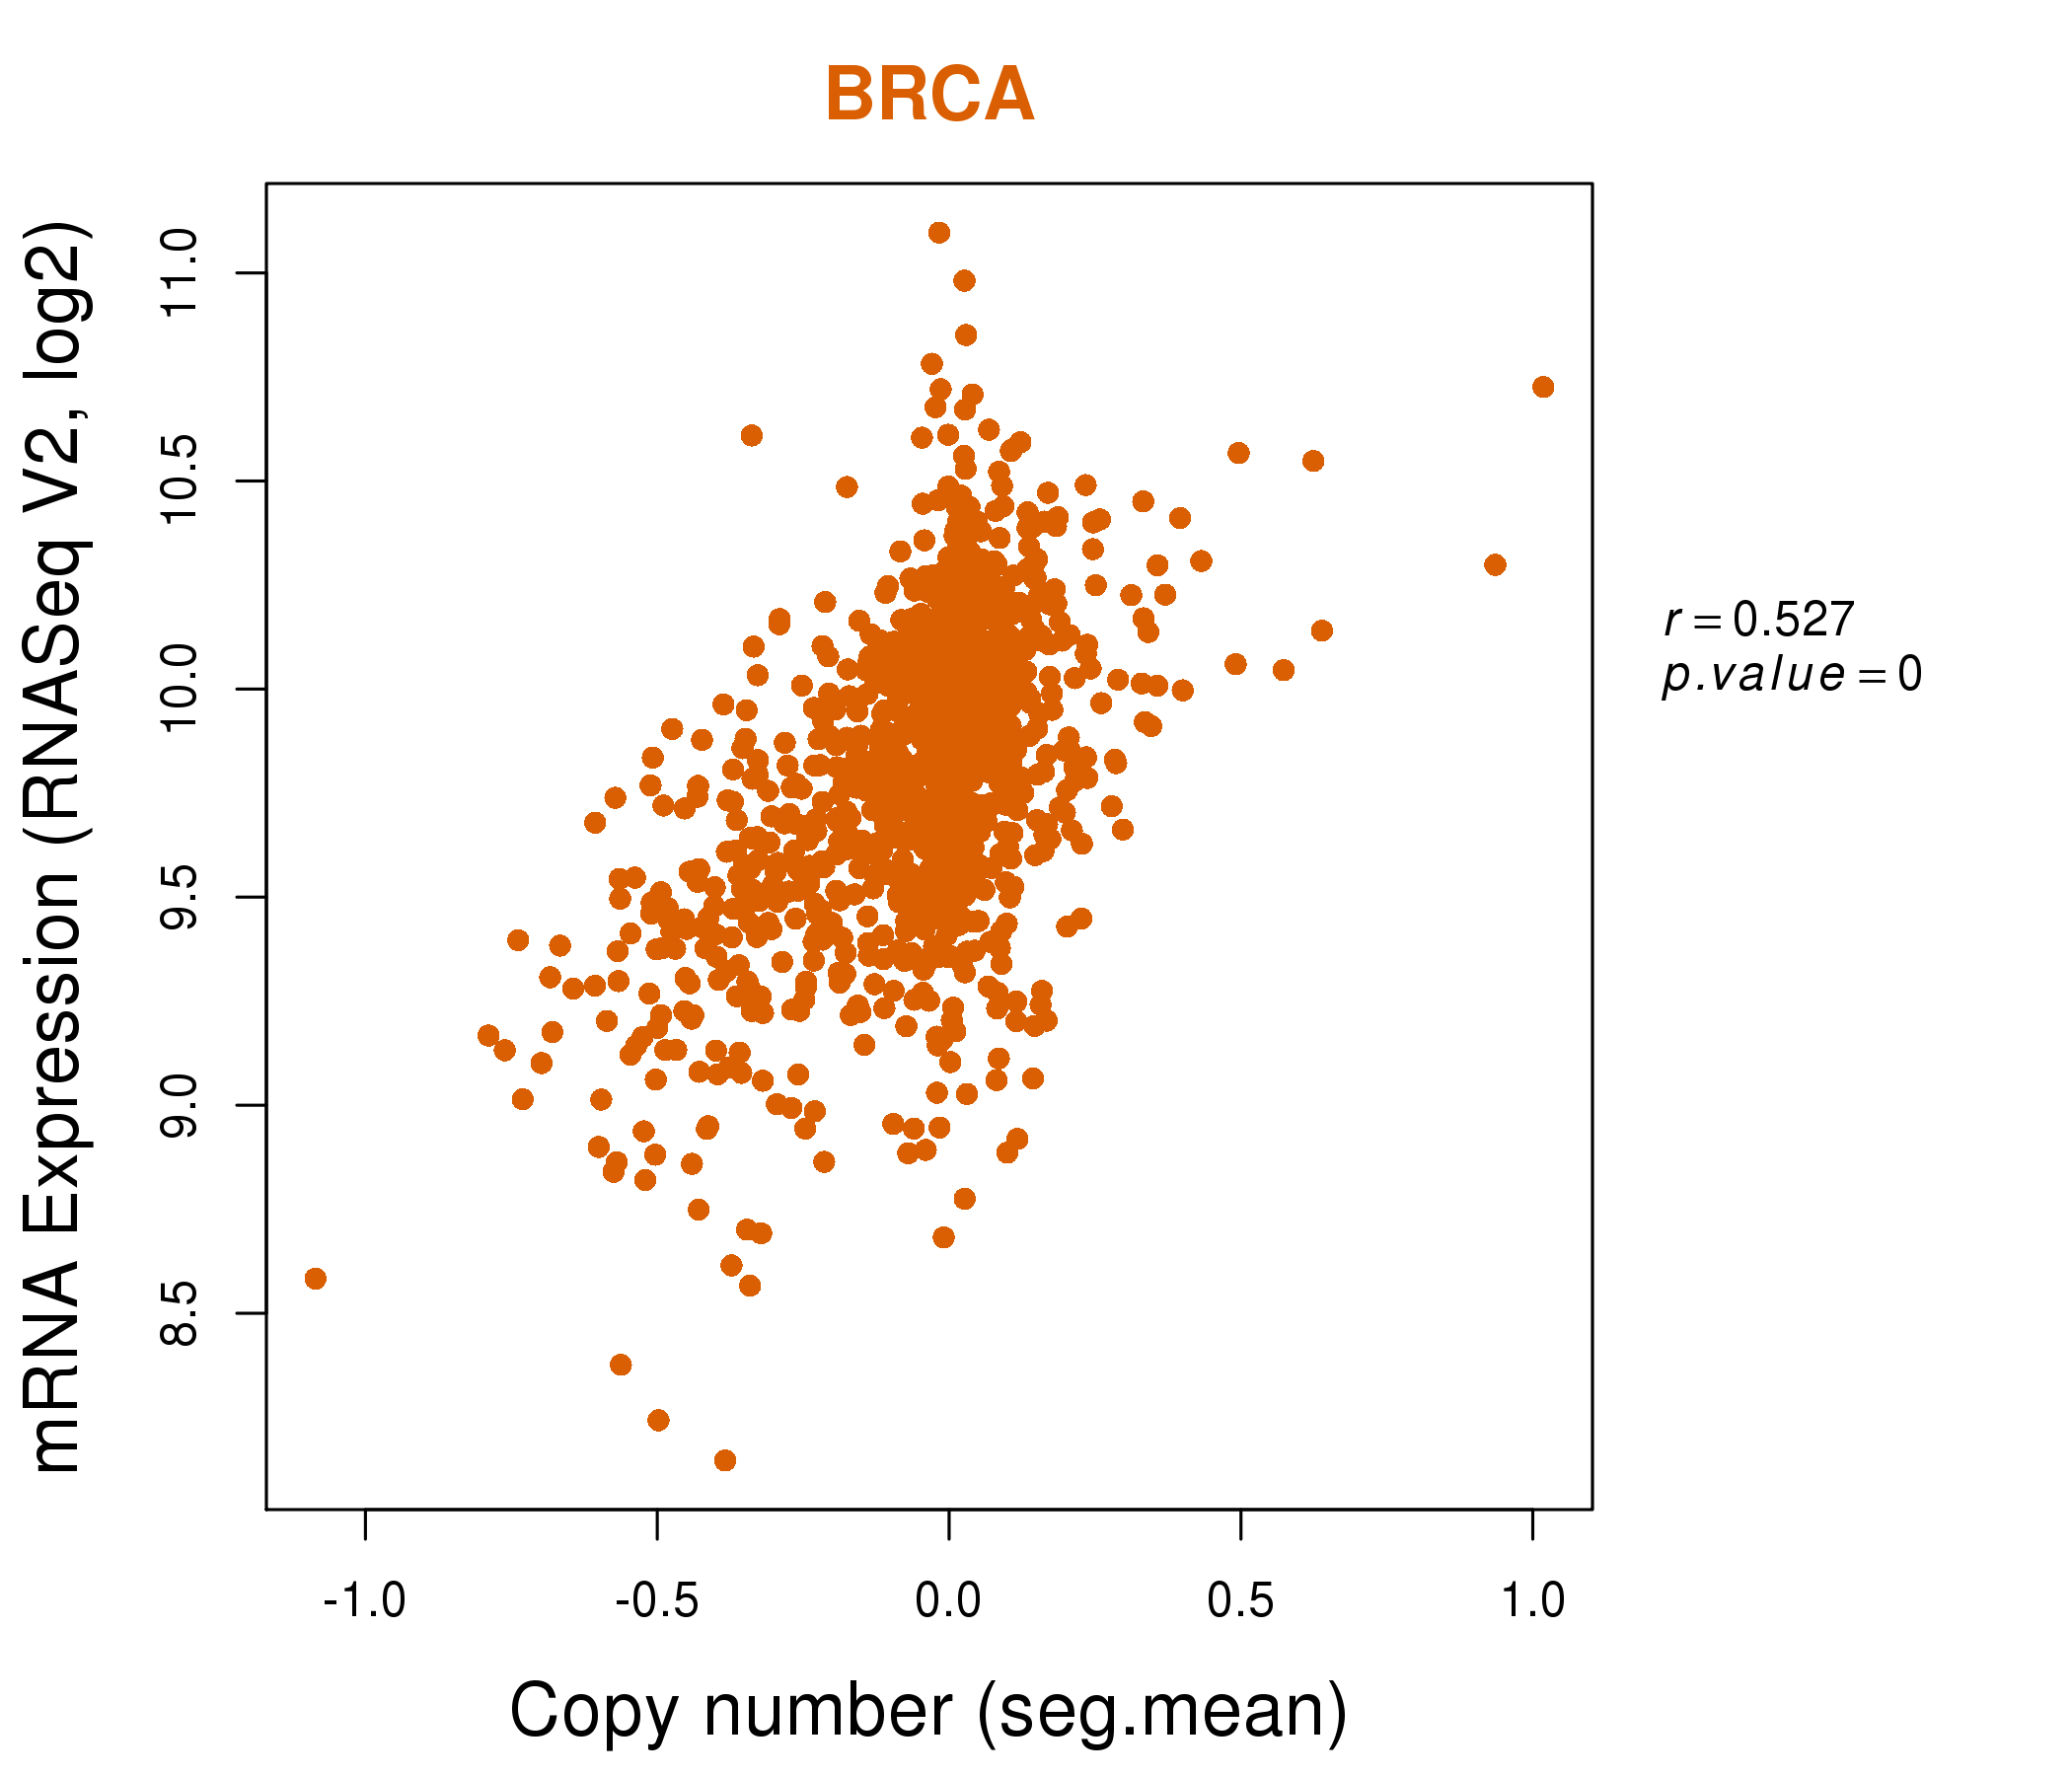
| * Normalized gene expression data of RNASeqV2 was extracted from TCGA using R package TCGA-Assembler. The URLs of all public data files on TCGA DCC data server were gathered at Jan-05-2015. Only eight cancer types have enough normal control samples for differential expression analysis. (t test, adjusted p<0.05 (using Benjamini-Hochberg FDR)) |
 |
| Top |
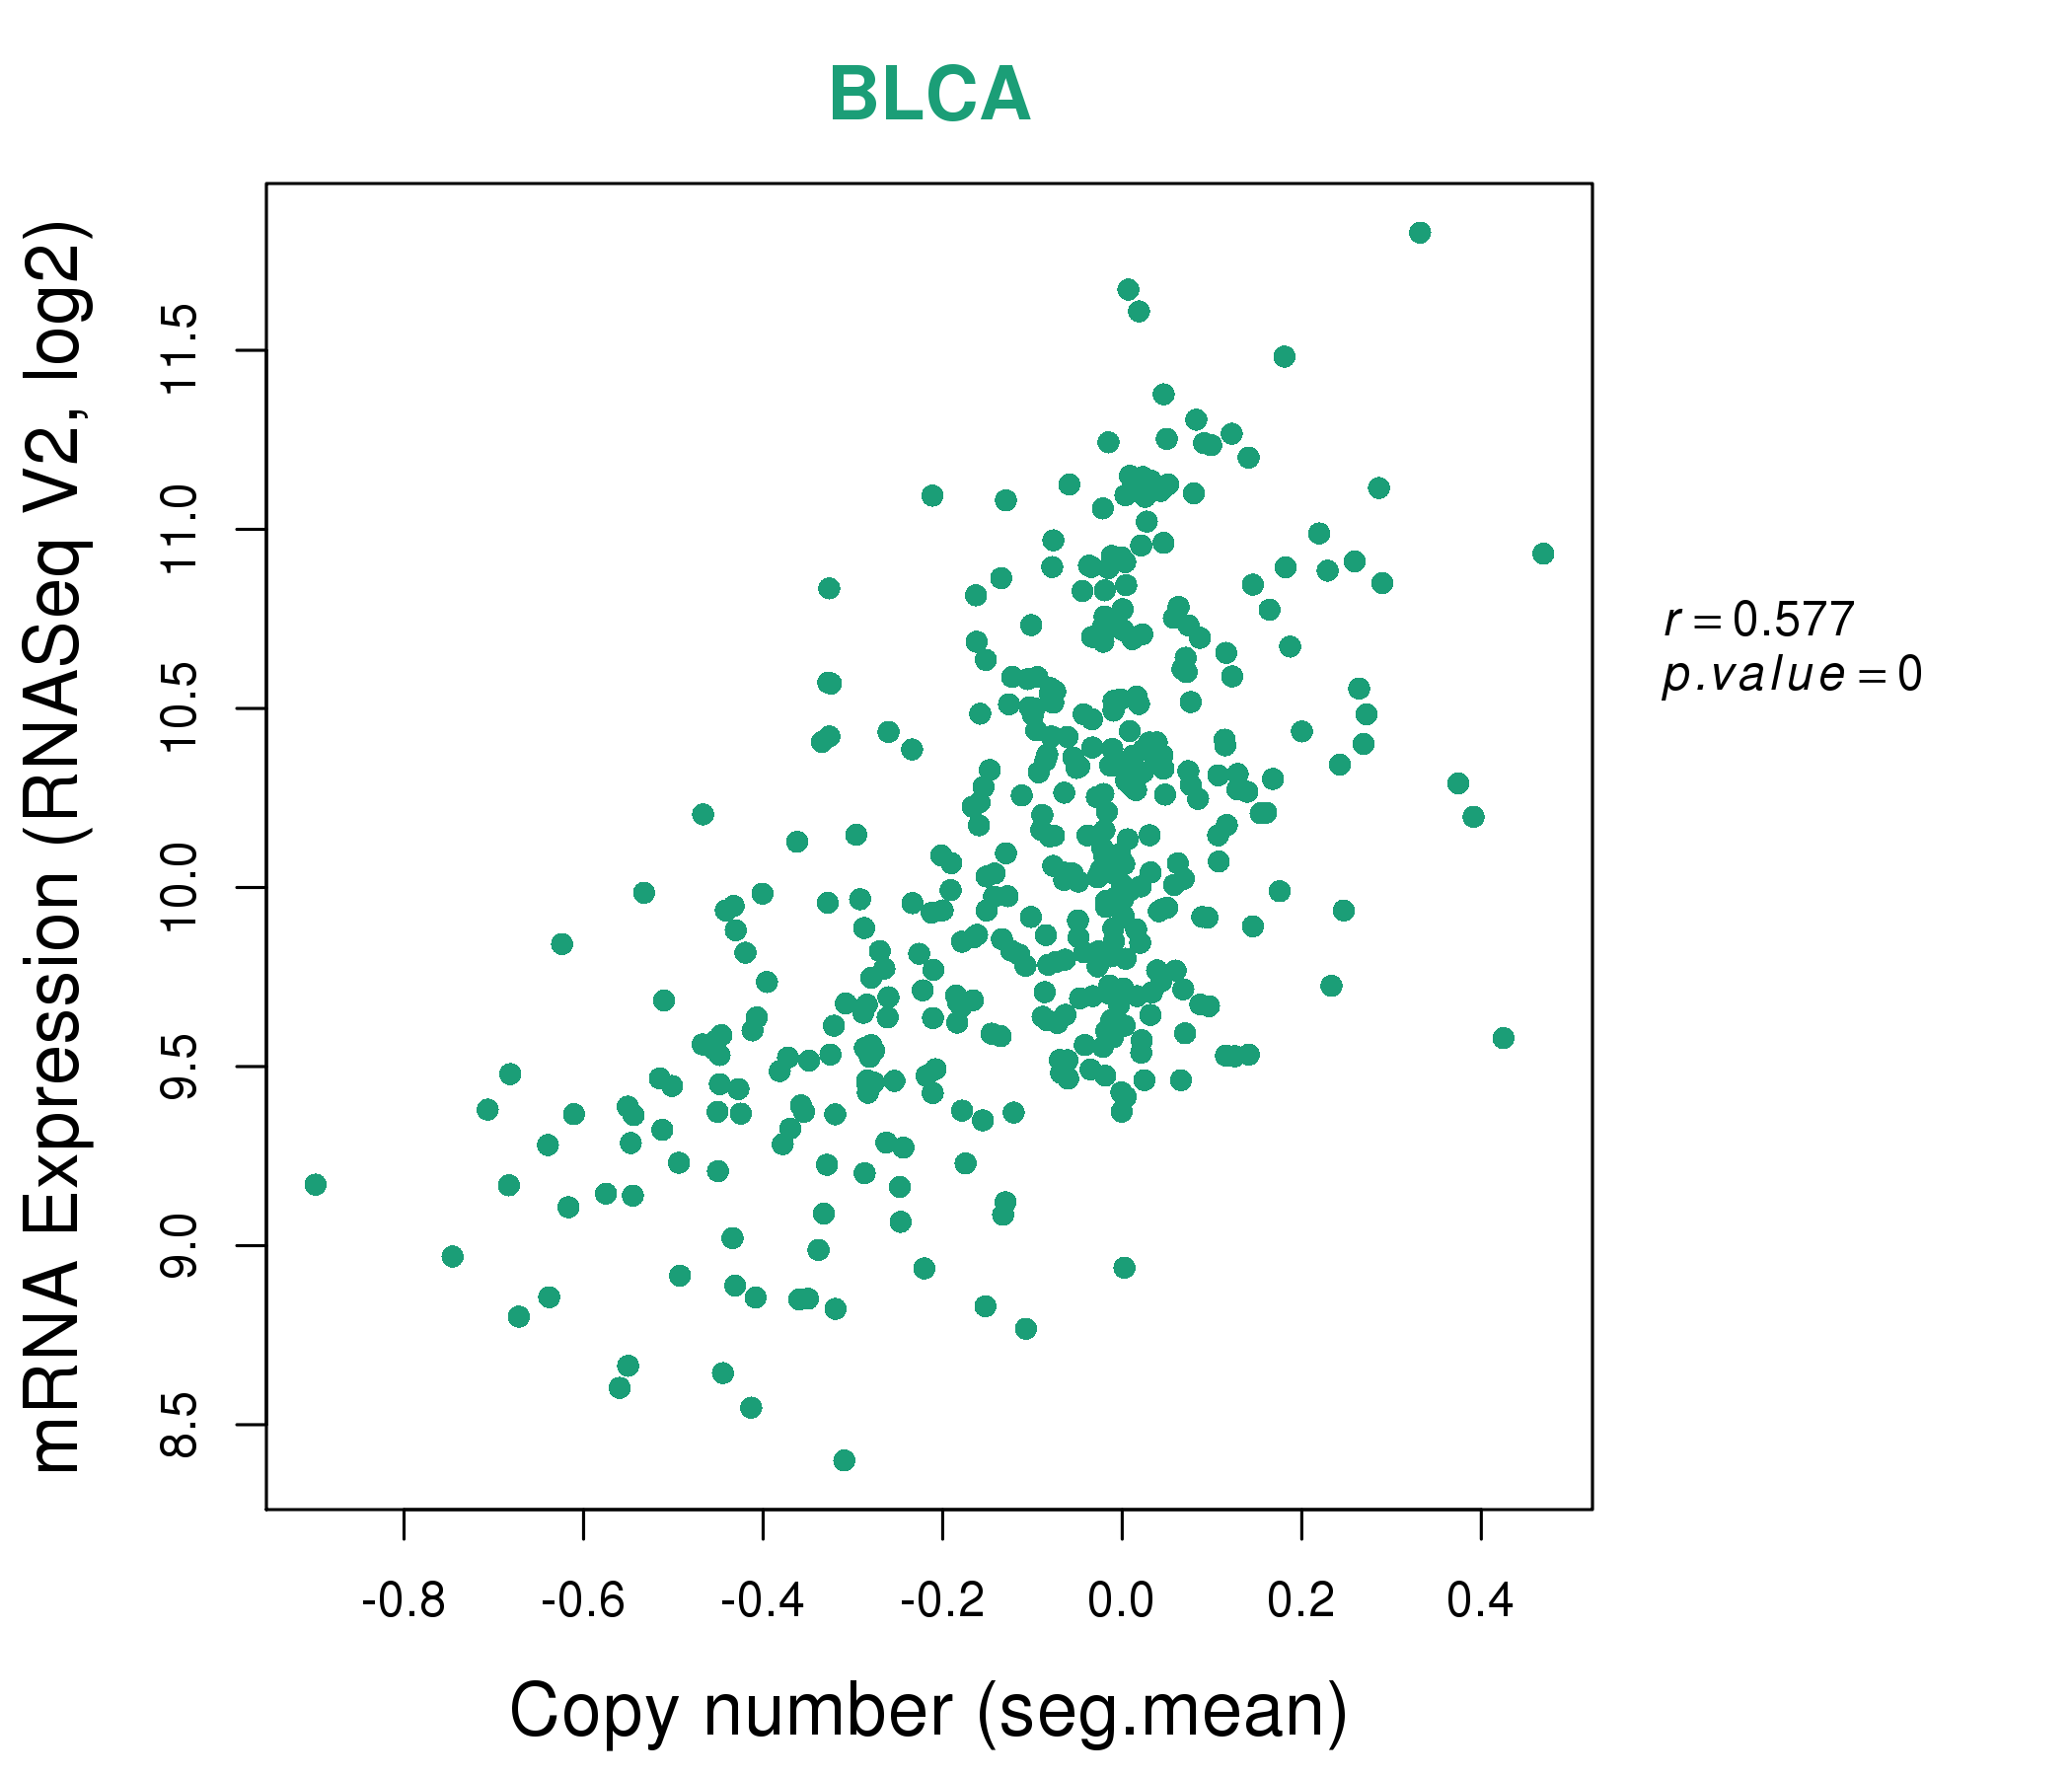
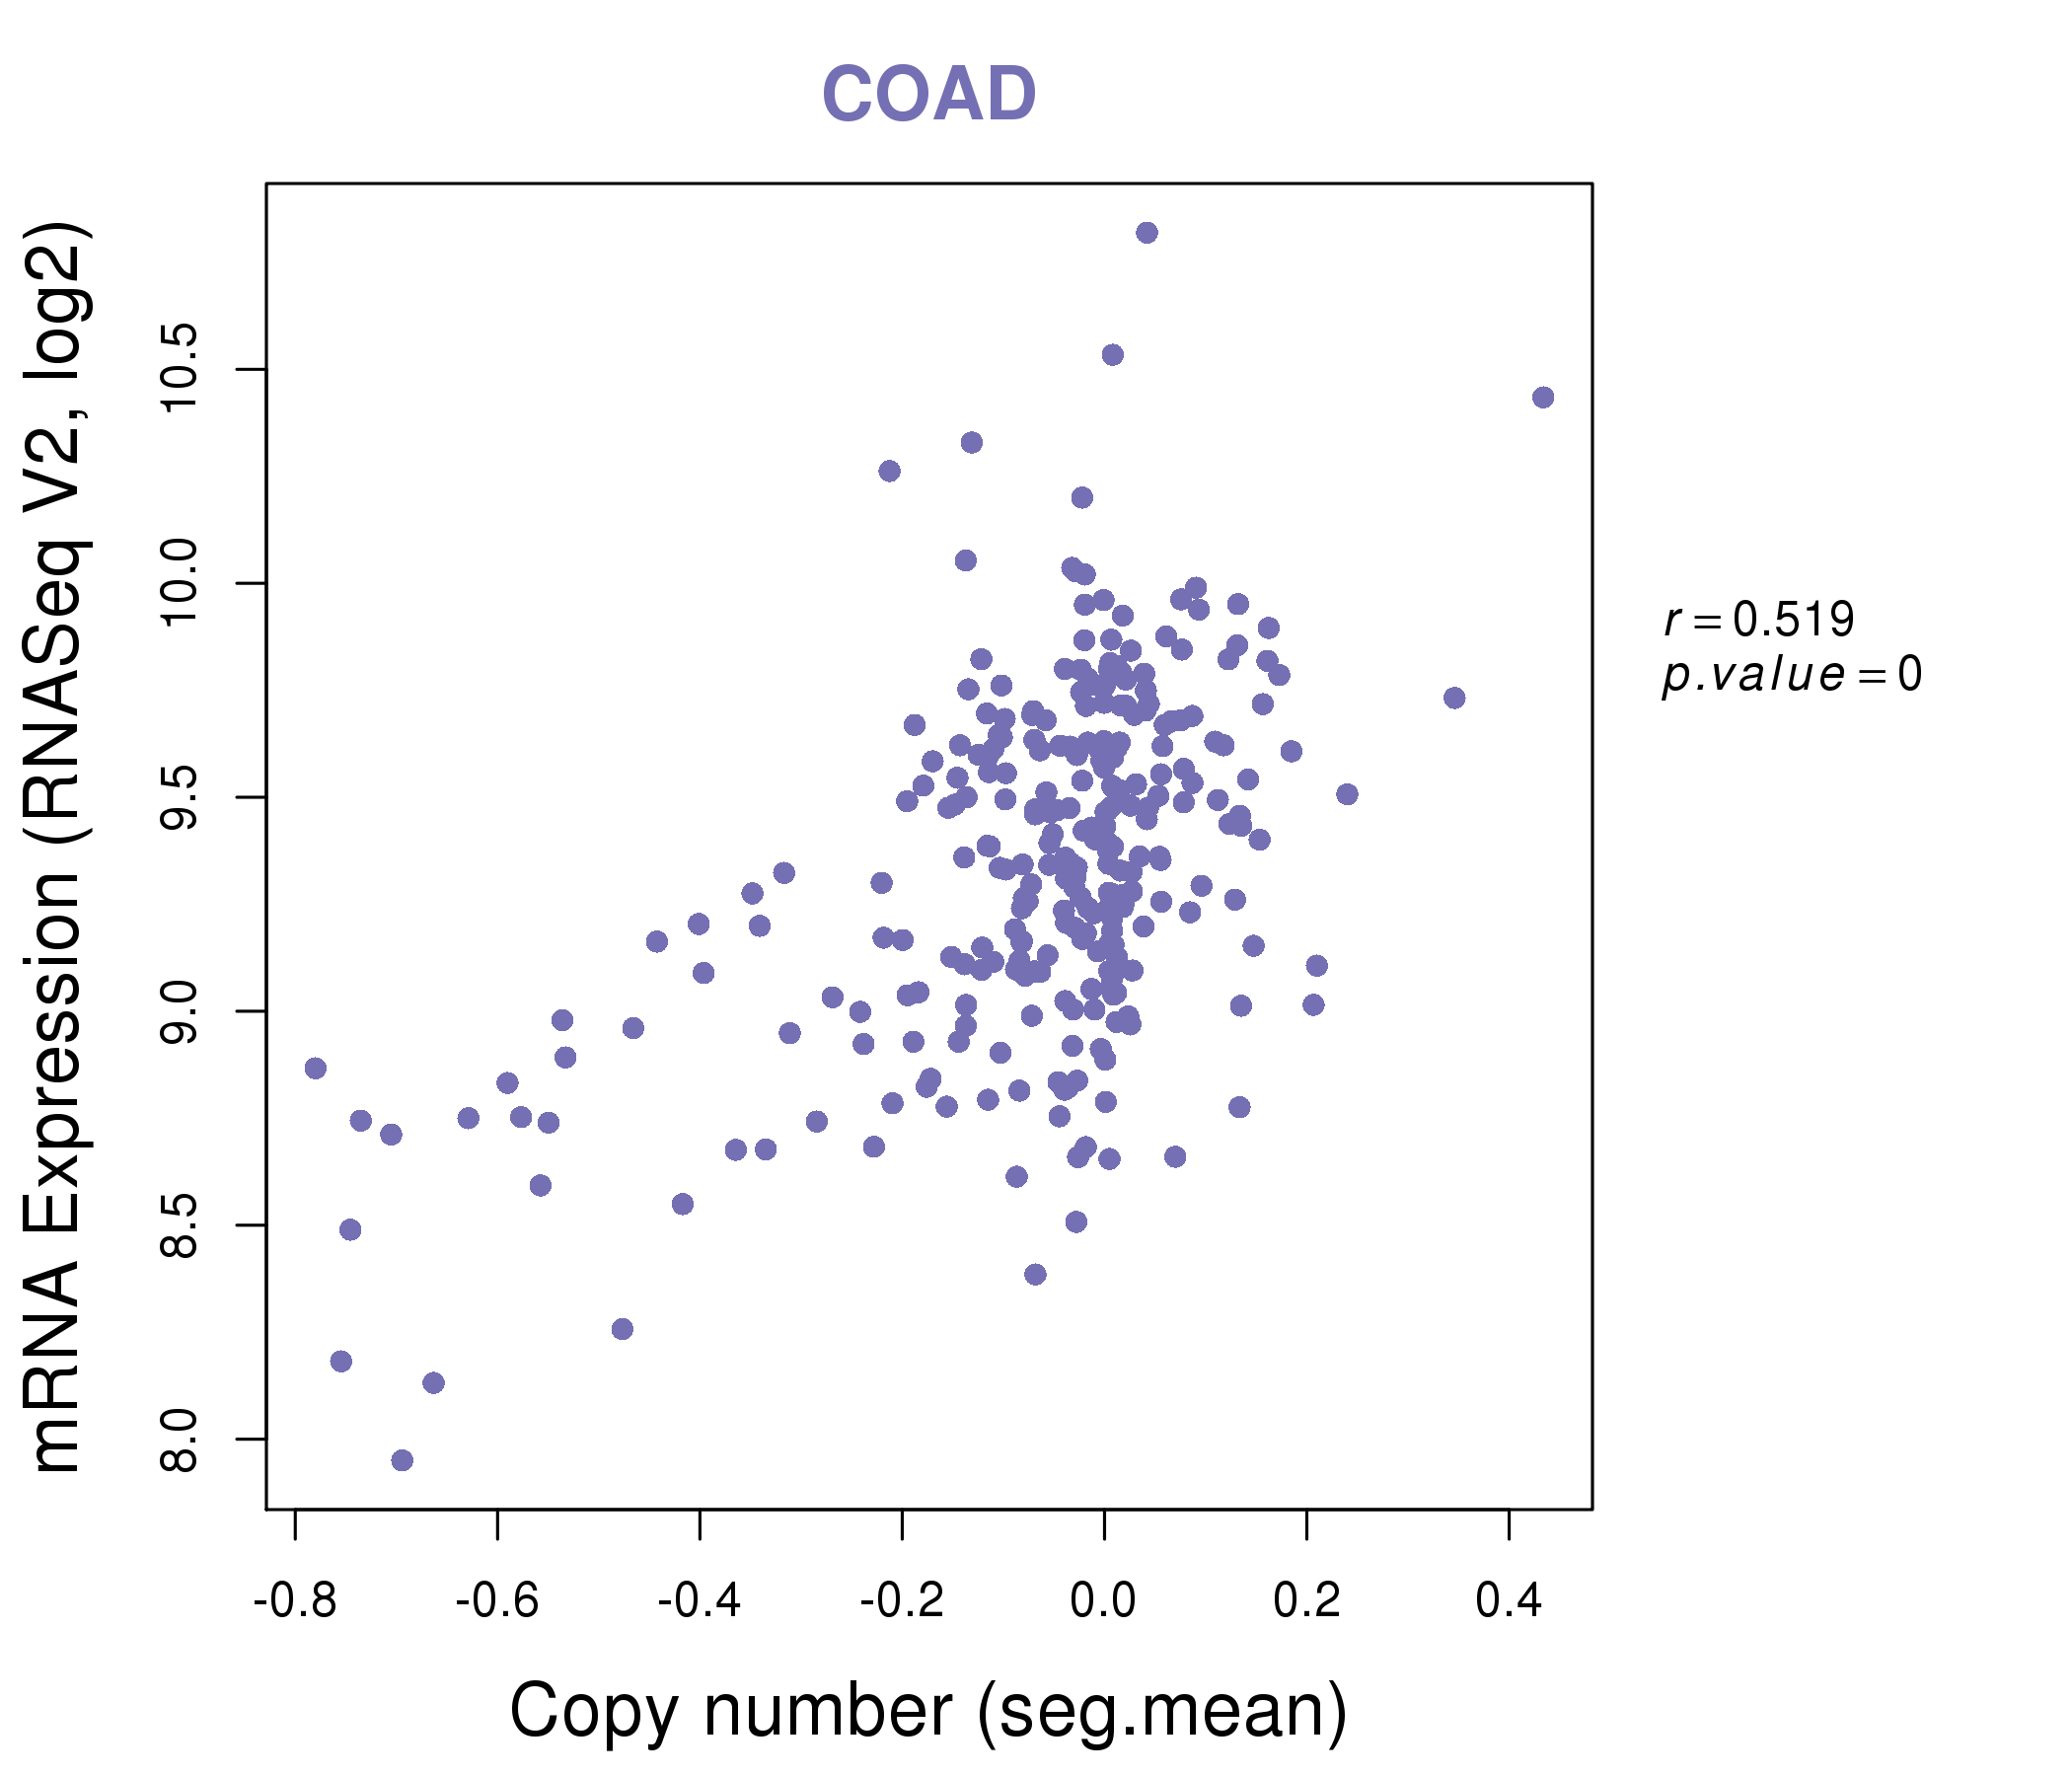
| * This plots show the correlation between CNV and gene expression. |
: Open all plots for all cancer types
 |
|
 |
|

| Top |
| Gene-Gene Network Information |
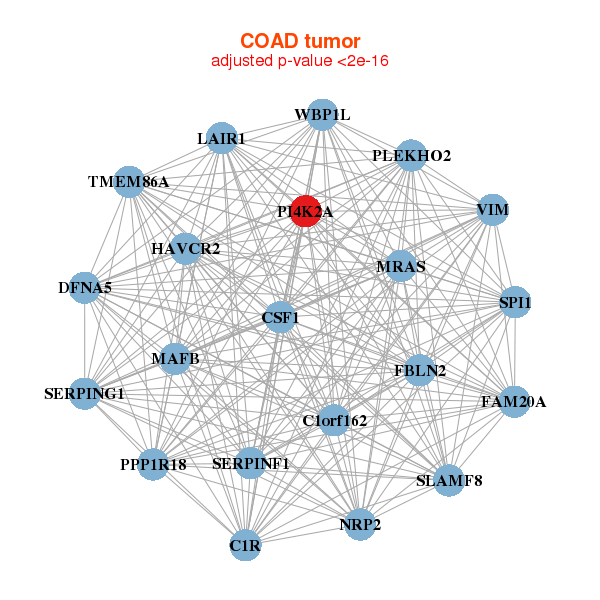
| * Co-Expression network figures were drawn using R package igraph. Only the top 20 genes with the highest correlations were shown. Red circle: input gene, orange circle: cell metabolism gene, sky circle: other gene |
: Open all plots for all cancer types
 |
|
| ADAP2,AXL,C10orf76,C3AR1,CALHM2,CD33,CD68, CSF1R,CTSB,HAVCR2,LIPA,LRRC25,MARVELD1,PI4K2A, PLEKHO2,PSAP,RASGRP4,SFXN3,SIGLEC7,SIGLEC9,SLCO2B1 | ADAP2,ARRB2,C1QA,C1QB,C1QC,C2,CD4, CD86,CLEC10A,FCER1G,HAVCR2,HCK,LGMN,LILRB2, LILRB4,NCF4,NFAM1,PI4K2A,PSAP,SPI1,TBXAS1 |
 |
|
| WBP1L,C1orf162,C1R,CSF1,DFNA5,FAM20A,FBLN2, HAVCR2,PPP1R18,LAIR1,MAFB,MRAS,NRP2,PI4K2A, PLEKHO2,SERPINF1,SERPING1,SLAMF8,SPI1,TMEM86A,VIM | CGREF1,CHRM4,CREB3L2,DGKZ,GNS,GOLGA8CP,GREB1L, IRAK2,KIFC3,MPP1,NBAS,NEDD4,PI4K2A,PLOD1, REG4,SEMA3G,SERPINF2,SFXN3,SIRPA,TK2,UNC5CL |


| * Co-Expression network figures were drawn using R package igraph. Only the top 20 genes with the highest correlations were shown. Red circle: input gene, orange circle: cell metabolism gene, sky circle: other gene |
: Open all plots for all cancer types
| Top |
: Open all interacting genes' information including KEGG pathway for all interacting genes from DAVID
| Top |
| Pharmacological Information for PI4K2A |
| There's no related Drug. |
| Top |
| Cross referenced IDs for PI4K2A |
| * We obtained these cross-references from Uniprot database. It covers 150 different DBs, 18 categories. http://www.uniprot.org/help/cross_references_section |
: Open all cross reference information
|
Copyright © 2016-Present - The Univsersity of Texas Health Science Center at Houston @ |