|
||||||||||||||||||||||||||||||||||||||||||||||||||||||||||||||||||||||||||||||||||||||||||||||||||||||||||||||||||||||||||||||||||||||||||||||||||||||||||||||||||||||||||||||||||||||||||||||||||||||||||||||||||||||||||||||||||||||||||||||||||||||||||||||||||||||||||||||||||||||||||||||||||||||||||||||||||||||||||
| |
| Phenotypic Information (metabolism pathway, cancer, disease, phenome) |
| |
| |
| Gene-Gene Network Information: Co-Expression Network, Interacting Genes & KEGG |
| |
|


| Gene Summary for GALNT10 |
| Basic gene info. | Gene symbol | GALNT10 |
| Gene name | polypeptide N-acetylgalactosaminyltransferase 10 | |
| Synonyms | GALNACT10|PPGALNACT10|PPGANTASE10 | |
| Cytomap | UCSC genome browser: 5q33.2 | |
| Genomic location | chr5 :153570294-153800543 | |
| Type of gene | protein-coding | |
| RefGenes | NM_198321.3, NM_017540.3,NM_024564.1, | |
| Ensembl id | ENSG00000164574 | |
| Description | GalNAc transferase 10UDP-GalNAc:polypeptide N-acetylgalactosaminyltransferase 10UDP-N-acetyl-alpha-D-galactosamine:polypeptide N-acetylgalactosaminyltransferase 10 (GalNAc-T10) | |
| Modification date | 20141207 | |
| dbXrefs | MIM : 608043 | |
| HGNC : HGNC | ||
| Ensembl : ENSG00000164574 | ||
| HPRD : 12157 | ||
| Vega : OTTHUMG00000130145 | ||
| Protein | UniProt: go to UniProt's Cross Reference DB Table | |
| Expression | CleanEX: HS_GALNT10 | |
| BioGPS: 55568 | ||
| Gene Expression Atlas: ENSG00000164574 | ||
| The Human Protein Atlas: ENSG00000164574 | ||
| Pathway | NCI Pathway Interaction Database: GALNT10 | |
| KEGG: GALNT10 | ||
| REACTOME: GALNT10 | ||
| ConsensusPathDB | ||
| Pathway Commons: GALNT10 | ||
| Metabolism | MetaCyc: GALNT10 | |
| HUMANCyc: GALNT10 | ||
| Regulation | Ensembl's Regulation: ENSG00000164574 | |
| miRBase: chr5 :153,570,294-153,800,543 | ||
| TargetScan: NM_198321 | ||
| cisRED: ENSG00000164574 | ||
| Context | iHOP: GALNT10 | |
| cancer metabolism search in PubMed: GALNT10 | ||
| UCL Cancer Institute: GALNT10 | ||
| Assigned class in ccmGDB | C | |
| Top |
| Phenotypic Information for GALNT10(metabolism pathway, cancer, disease, phenome) |
| Cancer | CGAP: GALNT10 |
| Familial Cancer Database: GALNT10 | |
| * This gene is included in those cancer gene databases. |
|
|
|
|
|
| . | ||||||||||||||||||||||||||||||||||||||||||||||||||||||||||||||||||||||||||||||||||||||||||||||||||||||||||||||||||||||||||||||||||||||||||||||||||||||||||||||||||||||||||||||||||||||||||||||||||||||||||||||||||||||||||||||||||||||||||||||||||||||||||||||||||||||||||||||||||||||||||||||||||||||||||||||||||||
Oncogene 1 | Significant driver gene in | |||||||||||||||||||||||||||||||||||||||||||||||||||||||||||||||||||||||||||||||||||||||||||||||||||||||||||||||||||||||||||||||||||||||||||||||||||||||||||||||||||||||||||||||||||||||||||||||||||||||||||||||||||||||||||||||||||||||||||||||||||||||||||||||||||||||||||||||||||||||||||||||||||||||||||||||||||||||||
| cf) number; DB name 1 Oncogene; http://nar.oxfordjournals.org/content/35/suppl_1/D721.long, 2 Tumor Suppressor gene; https://bioinfo.uth.edu/TSGene/, 3 Cancer Gene Census; http://www.nature.com/nrc/journal/v4/n3/abs/nrc1299.html, 4 CancerGenes; http://nar.oxfordjournals.org/content/35/suppl_1/D721.long, 5 Network of Cancer Gene; http://ncg.kcl.ac.uk/index.php, 1Therapeutic Vulnerabilities in Cancer; http://cbio.mskcc.org/cancergenomics/statius/ |
| REACTOME_METABOLISM_OF_PROTEINS | |
| Mutations for GALNT10 |
| * Under tables are showing count per each tissue to give us broad intuition about tissue specific mutation patterns.You can go to the detailed page for each mutation database's web site. |
| - Statistics for Tissue and Mutation type | Top |
 |
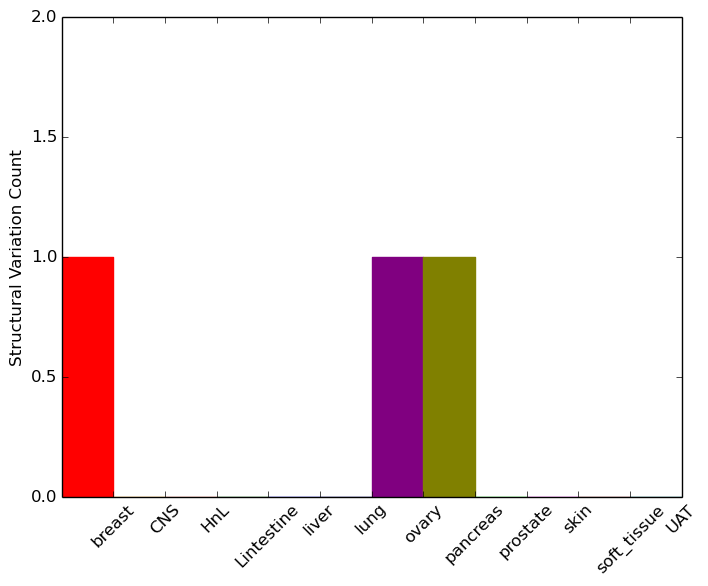
| - For Inter-chromosomal Variations |
| * Inter-chromosomal variantions includes 'interchromosomal amplicon to amplicon', 'interchromosomal amplicon to non-amplified dna', 'interchromosomal insertion', 'Interchromosomal unknown type'. |
 |
| - For Intra-chromosomal Variations |
| There's no intra-chromosomal structural variation. |
| Sample | Symbol_a | Chr_a | Start_a | End_a | Symbol_b | Chr_b | Start_b | End_b |
| breast | GALNT10 | chr5 | 153763540 | 153763540 | chr12 | 71462294 | 71462294 | |
| ovary | GALNT10 | chr5 | 153766697 | 153766717 | chr19 | 11498835 | 11498855 | |
| ovary | GALNT10 | chr5 | 153766815 | 153766835 | chr5 | 154696202 | 154696222 | |
| pancreas | GALNT10 | chr5 | 153658912 | 153659112 | CBL | chr11 | 119124194 | 119124394 |
| pancreas | GALNT10 | chr5 | 153666875 | 153666895 | chr5 | 159343243 | 159343263 |
| cf) Tissue number; Tissue name (1;Breast, 2;Central_nervous_system, 3;Haematopoietic_and_lymphoid_tissue, 4;Large_intestine, 5;Liver, 6;Lung, 7;Ovary, 8;Pancreas, 9;Prostate, 10;Skin, 11;Soft_tissue, 12;Upper_aerodigestive_tract) |
| * From mRNA Sanger sequences, Chitars2.0 arranged chimeric transcripts. This table shows GALNT10 related fusion information. |
| ID | Head Gene | Tail Gene | Accession | Gene_a | qStart_a | qEnd_a | Chromosome_a | tStart_a | tEnd_a | Gene_a | qStart_a | qEnd_a | Chromosome_a | tStart_a | tEnd_a |
| BF155072 | GALNT10 | 1 | 116 | 5 | 153800378 | 153800494 | GALNT10 | 117 | 472 | 5 | 153799900 | 153800255 | |
| DA949043 | GALNT10 | 1 | 305 | 5 | 153778005 | 153778307 | MYH9 | 302 | 557 | 22 | 36707599 | 36707854 | |
| Top |
| Mutation type/ Tissue ID | brca | cns | cerv | endome | haematopo | kidn | Lintest | liver | lung | ns | ovary | pancre | prost | skin | stoma | thyro | urina | |||
| Total # sample | 1 | 3 | 9 | 4 | 1 | 1 | 1 | 1 | ||||||||||||
| GAIN (# sample) | 1 | 1 | 3 | 1 | 1 | |||||||||||||||
| LOSS (# sample) | 1 | 2 | 8 | 1 | 1 | 1 |
| cf) Tissue ID; Tissue type (1; Breast, 2; Central_nervous_system, 3; Cervix, 4; Endometrium, 5; Haematopoietic_and_lymphoid_tissue, 6; Kidney, 7; Large_intestine, 8; Liver, 9; Lung, 10; NS, 11; Ovary, 12; Pancreas, 13; Prostate, 14; Skin, 15; Stomach, 16; Thyroid, 17; Urinary_tract) |
| Top |
|
 |
| Top |
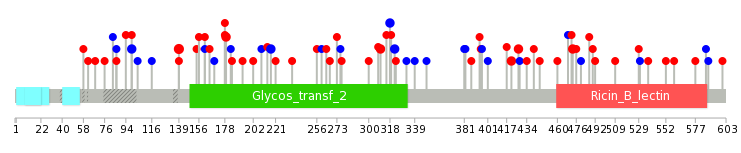
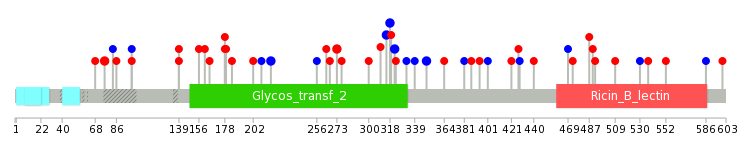
| Stat. for Non-Synonymous SNVs (# total SNVs=49) | (# total SNVs=18) |
 |  |
(# total SNVs=1) | (# total SNVs=0) |
 |
| Top |
| * When you move the cursor on each content, you can see more deailed mutation information on the Tooltip. Those are primary_site,primary_histology,mutation(aa),pubmedID. |
| GRCh37 position | Mutation(aa) | Unique sampleID count |
| chr5:153709146-153709146 | p.R139H | 3 |
| chr5:153755896-153755896 | p.R210* | 3 |
| chr5:153755919-153755919 | p.L217L | 2 |
| chr5:153677535-153677535 | p.T99T | 2 |
| chr5:153760081-153760081 | p.Y276Y | 2 |
| chr5:153792479-153792479 | p.D473H | 2 |
| chr5:153789197-153789197 | p.A421T | 2 |
| chr5:153789216-153789216 | p.R427H | 2 |
| chr5:153709265-153709265 | p.E179K | 2 |
| chr5:153760181-153760181 | p.D310Y | 2 |
| Top |
|
 |
| Point Mutation/ Tissue ID | 1 | 2 | 3 | 4 | 5 | 6 | 7 | 8 | 9 | 10 | 11 | 12 | 13 | 14 | 15 | 16 | 17 | 18 | 19 | 20 |
| # sample | 2 | 1 | 10 | 1 | 2 | 3 | 1 | 7 | 3 | 3 | 7 | 8 | 1 | 10 | ||||||
| # mutation | 2 | 1 | 9 | 1 | 2 | 3 | 1 | 7 | 3 | 3 | 7 | 8 | 1 | 10 | ||||||
| nonsynonymous SNV | 2 | 6 | 1 | 1 | 1 | 1 | 4 | 3 | 2 | 4 | 4 | 1 | 7 | |||||||
| synonymous SNV | 1 | 3 | 1 | 2 | 3 | 1 | 3 | 4 | 3 |
| cf) Tissue ID; Tissue type (1; BLCA[Bladder Urothelial Carcinoma], 2; BRCA[Breast invasive carcinoma], 3; CESC[Cervical squamous cell carcinoma and endocervical adenocarcinoma], 4; COAD[Colon adenocarcinoma], 5; GBM[Glioblastoma multiforme], 6; Glioma Low Grade, 7; HNSC[Head and Neck squamous cell carcinoma], 8; KICH[Kidney Chromophobe], 9; KIRC[Kidney renal clear cell carcinoma], 10; KIRP[Kidney renal papillary cell carcinoma], 11; LAML[Acute Myeloid Leukemia], 12; LUAD[Lung adenocarcinoma], 13; LUSC[Lung squamous cell carcinoma], 14; OV[Ovarian serous cystadenocarcinoma ], 15; PAAD[Pancreatic adenocarcinoma], 16; PRAD[Prostate adenocarcinoma], 17; SKCM[Skin Cutaneous Melanoma], 18:STAD[Stomach adenocarcinoma], 19:THCA[Thyroid carcinoma], 20:UCEC[Uterine Corpus Endometrial Carcinoma]) |
| Top |
| * We represented just top 10 SNVs. When you move the cursor on each content, you can see more deailed mutation information on the Tooltip. Those are primary_site, primary_histology, mutation(aa), pubmedID. |
| Genomic Position | Mutation(aa) | Unique sampleID count |
| chr5:153760070 | p.F322F | 2 |
| chr5:153765981 | p.I349I | 2 |
| chr5:153674442 | p.D76N | 2 |
| chr5:153765879 | p.L217L | 2 |
| chr5:153765888 | p.D273N | 2 |
| chr5:153755919 | p.P315P | 2 |
| chr5:153765900 | p.A318A | 2 |
| chr5:153760052 | p.A178V | 1 |
| chr5:153796519 | p.G487D | 1 |
| chr5:153765949 | p.E179K | 1 |
| * Copy number data were extracted from TCGA using R package TCGA-Assembler. The URLs of all public data files on TCGA DCC data server were gathered on Jan-05-2015. Function ProcessCNAData in TCGA-Assembler package was used to obtain gene-level copy number value which is calculated as the average copy number of the genomic region of a gene. |
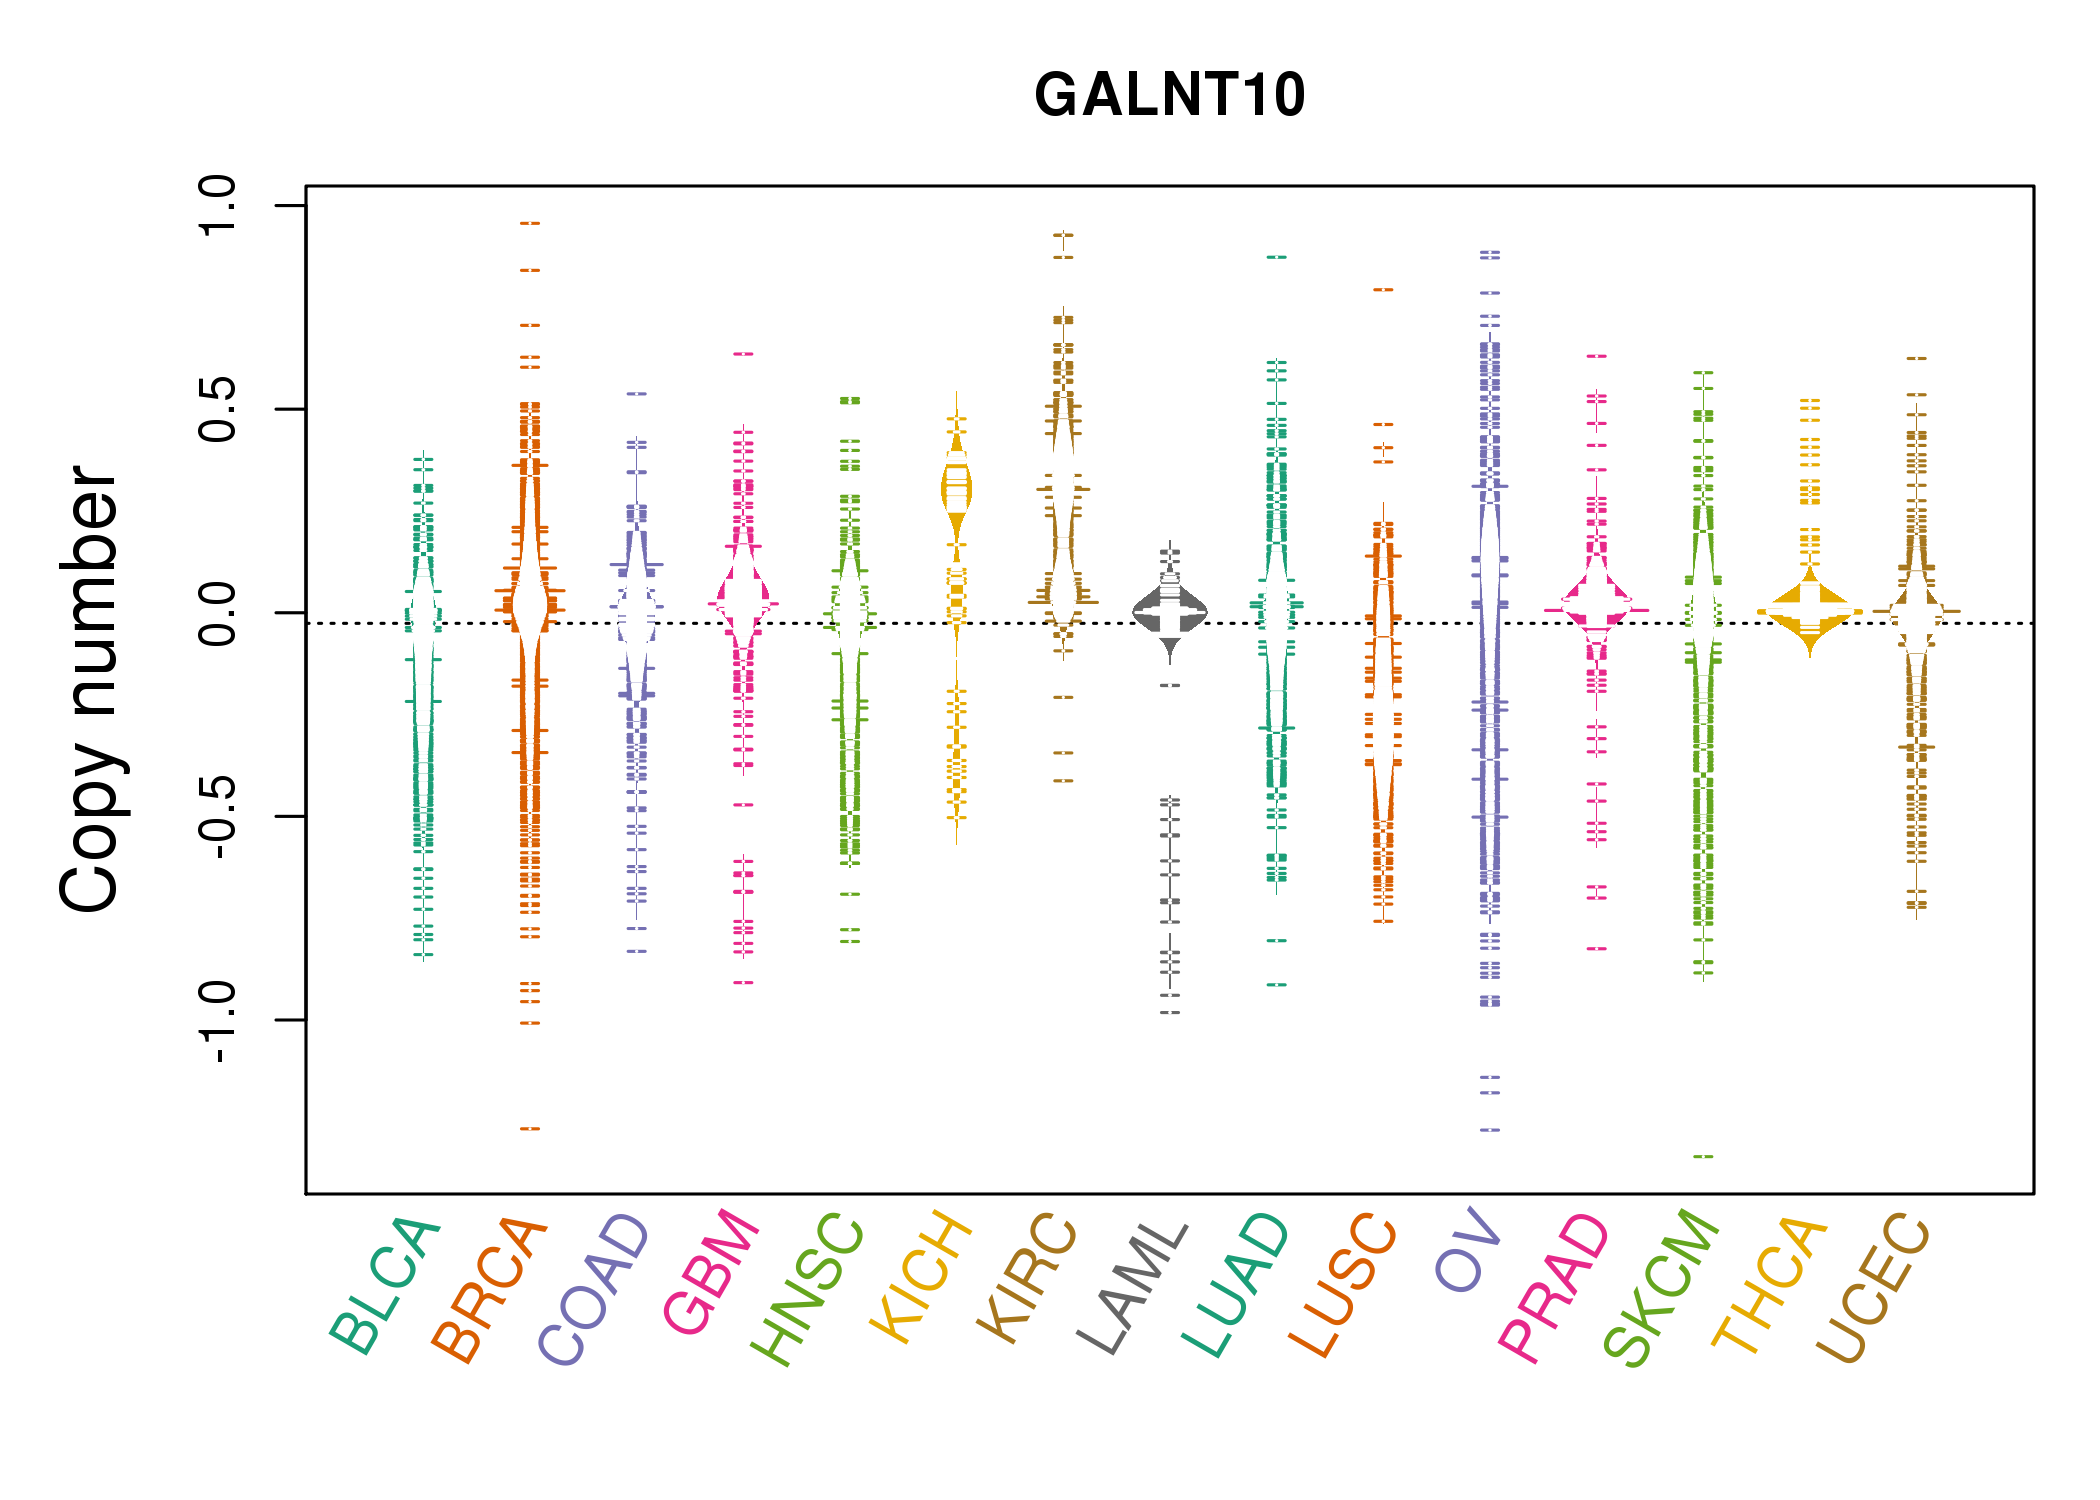 |
| cf) Tissue ID[Tissue type]: BLCA[Bladder Urothelial Carcinoma], BRCA[Breast invasive carcinoma], CESC[Cervical squamous cell carcinoma and endocervical adenocarcinoma], COAD[Colon adenocarcinoma], GBM[Glioblastoma multiforme], Glioma Low Grade, HNSC[Head and Neck squamous cell carcinoma], KICH[Kidney Chromophobe], KIRC[Kidney renal clear cell carcinoma], KIRP[Kidney renal papillary cell carcinoma], LAML[Acute Myeloid Leukemia], LUAD[Lung adenocarcinoma], LUSC[Lung squamous cell carcinoma], OV[Ovarian serous cystadenocarcinoma ], PAAD[Pancreatic adenocarcinoma], PRAD[Prostate adenocarcinoma], SKCM[Skin Cutaneous Melanoma], STAD[Stomach adenocarcinoma], THCA[Thyroid carcinoma], UCEC[Uterine Corpus Endometrial Carcinoma] |
| Top |
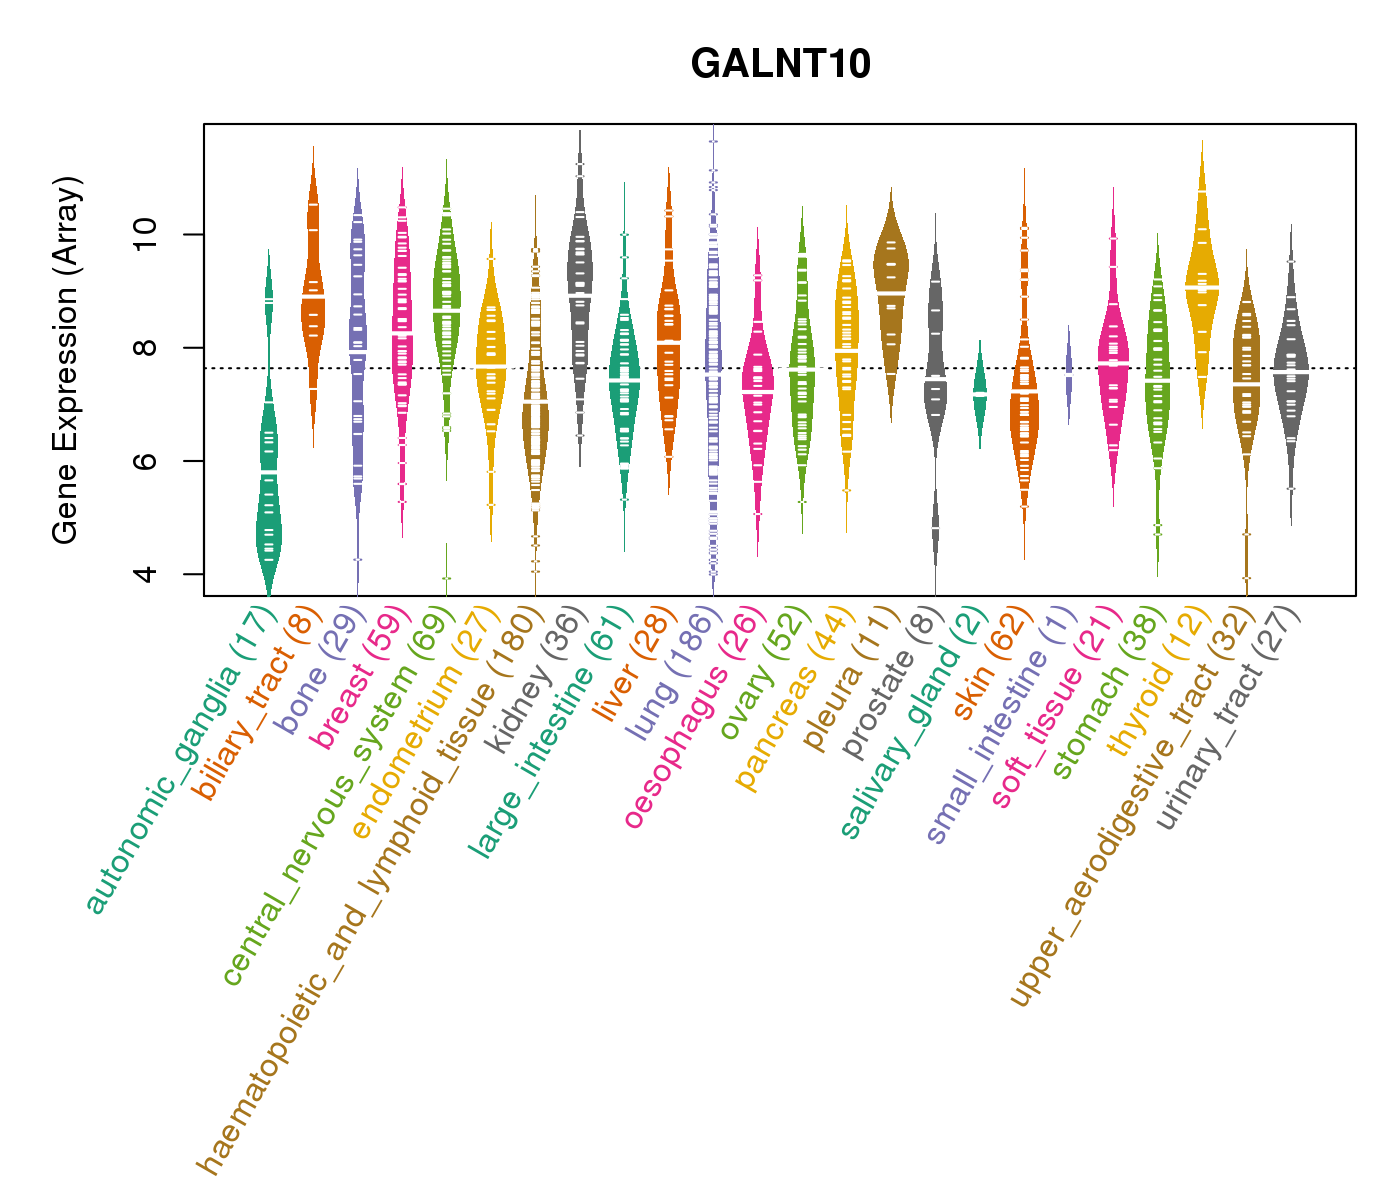
| Gene Expression for GALNT10 |
| * CCLE gene expression data were extracted from CCLE_Expression_Entrez_2012-10-18.res: Gene-centric RMA-normalized mRNA expression data. |
 |
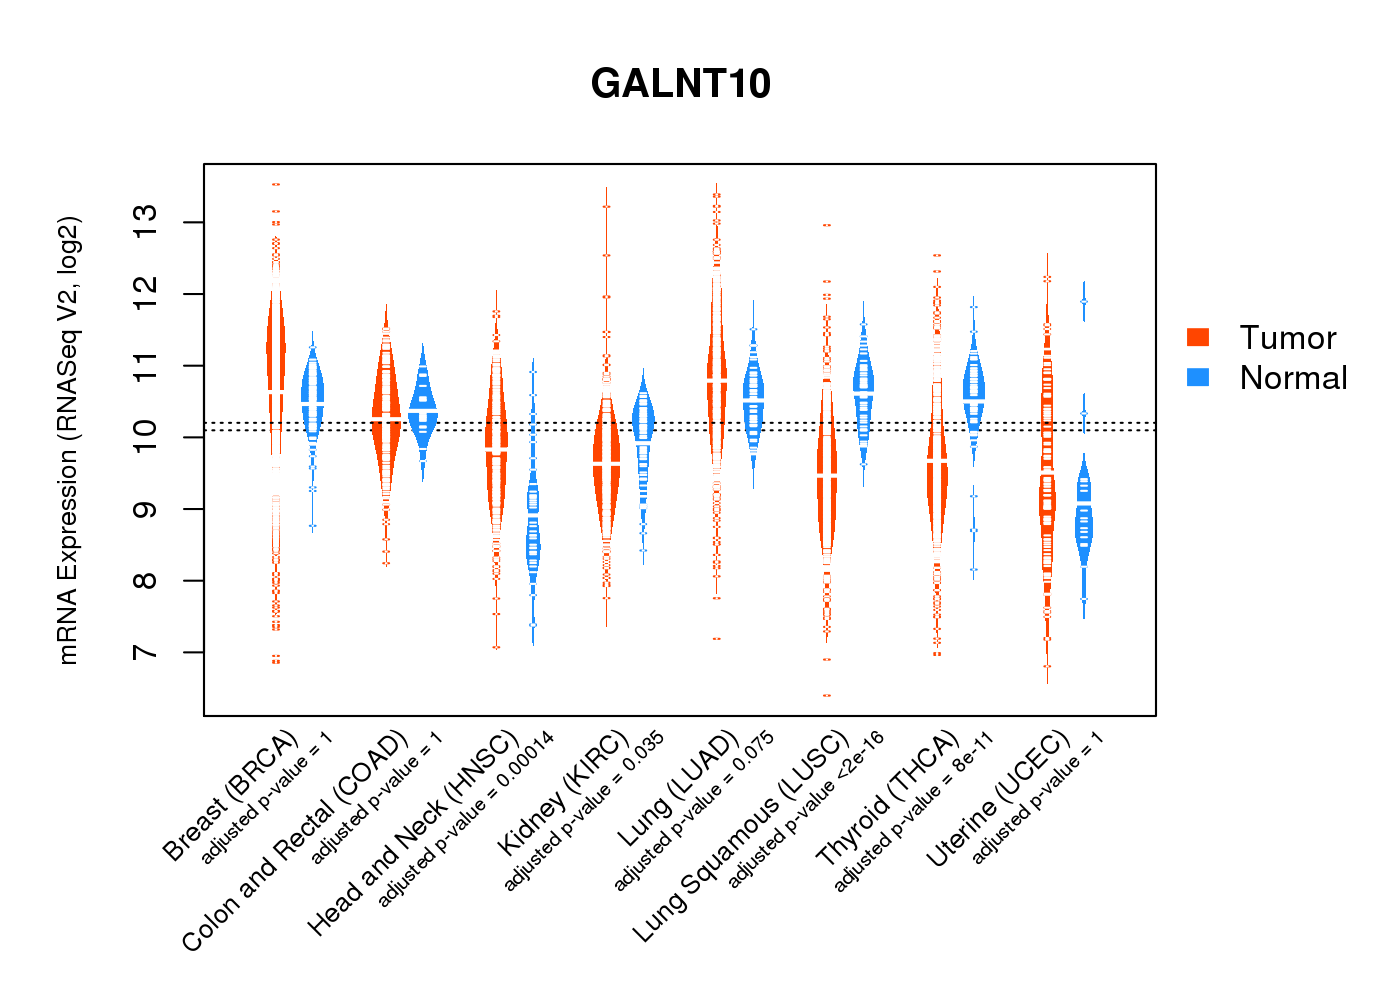
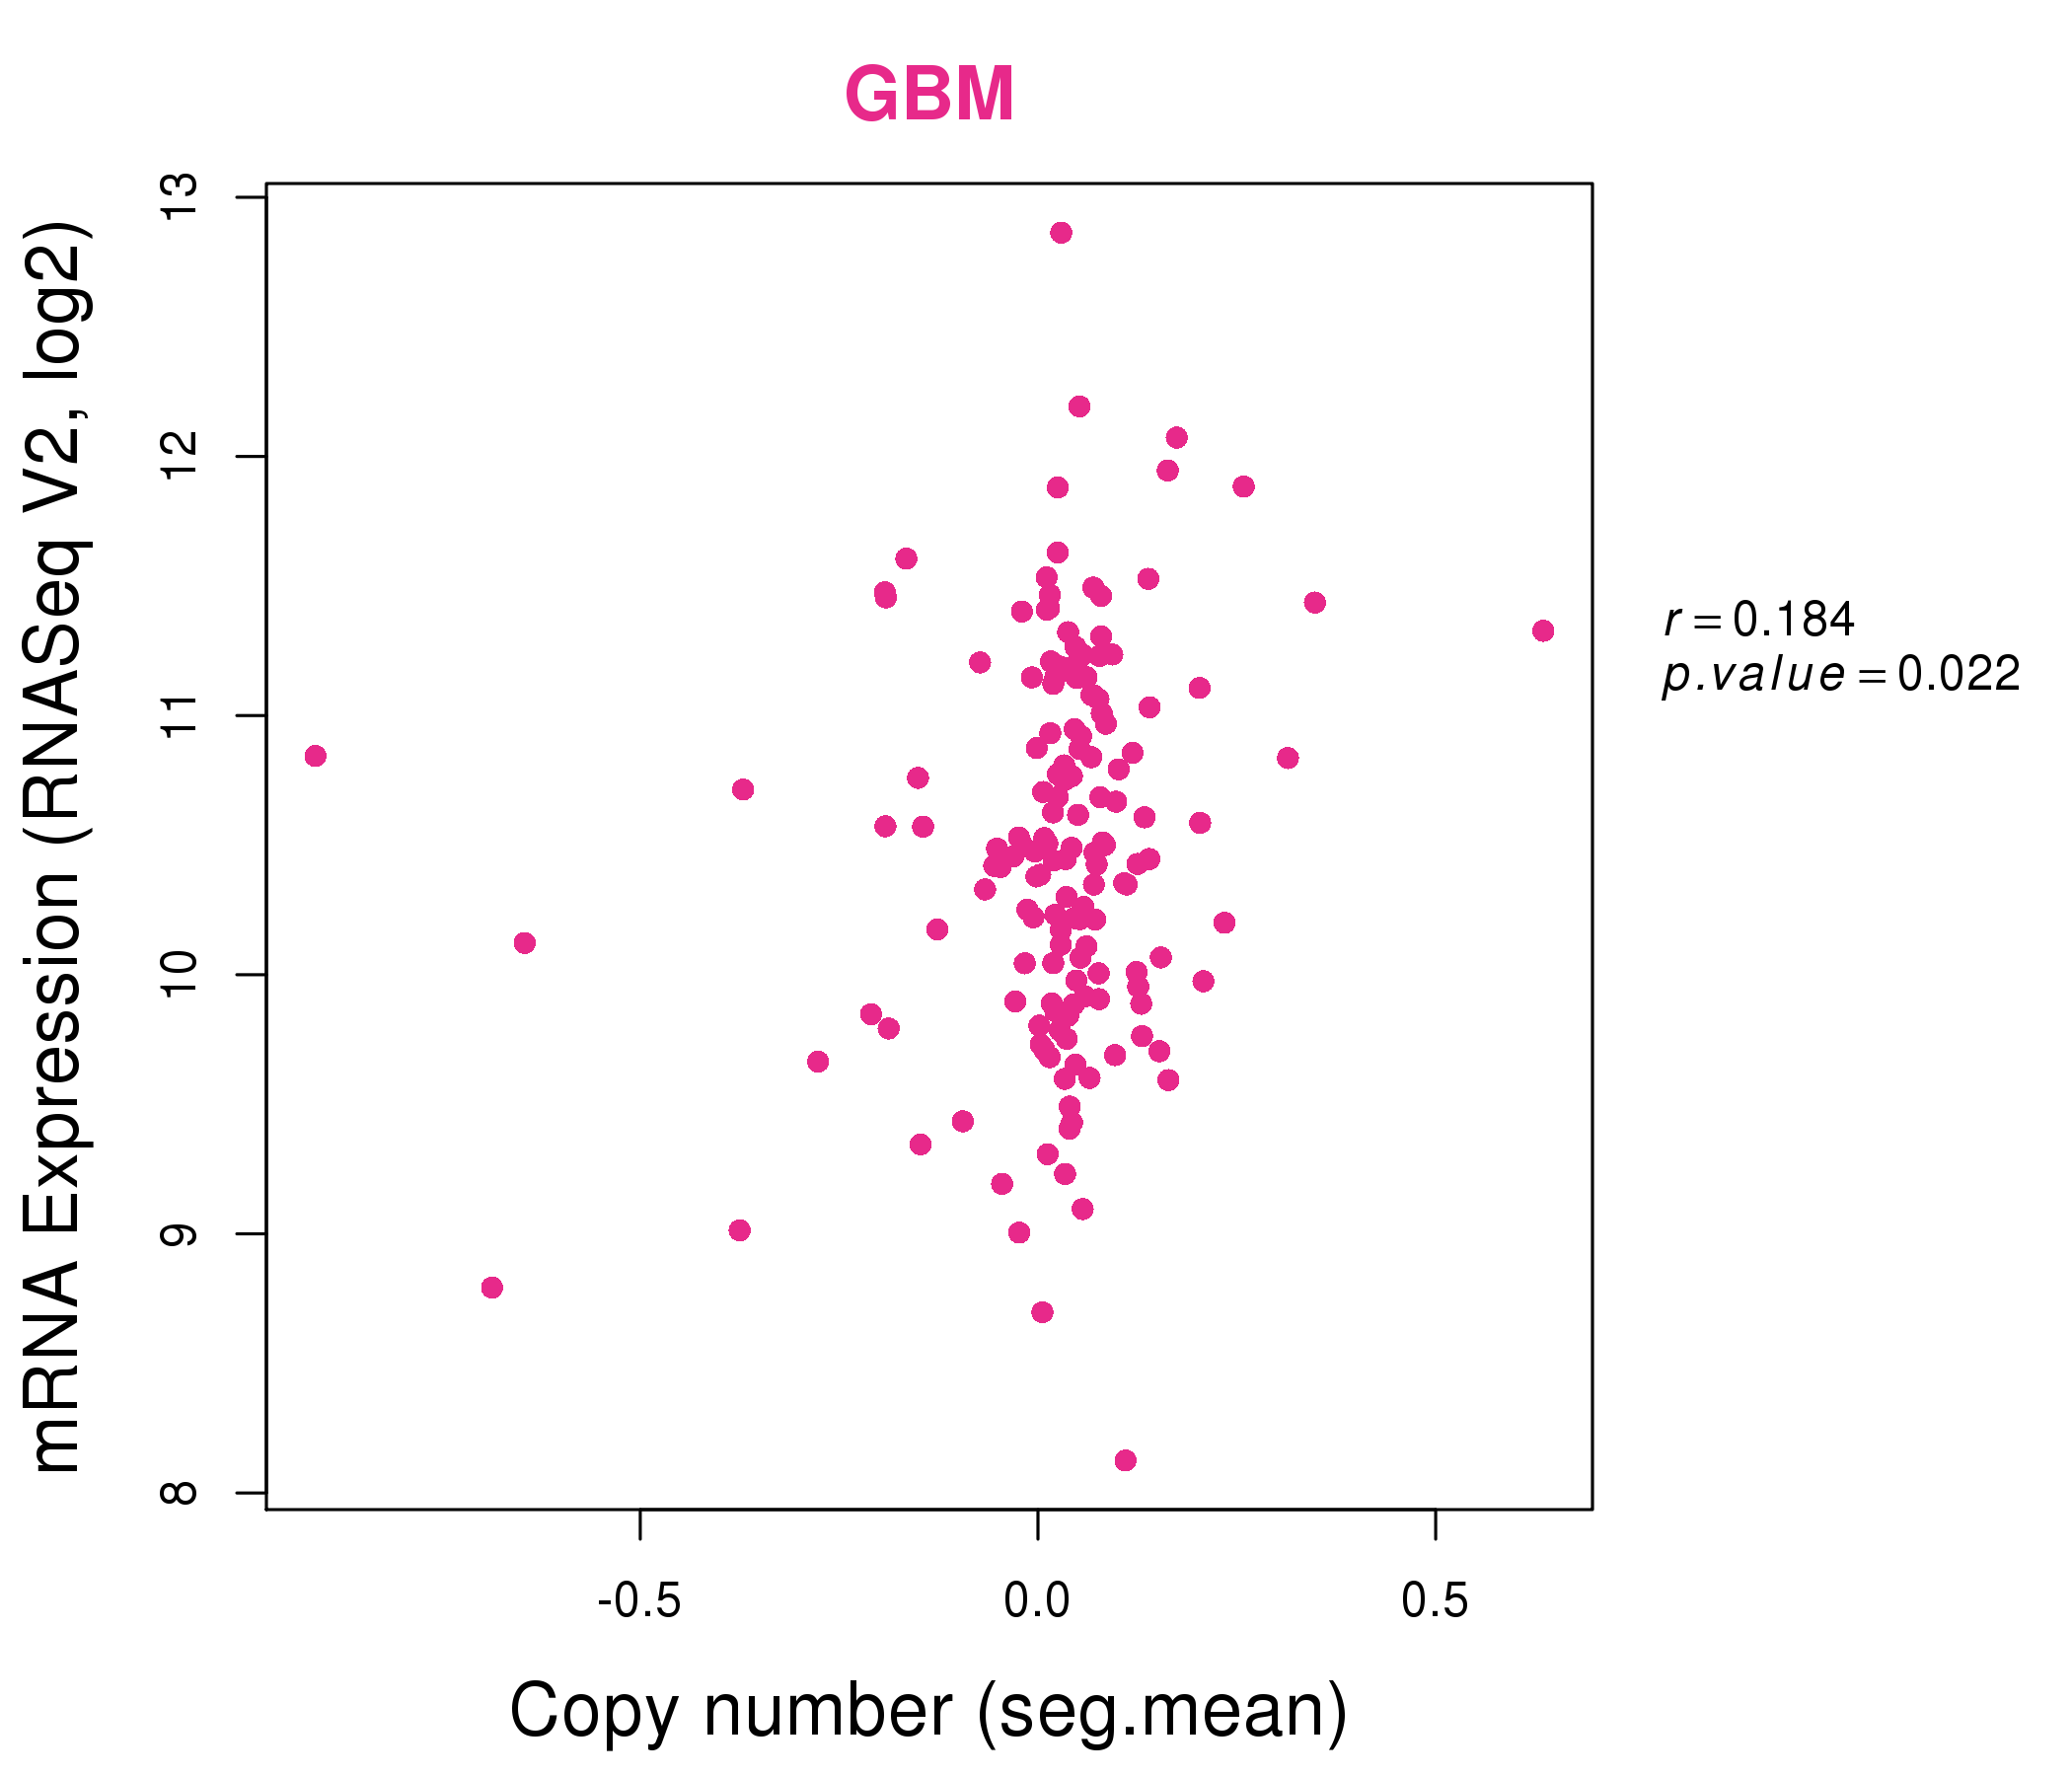
| * Normalized gene expression data of RNASeqV2 was extracted from TCGA using R package TCGA-Assembler. The URLs of all public data files on TCGA DCC data server were gathered at Jan-05-2015. Only eight cancer types have enough normal control samples for differential expression analysis. (t test, adjusted p<0.05 (using Benjamini-Hochberg FDR)) |
 |
| Top |
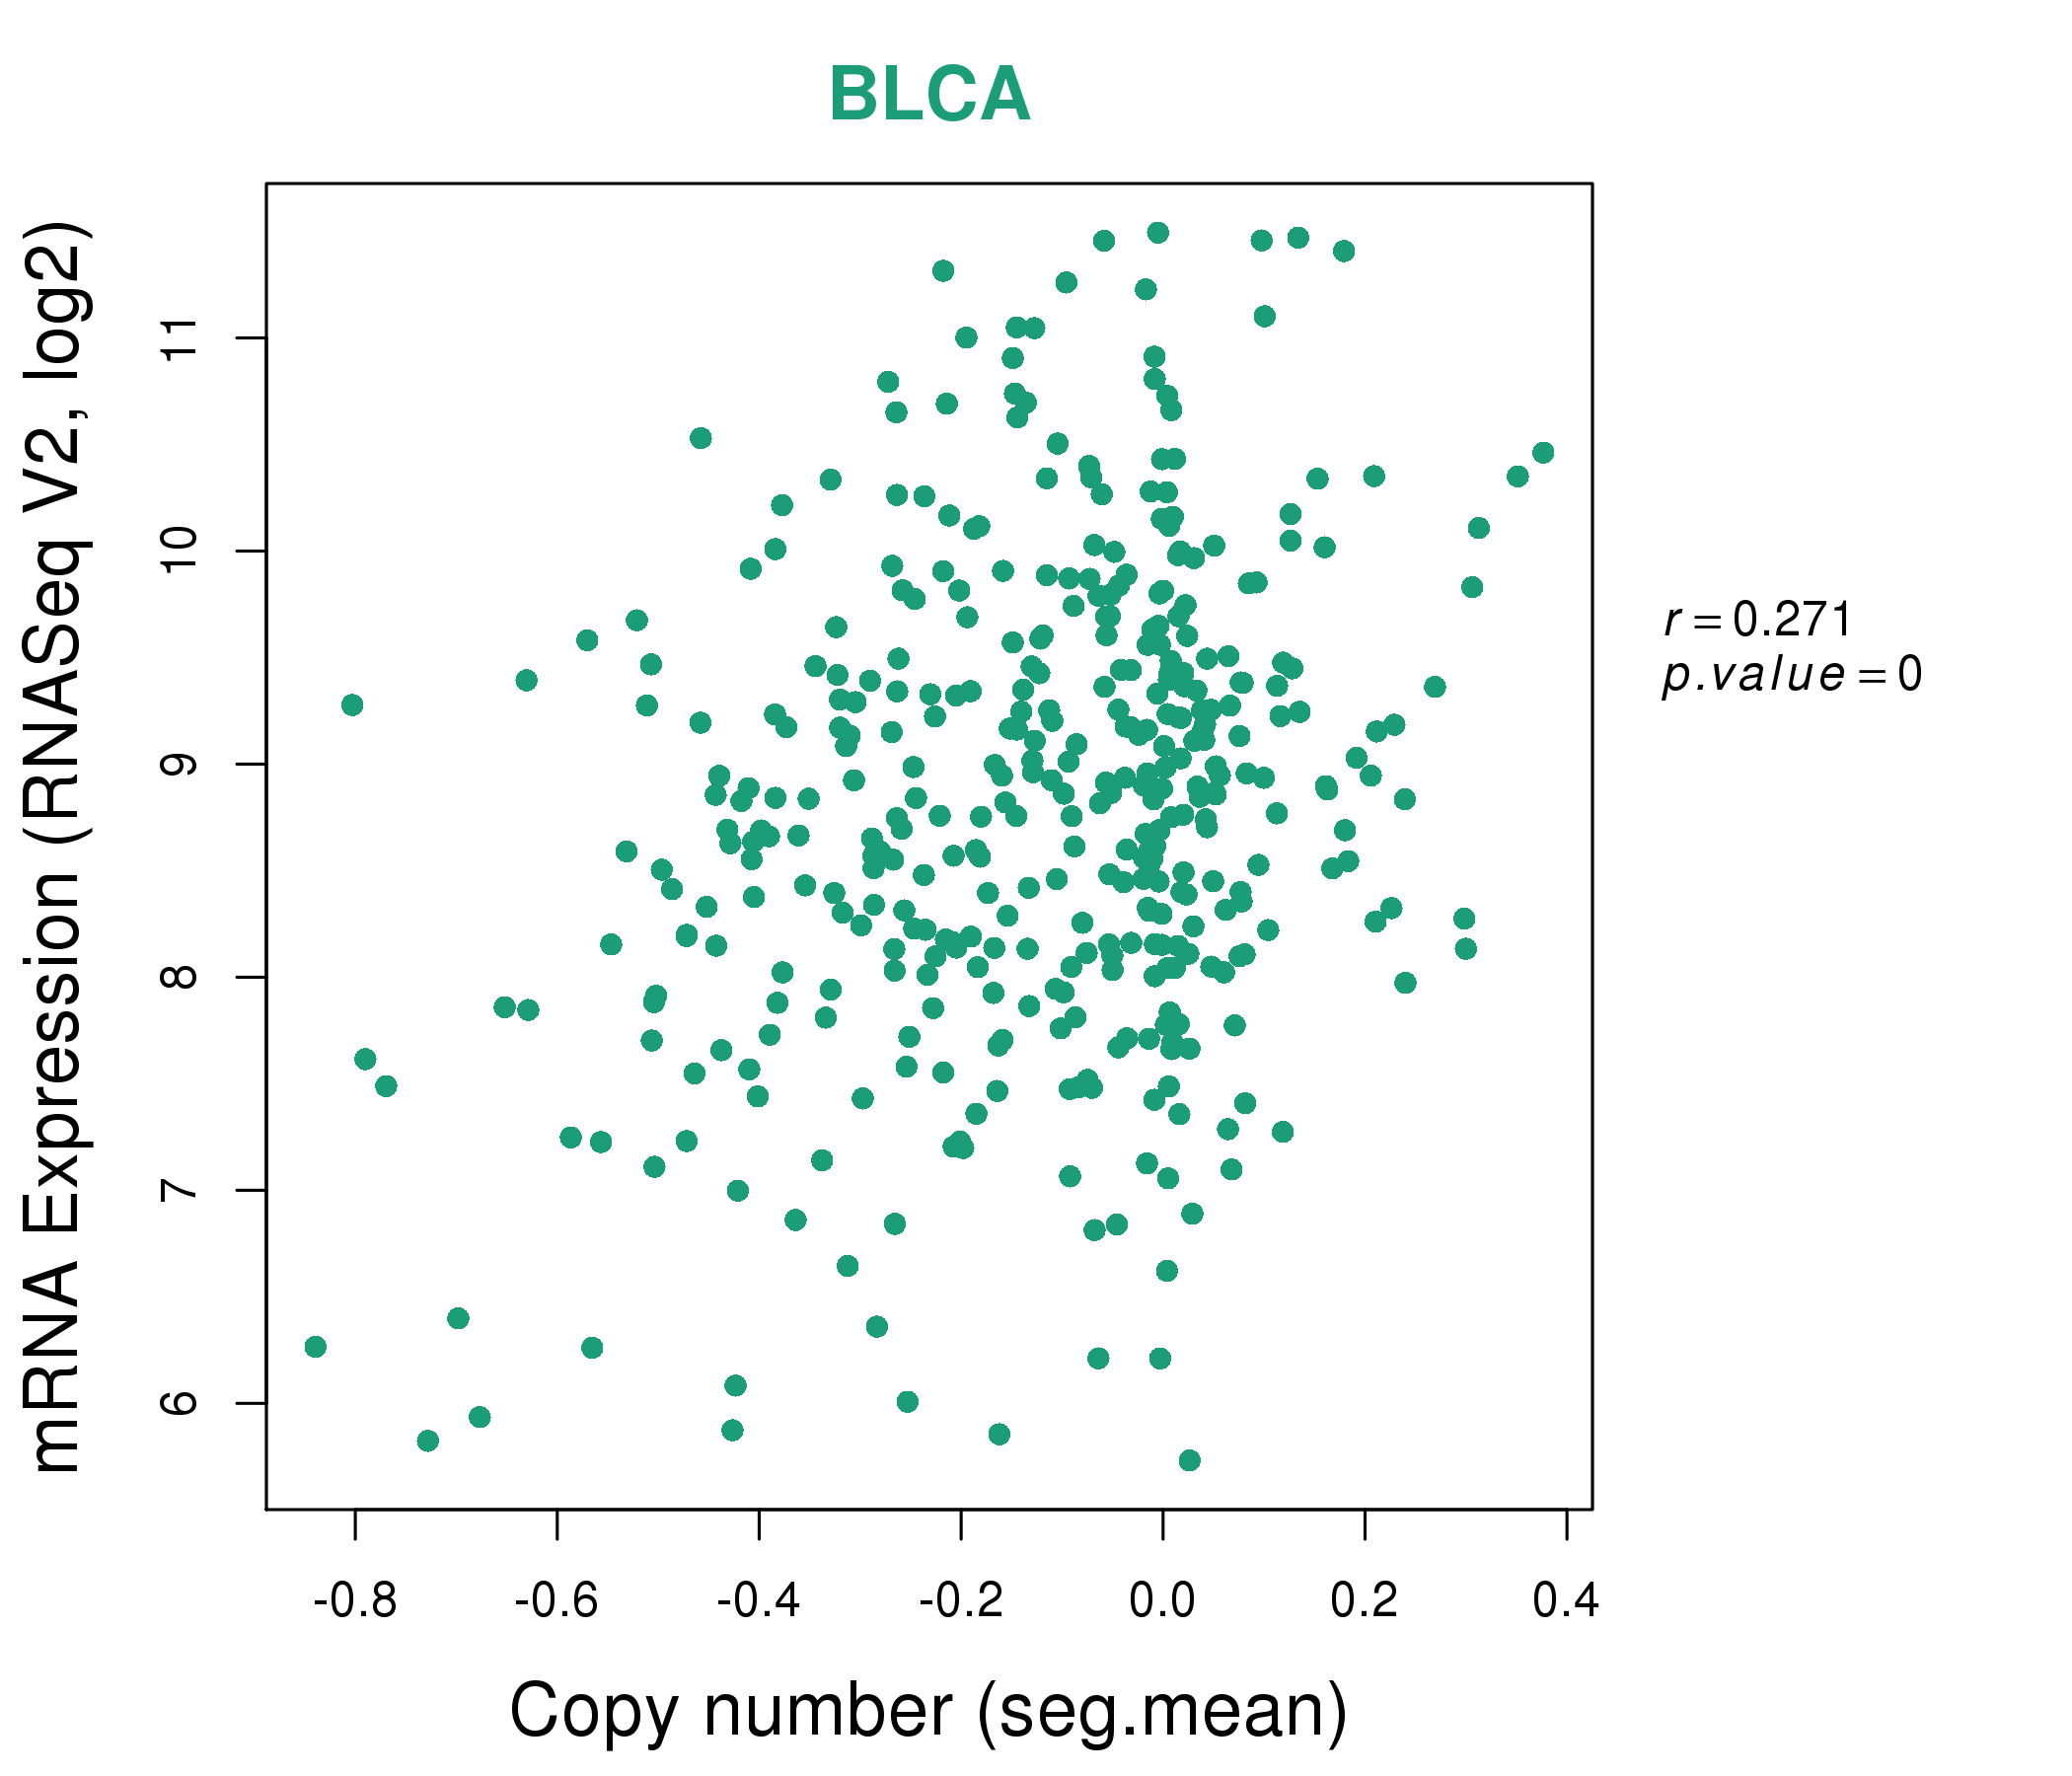
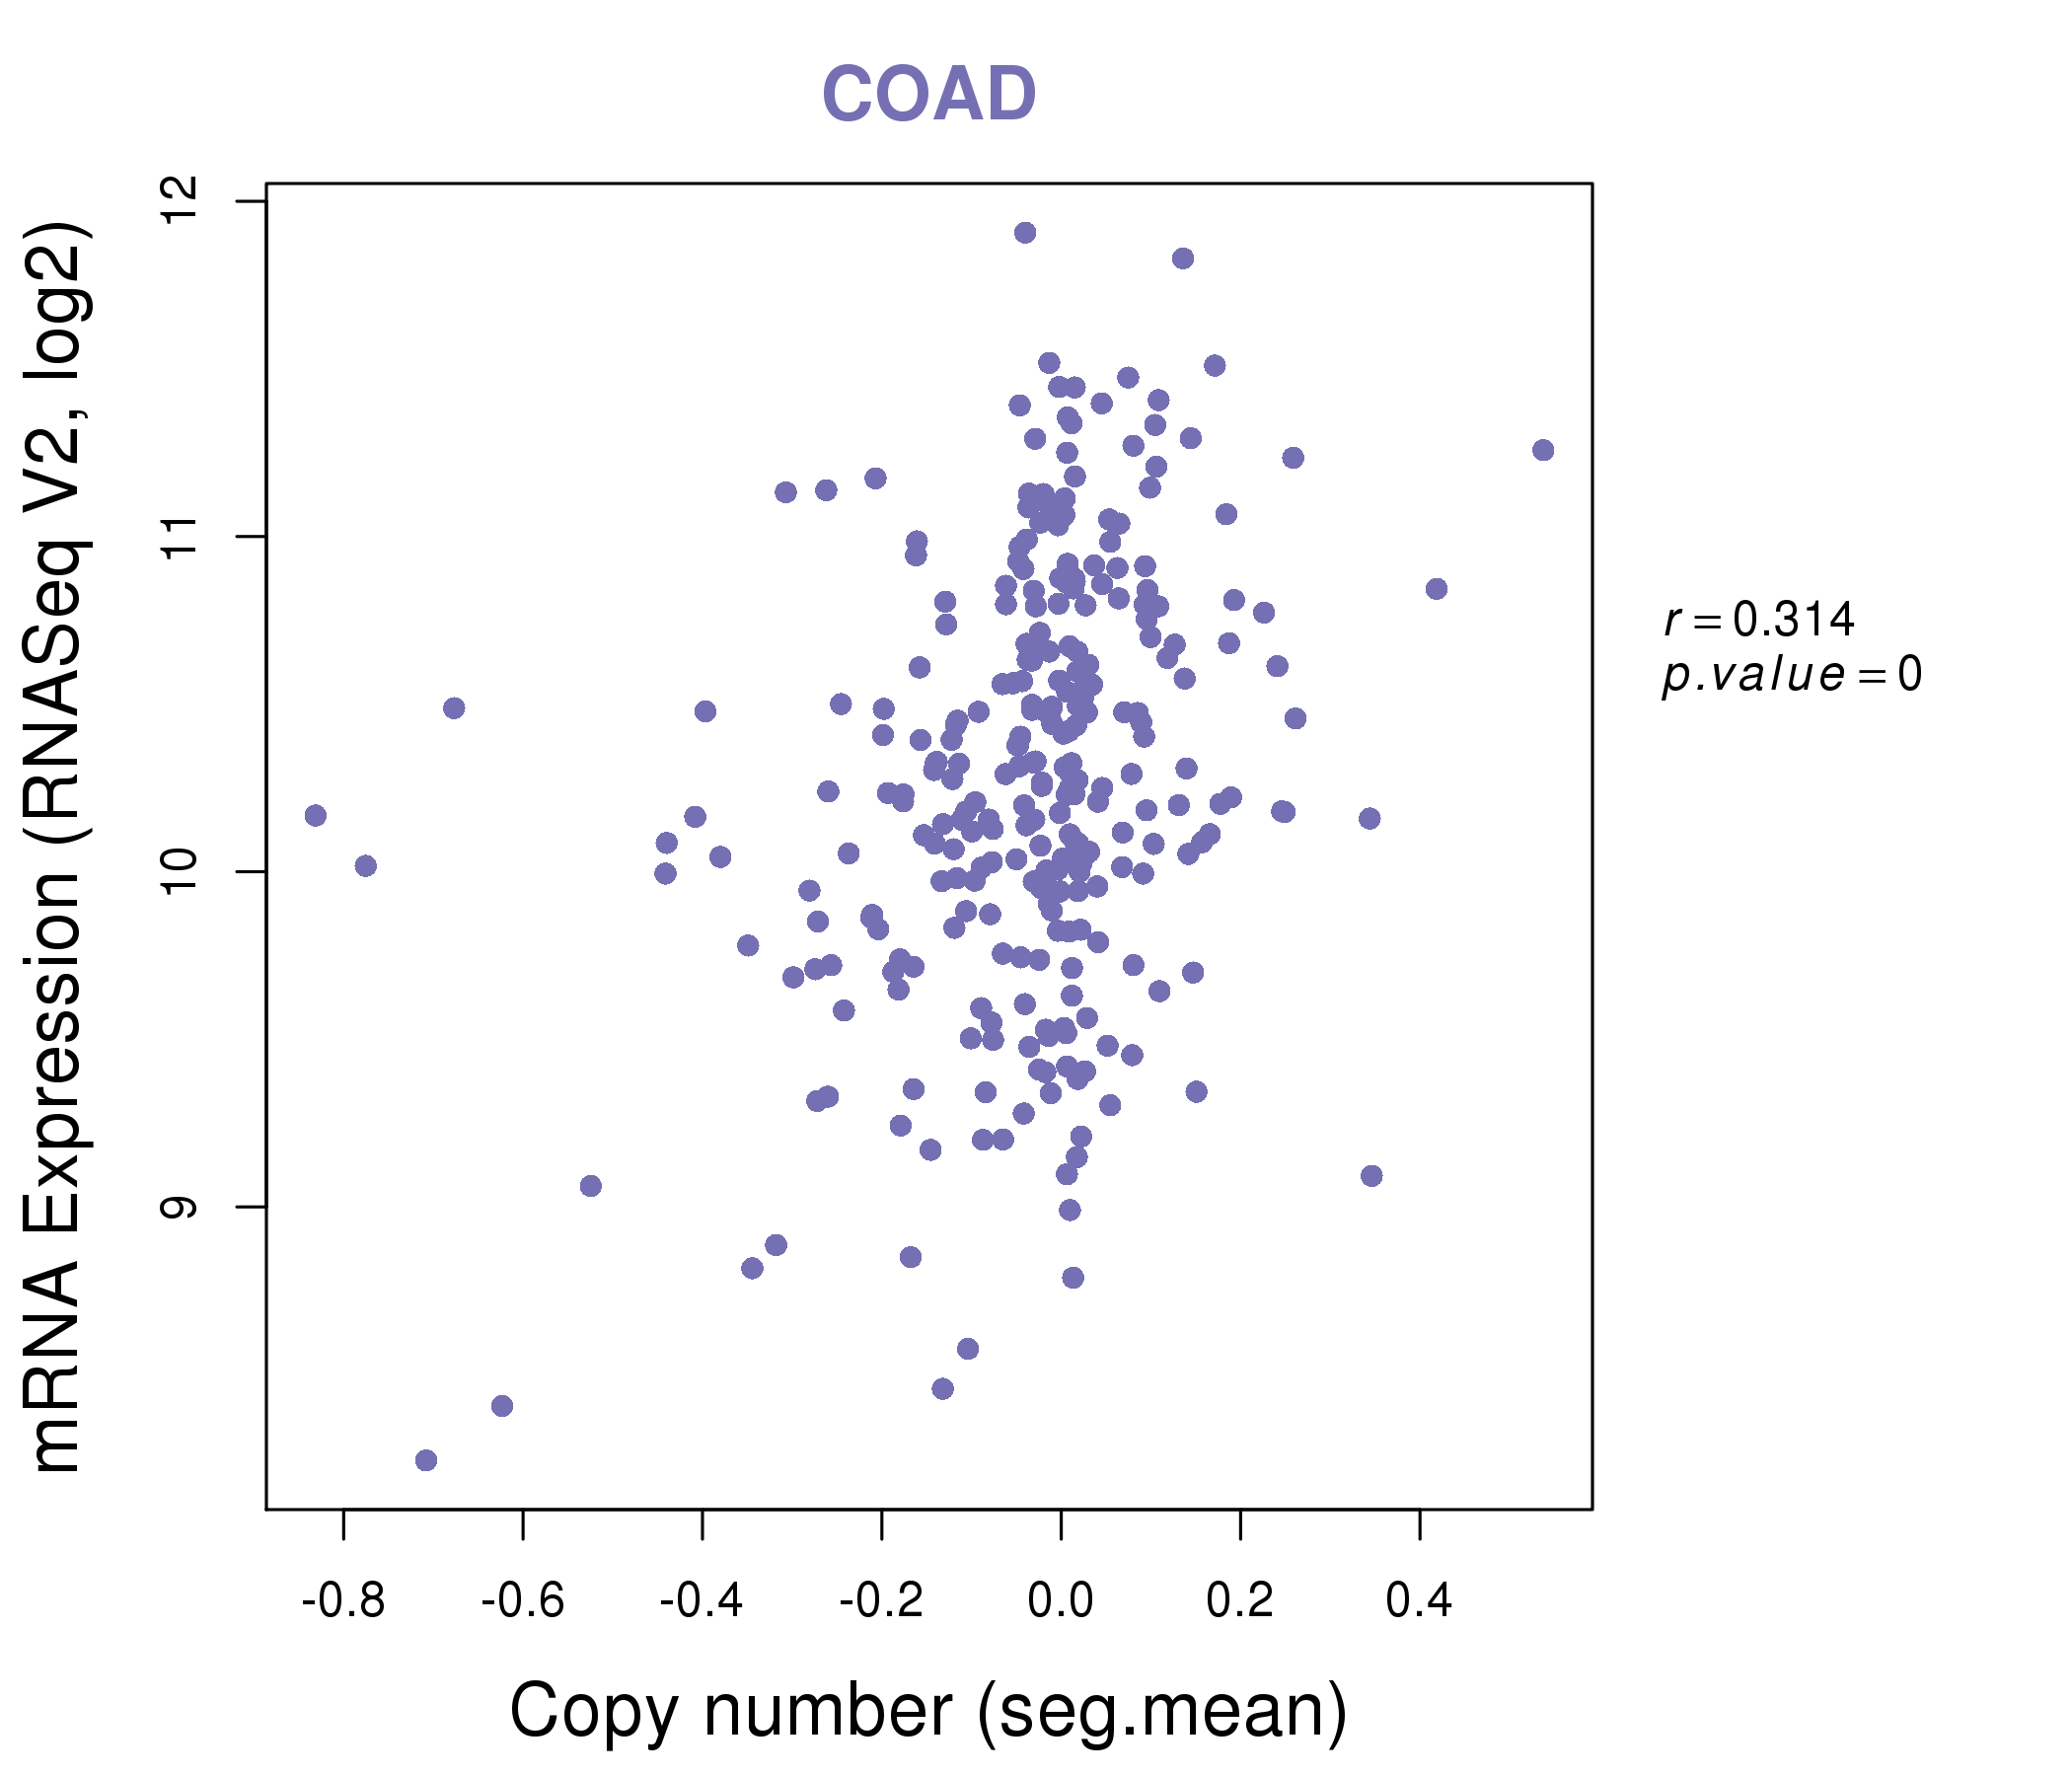
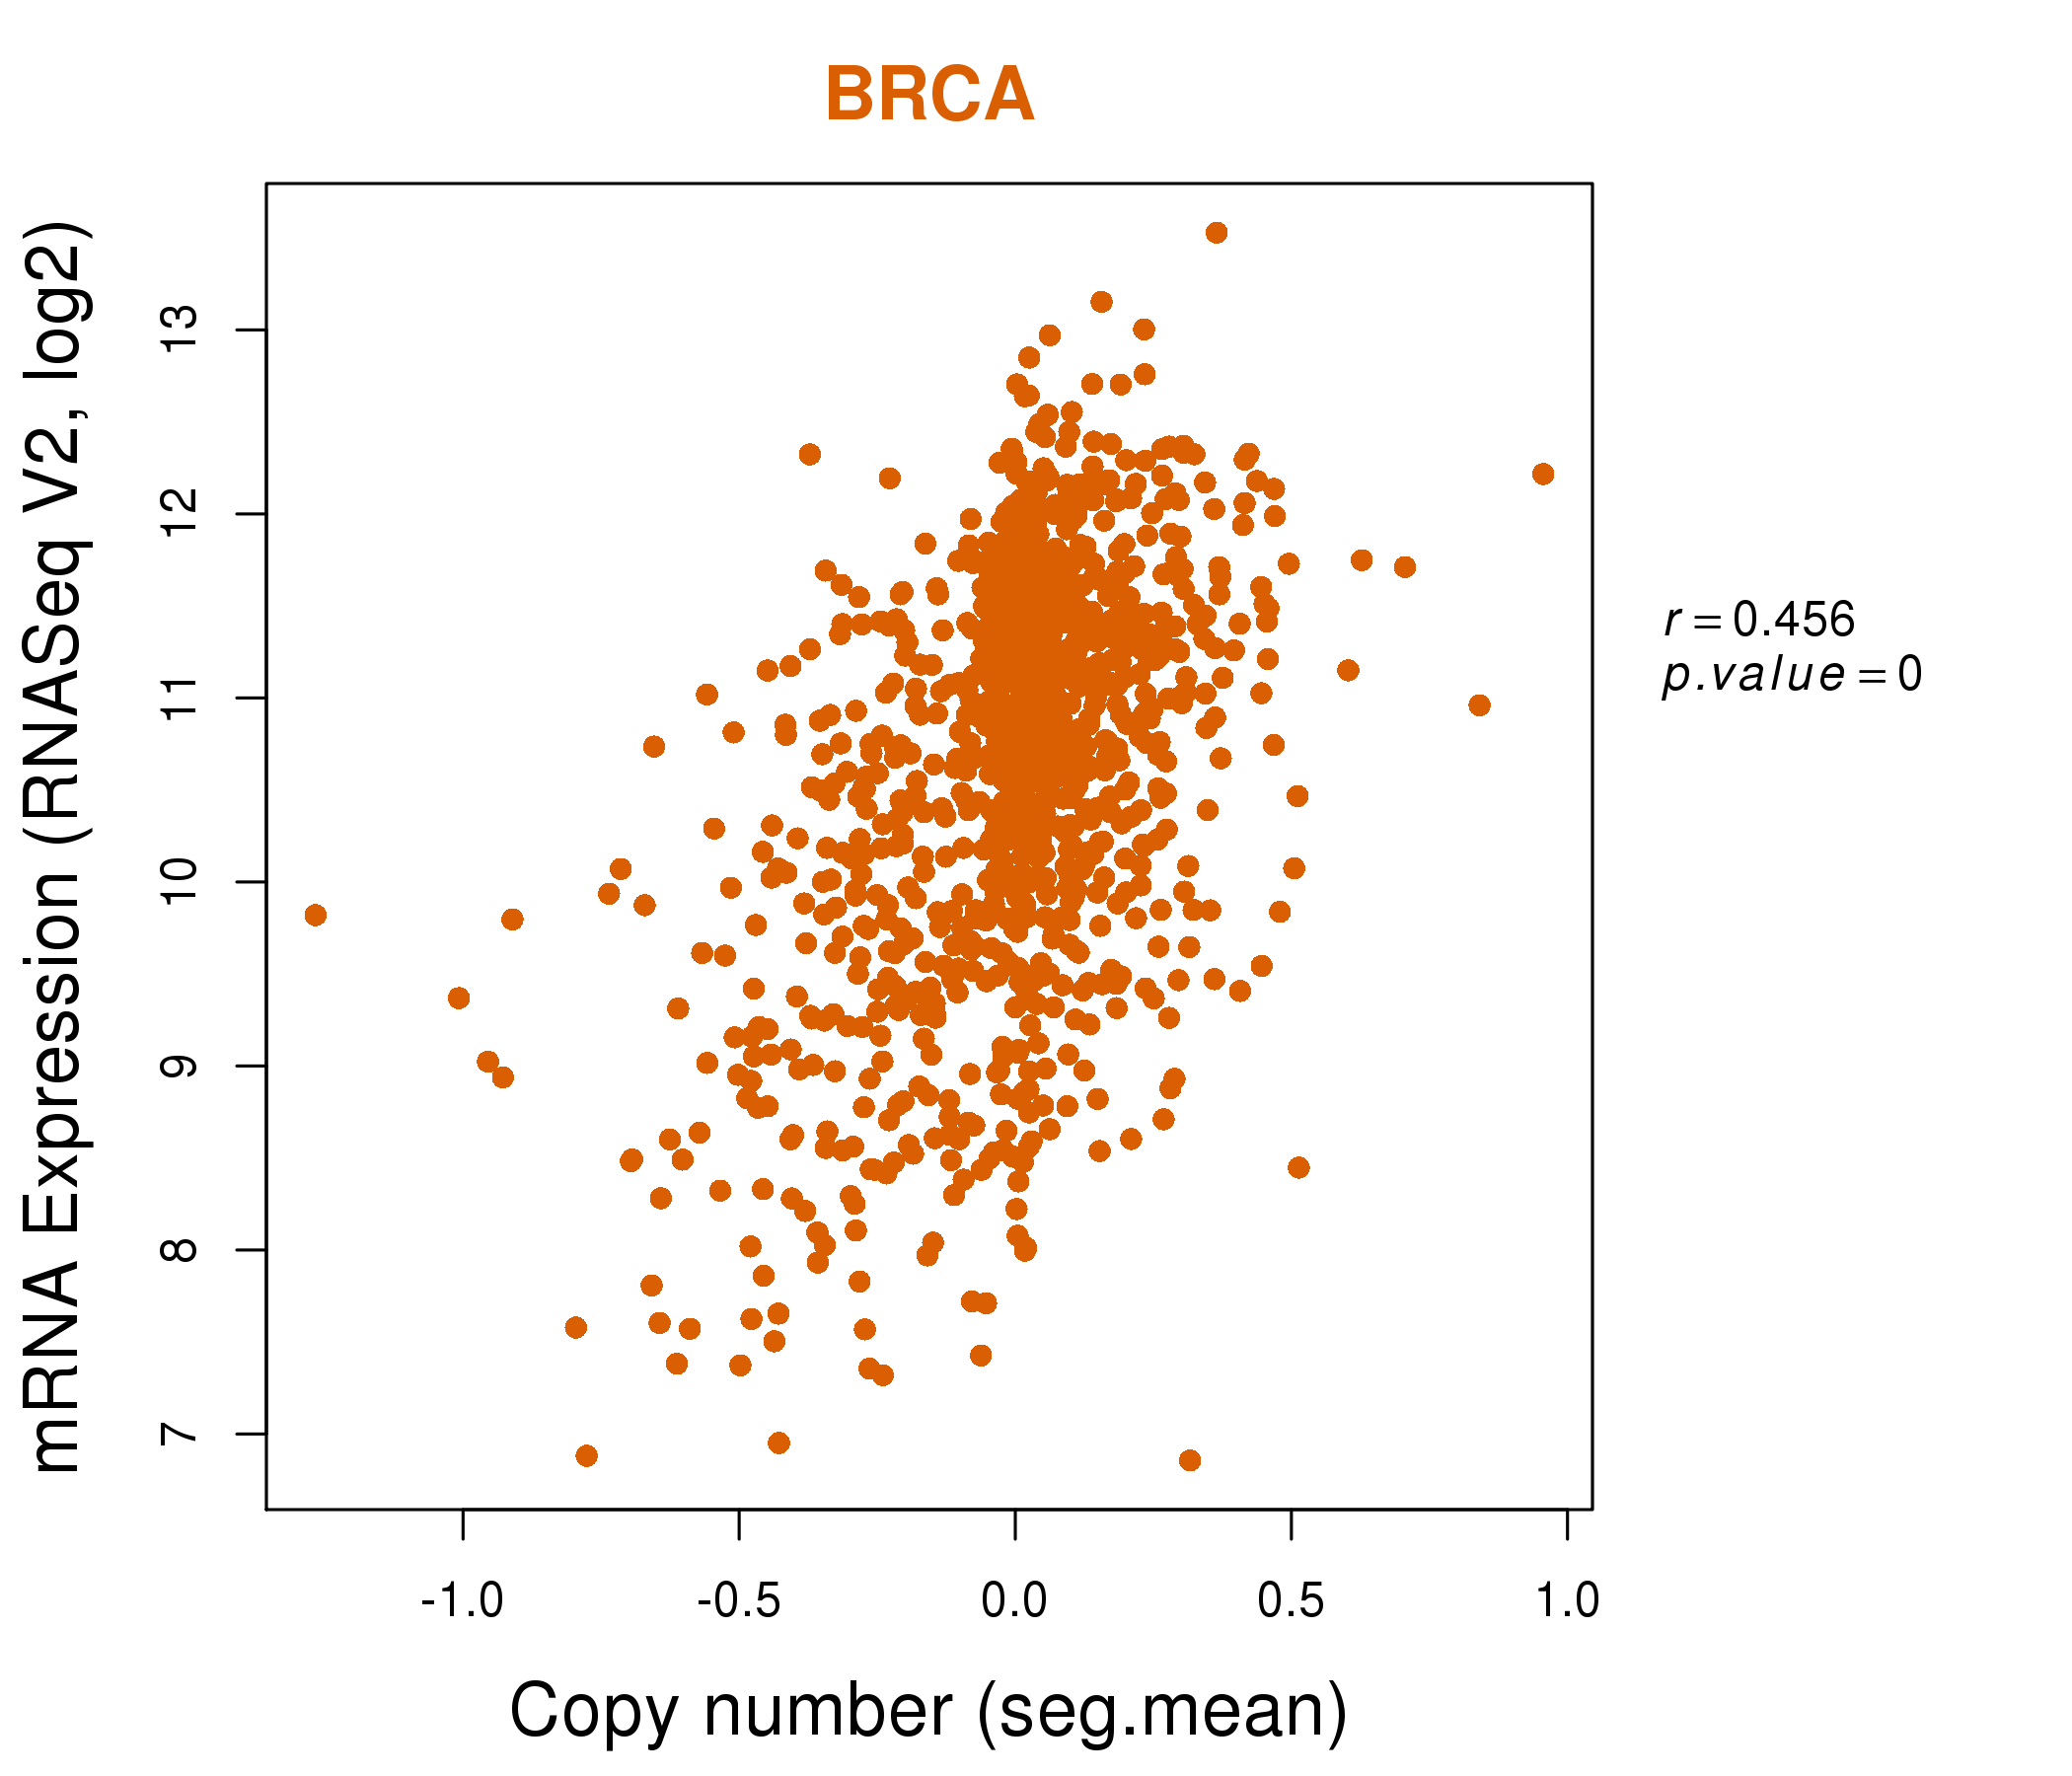
| * This plots show the correlation between CNV and gene expression. |
: Open all plots for all cancer types
 |
|
 |
|
| Top |
| Gene-Gene Network Information |
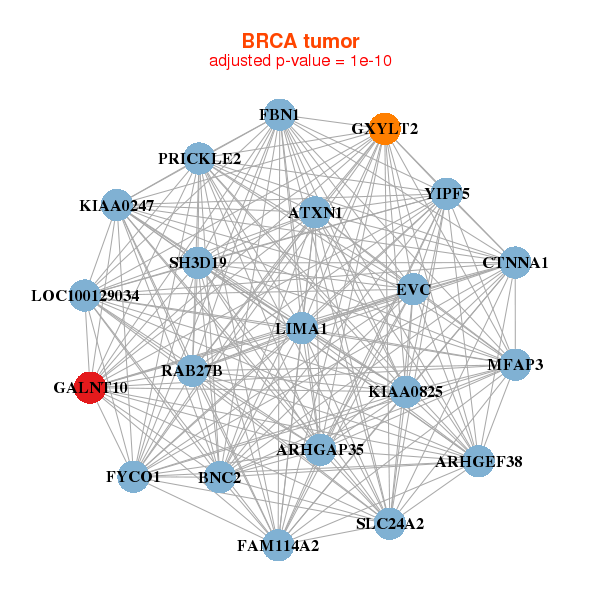
| * Co-Expression network figures were drawn using R package igraph. Only the top 20 genes with the highest correlations were shown. Red circle: input gene, orange circle: cell metabolism gene, sky circle: other gene |
: Open all plots for all cancer types
 |
|
| ARHGEF38,ATXN1,BNC2,KIAA0825,CTNNA1,EVC,FAM114A2, FBN1,FYCO1,GALNT10,ARHGAP35,GXYLT2,KIAA0247,LIMA1, LOC100129034,MFAP3,PRICKLE2,RAB27B,SH3D19,SLC24A2,YIPF5 | ADAM10,ATRN,C12orf49,CACNA1D,CHST15,EDARADD,GALNT10, LTBP2,MAGI3,MICALCL,MYOF,PTPRJ,RAB27B,RASEF, SEPT8,SFMBT2,SIPA1L1,SLC2A10,TTC26,TXLNA,WWC3 |
 |
|
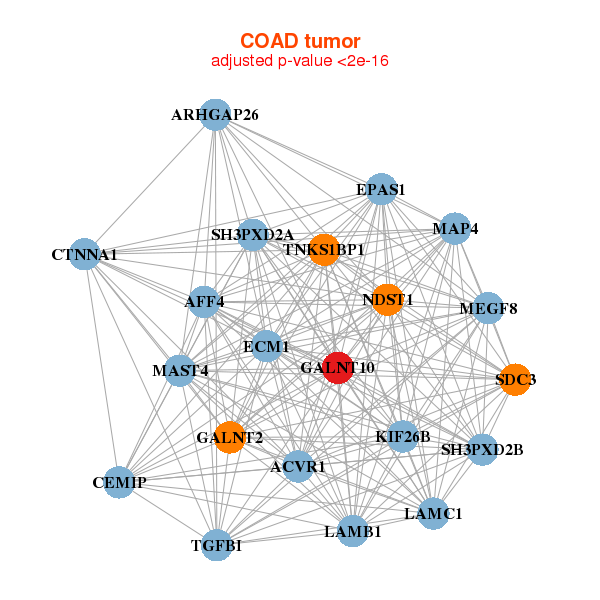
| ACVR1,AFF4,ARHGAP26,CTNNA1,ECM1,EPAS1,GALNT10, GALNT2,CEMIP,KIF26B,LAMB1,LAMC1,MAP4,MAST4, MEGF8,NDST1,SDC3,SH3PXD2A,SH3PXD2B,TGFBI,TNKS1BP1 | ABHD2,ACLY,ASCC3,EIF4G1,EPRS,GALNT10,GANAB, MKI67,PDE11A,PRKDC,SBNO1,SEC16A,SEC24C,SEC61A1, SMC1A,STT3A,TAF15,TMEM214,TRIP11,UGGT1,VPS53 |


| * Co-Expression network figures were drawn using R package igraph. Only the top 20 genes with the highest correlations were shown. Red circle: input gene, orange circle: cell metabolism gene, sky circle: other gene |
: Open all plots for all cancer types
| Top |
: Open all interacting genes' information including KEGG pathway for all interacting genes from DAVID
| Top |
| Pharmacological Information for GALNT10 |
| There's no related Drug. |
| Top |
| Cross referenced IDs for GALNT10 |
| * We obtained these cross-references from Uniprot database. It covers 150 different DBs, 18 categories. http://www.uniprot.org/help/cross_references_section |
: Open all cross reference information
|
Copyright © 2016-Present - The Univsersity of Texas Health Science Center at Houston @ |