|
||||||||||||||||||||||||||||||||||||||||||||||||||||||||||||||||||||||||||||||||||||||||||||||||||||||||||||||||||||||||||||||||||||||||||||||||||||||||||||||||||||||||||||||||||||||||||||||||||||||||||||||||||||||||||||||||||||||||||||||||||||||||||||||||||||||||||||||||||||||||||||||||||||||||||||||||||||||||||
| |
| Phenotypic Information (metabolism pathway, cancer, disease, phenome) |
| |
| |
| Gene-Gene Network Information: Co-Expression Network, Interacting Genes & KEGG |
| |
|


| Gene Summary for STAB2 |
| Basic gene info. | Gene symbol | STAB2 |
| Gene name | stabilin 2 | |
| Synonyms | FEEL2|FELE-2|FELL2|FEX2|HARE | |
| Cytomap | UCSC genome browser: 12q23.3 | |
| Genomic location | chr12 :103981068-104160502 | |
| Type of gene | protein-coding | |
| RefGenes | NM_017564.9, | |
| Ensembl id | ENSG00000136011 | |
| Description | CD44-like precursor FELLFAS1 EGF-like and X-link domain containing adhesion molecule-2fasciclin egf-like, laminin-type egf-like, and link domain-containing scavenger receptor-2hepatic hyaluronan clearance receptorhyaluronan receptor for endocytosishy | |
| Modification date | 20141207 | |
| dbXrefs | MIM : 608561 | |
| HGNC : HGNC | ||
| Ensembl : ENSG00000136011 | ||
| HPRD : 10542 | ||
| Vega : OTTHUMG00000170056 | ||
| Protein | UniProt: go to UniProt's Cross Reference DB Table | |
| Expression | CleanEX: HS_STAB2 | |
| BioGPS: 55576 | ||
| Gene Expression Atlas: ENSG00000136011 | ||
| The Human Protein Atlas: ENSG00000136011 | ||
| Pathway | NCI Pathway Interaction Database: STAB2 | |
| KEGG: STAB2 | ||
| REACTOME: STAB2 | ||
| ConsensusPathDB | ||
| Pathway Commons: STAB2 | ||
| Metabolism | MetaCyc: STAB2 | |
| HUMANCyc: STAB2 | ||
| Regulation | Ensembl's Regulation: ENSG00000136011 | |
| miRBase: chr12 :103,981,068-104,160,502 | ||
| TargetScan: NM_017564 | ||
| cisRED: ENSG00000136011 | ||
| Context | iHOP: STAB2 | |
| cancer metabolism search in PubMed: STAB2 | ||
| UCL Cancer Institute: STAB2 | ||
| Assigned class in ccmGDB | C | |
| Top |
| Phenotypic Information for STAB2(metabolism pathway, cancer, disease, phenome) |
| Cancer | CGAP: STAB2 |
| Familial Cancer Database: STAB2 | |
| * This gene is included in those cancer gene databases. |
|
|
|
|
|
| . | ||||||||||||||||||||||||||||||||||||||||||||||||||||||||||||||||||||||||||||||||||||||||||||||||||||||||||||||||||||||||||||||||||||||||||||||||||||||||||||||||||||||||||||||||||||||||||||||||||||||||||||||||||||||||||||||||||||||||||||||||||||||||||||||||||||||||||||||||||||||||||||||||||||||||||||||||||||
Oncogene 1 | Significant driver gene in | |||||||||||||||||||||||||||||||||||||||||||||||||||||||||||||||||||||||||||||||||||||||||||||||||||||||||||||||||||||||||||||||||||||||||||||||||||||||||||||||||||||||||||||||||||||||||||||||||||||||||||||||||||||||||||||||||||||||||||||||||||||||||||||||||||||||||||||||||||||||||||||||||||||||||||||||||||||||||
| cf) number; DB name 1 Oncogene; http://nar.oxfordjournals.org/content/35/suppl_1/D721.long, 2 Tumor Suppressor gene; https://bioinfo.uth.edu/TSGene/, 3 Cancer Gene Census; http://www.nature.com/nrc/journal/v4/n3/abs/nrc1299.html, 4 CancerGenes; http://nar.oxfordjournals.org/content/35/suppl_1/D721.long, 5 Network of Cancer Gene; http://ncg.kcl.ac.uk/index.php, 1Therapeutic Vulnerabilities in Cancer; http://cbio.mskcc.org/cancergenomics/statius/ |
| REACTOME_HYALURONAN_METABOLISM REACTOME_METABOLISM_OF_CARBOHYDRATES | |
| OMIM | |
| Orphanet | |
| Disease | KEGG Disease: STAB2 |
| MedGen: STAB2 (Human Medical Genetics with Condition) | |
| ClinVar: STAB2 | |
| Phenotype | MGI: STAB2 (International Mouse Phenotyping Consortium) |
| PhenomicDB: STAB2 | |
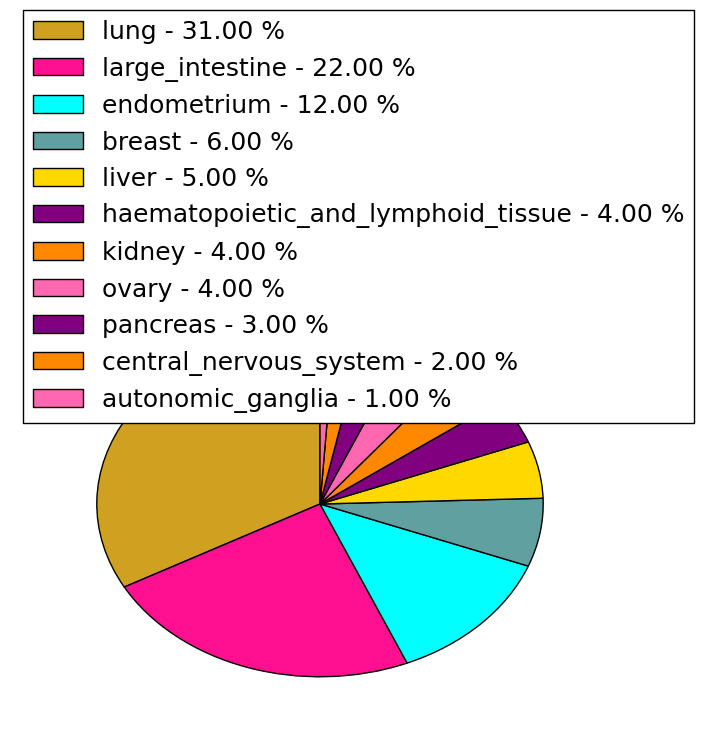
| Mutations for STAB2 |
| * Under tables are showing count per each tissue to give us broad intuition about tissue specific mutation patterns.You can go to the detailed page for each mutation database's web site. |
| - Statistics for Tissue and Mutation type | Top |
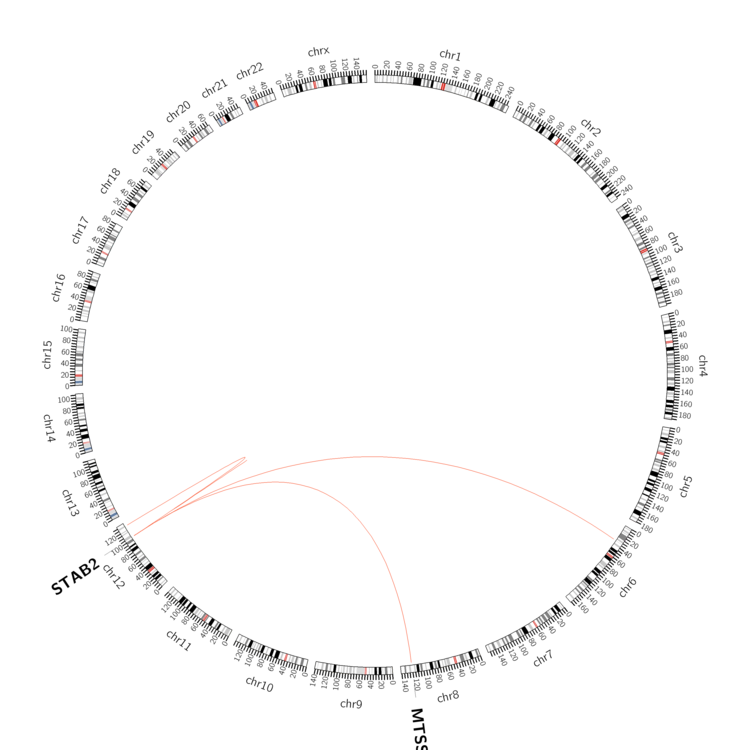 |
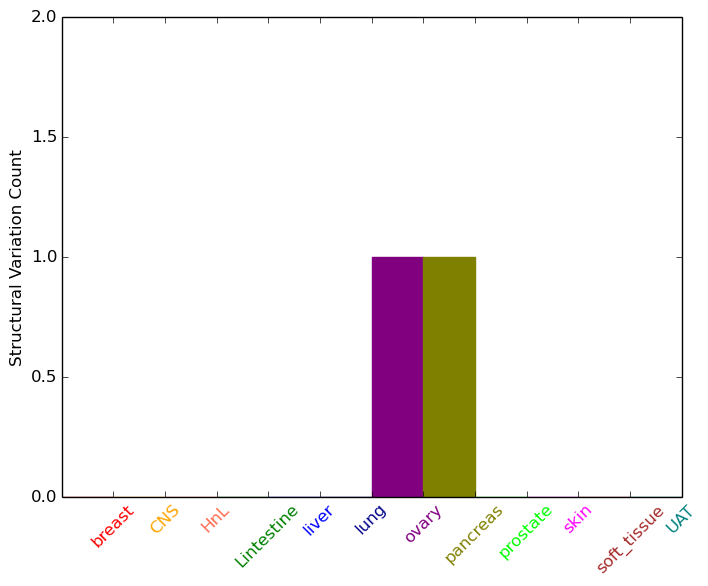
| - For Inter-chromosomal Variations |
| * Inter-chromosomal variantions includes 'interchromosomal amplicon to amplicon', 'interchromosomal amplicon to non-amplified dna', 'interchromosomal insertion', 'Interchromosomal unknown type'. |
 |
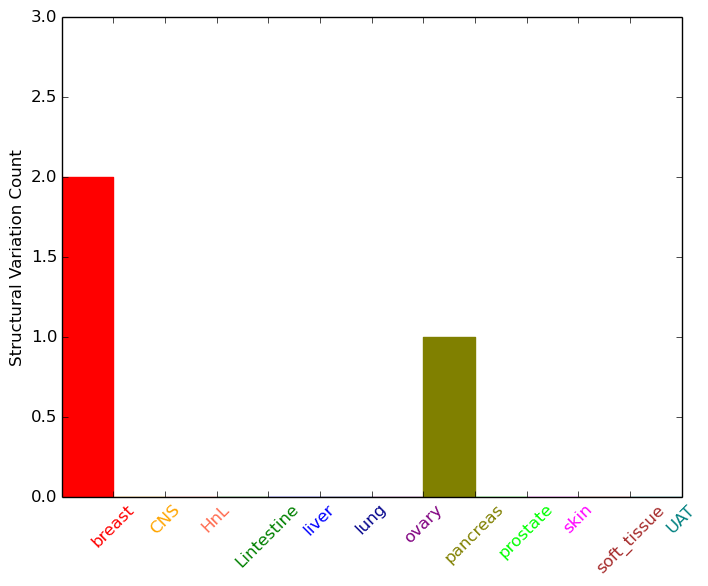
| - For Intra-chromosomal Variations |
| * Intra-chromosomal variantions includes 'intrachromosomal amplicon to amplicon', 'intrachromosomal amplicon to non-amplified dna', 'intrachromosomal deletion', 'intrachromosomal fold-back inversion', 'intrachromosomal inversion', 'intrachromosomal tandem duplication', 'Intrachromosomal unknown type', 'intrachromosomal with inverted orientation', 'intrachromosomal with non-inverted orientation'. |
 |
| Sample | Symbol_a | Chr_a | Start_a | End_a | Symbol_b | Chr_b | Start_b | End_b |
| breast | STAB2 | chr12 | 104116524 | 104116524 | chr12 | 127640816 | 127640816 | |
| ovary | STAB2 | chr12 | 104150505 | 104150525 | MTSS1 | chr8 | 125663004 | 125663024 |
| pancreas | STAB2 | chr12 | 104152953 | 104152973 | STAB2 | chr12 | 104156080 | 104156100 |
| cf) Tissue number; Tissue name (1;Breast, 2;Central_nervous_system, 3;Haematopoietic_and_lymphoid_tissue, 4;Large_intestine, 5;Liver, 6;Lung, 7;Ovary, 8;Pancreas, 9;Prostate, 10;Skin, 11;Soft_tissue, 12;Upper_aerodigestive_tract) |
| * From mRNA Sanger sequences, Chitars2.0 arranged chimeric transcripts. This table shows STAB2 related fusion information. |
| ID | Head Gene | Tail Gene | Accession | Gene_a | qStart_a | qEnd_a | Chromosome_a | tStart_a | tEnd_a | Gene_a | qStart_a | qEnd_a | Chromosome_a | tStart_a | tEnd_a |
| Top |
| Mutation type/ Tissue ID | brca | cns | cerv | endome | haematopo | kidn | Lintest | liver | lung | ns | ovary | pancre | prost | skin | stoma | thyro | urina | |||
| Total # sample | 1 | |||||||||||||||||||
| GAIN (# sample) | 1 | |||||||||||||||||||
| LOSS (# sample) |
| cf) Tissue ID; Tissue type (1; Breast, 2; Central_nervous_system, 3; Cervix, 4; Endometrium, 5; Haematopoietic_and_lymphoid_tissue, 6; Kidney, 7; Large_intestine, 8; Liver, 9; Lung, 10; NS, 11; Ovary, 12; Pancreas, 13; Prostate, 14; Skin, 15; Stomach, 16; Thyroid, 17; Urinary_tract) |
| Top |
|
 |
| Top |
| Stat. for Non-Synonymous SNVs (# total SNVs=246) | (# total SNVs=114) |
 | 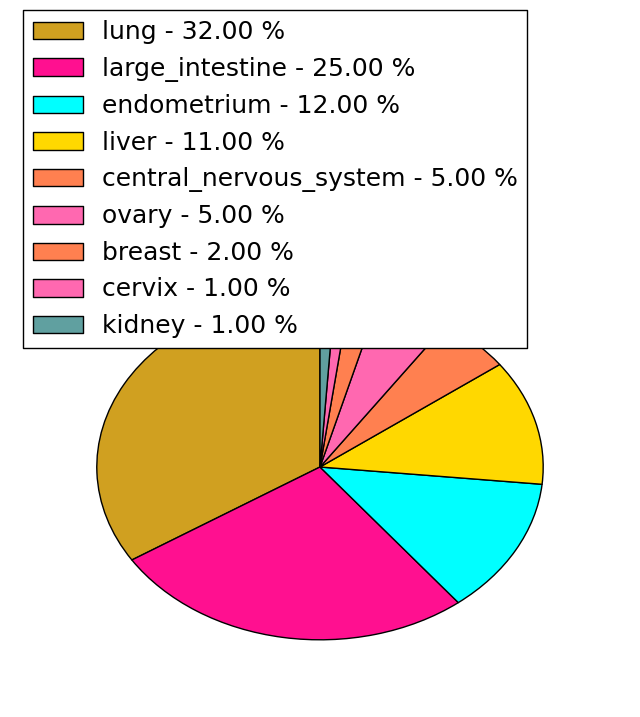 |
(# total SNVs=3) | (# total SNVs=1) |
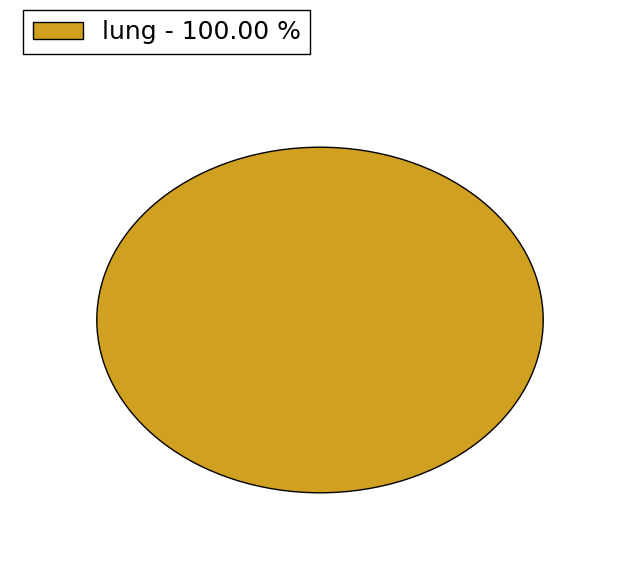 |  |
| Top |
| * When you move the cursor on each content, you can see more deailed mutation information on the Tooltip. Those are primary_site,primary_histology,mutation(aa),pubmedID. |
| GRCh37 position | Mutation(aa) | Unique sampleID count |
| chr12:104155080-104155080 | p.T2417T | 6 |
| chr12:104033936-104033936 | p.F314F | 5 |
| chr12:104155079-104155079 | p.T2417M | 4 |
| chr12:104062457-104062457 | p.F708V | 4 |
| chr12:103984748-103984748 | p.V52D | 3 |
| chr12:104092978-104092978 | p.F1229F | 3 |
| chr12:104129318-104129318 | p.G1837V | 3 |
| chr12:104134523-104134523 | p.R1957Q | 3 |
| chr12:104119924-104119924 | p.Y1612H | 3 |
| chr12:104156054-104156054 | p.T2454T | 3 |
| Top |
|
 |
| Point Mutation/ Tissue ID | 1 | 2 | 3 | 4 | 5 | 6 | 7 | 8 | 9 | 10 | 11 | 12 | 13 | 14 | 15 | 16 | 17 | 18 | 19 | 20 |
| # sample | 6 | 5 | 4 | 49 | 4 | 13 | 8 | 42 | 28 | 12 | 1 | 68 | 25 | 3 | 30 | |||||
| # mutation | 8 | 5 | 5 | 53 | 4 | 13 | 8 | 53 | 29 | 12 | 1 | 95 | 36 | 3 | 40 | |||||
| nonsynonymous SNV | 6 | 3 | 3 | 36 | 2 | 9 | 6 | 25 | 19 | 8 | 63 | 28 | 3 | 28 | ||||||
| synonymous SNV | 2 | 2 | 2 | 17 | 2 | 4 | 2 | 28 | 10 | 4 | 1 | 32 | 8 | 12 |
| cf) Tissue ID; Tissue type (1; BLCA[Bladder Urothelial Carcinoma], 2; BRCA[Breast invasive carcinoma], 3; CESC[Cervical squamous cell carcinoma and endocervical adenocarcinoma], 4; COAD[Colon adenocarcinoma], 5; GBM[Glioblastoma multiforme], 6; Glioma Low Grade, 7; HNSC[Head and Neck squamous cell carcinoma], 8; KICH[Kidney Chromophobe], 9; KIRC[Kidney renal clear cell carcinoma], 10; KIRP[Kidney renal papillary cell carcinoma], 11; LAML[Acute Myeloid Leukemia], 12; LUAD[Lung adenocarcinoma], 13; LUSC[Lung squamous cell carcinoma], 14; OV[Ovarian serous cystadenocarcinoma ], 15; PAAD[Pancreatic adenocarcinoma], 16; PRAD[Prostate adenocarcinoma], 17; SKCM[Skin Cutaneous Melanoma], 18:STAD[Stomach adenocarcinoma], 19:THCA[Thyroid carcinoma], 20:UCEC[Uterine Corpus Endometrial Carcinoma]) |
| Top |
| * We represented just top 10 SNVs. When you move the cursor on each content, you can see more deailed mutation information on the Tooltip. Those are primary_site, primary_histology, mutation(aa), pubmedID. |
| Genomic Position | Mutation(aa) | Unique sampleID count |
| chr12:104155080 | p.T2417T | 7 |
| chr12:104155079 | p.T2417M | 4 |
| chr12:103984748 | p.F314F | 3 |
| chr12:104077060 | p.V52A | 3 |
| chr12:104033936 | p.T961T | 3 |
| chr12:104042572 | p.A1792T | 2 |
| chr12:104049338 | p.A1874A | 2 |
| chr12:104118760 | p.P2170P | 2 |
| chr12:104157305 | p.K2508K | 2 |
| chr12:104131483 | p.L822L | 2 |
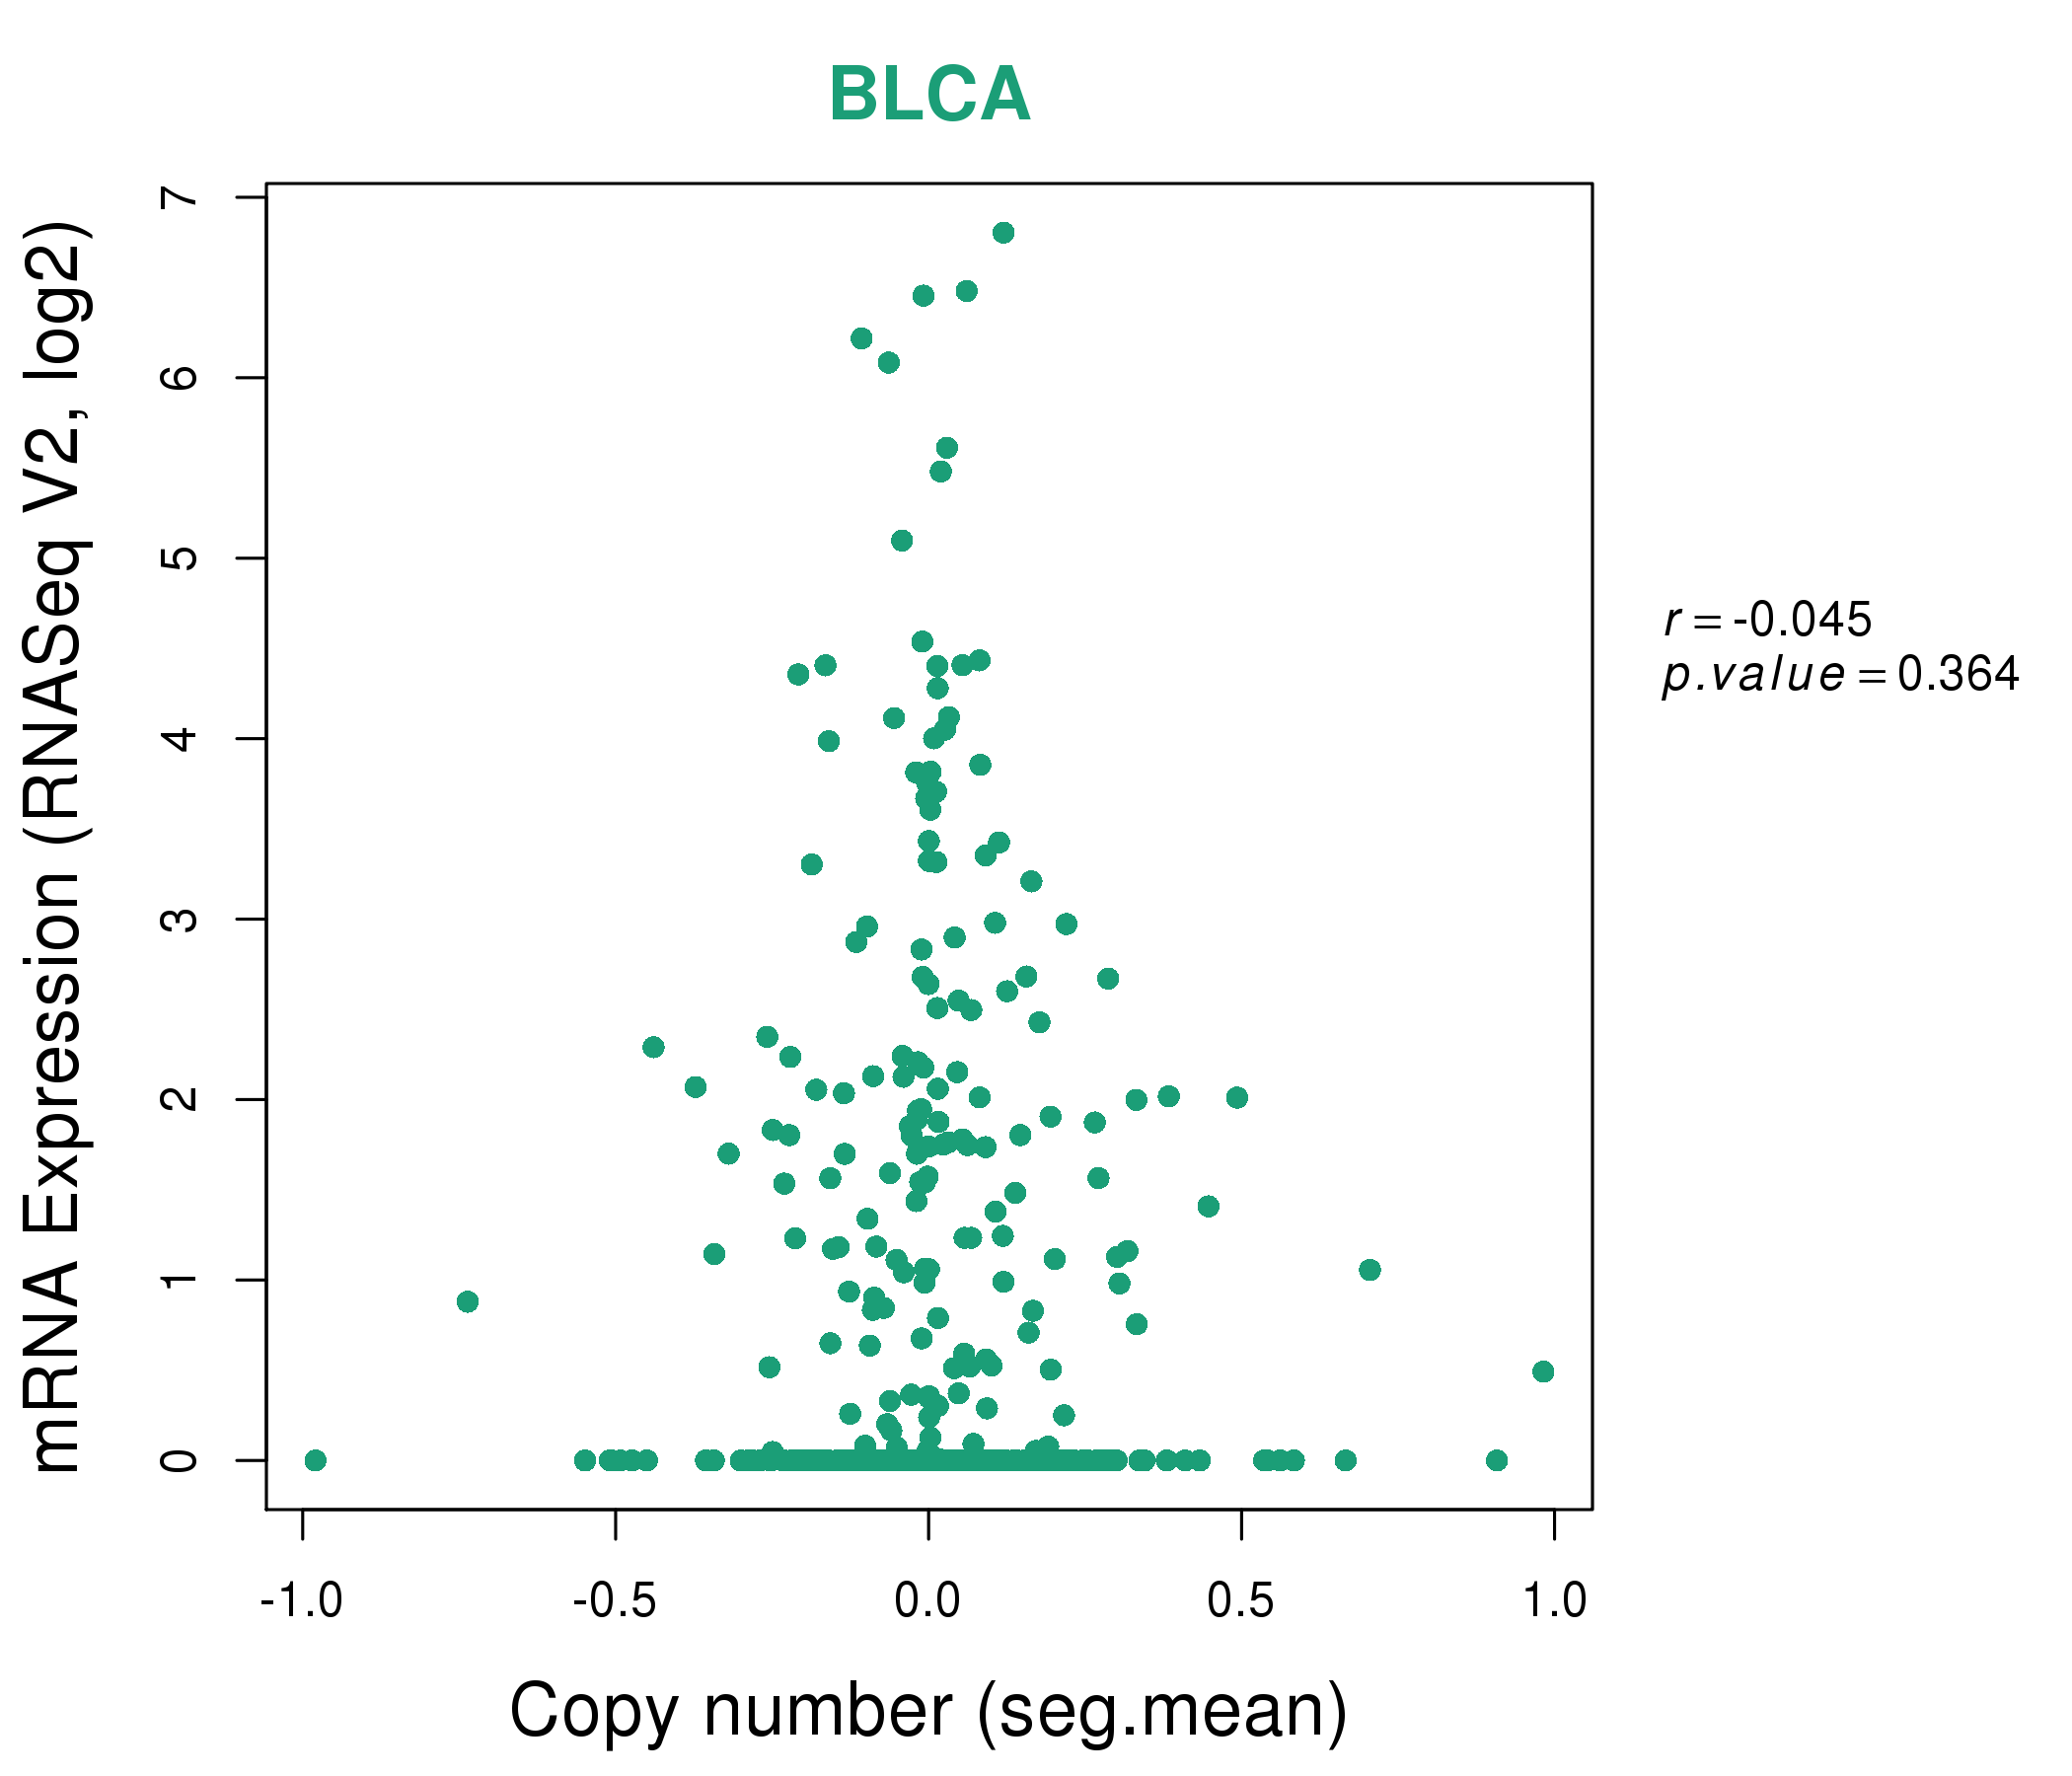
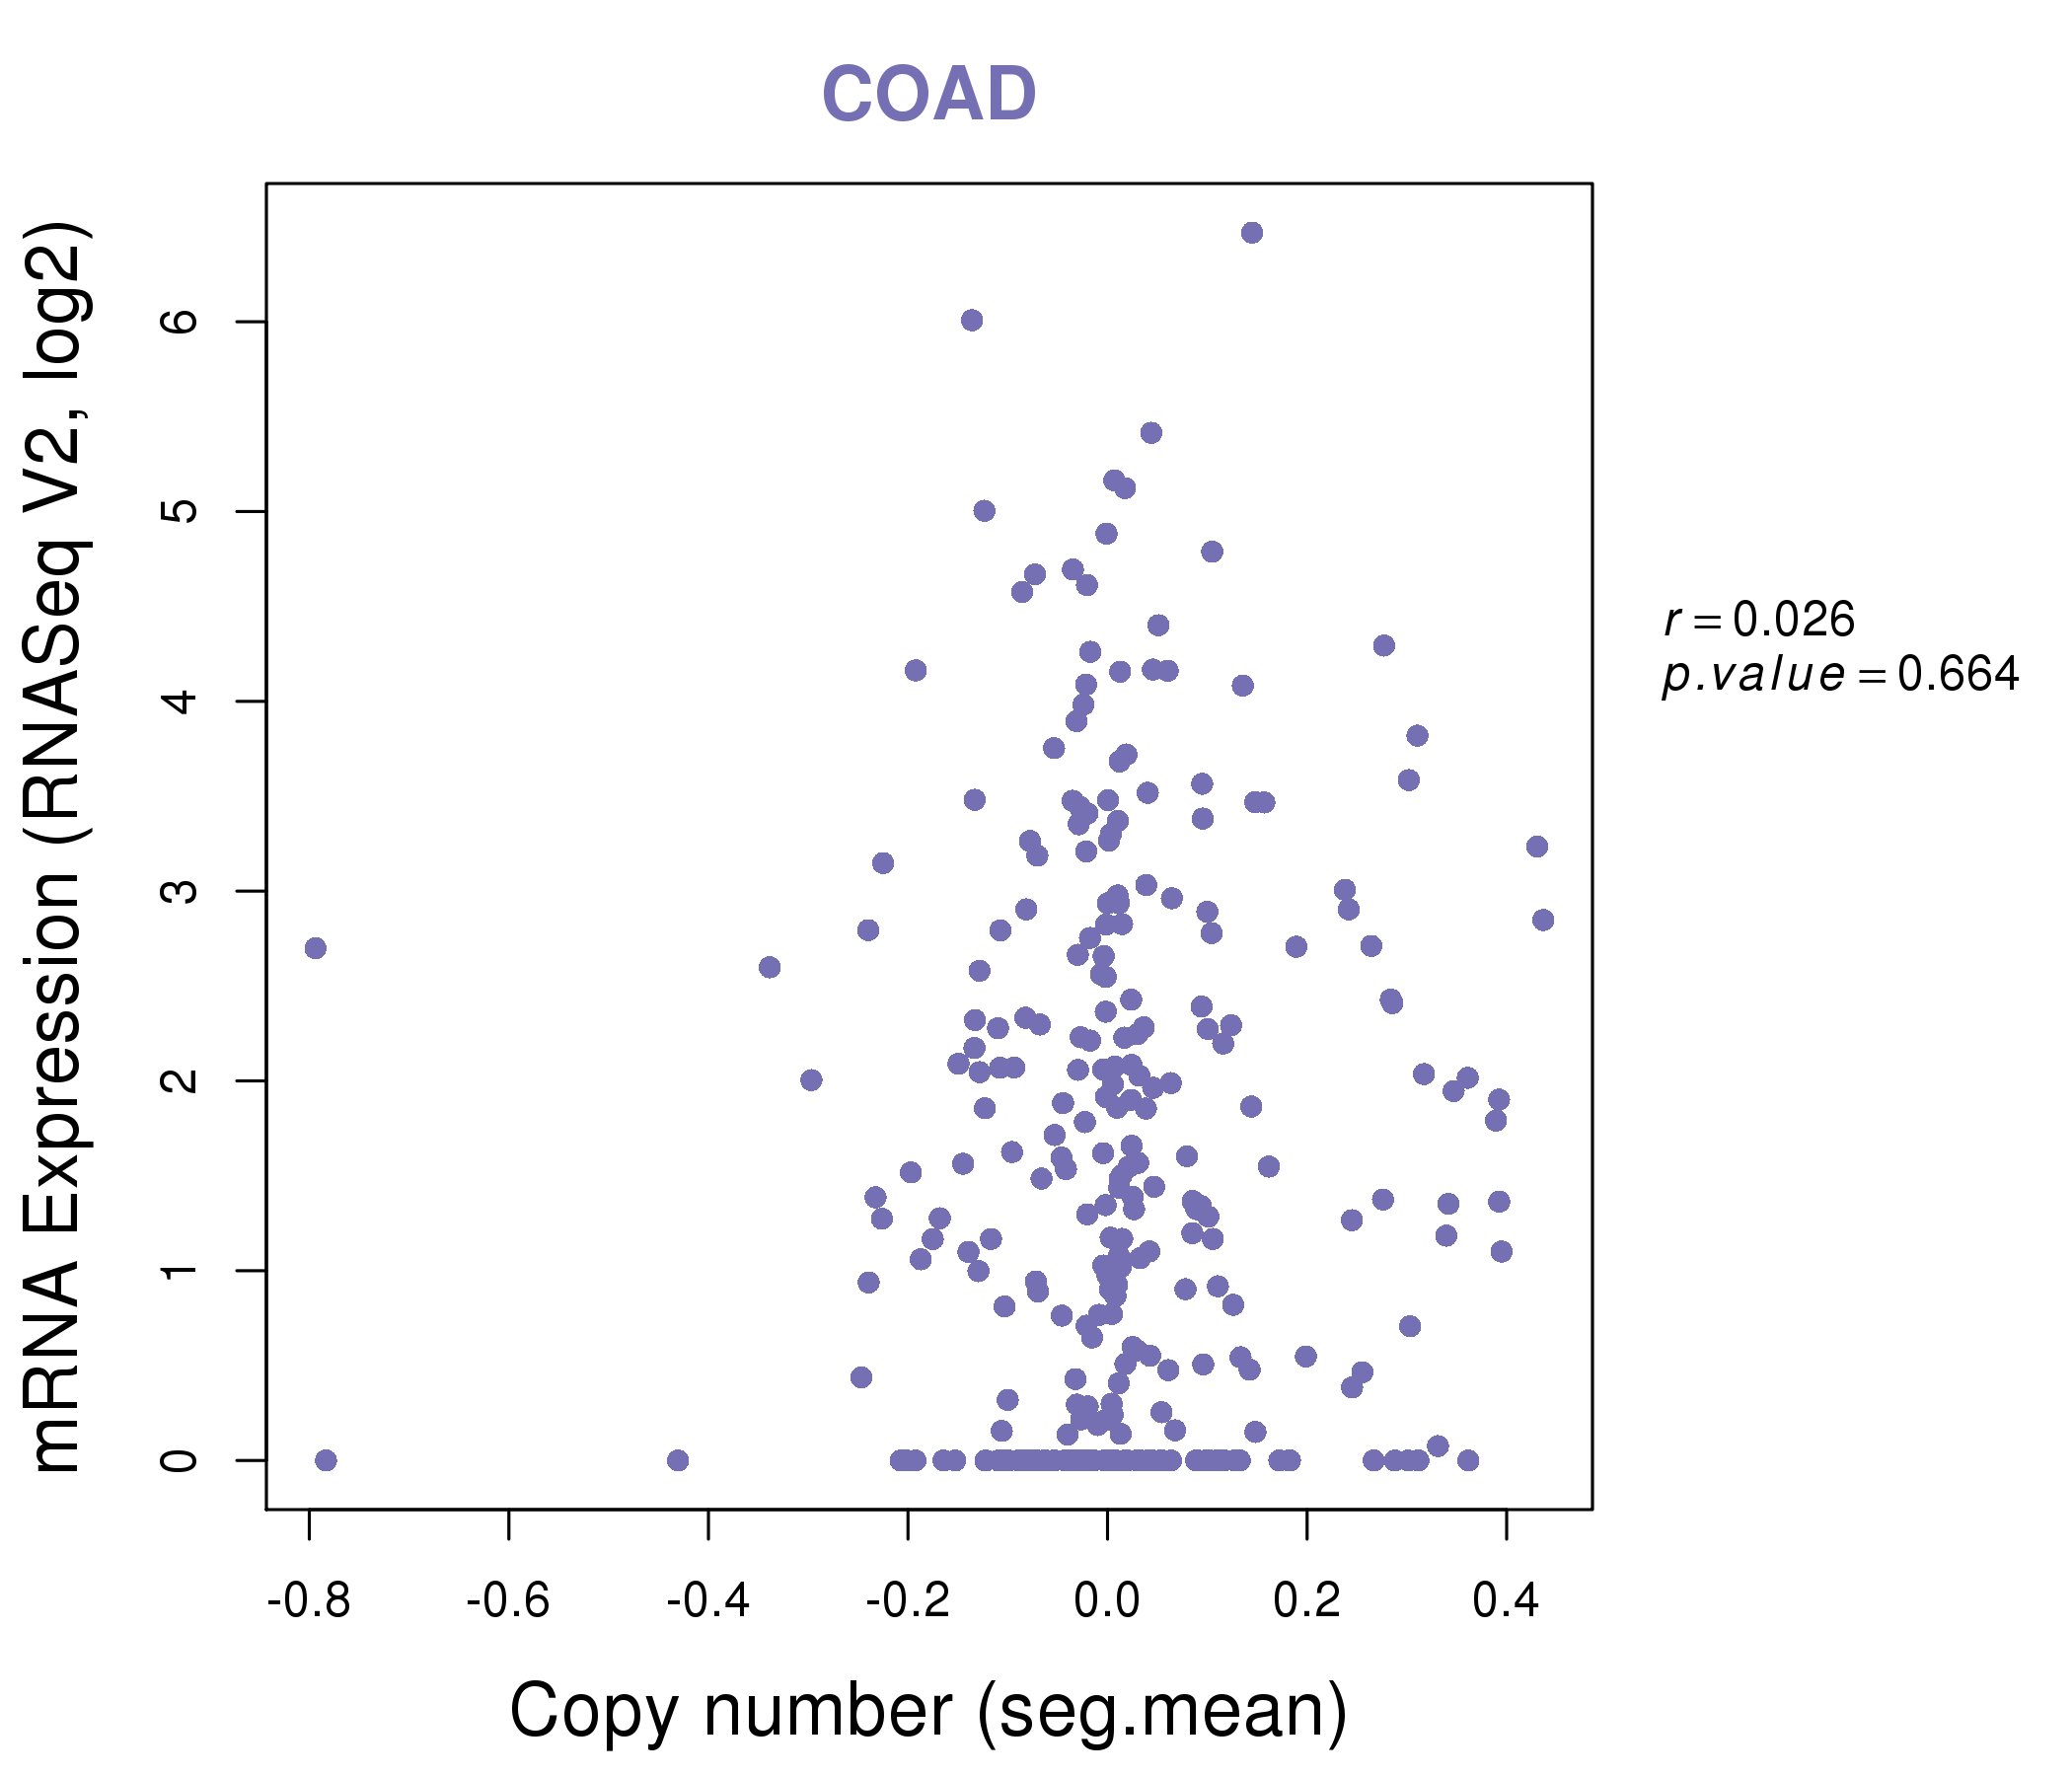
| * Copy number data were extracted from TCGA using R package TCGA-Assembler. The URLs of all public data files on TCGA DCC data server were gathered on Jan-05-2015. Function ProcessCNAData in TCGA-Assembler package was used to obtain gene-level copy number value which is calculated as the average copy number of the genomic region of a gene. |
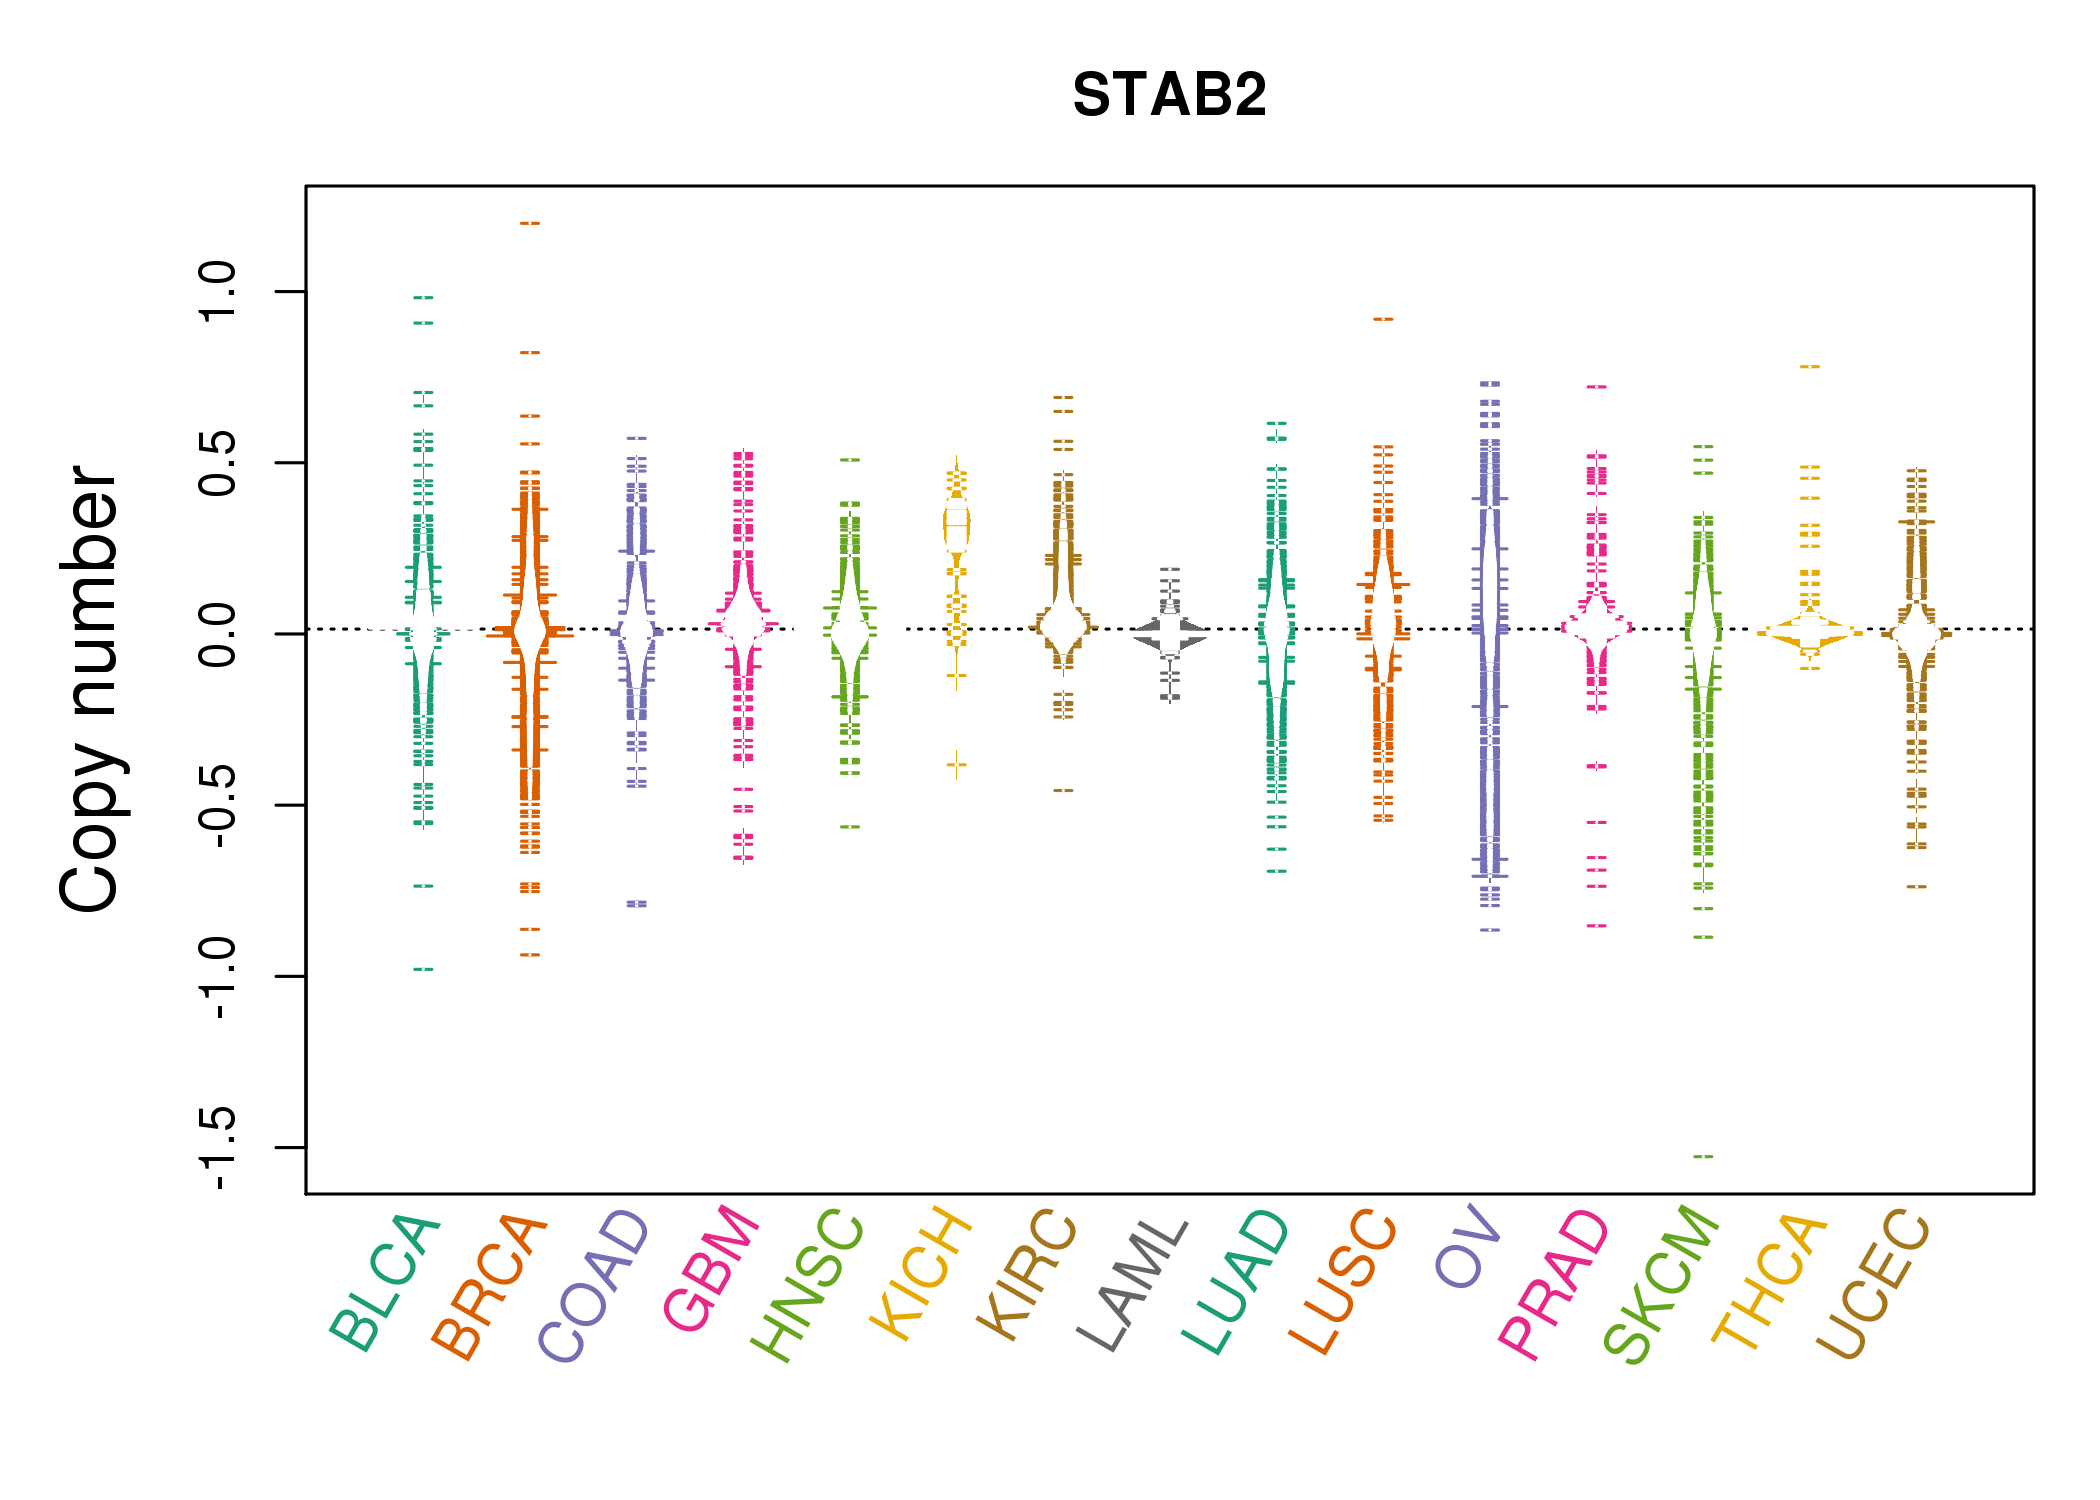 |
| cf) Tissue ID[Tissue type]: BLCA[Bladder Urothelial Carcinoma], BRCA[Breast invasive carcinoma], CESC[Cervical squamous cell carcinoma and endocervical adenocarcinoma], COAD[Colon adenocarcinoma], GBM[Glioblastoma multiforme], Glioma Low Grade, HNSC[Head and Neck squamous cell carcinoma], KICH[Kidney Chromophobe], KIRC[Kidney renal clear cell carcinoma], KIRP[Kidney renal papillary cell carcinoma], LAML[Acute Myeloid Leukemia], LUAD[Lung adenocarcinoma], LUSC[Lung squamous cell carcinoma], OV[Ovarian serous cystadenocarcinoma ], PAAD[Pancreatic adenocarcinoma], PRAD[Prostate adenocarcinoma], SKCM[Skin Cutaneous Melanoma], STAD[Stomach adenocarcinoma], THCA[Thyroid carcinoma], UCEC[Uterine Corpus Endometrial Carcinoma] |
| Top |
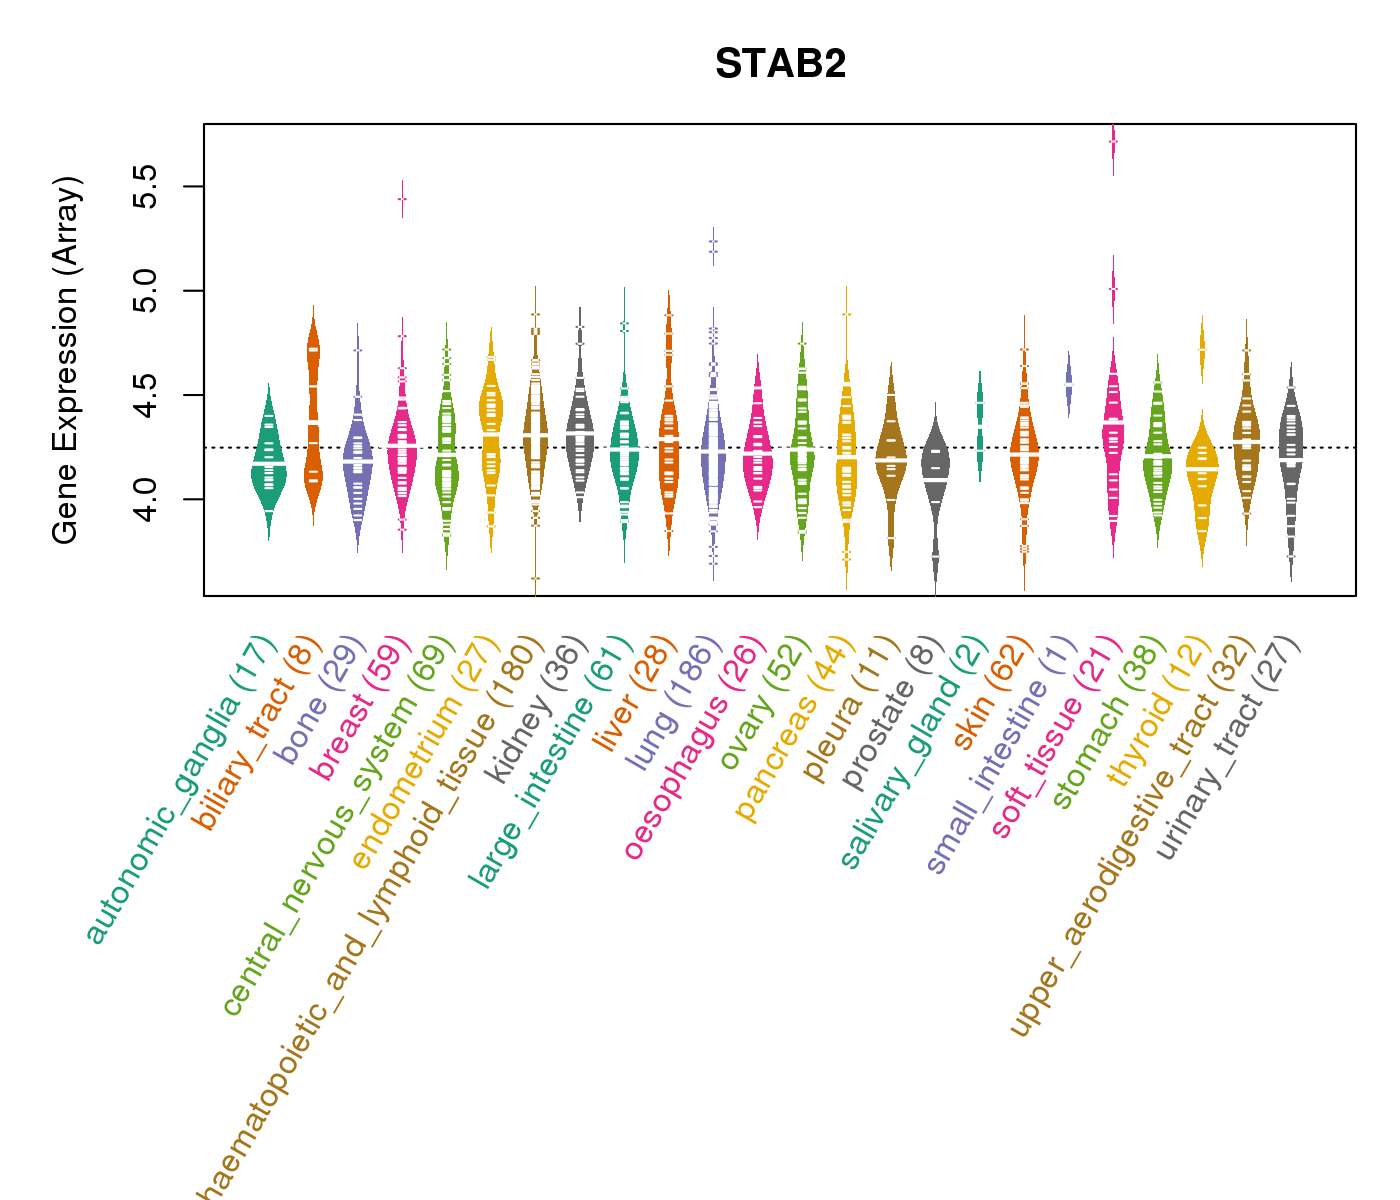
| Gene Expression for STAB2 |
| * CCLE gene expression data were extracted from CCLE_Expression_Entrez_2012-10-18.res: Gene-centric RMA-normalized mRNA expression data. |
 |
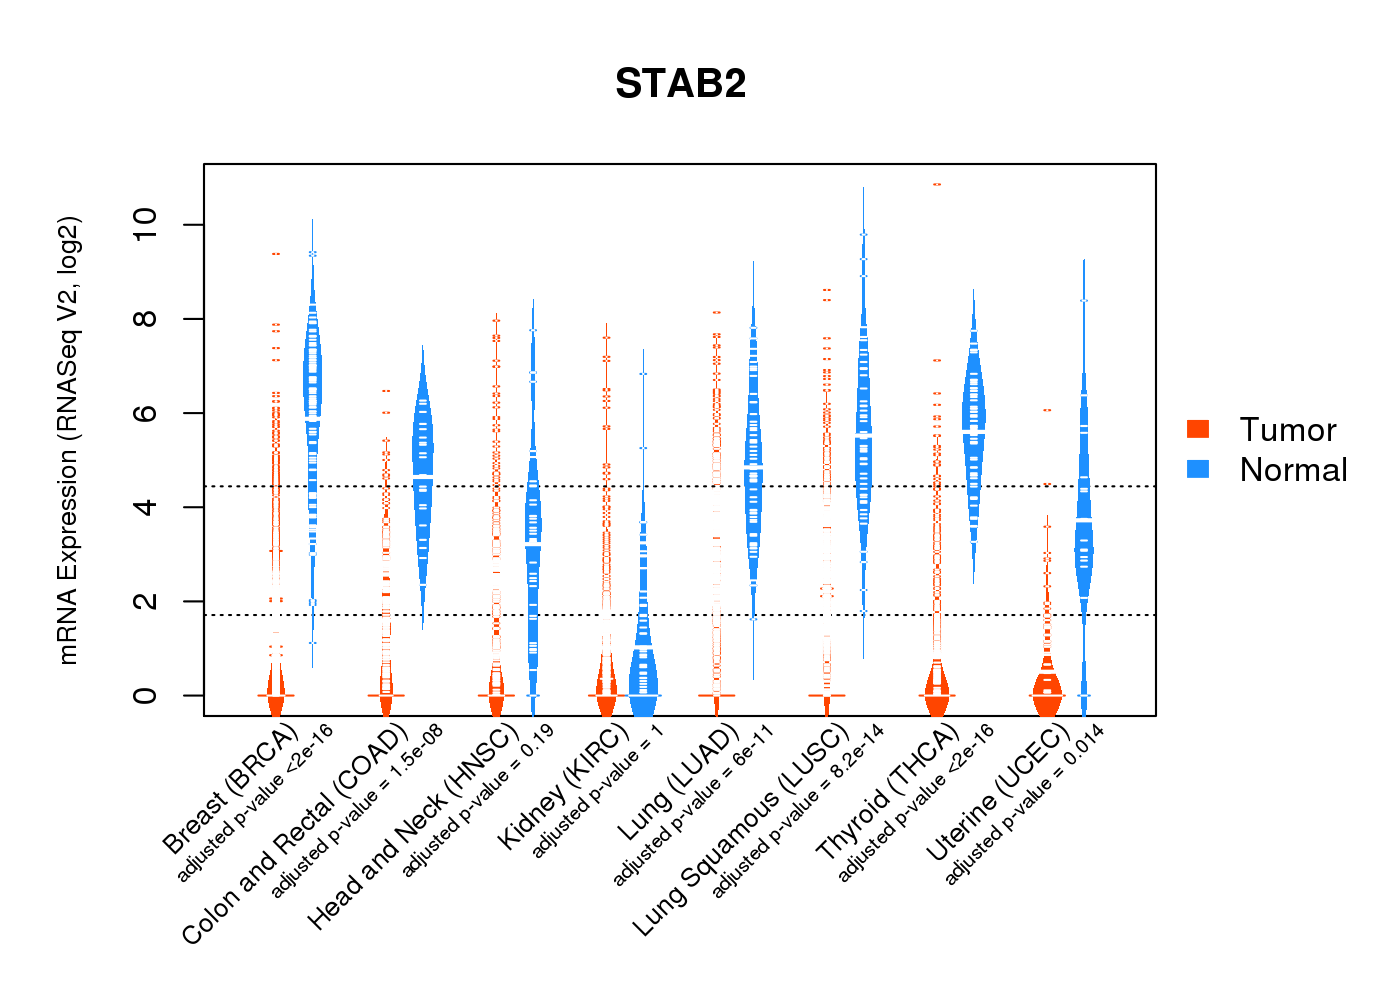
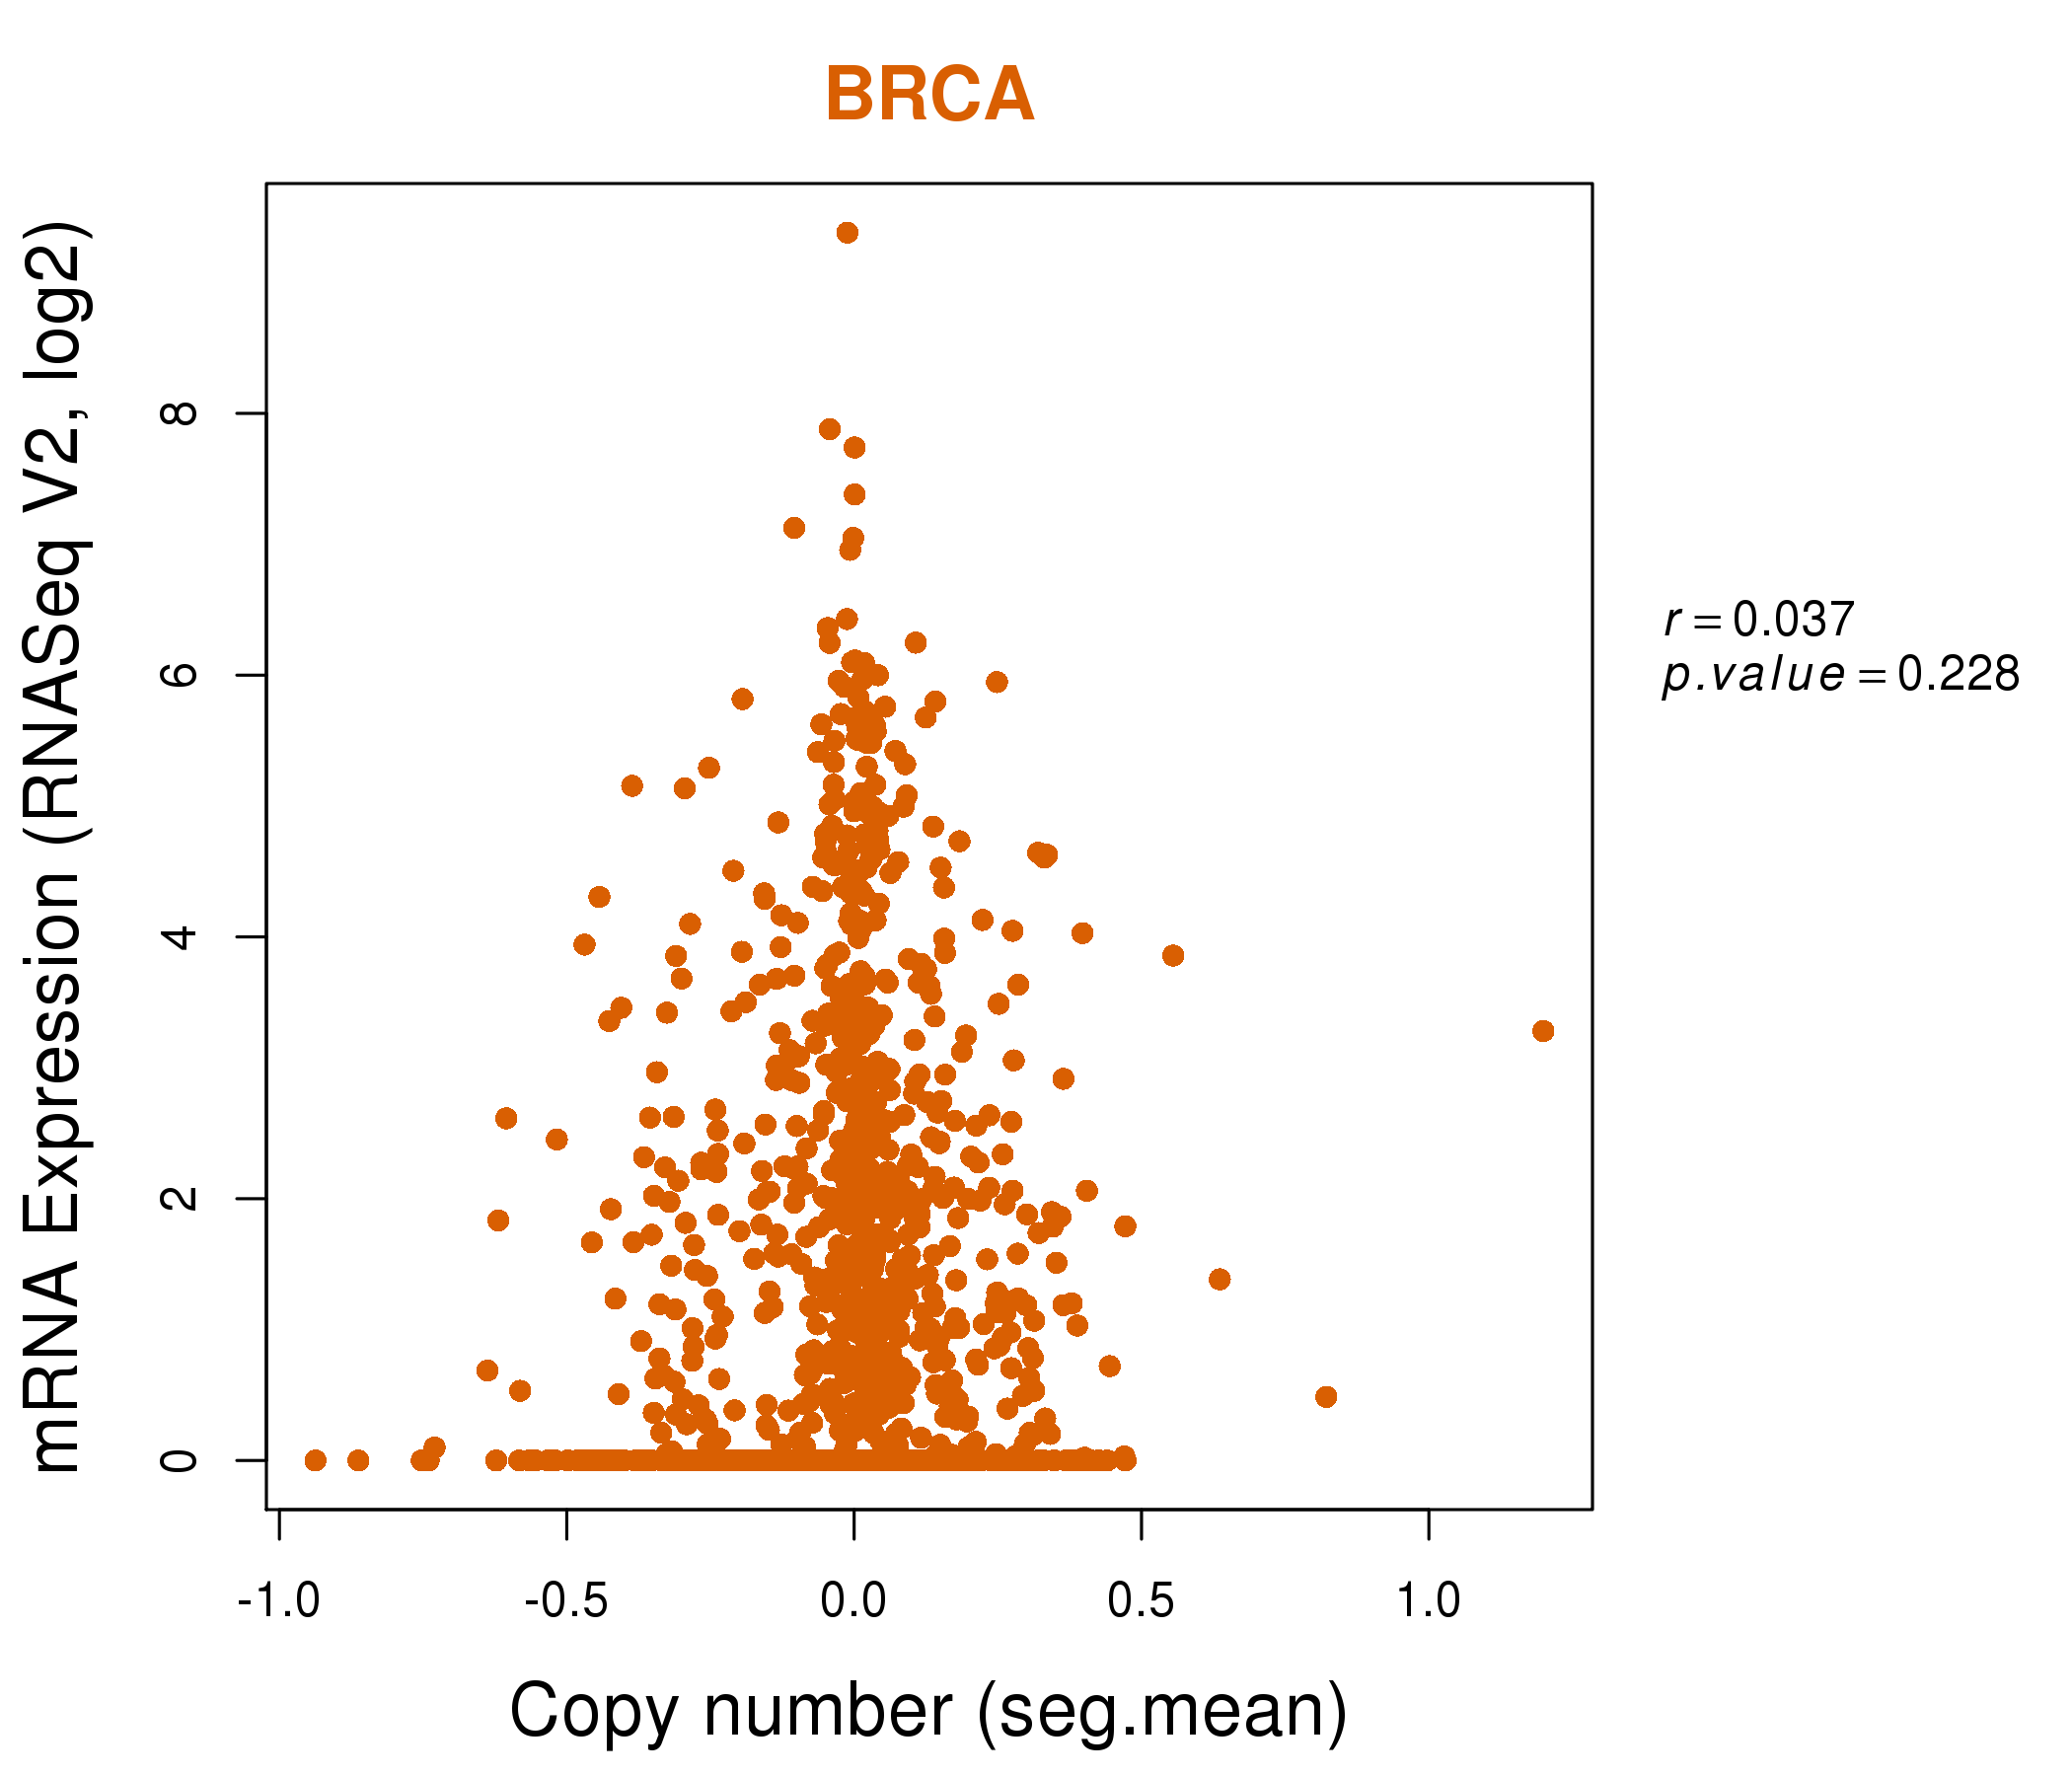
| * Normalized gene expression data of RNASeqV2 was extracted from TCGA using R package TCGA-Assembler. The URLs of all public data files on TCGA DCC data server were gathered at Jan-05-2015. Only eight cancer types have enough normal control samples for differential expression analysis. (t test, adjusted p<0.05 (using Benjamini-Hochberg FDR)) |
 |
| Top |
| * This plots show the correlation between CNV and gene expression. |
: Open all plots for all cancer types
 |
|
 |
|

| Top |
| Gene-Gene Network Information |
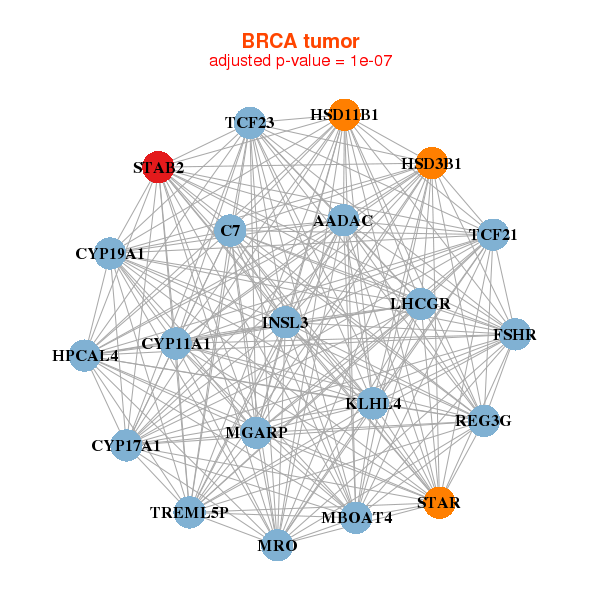
| * Co-Expression network figures were drawn using R package igraph. Only the top 20 genes with the highest correlations were shown. Red circle: input gene, orange circle: cell metabolism gene, sky circle: other gene |
: Open all plots for all cancer types
 |
|
| AADAC,MGARP,C7,CYP11A1,CYP17A1,CYP19A1,FSHR, HPCAL4,HSD11B1,HSD3B1,INSL3,KLHL4,LHCGR,MBOAT4, MRO,REG3G,STAB2,STAR,TCF21,TCF23,TREML5P | BPIFA4P,C17orf67,C17orf78,TSPEAR,CDH17,DNTT,FCER1A, GJD3,GPR182,GPR84,KCNIP1,KRTAP12-2,LGSN,MMRN1, OR4D2,PIM2,PTPRE,SEC14L4,PMEL,SOX21,STAB2 |
 |
|
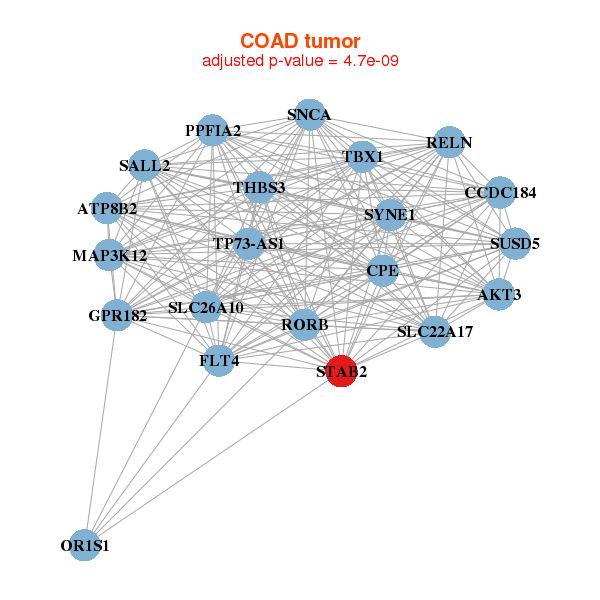
| AKT3,ATP8B2,CCDC184,CPE,FLT4,GPR182,TP73-AS1, MAP3K12,OR1S1,PPFIA2,RELN,RORB,SALL2,SLC22A17, SLC26A10,SNCA,STAB2,SUSD5,SYNE1,TBX1,THBS3 | ABCA2,AQP12B,DGCR2,ECE1,MVB12B,IL4R,KDM4B, LOC100131193,LOC646627,LRP4,MICAL3,PNPLA7,PTPN21,SCARB1, SRGAP1,STAB2,STIM1,TNK2,TOM1L2,TSTD2,USP19 |
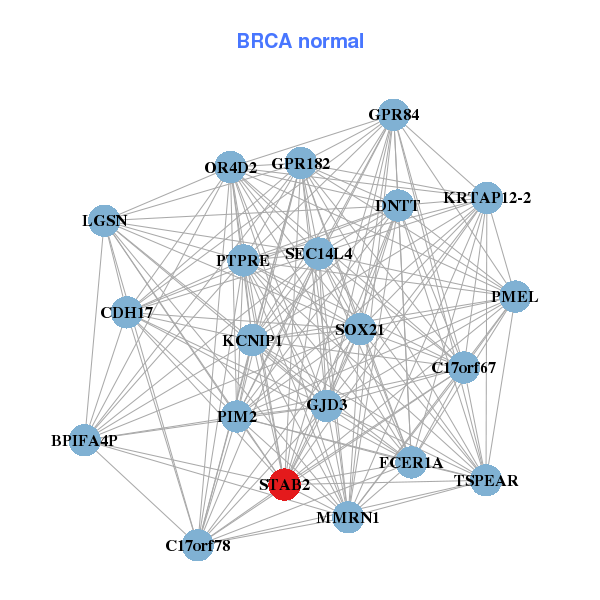
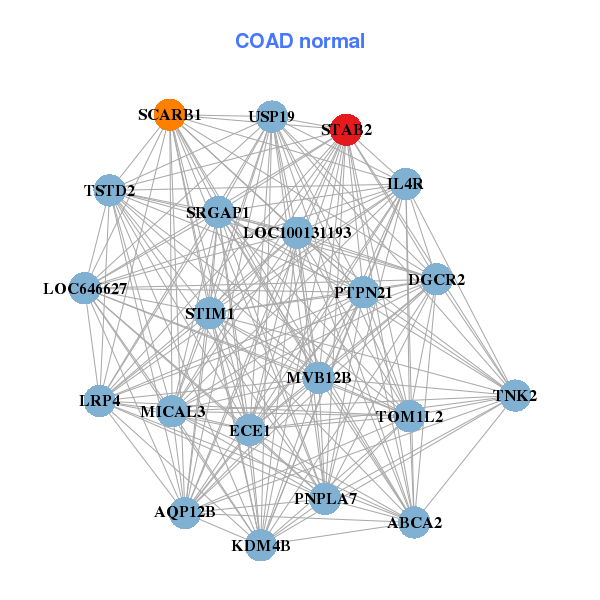
| * Co-Expression network figures were drawn using R package igraph. Only the top 20 genes with the highest correlations were shown. Red circle: input gene, orange circle: cell metabolism gene, sky circle: other gene |
: Open all plots for all cancer types
| Top |
: Open all interacting genes' information including KEGG pathway for all interacting genes from DAVID
| Top |
| Pharmacological Information for STAB2 |
| There's no related Drug. |
| Top |
| Cross referenced IDs for STAB2 |
| * We obtained these cross-references from Uniprot database. It covers 150 different DBs, 18 categories. http://www.uniprot.org/help/cross_references_section |
: Open all cross reference information
|
Copyright © 2016-Present - The Univsersity of Texas Health Science Center at Houston @ |