|
||||||||||||||||||||
| |
| Phenotypic Information (metabolism pathway, cancer, disease, phenome) |
| |
| |
| Gene-Gene Network Information: Co-Expression Network, Interacting Genes & KEGG |
| |
|


| Gene Summary for MIOX |
| Top |
| Phenotypic Information for MIOX(metabolism pathway, cancer, disease, phenome) |
| Cancer | CGAP: MIOX |
| Familial Cancer Database: MIOX | |
| * This gene is included in those cancer gene databases. |
|
|
|
|
|
| . | ||||||||||||||
Oncogene 1 | Significant driver gene in | |||||||||||||||||||
| cf) number; DB name 1 Oncogene; http://nar.oxfordjournals.org/content/35/suppl_1/D721.long, 2 Tumor Suppressor gene; https://bioinfo.uth.edu/TSGene/, 3 Cancer Gene Census; http://www.nature.com/nrc/journal/v4/n3/abs/nrc1299.html, 4 CancerGenes; http://nar.oxfordjournals.org/content/35/suppl_1/D721.long, 5 Network of Cancer Gene; http://ncg.kcl.ac.uk/index.php, 1Therapeutic Vulnerabilities in Cancer; http://cbio.mskcc.org/cancergenomics/statius/ |
| KEGG_ASCORBATE_AND_ALDARATE_METABOLISM KEGG_INOSITOL_PHOSPHATE_METABOLISM | |
| OMIM | |
| Orphanet | |
| Disease | KEGG Disease: MIOX |
| MedGen: MIOX (Human Medical Genetics with Condition) | |
| ClinVar: MIOX | |
| Phenotype | MGI: MIOX (International Mouse Phenotyping Consortium) |
| PhenomicDB: MIOX | |
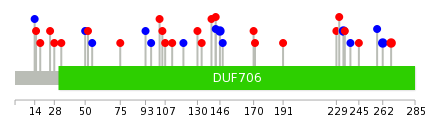
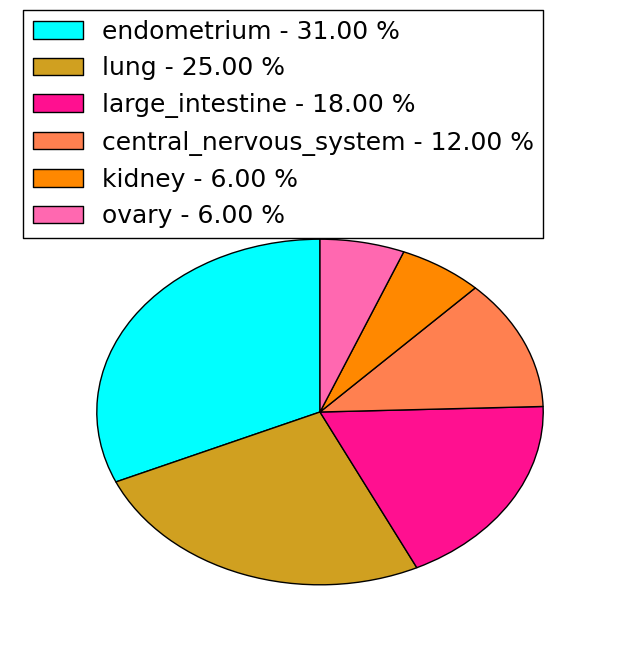
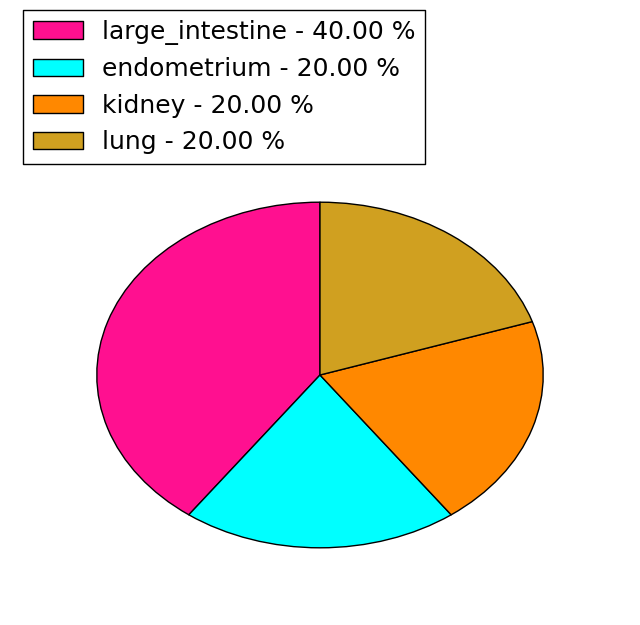
| Mutations for MIOX |
| * Under tables are showing count per each tissue to give us broad intuition about tissue specific mutation patterns.You can go to the detailed page for each mutation database's web site. |
| There's no structural variation information in COSMIC data for this gene. |
| * From mRNA Sanger sequences, Chitars2.0 arranged chimeric transcripts. This table shows MIOX related fusion information. |
| ID | Head Gene | Tail Gene | Accession | Gene_a | qStart_a | qEnd_a | Chromosome_a | tStart_a | tEnd_a | Gene_a | qStart_a | qEnd_a | Chromosome_a | tStart_a | tEnd_a |
| AF230095 | NUMA1 | 1 | 485 | 11 | 71778129 | 71778613 | MIOX | 486 | 1565 | 22 | 50925300 | 50928480 | |
| Top |
| There's no copy number variation information in COSMIC data for this gene. |
| Top |
|
 |
| Top |
| Stat. for Non-Synonymous SNVs (# total SNVs=16) | (# total SNVs=5) |
 |  |
(# total SNVs=0) | (# total SNVs=0) |
| Top |
| * When you move the cursor on each content, you can see more deailed mutation information on the Tooltip. Those are primary_site,primary_histology,mutation(aa),pubmedID. |
| GRCh37 position | Mutation(aa) | Unique sampleID count |
| chr22:50925838-50925838 | p.R14R | 4 |
| chr22:50928026-50928026 | p.L234L | 2 |
| chr22:50927498-50927498 | p.V146V | 2 |
| chr22:50928213-50928213 | p.P262P | 2 |
| chr22:50928230-50928230 | p.R268Q | 2 |
| chr22:50926723-50926723 | p.G120G | 1 |
| chr22:50928009-50928009 | p.R229C | 1 |
| chr22:50926144-50926144 | p.H50H | 1 |
| chr22:50926751-50926751 | p.A130T | 1 |
| chr22:50928015-50928015 | p.Y231N | 1 |
| Top |
|
 |
| Point Mutation/ Tissue ID | 1 | 2 | 3 | 4 | 5 | 6 | 7 | 8 | 9 | 10 | 11 | 12 | 13 | 14 | 15 | 16 | 17 | 18 | 19 | 20 |
| # sample | 2 | 1 | 2 | 1 | 1 | 1 | 3 | 1 | 1 | 5 | 6 | 5 | ||||||||
| # mutation | 2 | 1 | 2 | 1 | 1 | 1 | 3 | 1 | 1 | 5 | 6 | 6 | ||||||||
| nonsynonymous SNV | 1 | 2 | 1 | 1 | 1 | 1 | 1 | 1 | 2 | 4 | 5 | |||||||||
| synonymous SNV | 2 | 2 | 3 | 2 | 1 |
| cf) Tissue ID; Tissue type (1; BLCA[Bladder Urothelial Carcinoma], 2; BRCA[Breast invasive carcinoma], 3; CESC[Cervical squamous cell carcinoma and endocervical adenocarcinoma], 4; COAD[Colon adenocarcinoma], 5; GBM[Glioblastoma multiforme], 6; Glioma Low Grade, 7; HNSC[Head and Neck squamous cell carcinoma], 8; KICH[Kidney Chromophobe], 9; KIRC[Kidney renal clear cell carcinoma], 10; KIRP[Kidney renal papillary cell carcinoma], 11; LAML[Acute Myeloid Leukemia], 12; LUAD[Lung adenocarcinoma], 13; LUSC[Lung squamous cell carcinoma], 14; OV[Ovarian serous cystadenocarcinoma ], 15; PAAD[Pancreatic adenocarcinoma], 16; PRAD[Prostate adenocarcinoma], 17; SKCM[Skin Cutaneous Melanoma], 18:STAD[Stomach adenocarcinoma], 19:THCA[Thyroid carcinoma], 20:UCEC[Uterine Corpus Endometrial Carcinoma]) |
| Top |
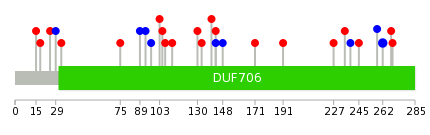
| * We represented just top 10 SNVs. When you move the cursor on each content, you can see more deailed mutation information on the Tooltip. Those are primary_site, primary_histology, mutation(aa), pubmedID. |
| Genomic Position | Mutation(aa) | Unique sampleID count |
| chr22:50928213 | p.P262P | 2 |
| chr22:50927504 | p.P269S | 1 |
| chr22:50926428 | p.D112Y | 1 |
| chr22:50927572 | p.A130T | 1 |
| chr22:50926445 | p.G133R | 1 |
| chr22:50927709 | p.V140I | 1 |
| chr22:50926451 | p.T143I | 1 |
| chr22:50928004 | p.P15S | 1 |
| chr22:50925841 | p.T143T | 1 |
| chr22:50926457 | p.D18Y | 1 |
| * Copy number data were extracted from TCGA using R package TCGA-Assembler. The URLs of all public data files on TCGA DCC data server were gathered on Jan-05-2015. Function ProcessCNAData in TCGA-Assembler package was used to obtain gene-level copy number value which is calculated as the average copy number of the genomic region of a gene. |
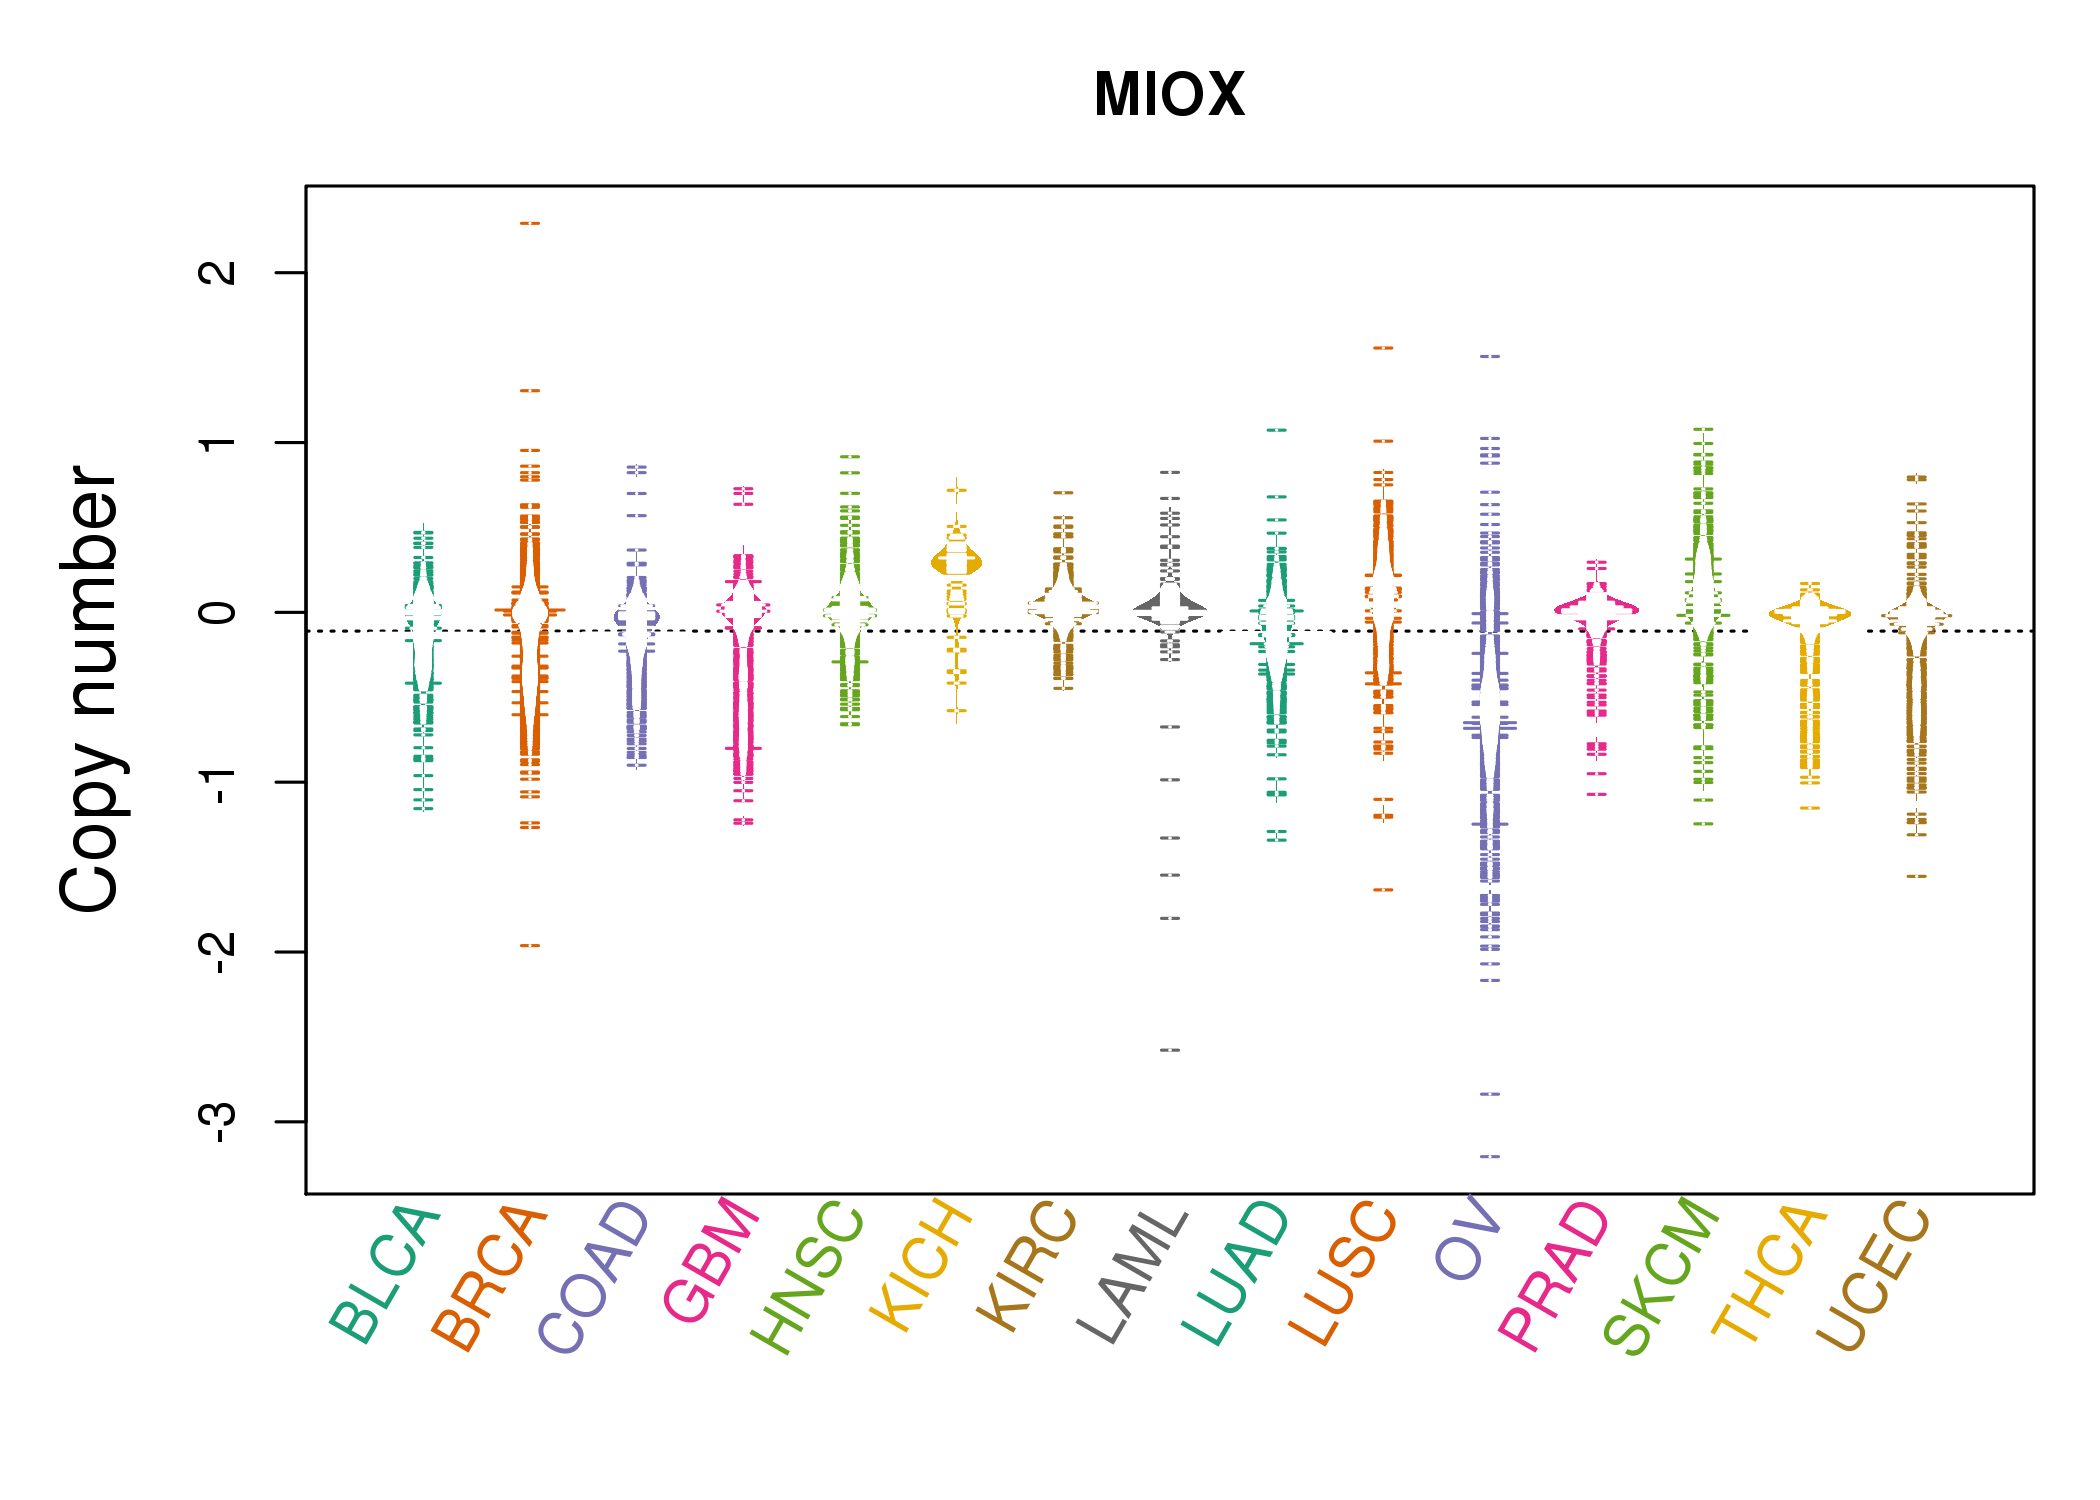 |
| cf) Tissue ID[Tissue type]: BLCA[Bladder Urothelial Carcinoma], BRCA[Breast invasive carcinoma], CESC[Cervical squamous cell carcinoma and endocervical adenocarcinoma], COAD[Colon adenocarcinoma], GBM[Glioblastoma multiforme], Glioma Low Grade, HNSC[Head and Neck squamous cell carcinoma], KICH[Kidney Chromophobe], KIRC[Kidney renal clear cell carcinoma], KIRP[Kidney renal papillary cell carcinoma], LAML[Acute Myeloid Leukemia], LUAD[Lung adenocarcinoma], LUSC[Lung squamous cell carcinoma], OV[Ovarian serous cystadenocarcinoma ], PAAD[Pancreatic adenocarcinoma], PRAD[Prostate adenocarcinoma], SKCM[Skin Cutaneous Melanoma], STAD[Stomach adenocarcinoma], THCA[Thyroid carcinoma], UCEC[Uterine Corpus Endometrial Carcinoma] |
| Top |
| Gene Expression for MIOX |
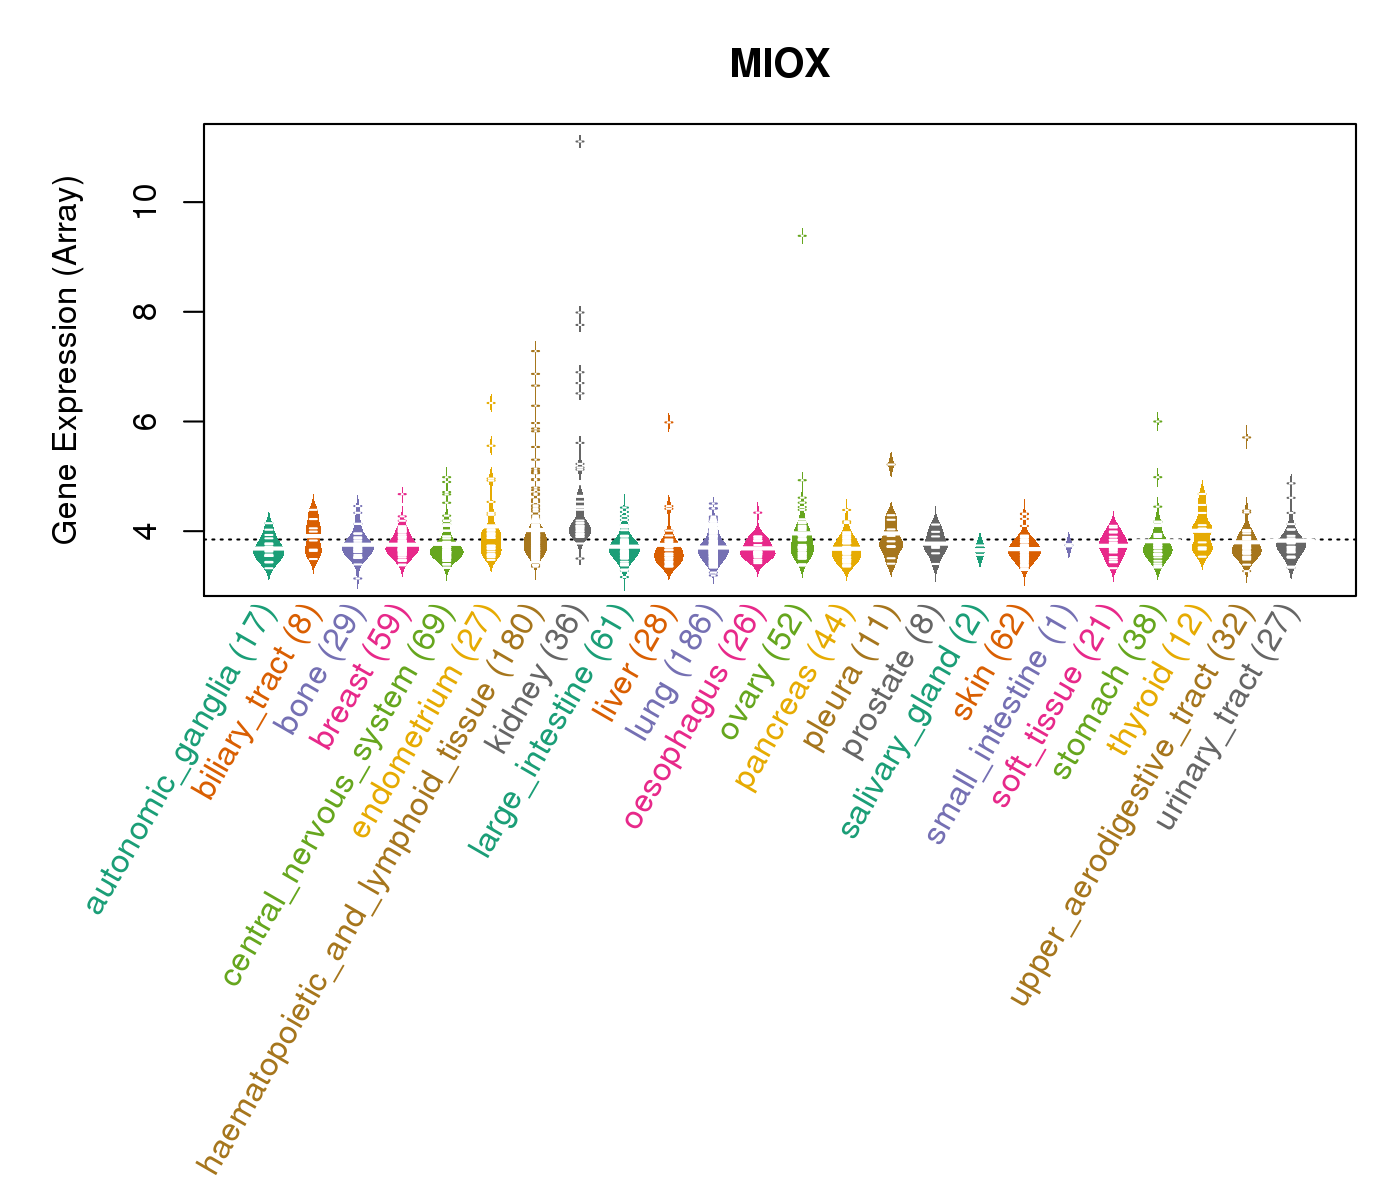
| * CCLE gene expression data were extracted from CCLE_Expression_Entrez_2012-10-18.res: Gene-centric RMA-normalized mRNA expression data. |
 |
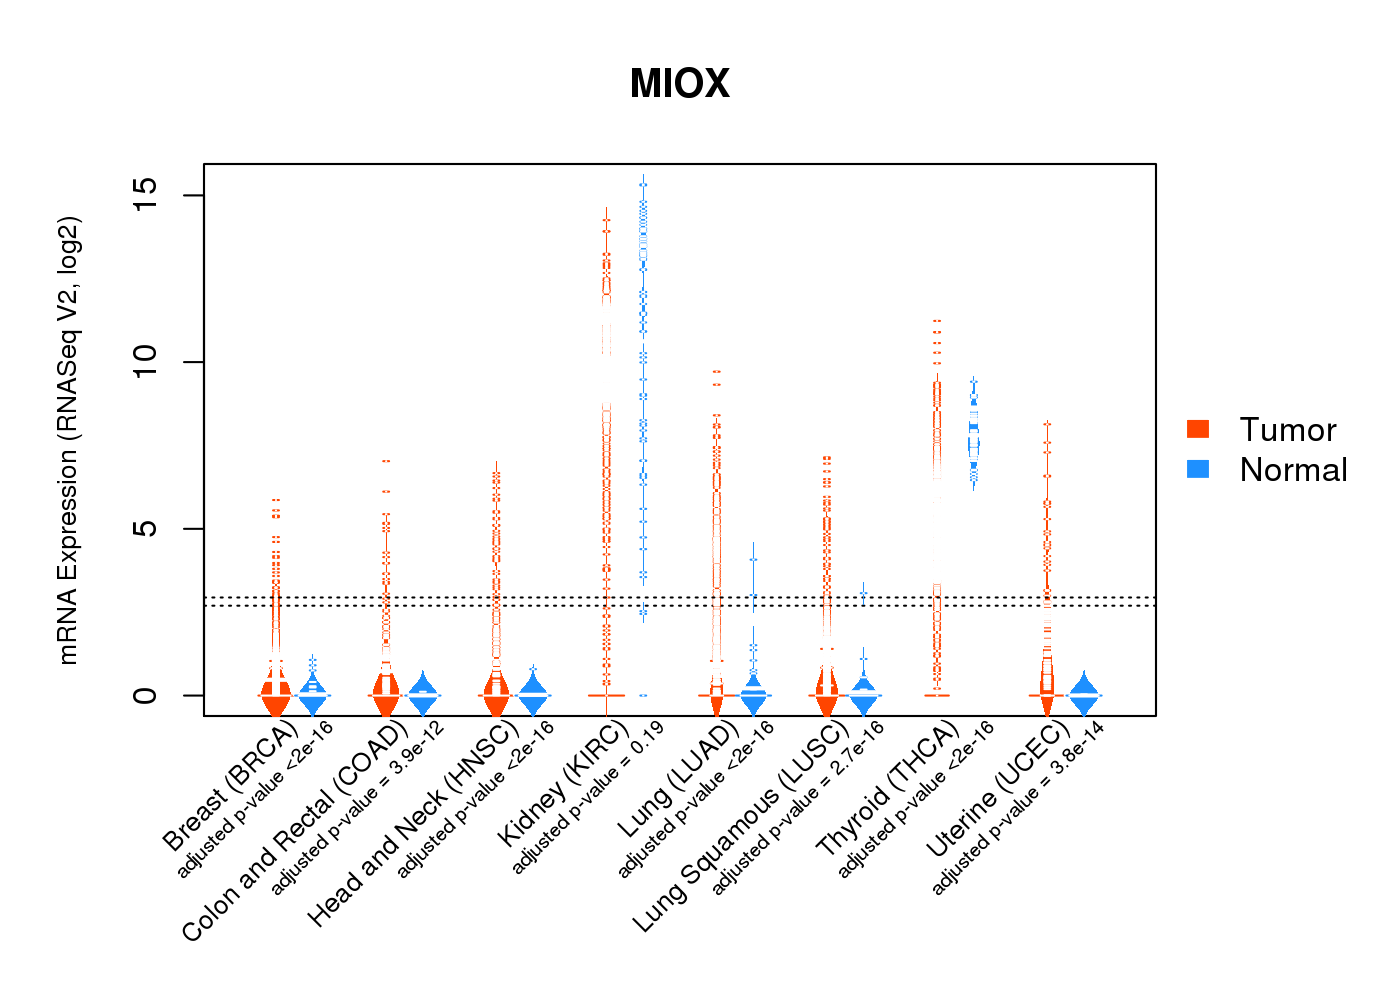
| * Normalized gene expression data of RNASeqV2 was extracted from TCGA using R package TCGA-Assembler. The URLs of all public data files on TCGA DCC data server were gathered at Jan-05-2015. Only eight cancer types have enough normal control samples for differential expression analysis. (t test, adjusted p<0.05 (using Benjamini-Hochberg FDR)) |
 |
| Top |
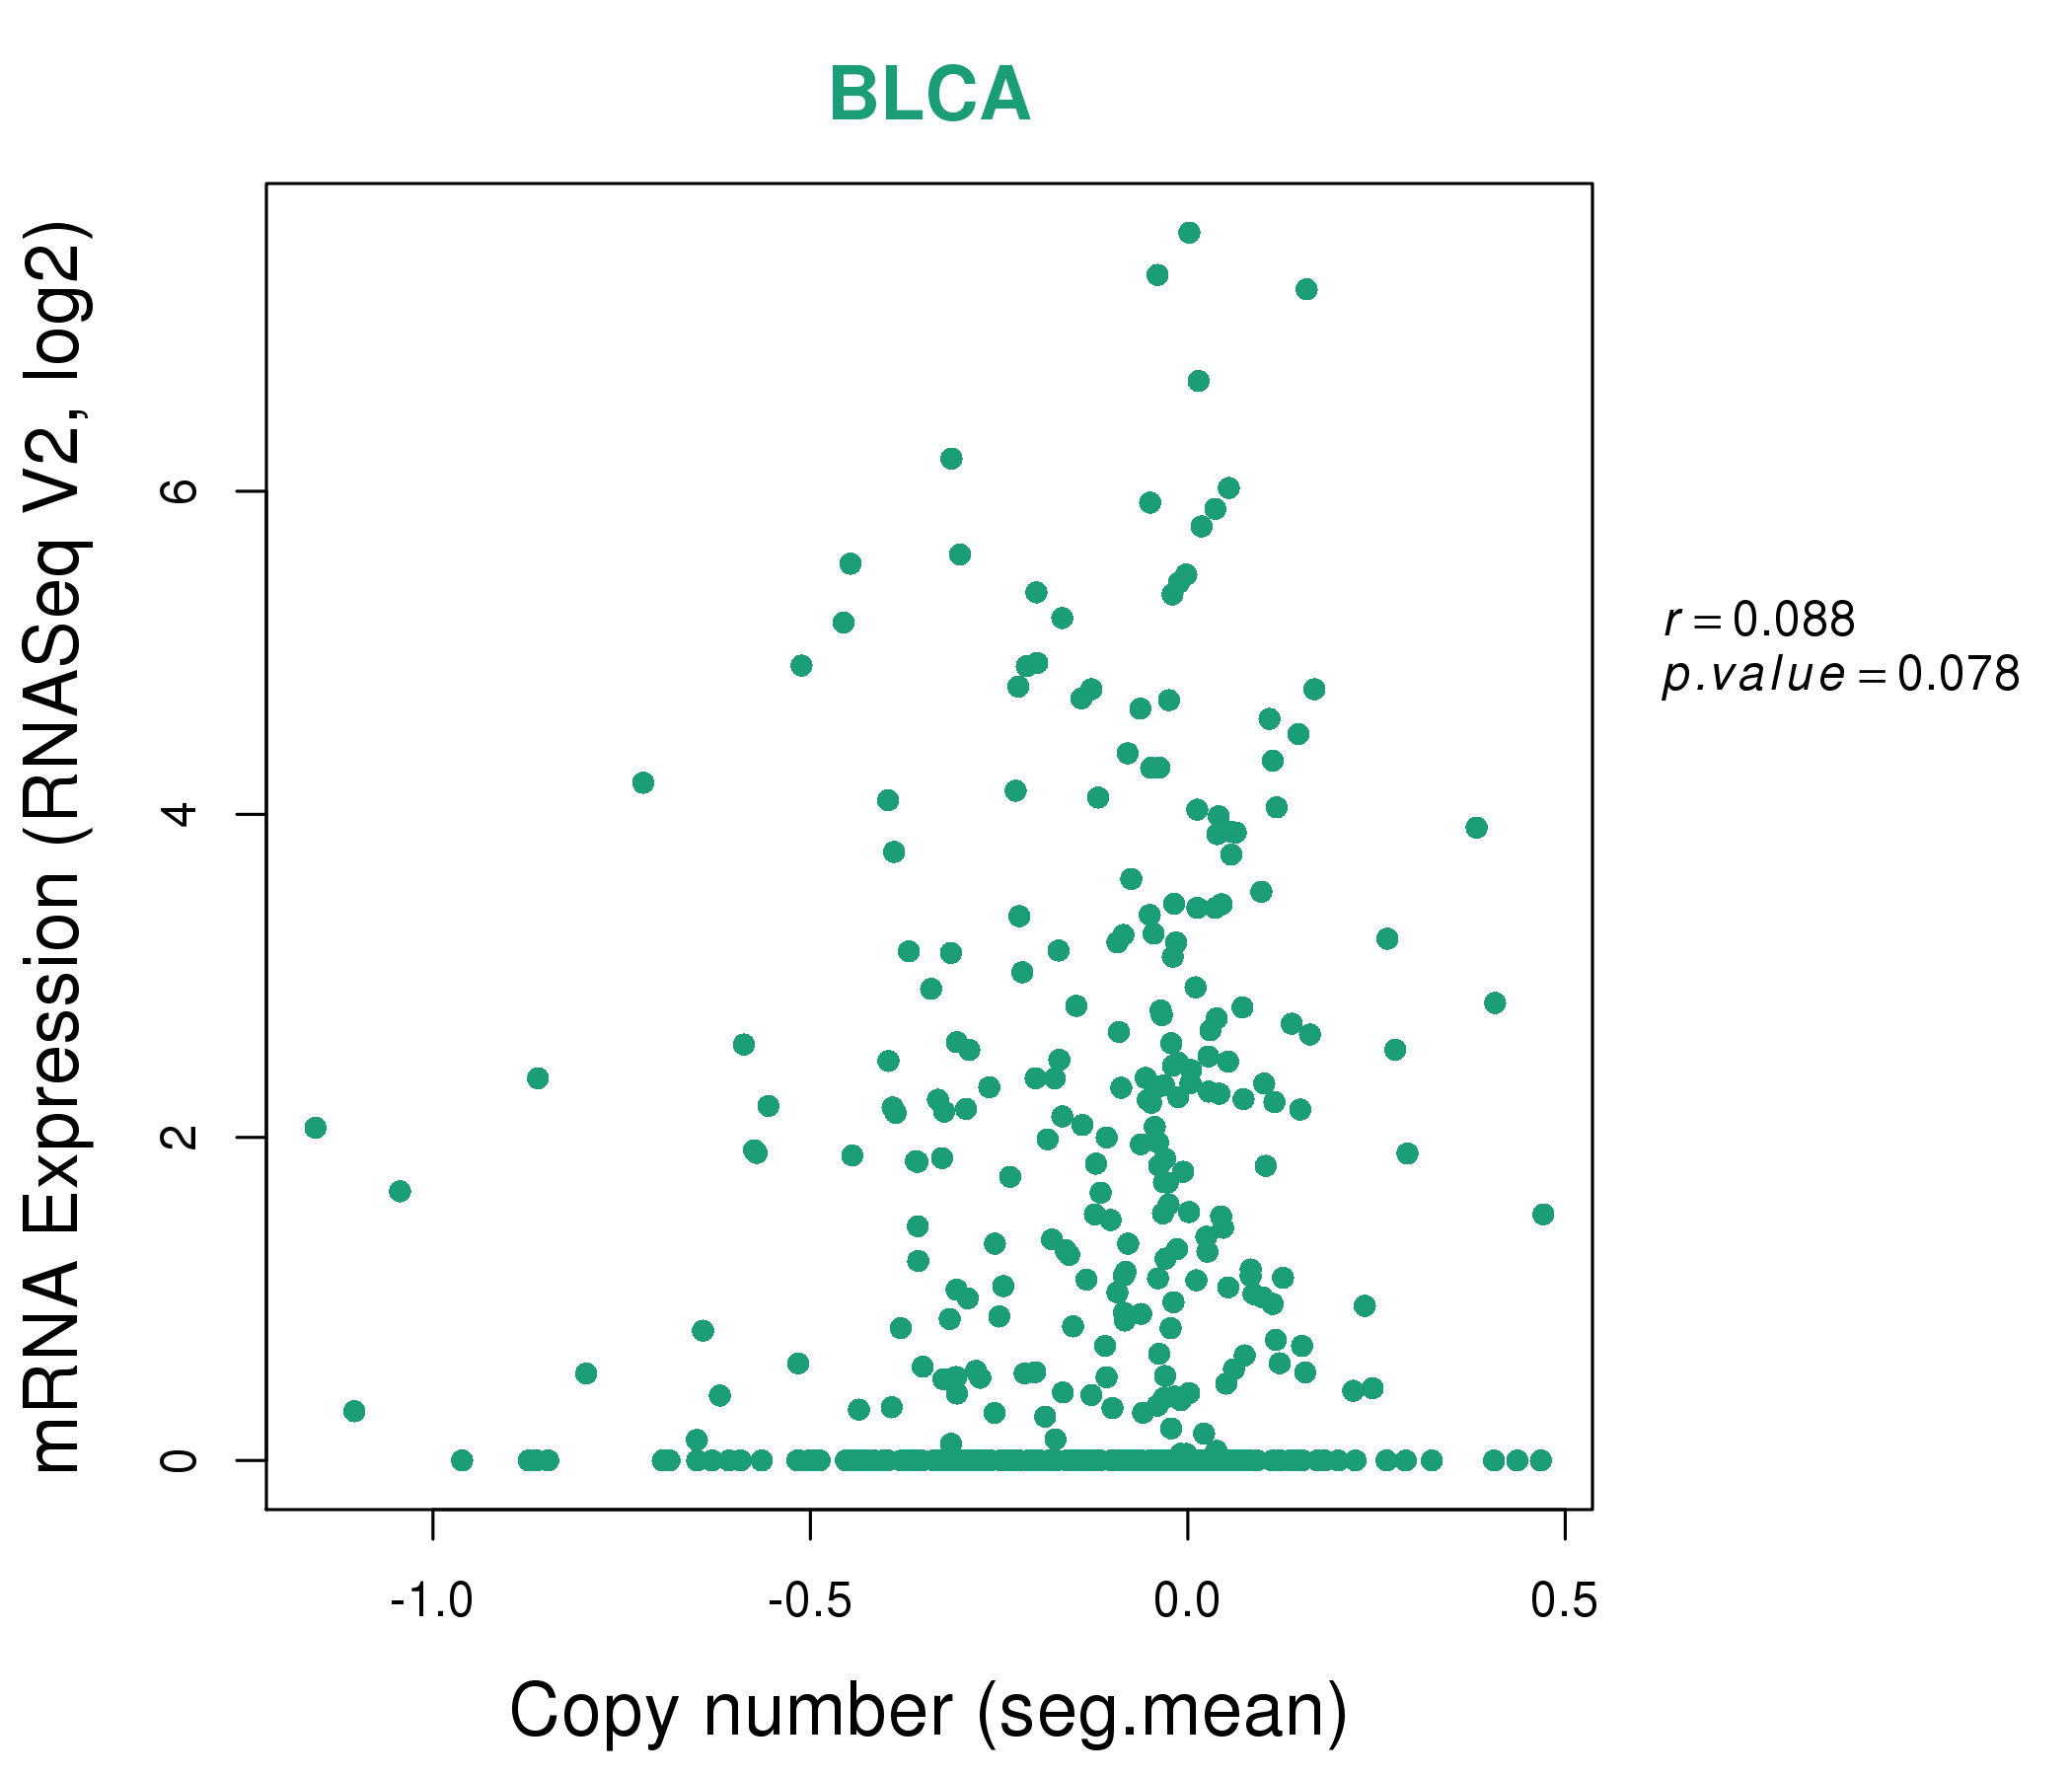
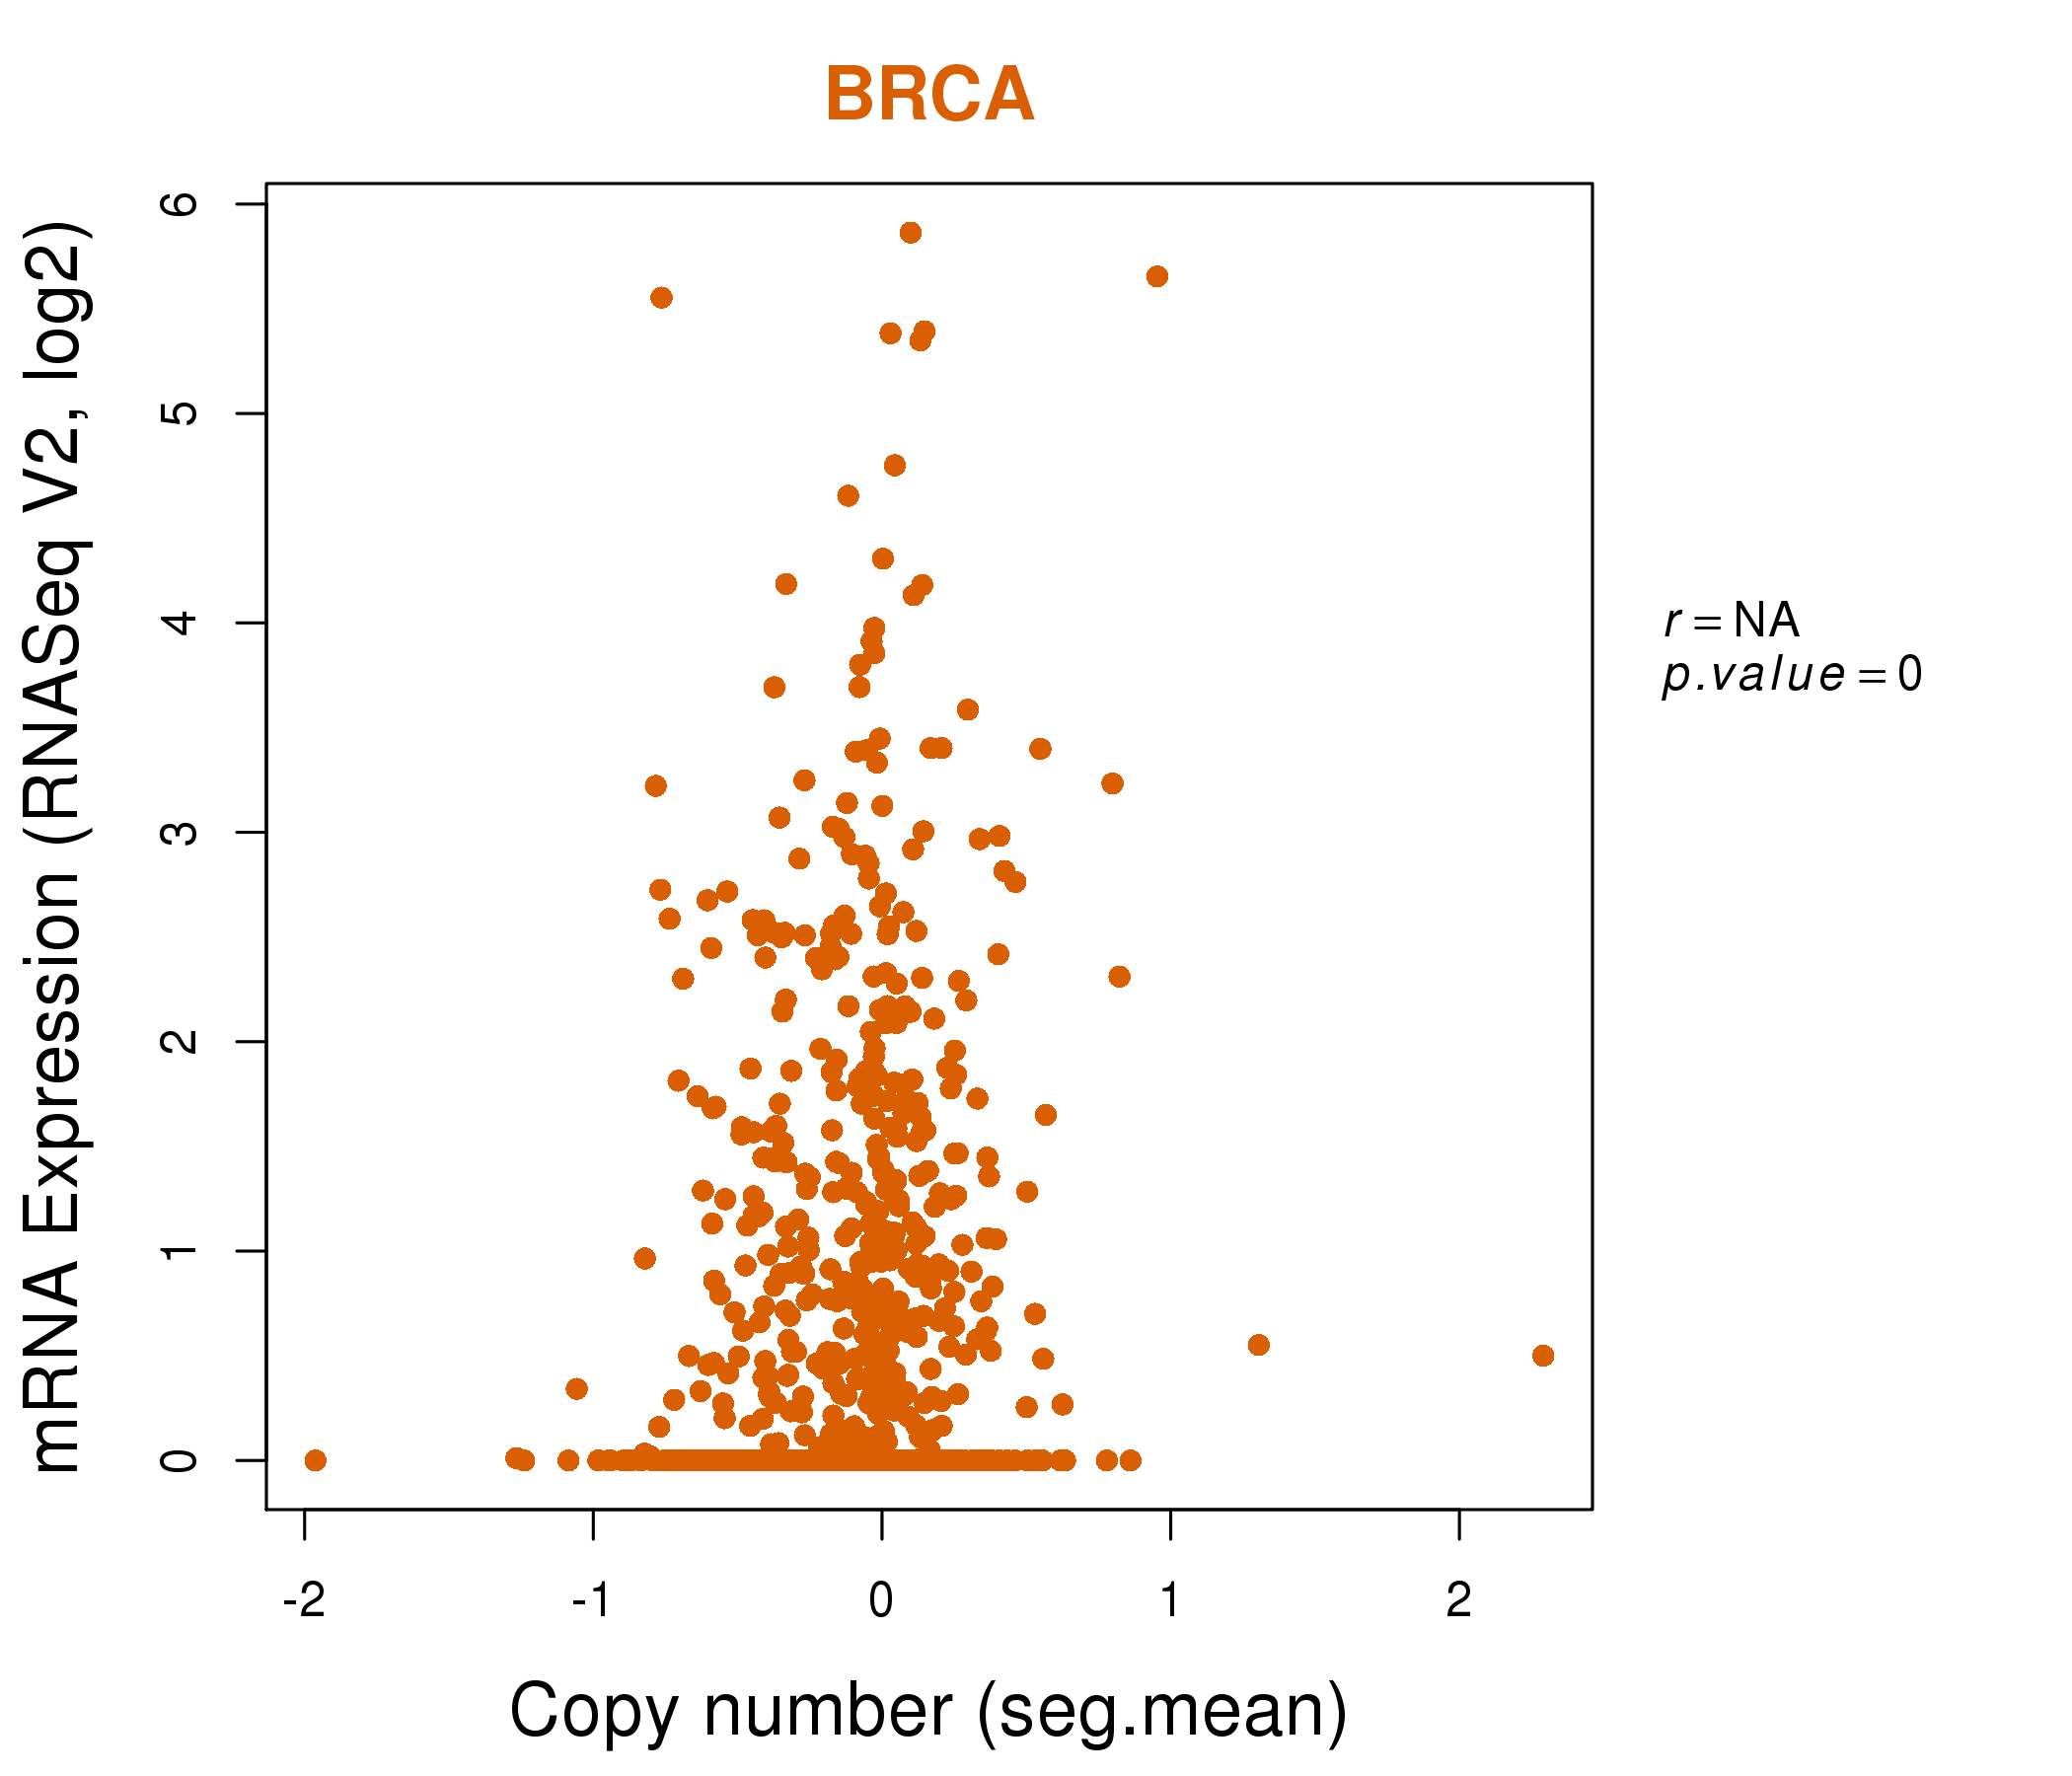
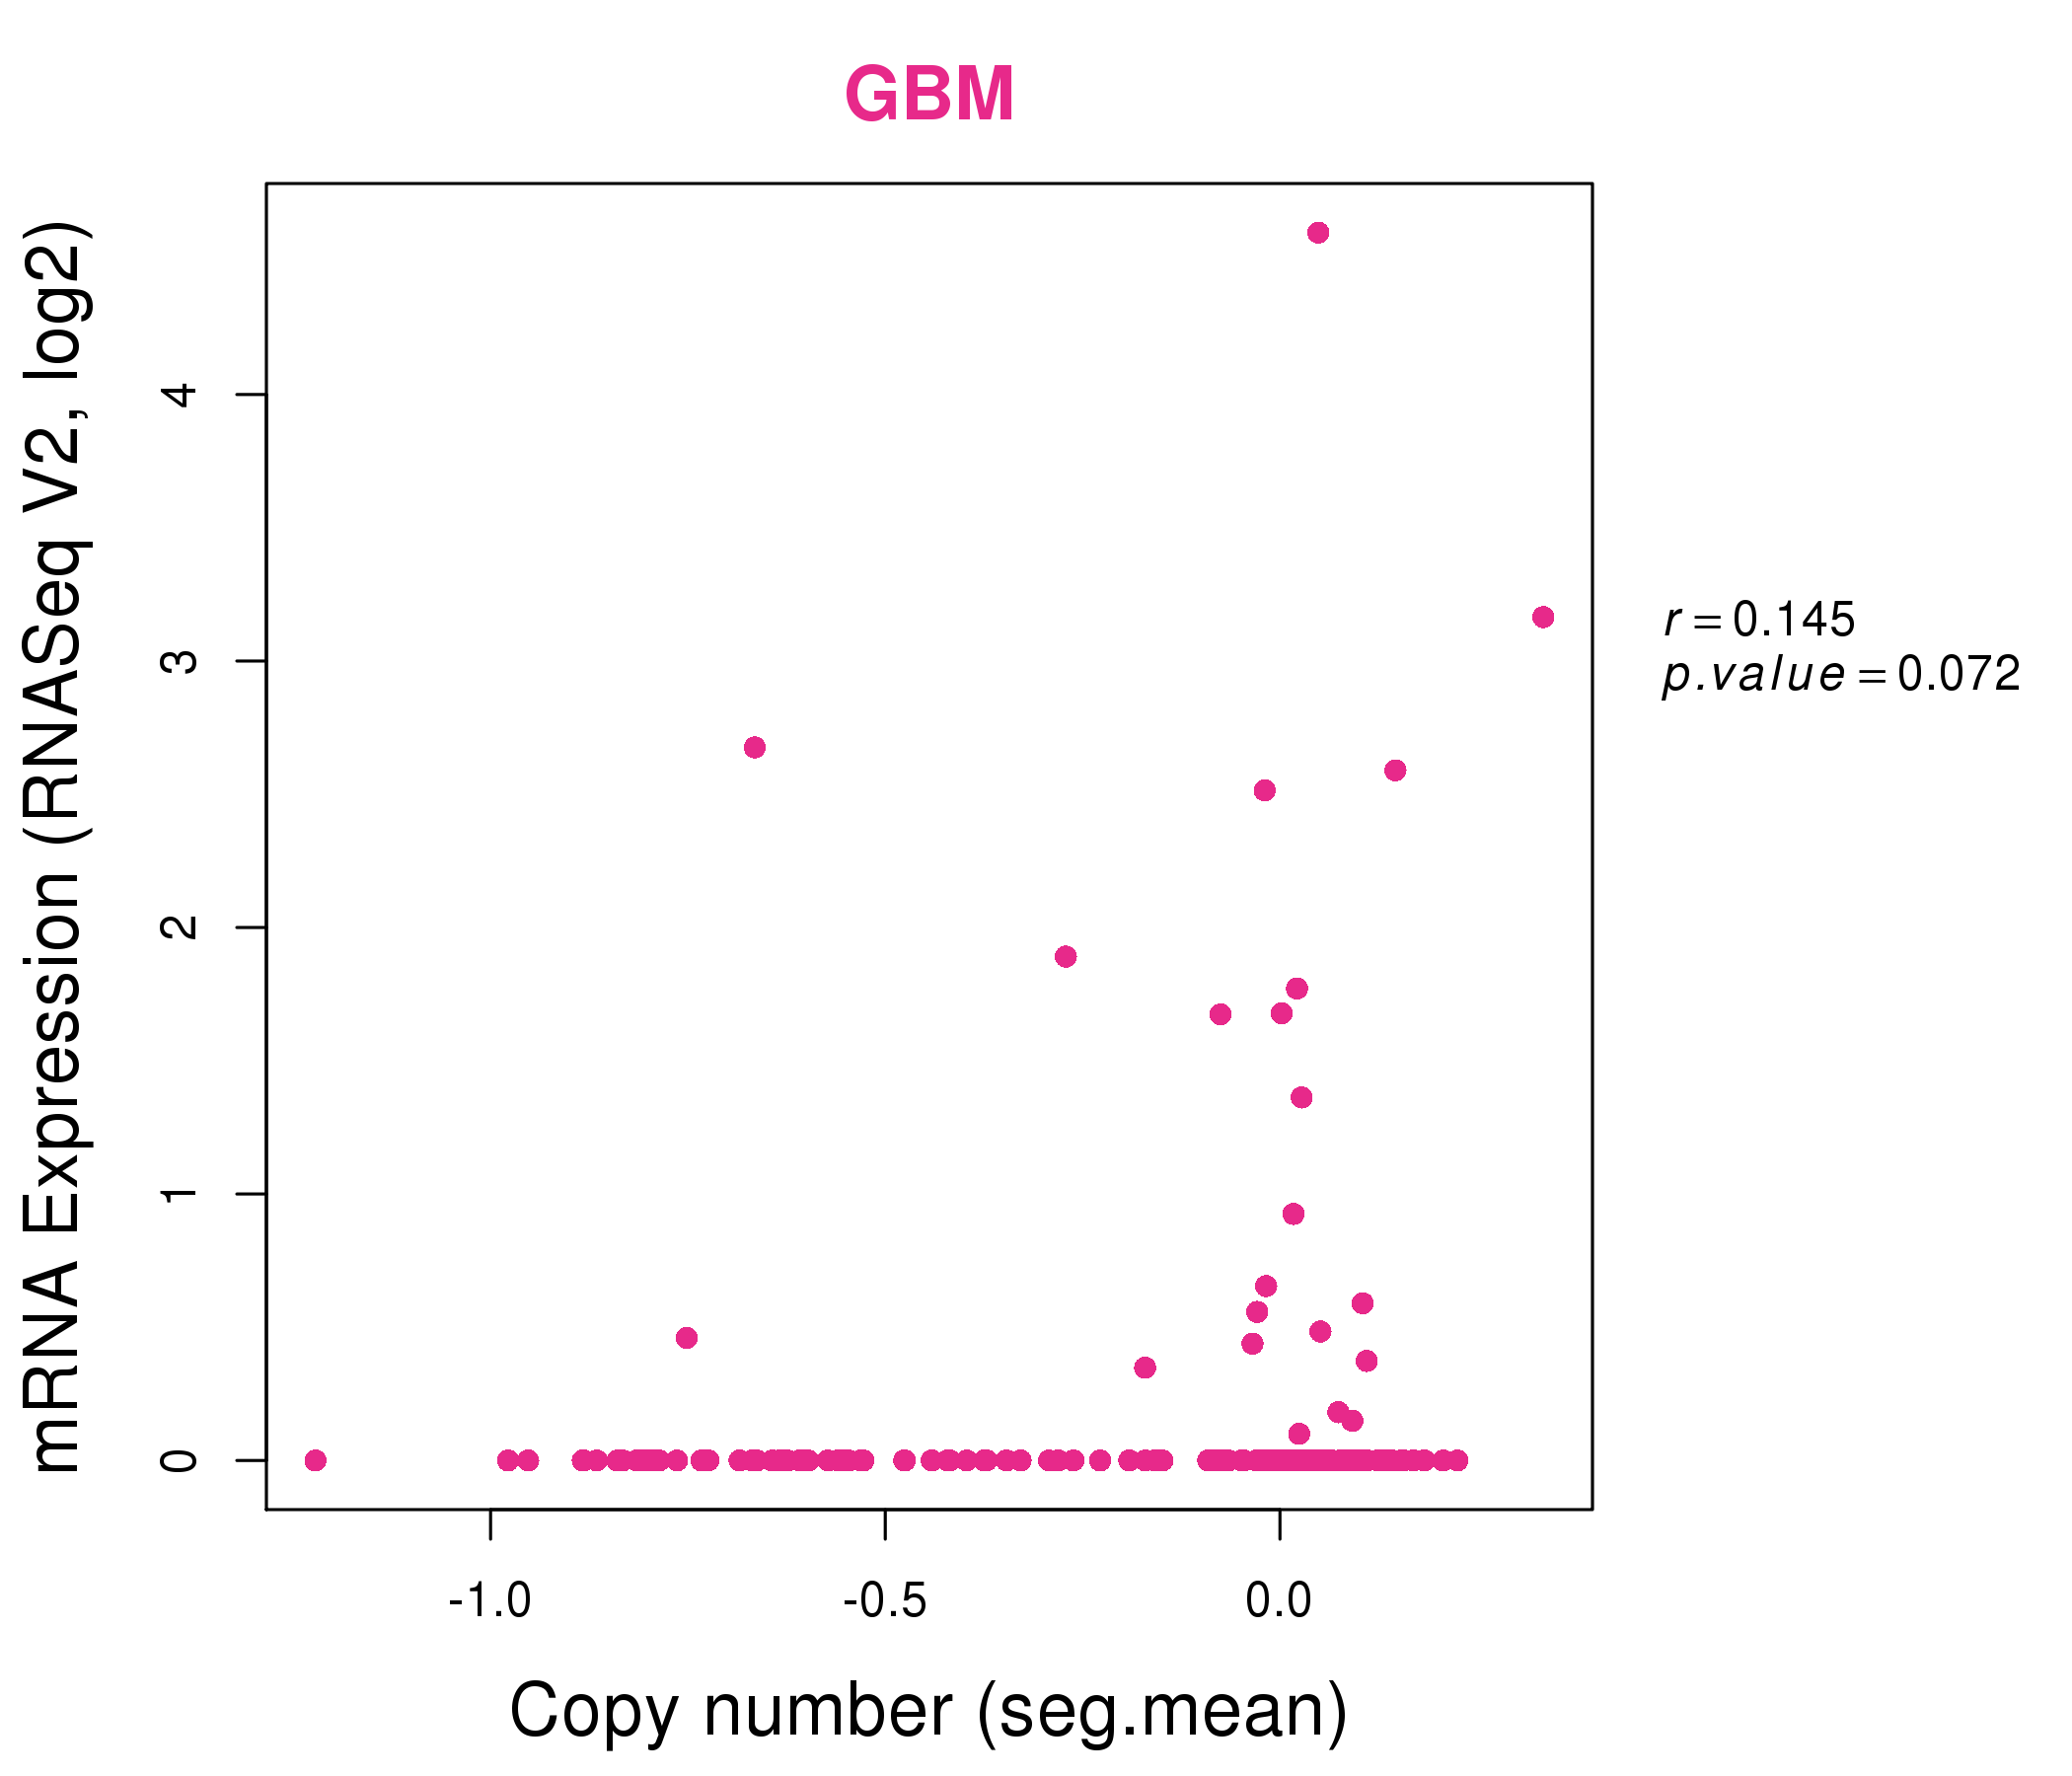
| * This plots show the correlation between CNV and gene expression. |
: Open all plots for all cancer types
 |
|
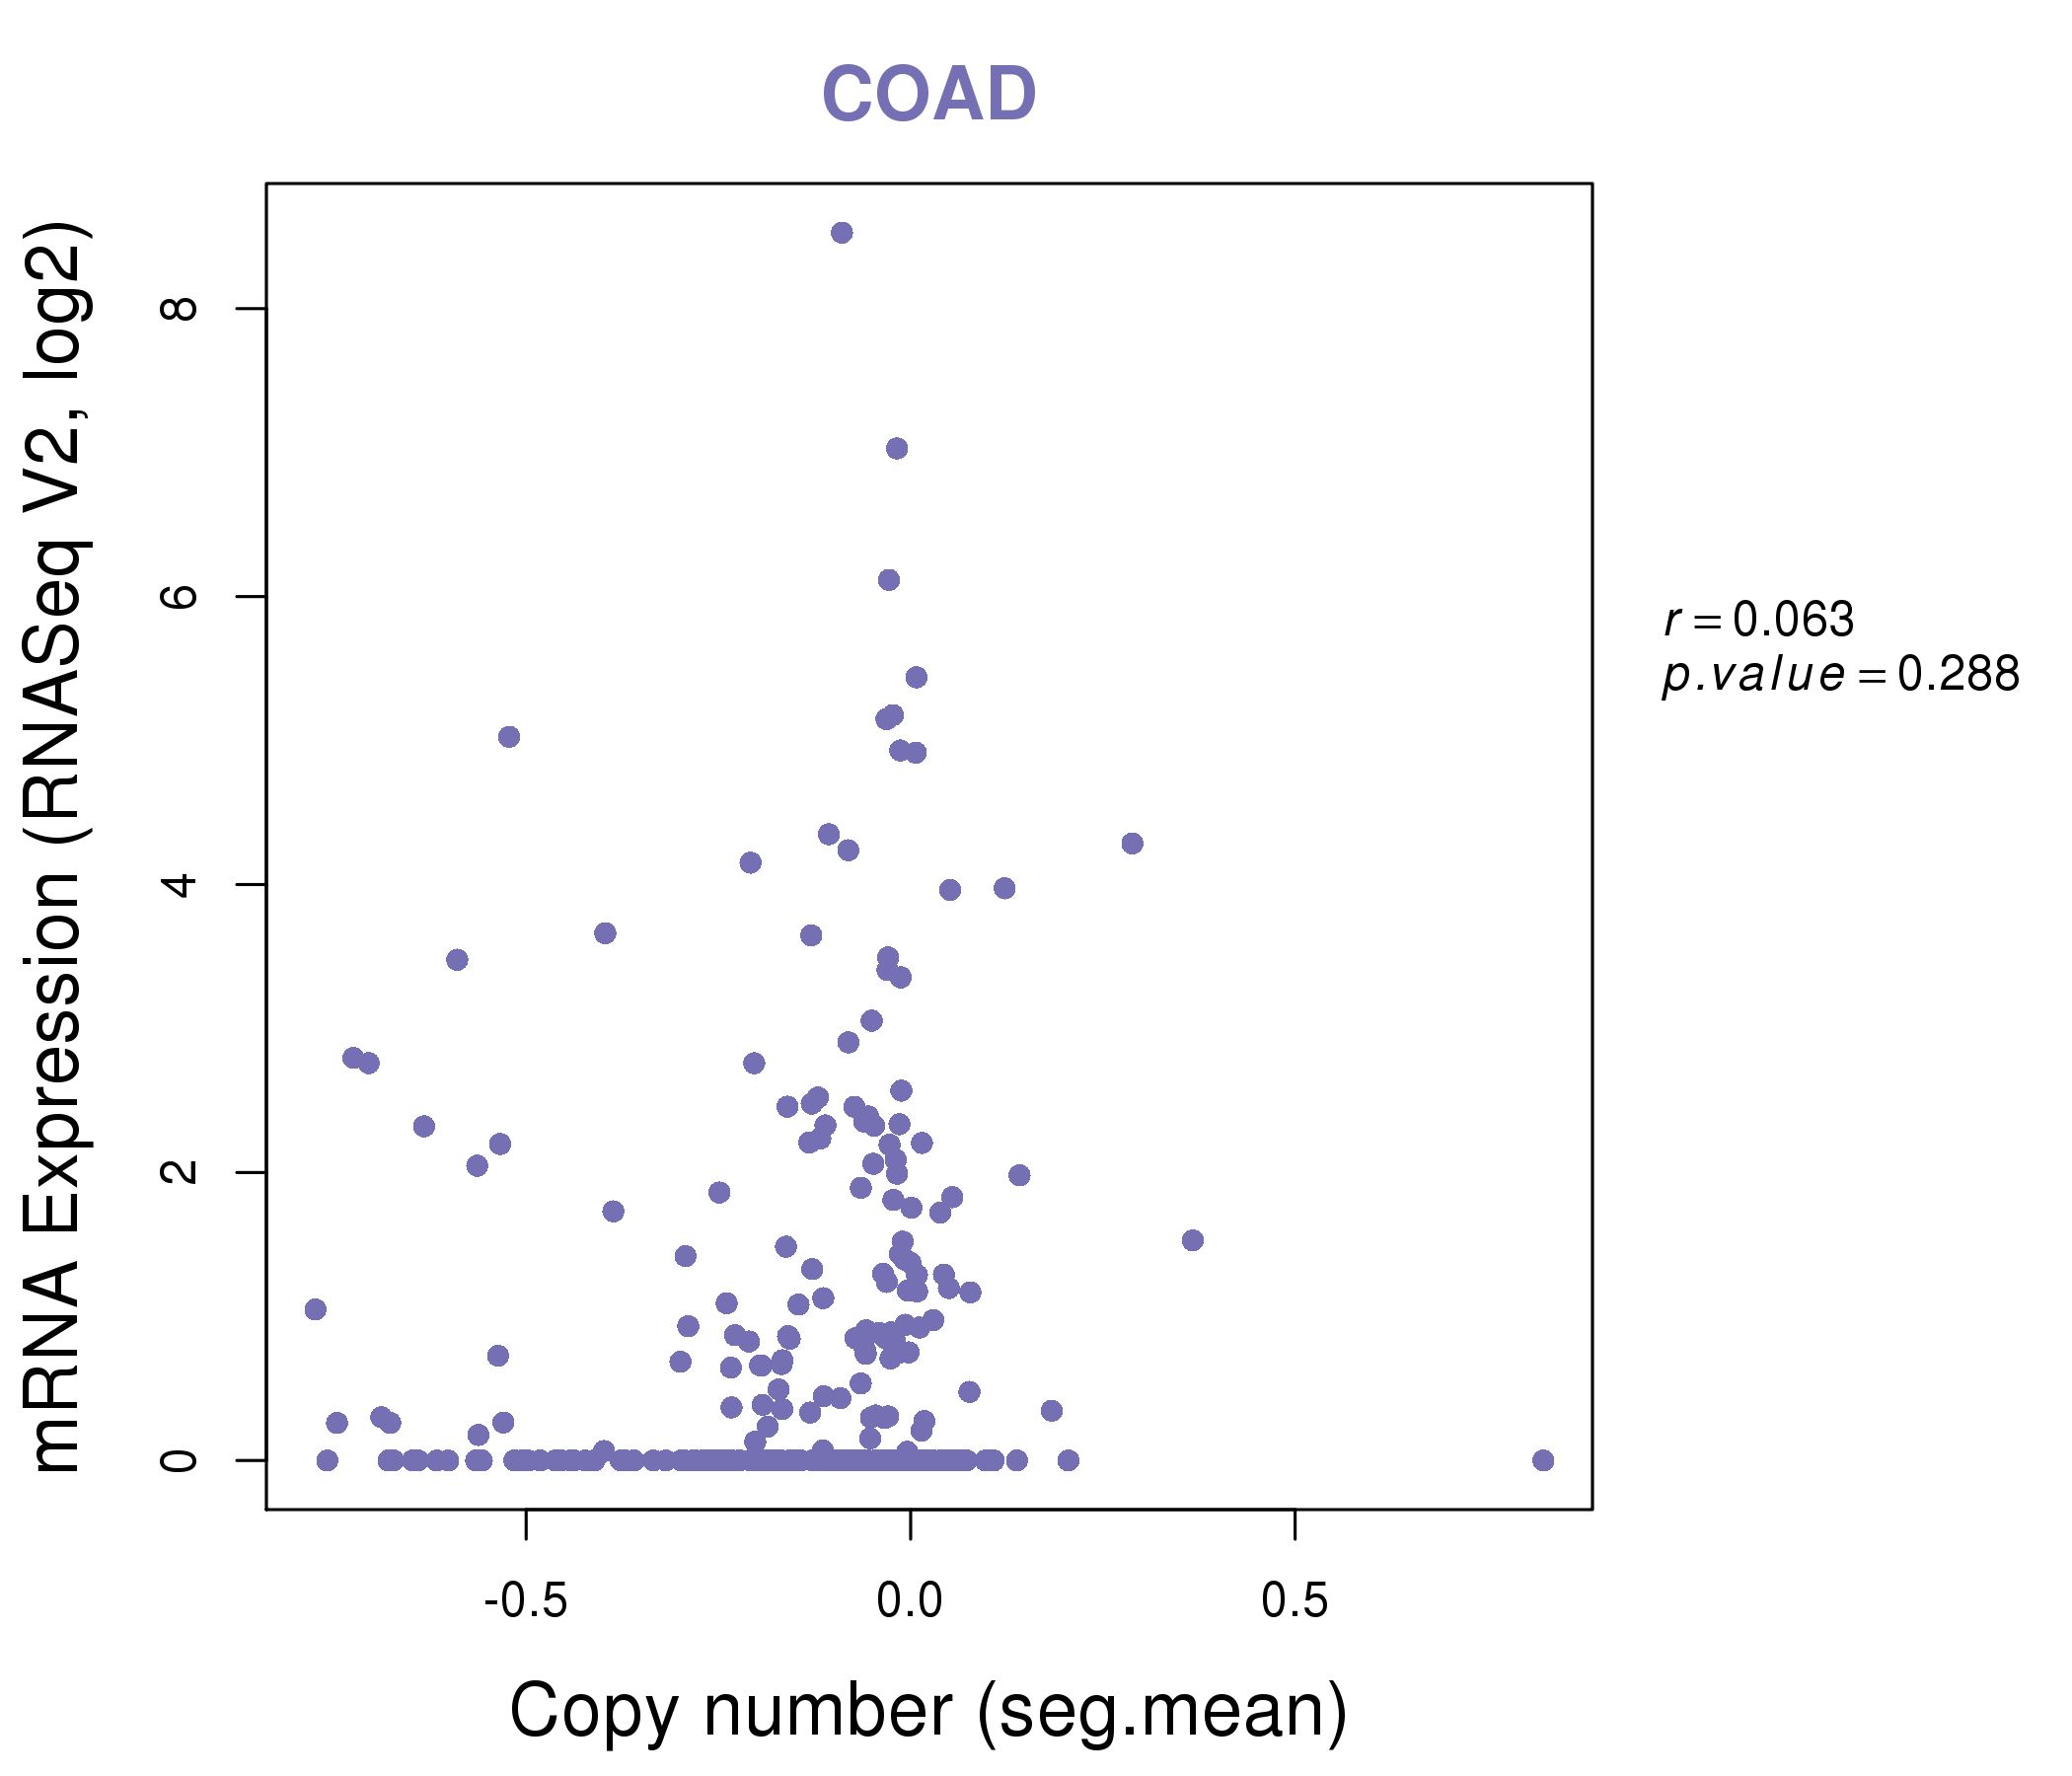 |
|
| Top |
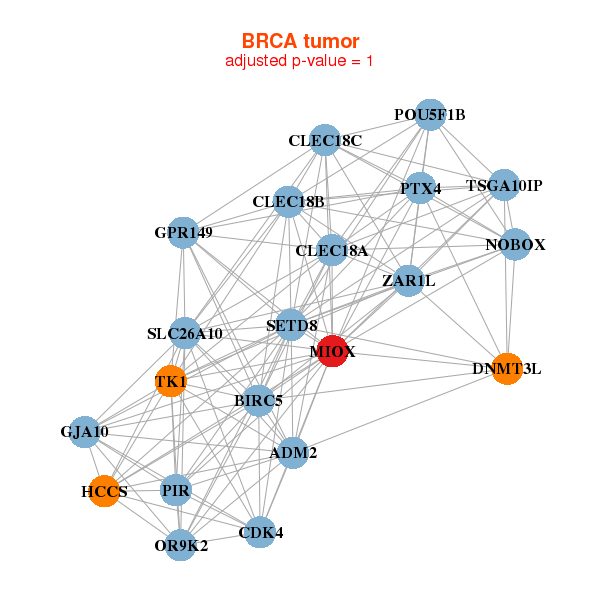
| Gene-Gene Network Information |
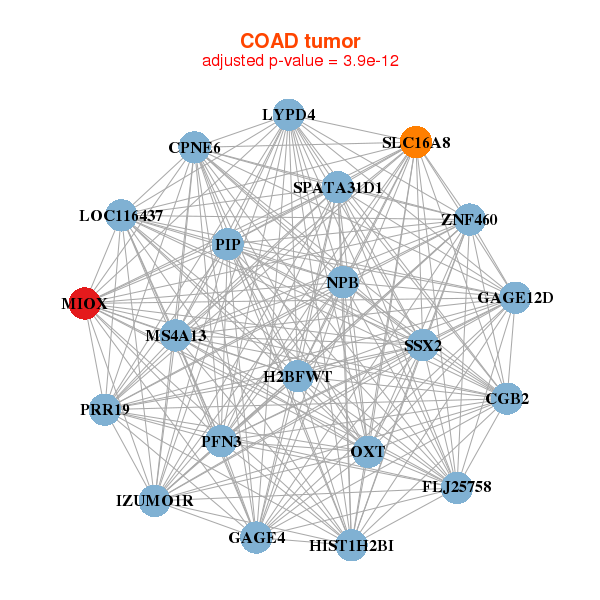
| * Co-Expression network figures were drawn using R package igraph. Only the top 20 genes with the highest correlations were shown. Red circle: input gene, orange circle: cell metabolism gene, sky circle: other gene |
: Open all plots for all cancer types
 |
|
| ADM2,BIRC5,CDK4,CLEC18A,CLEC18B,CLEC18C,DNMT3L, GJA10,GPR149,HCCS,MIOX,NOBOX,OR9K2,PIR, POU5F1B,PTX4,SETD8,SLC26A10,TK1,TSGA10IP,ZAR1L | ACTA2,AIM1L,CNN1,CSRP1,FAM83C,FOXC2,FOXI3, ARHGEF25,GRK1,KCNMB1,MIOX,MYH11,NCS1,NT5C1B, PRDM13,PSG6,SIX3,SNORA16A,SNORA25,TAGLN,USP11 |
 |
|
| CGB2,CPNE6,FLJ25758,SPATA31D1,IZUMO1R,GAGE12D,GAGE4, H2BFWT,HIST1H2BI,LOC116437,LYPD4,MIOX,MS4A13,NPB, OXT,PFN3,PIP,PRR19,SLC16A8,SSX2,ZNF460 | AMPD3,C20orf197,UMODL1-AS1,MLLT4-AS1,CACNA1F,EMR4P,FSCN2, LOC100128842,LOC284749,MGC16384,MGC16703,MIOX,RGPD5,SCN10A, SLC38A11,SNORA71E,TBC1D3,TMEM212,ZN |
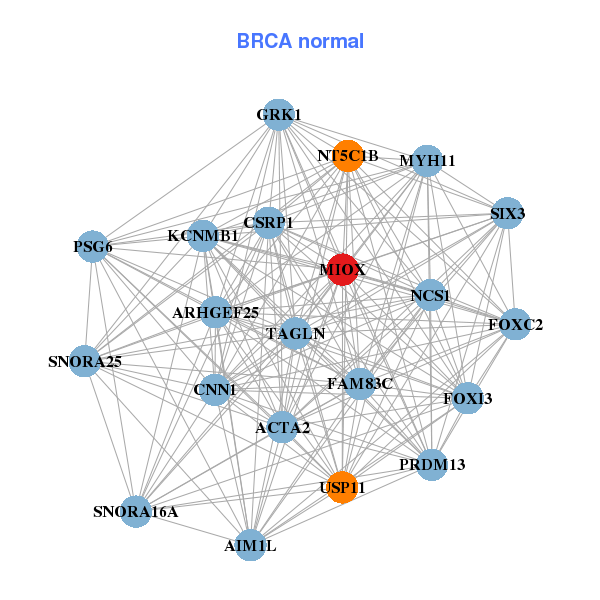

| * Co-Expression network figures were drawn using R package igraph. Only the top 20 genes with the highest correlations were shown. Red circle: input gene, orange circle: cell metabolism gene, sky circle: other gene |
: Open all plots for all cancer types
| Top |
: Open all interacting genes' information including KEGG pathway for all interacting genes from DAVID
| Top |
| Pharmacological Information for MIOX |
| There's no related Drug. |
| Top |
| Cross referenced IDs for MIOX |
| * We obtained these cross-references from Uniprot database. It covers 150 different DBs, 18 categories. http://www.uniprot.org/help/cross_references_section |
: Open all cross reference information
|
Copyright © 2016-Present - The Univsersity of Texas Health Science Center at Houston @ |