|
|||||||||||||||||||||||||||||||||||||||||||||||||||||||||||||||||||||||||||||||||||||||||||||||||||||||||||||||||||||||||||||||||||||||||||||||||||||||||||||||||||||||||||||||||||||||||||||||||||||||||||||||||||||||||||||||||||||||||||||||||||||||||||||||||||||||||||||||||||||||||||||||||||||||||||||||||||||||||||||||||||||||||||||
| |
| Phenotypic Information (metabolism pathway, cancer, disease, phenome) |
| |
| |
| Gene-Gene Network Information: Co-Expression Network, Interacting Genes & KEGG |
| |
|


| Gene Summary for SMPD4 |
| Top |
| Phenotypic Information for SMPD4(metabolism pathway, cancer, disease, phenome) |
| Cancer | CGAP: SMPD4 |
| Familial Cancer Database: SMPD4 | |
| * This gene is included in those cancer gene databases. |
|
|
|
|
|
|
| |||||||||||||||||||||||||||||||||||||||||||||||||||||||||||||||||||||||||||||||||||||||||||||||||||||||||||||||||||||||||||||||||||||||||||||||||||||||||||||||||||||||||||||||||||||||||||||||||||||||||||||||||||||||||||||||||||||||||||||||||||||||||||||||||||||||||||||||||||||||||||||||||||||||||||||||||||||||||||||||||||||||
Oncogene 1 | Significant driver gene in | ||||||||||||||||||||||||||||||||||||||||||||||||||||||||||||||||||||||||||||||||||||||||||||||||||||||||||||||||||||||||||||||||||||||||||||||||||||||||||||||||||||||||||||||||||||||||||||||||||||||||||||||||||||||||||||||||||||||||||||||||||||||||||||||||||||||||||||||||||||||||||||||||||||||||||||||||||||||||||||||||||||||||||||
| cf) number; DB name 1 Oncogene; http://nar.oxfordjournals.org/content/35/suppl_1/D721.long, 2 Tumor Suppressor gene; https://bioinfo.uth.edu/TSGene/, 3 Cancer Gene Census; http://www.nature.com/nrc/journal/v4/n3/abs/nrc1299.html, 4 CancerGenes; http://nar.oxfordjournals.org/content/35/suppl_1/D721.long, 5 Network of Cancer Gene; http://ncg.kcl.ac.uk/index.php, 1Therapeutic Vulnerabilities in Cancer; http://cbio.mskcc.org/cancergenomics/statius/ |
| KEGG_SPHINGOLIPID_METABOLISM REACTOME_GLYCOSPHINGOLIPID_METABOLISM REACTOME_PHOSPHOLIPID_METABOLISM REACTOME_SPHINGOLIPID_METABOLISM REACTOME_METABOLISM_OF_LIPIDS_AND_LIPOPROTEINS | |
| OMIM | |
| Orphanet | |
| Disease | KEGG Disease: SMPD4 |
| MedGen: SMPD4 (Human Medical Genetics with Condition) | |
| ClinVar: SMPD4 | |
| Phenotype | MGI: SMPD4 (International Mouse Phenotyping Consortium) |
| PhenomicDB: SMPD4 | |
| Mutations for SMPD4 |
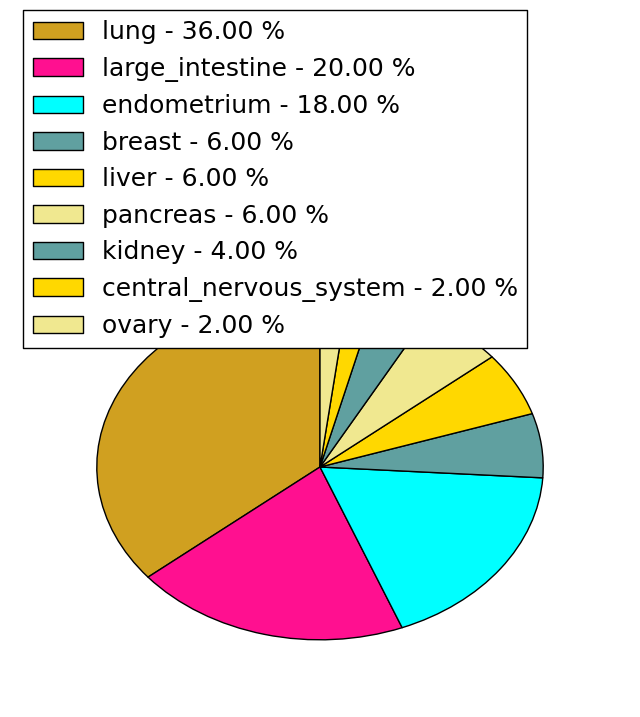
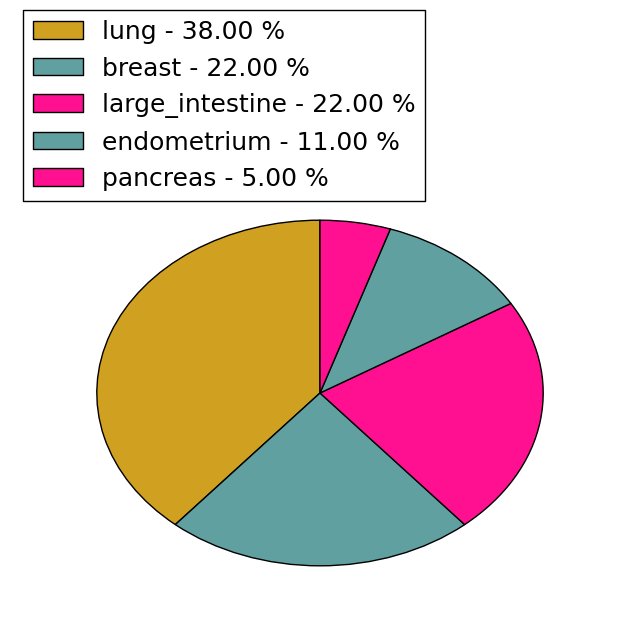
| * Under tables are showing count per each tissue to give us broad intuition about tissue specific mutation patterns.You can go to the detailed page for each mutation database's web site. |
| There's no structural variation information in COSMIC data for this gene. |
| * From mRNA Sanger sequences, Chitars2.0 arranged chimeric transcripts. This table shows SMPD4 related fusion information. |
| ID | Head Gene | Tail Gene | Accession | Gene_a | qStart_a | qEnd_a | Chromosome_a | tStart_a | tEnd_a | Gene_a | qStart_a | qEnd_a | Chromosome_a | tStart_a | tEnd_a |
| AK126162 | SMPD4 | 1 | 1559 | 2 | 130919680 | 130921238 | MTCH1 | 1557 | 2115 | 6 | 36935918 | 36936476 | |
| AA315813 | SMPD4 | 1 | 220 | 2 | 130932487 | 130939151 | MDH1 | 219 | 495 | 2 | 63821620 | 63824707 | |
| AW951984 | SMPD4 | 1 | 219 | 2 | 130932487 | 130939150 | MDH1 | 218 | 333 | 2 | 63821620 | 63824547 | |
| Top |
| Mutation type/ Tissue ID | brca | cns | cerv | endome | haematopo | kidn | Lintest | liver | lung | ns | ovary | pancre | prost | skin | stoma | thyro | urina | |||
| Total # sample | 1 | |||||||||||||||||||
| GAIN (# sample) | ||||||||||||||||||||
| LOSS (# sample) | 1 |
| cf) Tissue ID; Tissue type (1; Breast, 2; Central_nervous_system, 3; Cervix, 4; Endometrium, 5; Haematopoietic_and_lymphoid_tissue, 6; Kidney, 7; Large_intestine, 8; Liver, 9; Lung, 10; NS, 11; Ovary, 12; Pancreas, 13; Prostate, 14; Skin, 15; Stomach, 16; Thyroid, 17; Urinary_tract) |
| Top |
|
 |
| Top |
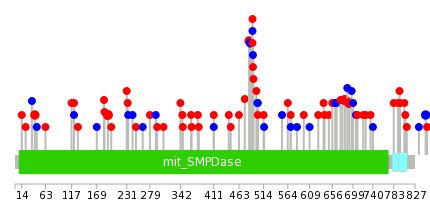
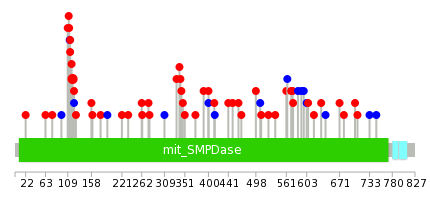
| Stat. for Non-Synonymous SNVs (# total SNVs=50) | (# total SNVs=18) |
 |  |
(# total SNVs=1) | (# total SNVs=0) |
 |
| Top |
| * When you move the cursor on each content, you can see more deailed mutation information on the Tooltip. Those are primary_site,primary_histology,mutation(aa),pubmedID. |
| GRCh37 position | Mutation(aa) | Unique sampleID count |
| chr2:130930247-130930247 | p.P192L | 3 |
| chr2:130910962-130910962 | p.G691E | 3 |
| chr2:130910990-130910990 | p.A682P | 3 |
| chr2:130934161-130934161 | p.A41V | 2 |
| chr2:130914230-130914230 | p.F411L | 2 |
| chr2:130912778-130912778 | p.F487F | 2 |
| chr2:130912789-130912789 | p.F484V | 2 |
| chr2:130910182-130910182 | p.L849L | 2 |
| chr2:130922009-130922009 | p.E307K | 1 |
| chr2:130910301-130910301 | p.L810M | 1 |
| Top |
|
 |
| Point Mutation/ Tissue ID | 1 | 2 | 3 | 4 | 5 | 6 | 7 | 8 | 9 | 10 | 11 | 12 | 13 | 14 | 15 | 16 | 17 | 18 | 19 | 20 |
| # sample | 3 | 1 | 8 | 3 | 2 | 10 | 8 | 10 | 9 | 1 | 9 | |||||||||
| # mutation | 3 | 1 | 8 | 3 | 2 | 10 | 8 | 10 | 10 | 1 | 10 | |||||||||
| nonsynonymous SNV | 2 | 6 | 3 | 2 | 7 | 8 | 6 | 7 | 1 | 8 | ||||||||||
| synonymous SNV | 1 | 1 | 2 | 3 | 4 | 3 | 2 |
| cf) Tissue ID; Tissue type (1; BLCA[Bladder Urothelial Carcinoma], 2; BRCA[Breast invasive carcinoma], 3; CESC[Cervical squamous cell carcinoma and endocervical adenocarcinoma], 4; COAD[Colon adenocarcinoma], 5; GBM[Glioblastoma multiforme], 6; Glioma Low Grade, 7; HNSC[Head and Neck squamous cell carcinoma], 8; KICH[Kidney Chromophobe], 9; KIRC[Kidney renal clear cell carcinoma], 10; KIRP[Kidney renal papillary cell carcinoma], 11; LAML[Acute Myeloid Leukemia], 12; LUAD[Lung adenocarcinoma], 13; LUSC[Lung squamous cell carcinoma], 14; OV[Ovarian serous cystadenocarcinoma ], 15; PAAD[Pancreatic adenocarcinoma], 16; PRAD[Prostate adenocarcinoma], 17; SKCM[Skin Cutaneous Melanoma], 18:STAD[Stomach adenocarcinoma], 19:THCA[Thyroid carcinoma], 20:UCEC[Uterine Corpus Endometrial Carcinoma]) |
| Top |
| * We represented just top 10 SNVs. When you move the cursor on each content, you can see more deailed mutation information on the Tooltip. Those are primary_site, primary_histology, mutation(aa), pubmedID. |
| Genomic Position | Mutation(aa) | Unique sampleID count |
| chr2:130930247 | p.P119L,SMPD4 | 3 |
| chr2:130931133 | p.V114M,SMPD4 | 2 |
| chr2:130910385 | p.A278T,SMPD4 | 1 |
| chr2:130914230 | p.G112C,SMPD4 | 1 |
| chr2:130925148 | p.G671C,SMPD4 | 1 |
| chr2:130911008 | p.S509F,SMPD4 | 1 |
| chr2:130931124 | p.A276S,SMPD4 | 1 |
| chr2:130911970 | p.L111F,SMPD4 | 1 |
| chr2:130910412 | p.V642V,SMPD4 | 1 |
| chr2:130914900 | p.S507S,SMPD4 | 1 |
| * Copy number data were extracted from TCGA using R package TCGA-Assembler. The URLs of all public data files on TCGA DCC data server were gathered on Jan-05-2015. Function ProcessCNAData in TCGA-Assembler package was used to obtain gene-level copy number value which is calculated as the average copy number of the genomic region of a gene. |
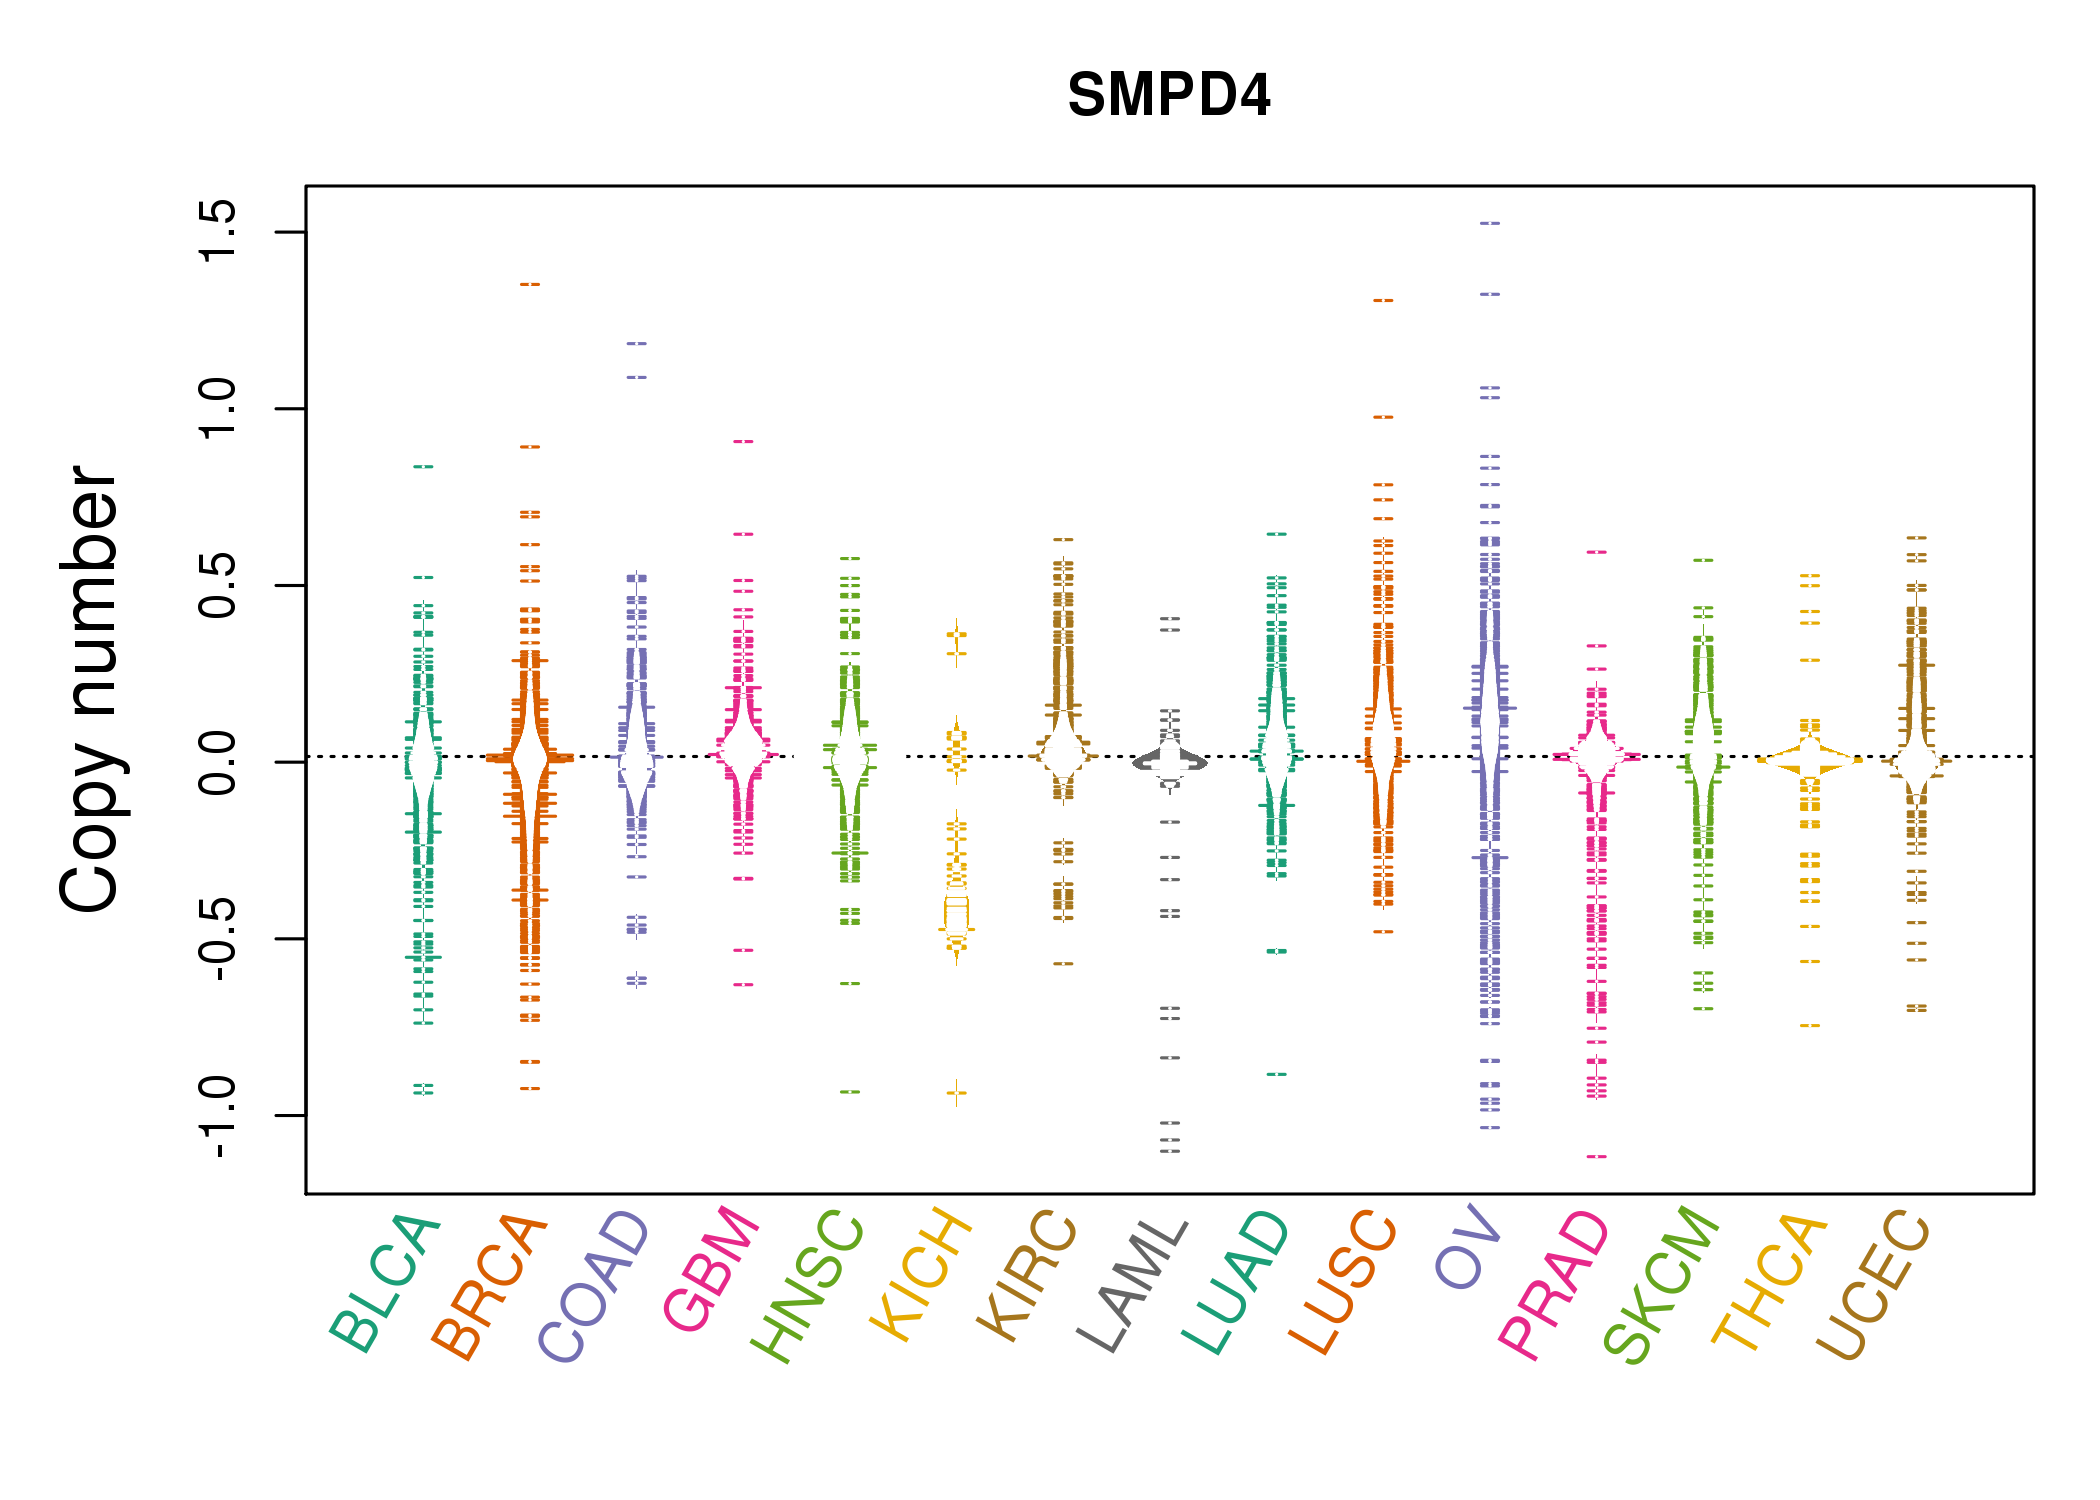 |
| cf) Tissue ID[Tissue type]: BLCA[Bladder Urothelial Carcinoma], BRCA[Breast invasive carcinoma], CESC[Cervical squamous cell carcinoma and endocervical adenocarcinoma], COAD[Colon adenocarcinoma], GBM[Glioblastoma multiforme], Glioma Low Grade, HNSC[Head and Neck squamous cell carcinoma], KICH[Kidney Chromophobe], KIRC[Kidney renal clear cell carcinoma], KIRP[Kidney renal papillary cell carcinoma], LAML[Acute Myeloid Leukemia], LUAD[Lung adenocarcinoma], LUSC[Lung squamous cell carcinoma], OV[Ovarian serous cystadenocarcinoma ], PAAD[Pancreatic adenocarcinoma], PRAD[Prostate adenocarcinoma], SKCM[Skin Cutaneous Melanoma], STAD[Stomach adenocarcinoma], THCA[Thyroid carcinoma], UCEC[Uterine Corpus Endometrial Carcinoma] |
| Top |
| Gene Expression for SMPD4 |
| * CCLE gene expression data were extracted from CCLE_Expression_Entrez_2012-10-18.res: Gene-centric RMA-normalized mRNA expression data. |
 |
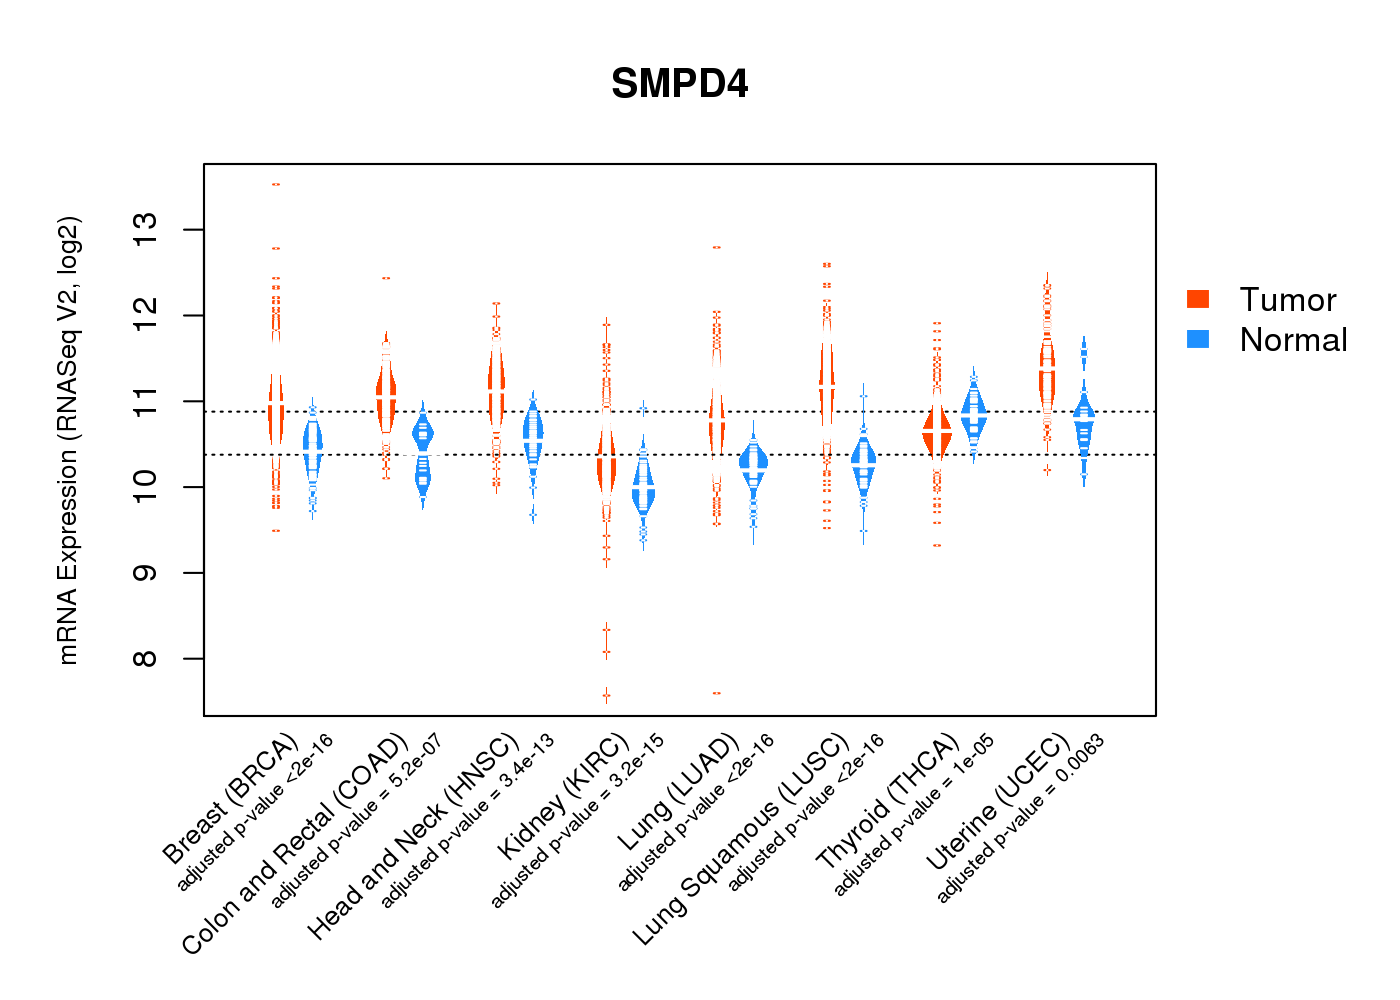
| * Normalized gene expression data of RNASeqV2 was extracted from TCGA using R package TCGA-Assembler. The URLs of all public data files on TCGA DCC data server were gathered at Jan-05-2015. Only eight cancer types have enough normal control samples for differential expression analysis. (t test, adjusted p<0.05 (using Benjamini-Hochberg FDR)) |
 |
| Top |
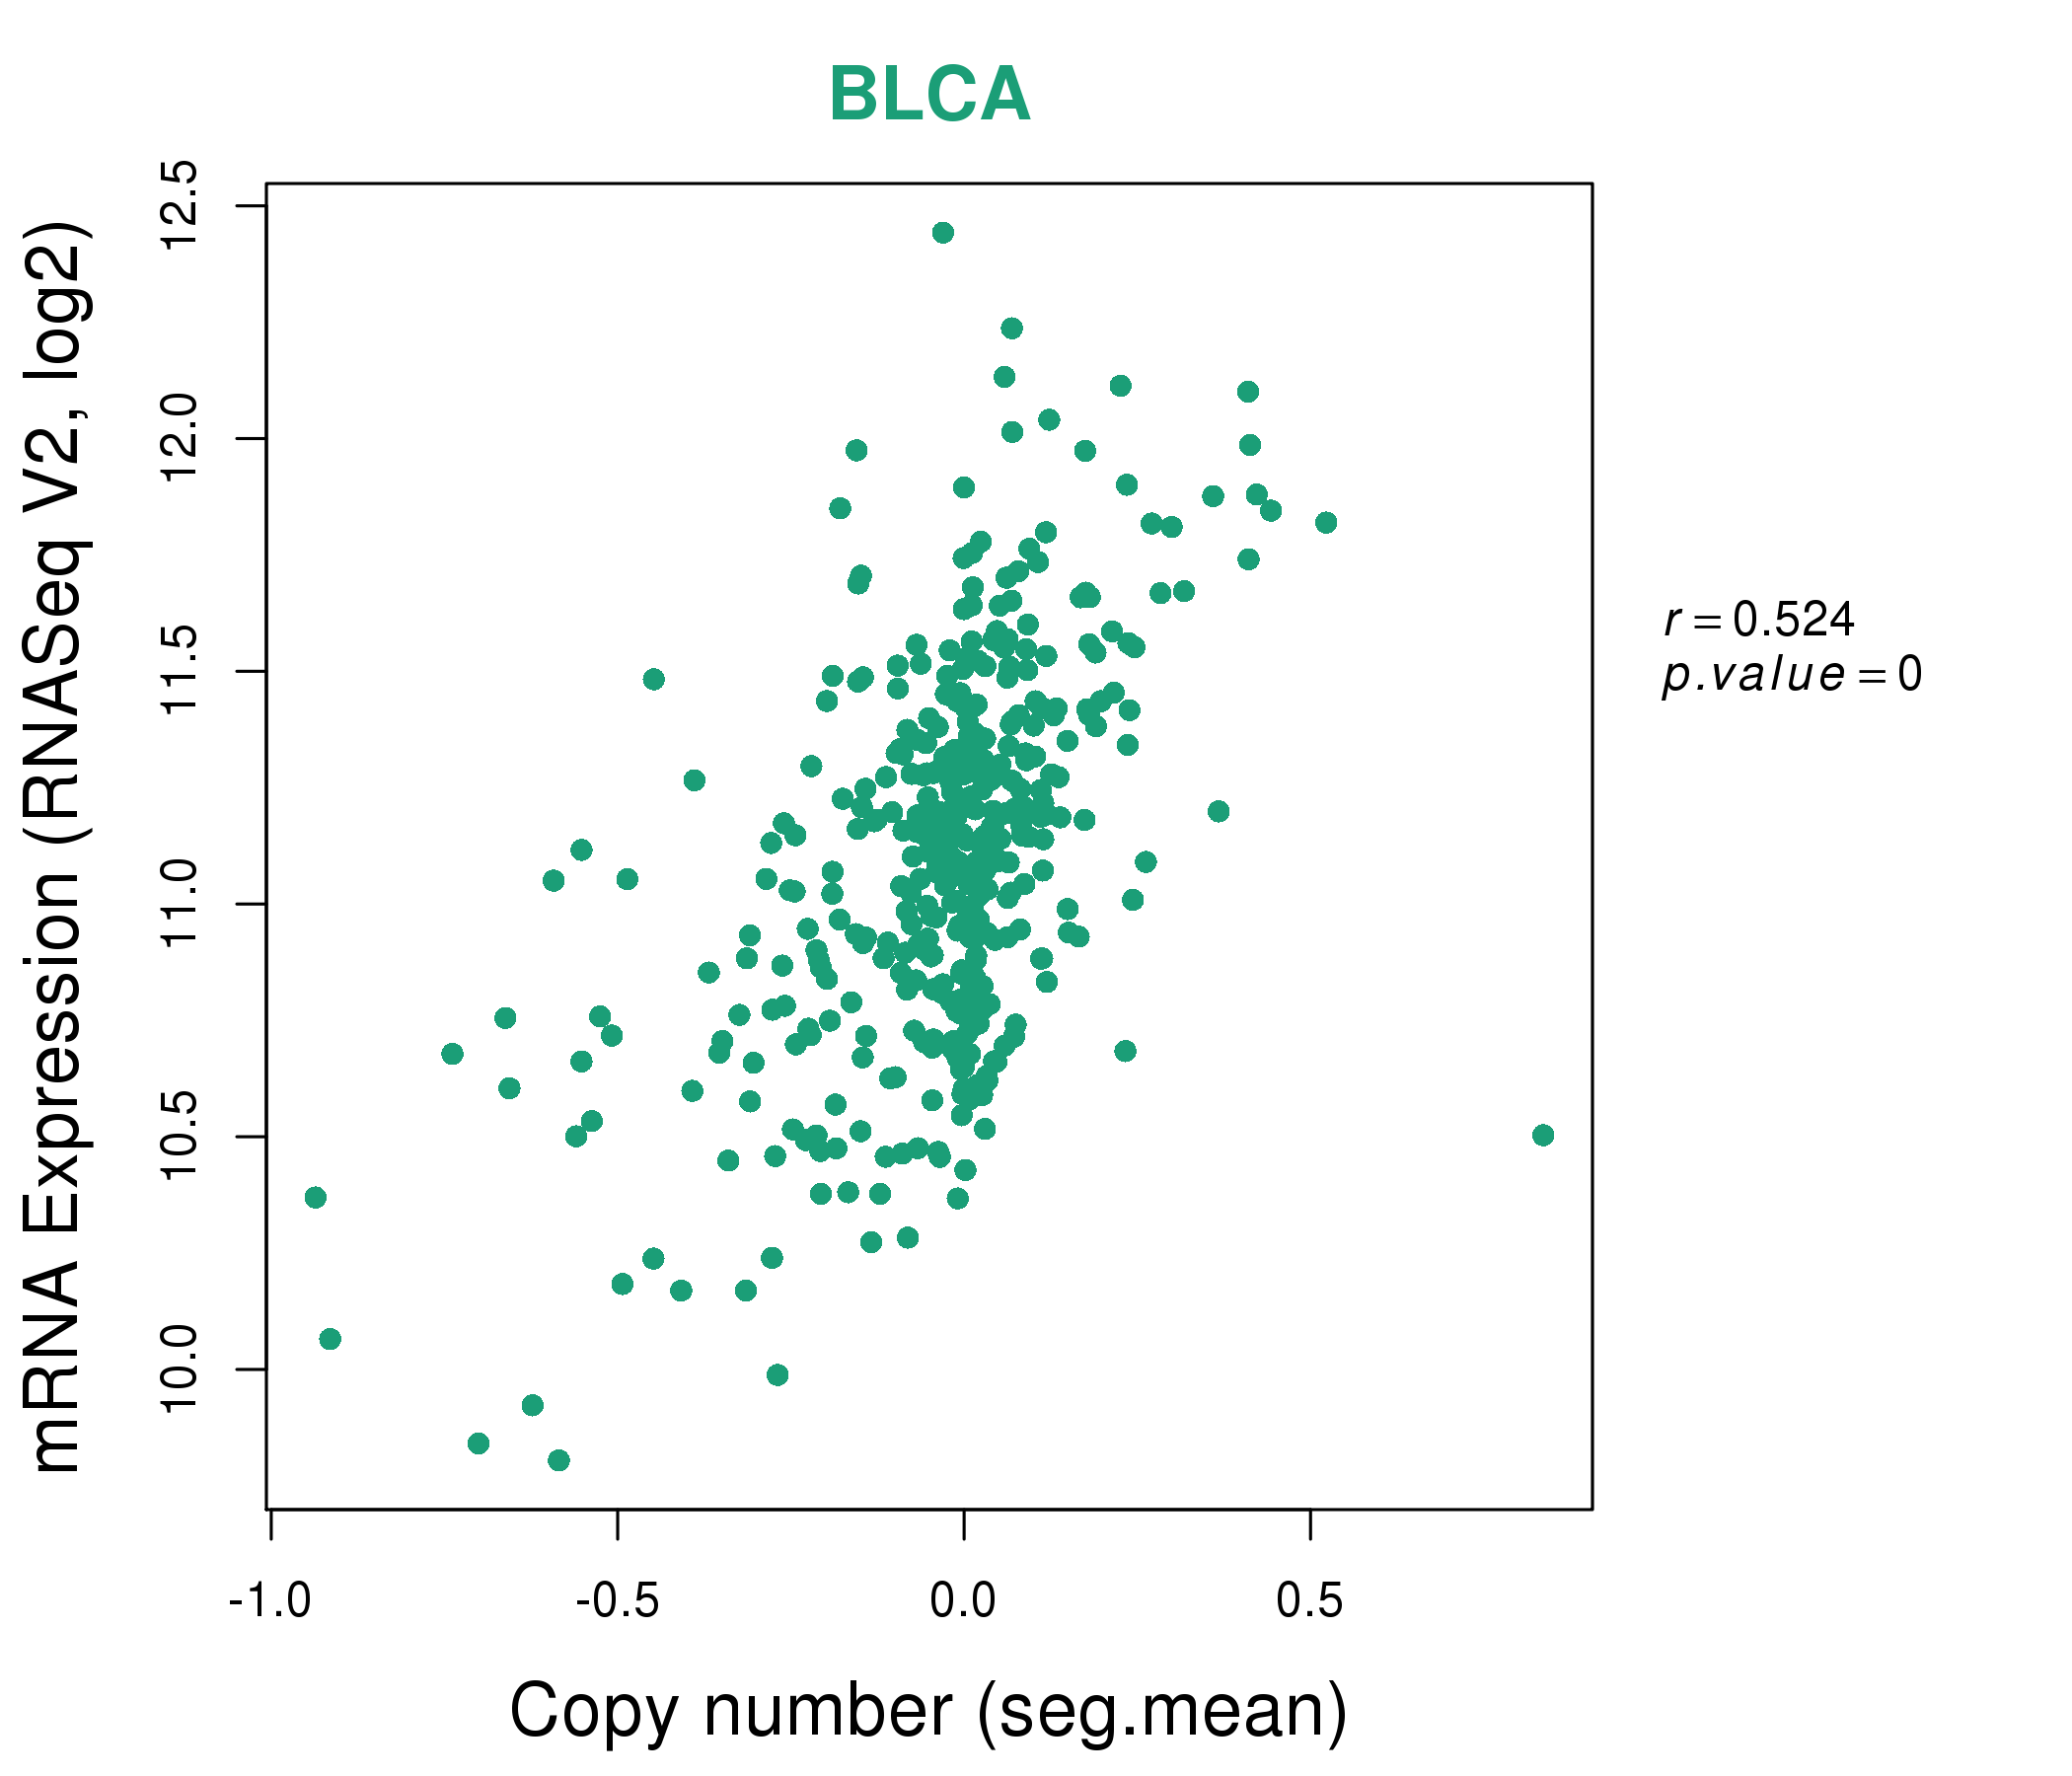
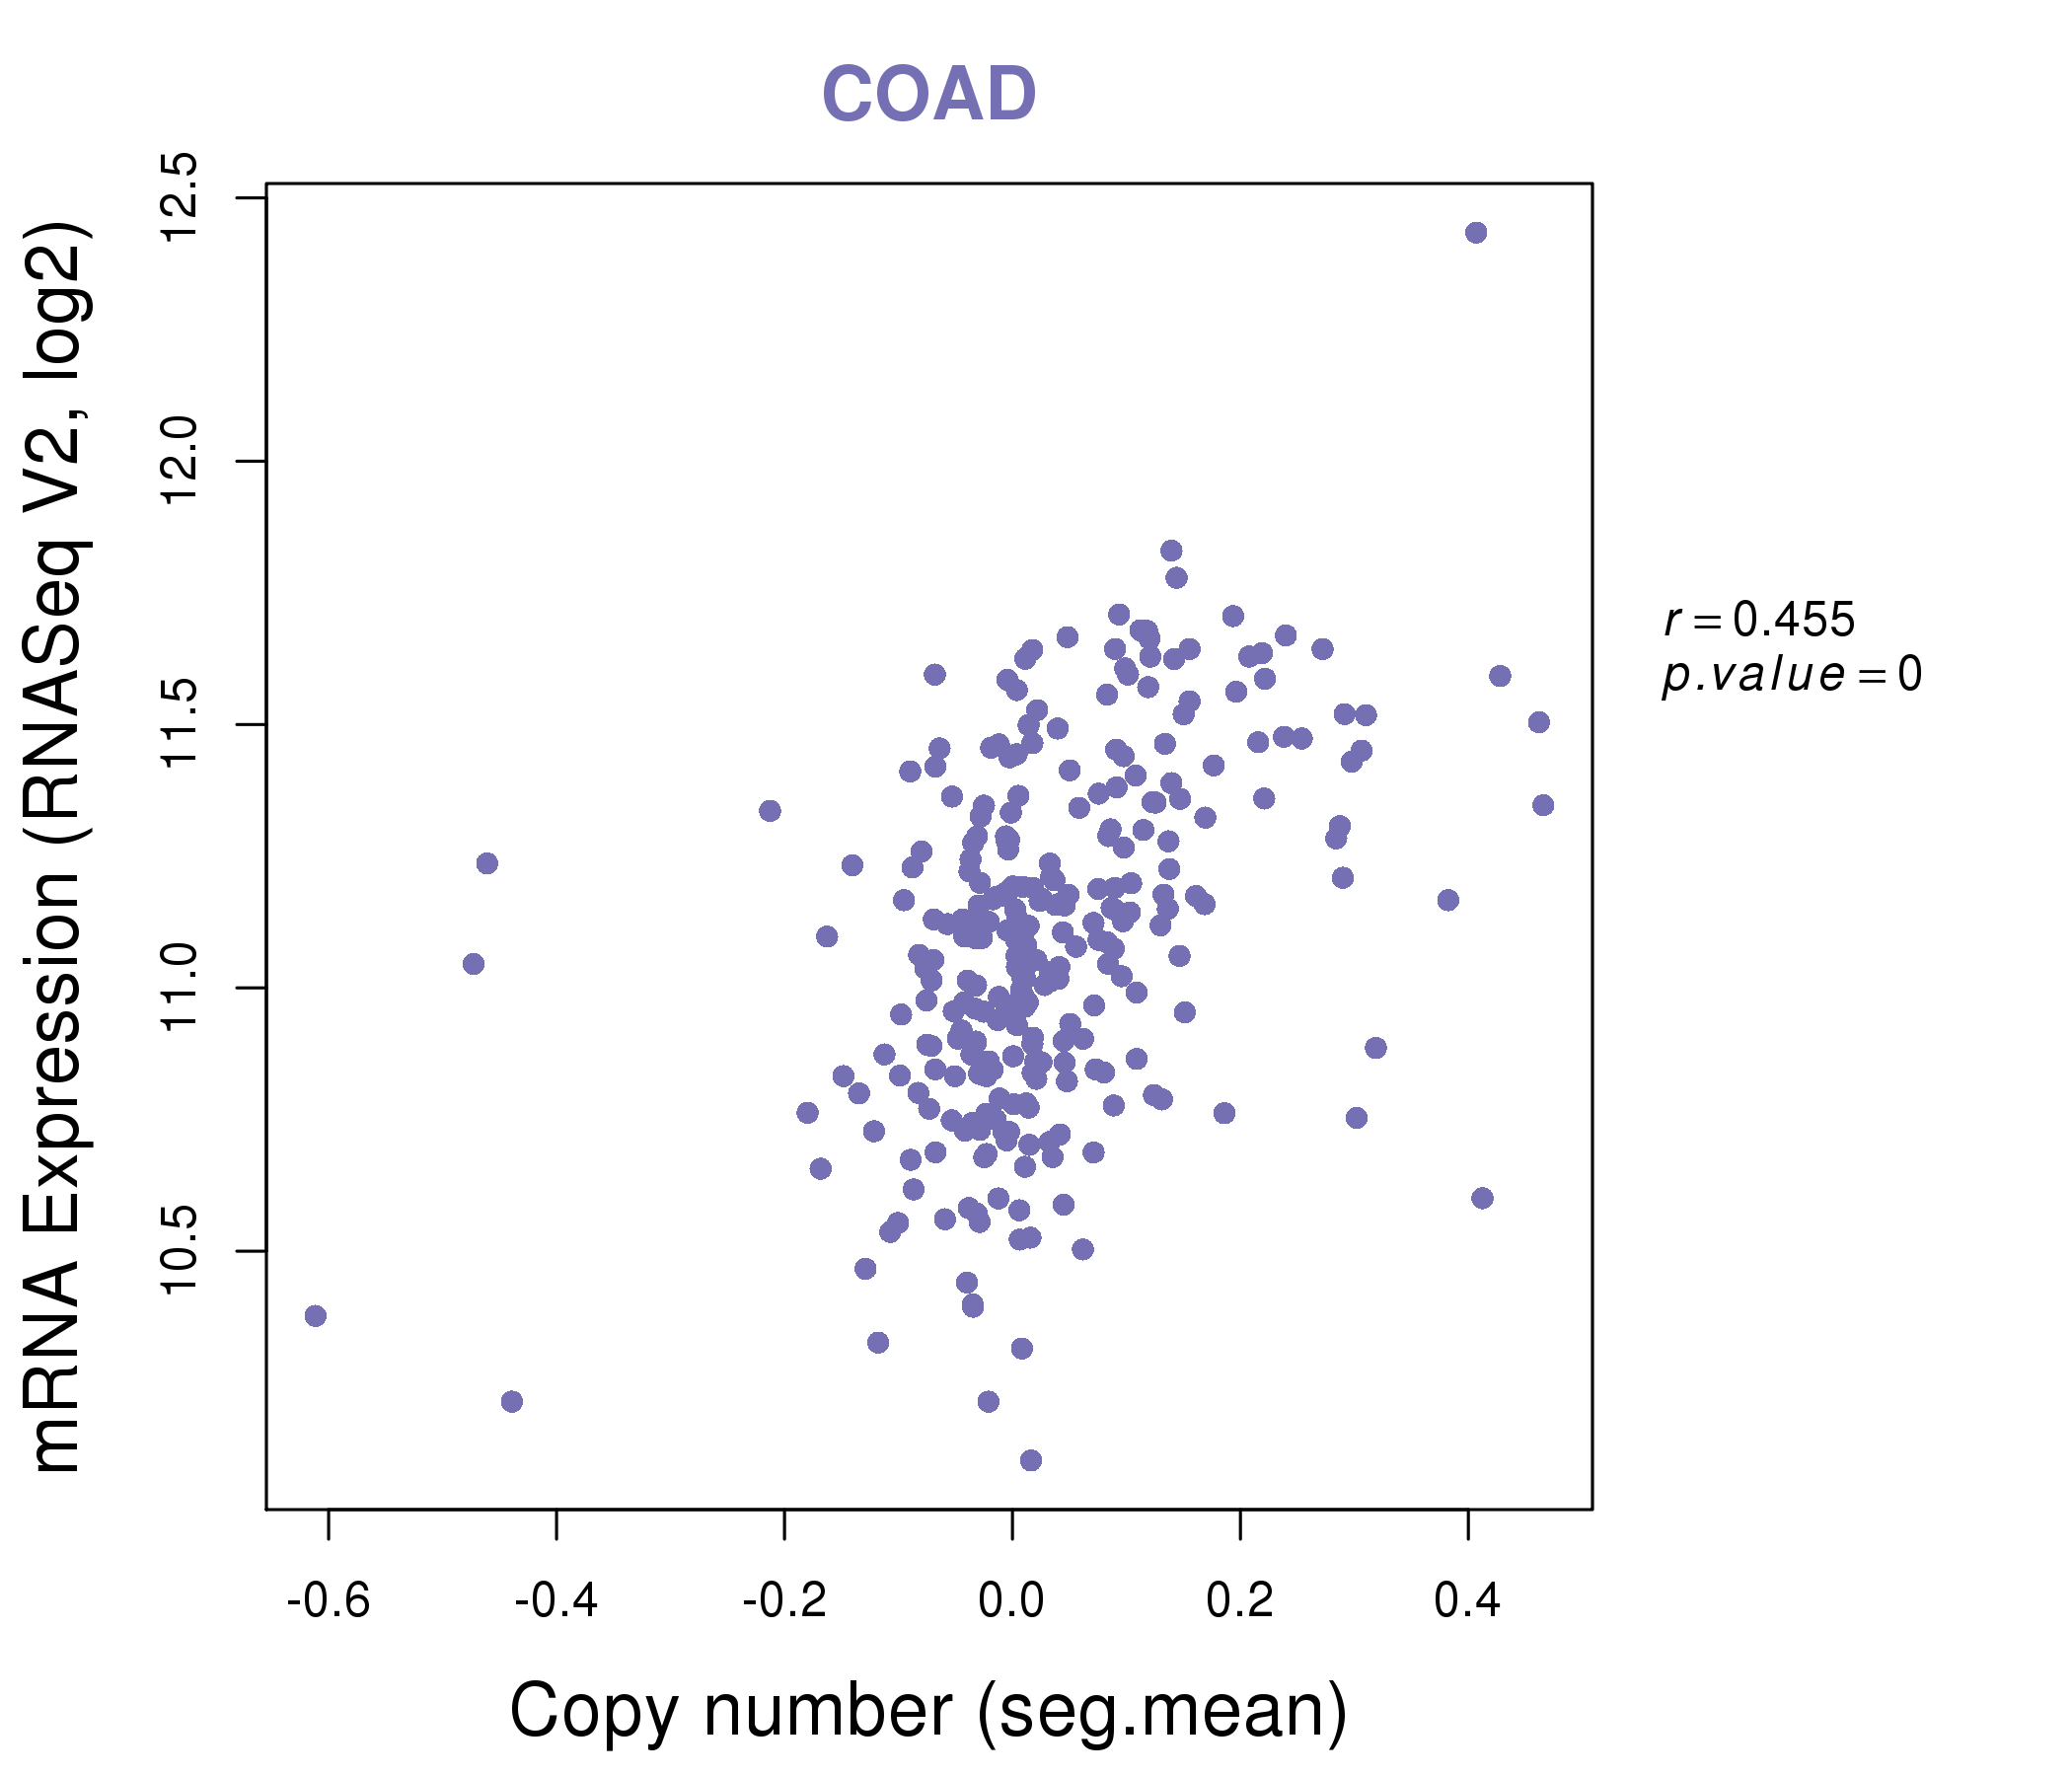
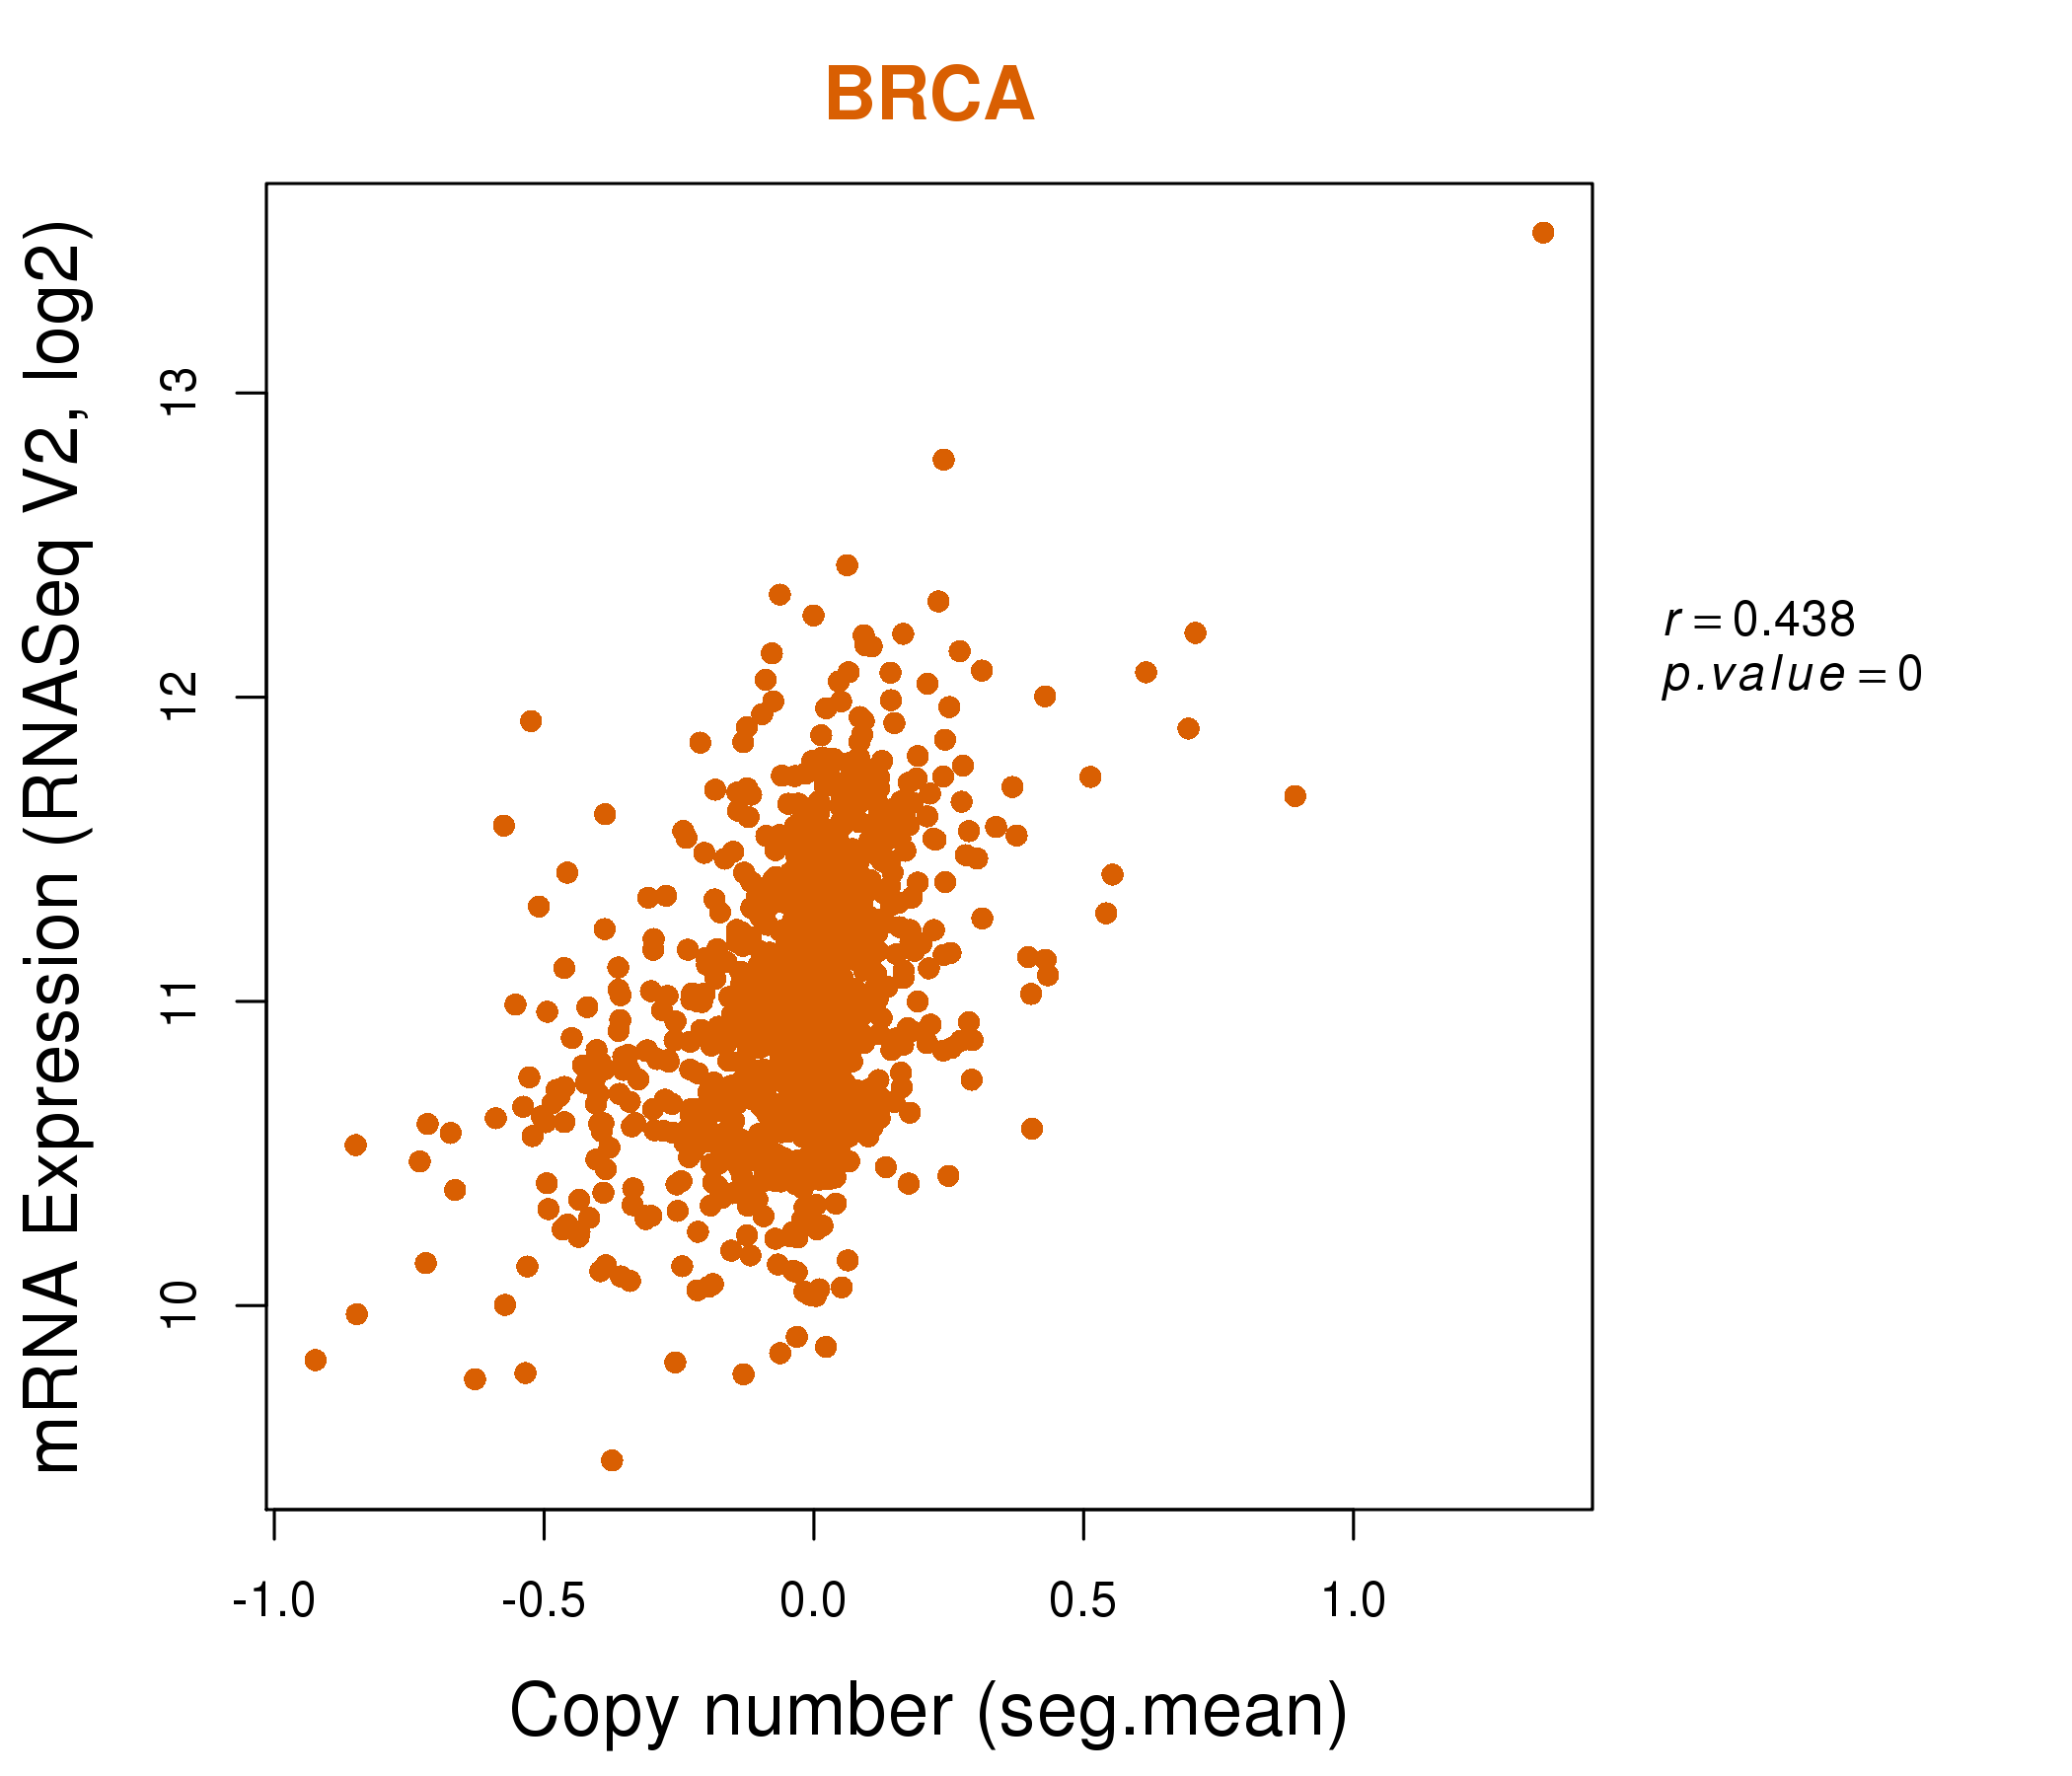
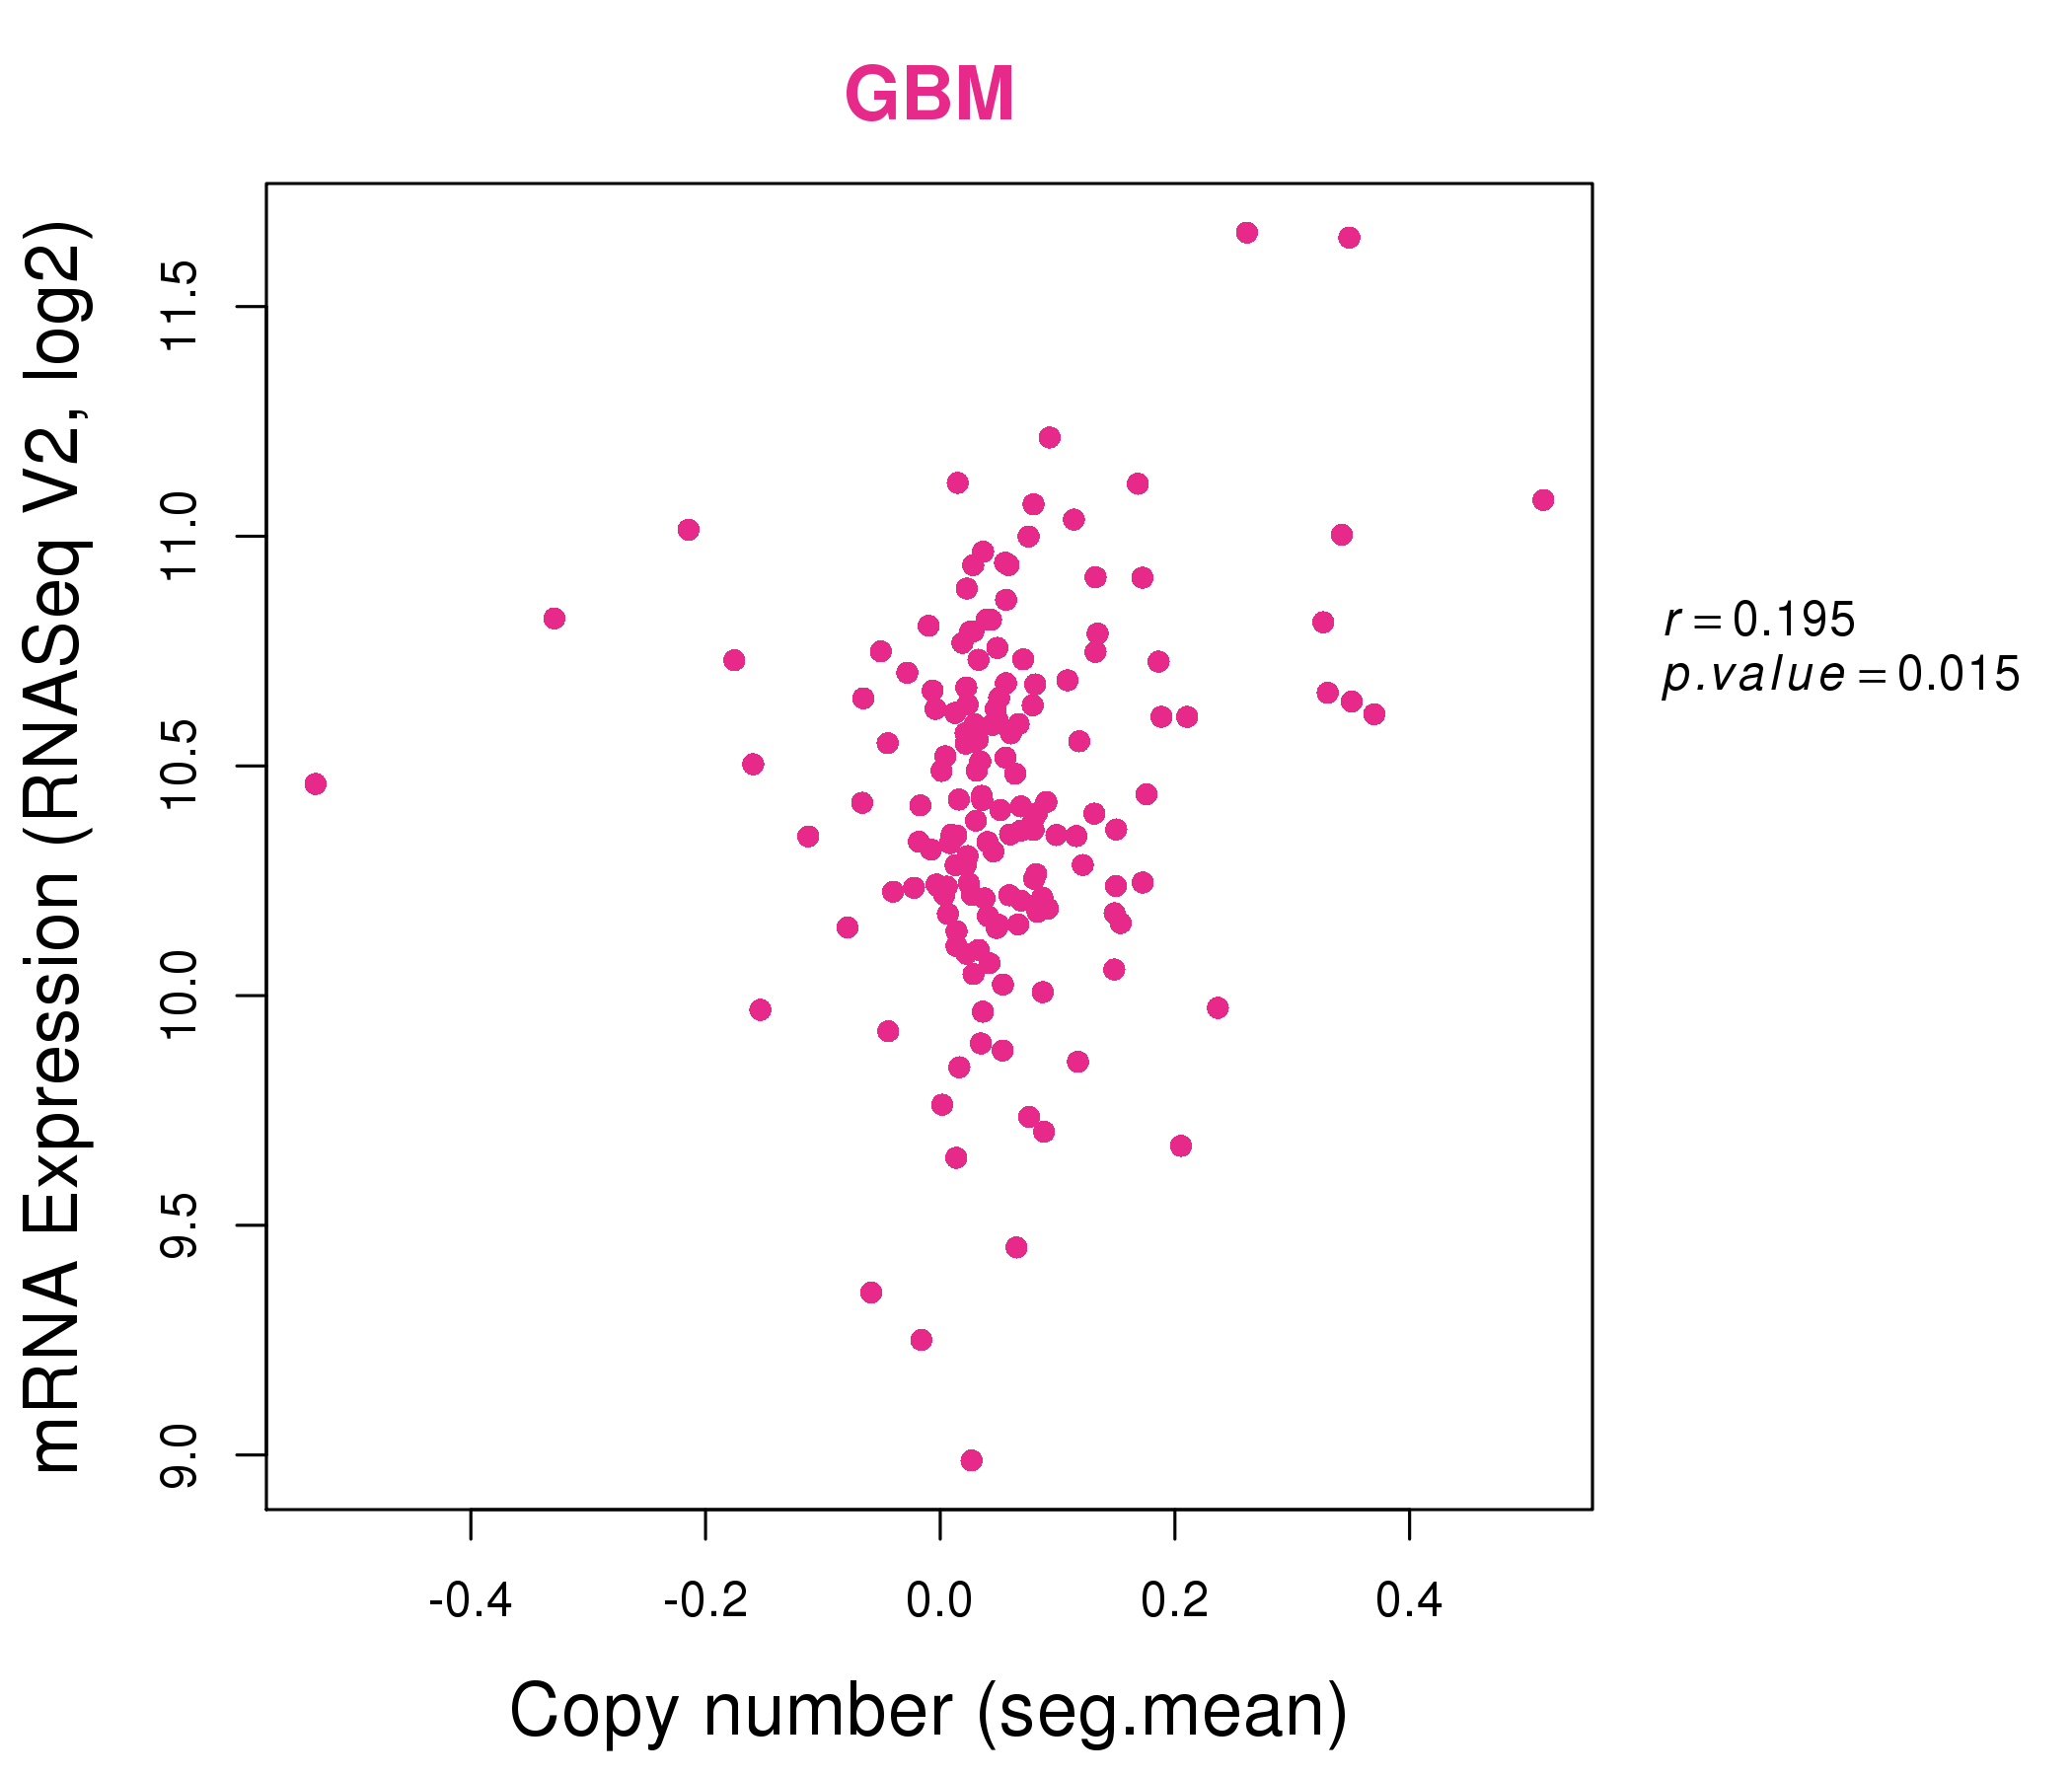
| * This plots show the correlation between CNV and gene expression. |
: Open all plots for all cancer types
 |
|
 |
|
| Top |
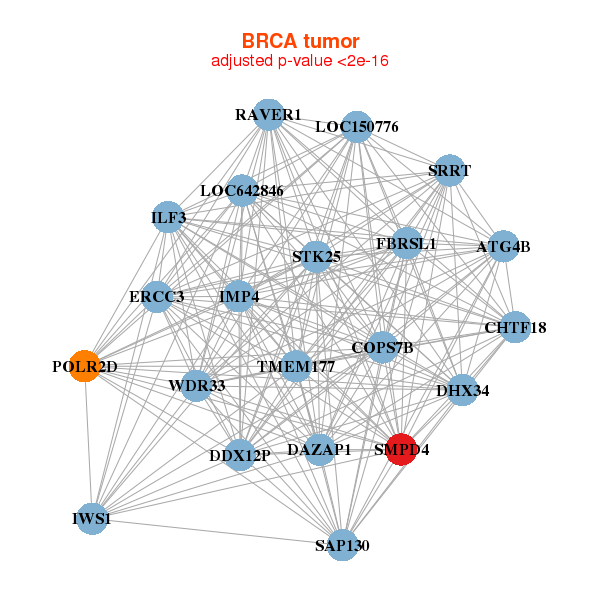
| Gene-Gene Network Information |
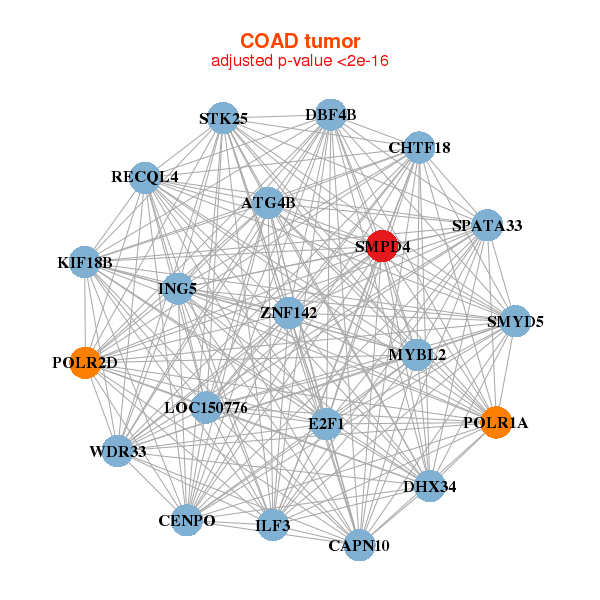
| * Co-Expression network figures were drawn using R package igraph. Only the top 20 genes with the highest correlations were shown. Red circle: input gene, orange circle: cell metabolism gene, sky circle: other gene |
: Open all plots for all cancer types
 |
| ||||
| ATG4B,CHTF18,COPS7B,DAZAP1,DDX12P,DHX34,ERCC3, FBRSL1,ILF3,IMP4,IWS1,LOC150776,LOC642846,POLR2D, RAVER1,SAP130,SMPD4,SRRT,STK25,TMEM177,WDR33 | ASB6,ATF6B,LRRC75B,CHERP,CNOT3,DHX34,ELMO3, DENND6B,FBXW9,KIF22,LIG1,RAD9A,SCAMP4,SLC12A9, SLC25A29,SMPD4,STK11IP,TRIM28,USP20,WDR6,ZFYVE27 | ||||
 |
| ||||
| ATG4B,SPATA33,CAPN10,CENPO,CHTF18,DBF4B,DHX34, E2F1,ILF3,ING5,KIF18B,LOC150776,MYBL2,POLR1A, POLR2D,RECQL4,SMPD4,SMYD5,STK25,WDR33,ZNF142 | ATRIP,CEP164,DHX30,DOHH,EIF3B,GCN1L1,HNRNPA0, ILF3,KHSRP,MYBBP1A,NOC2L,NOL6,NUP188,ODF2, PFAS,SLC7A1,SMPD4,TELO2,TMEM201,ZC3H18,ZNF142 |
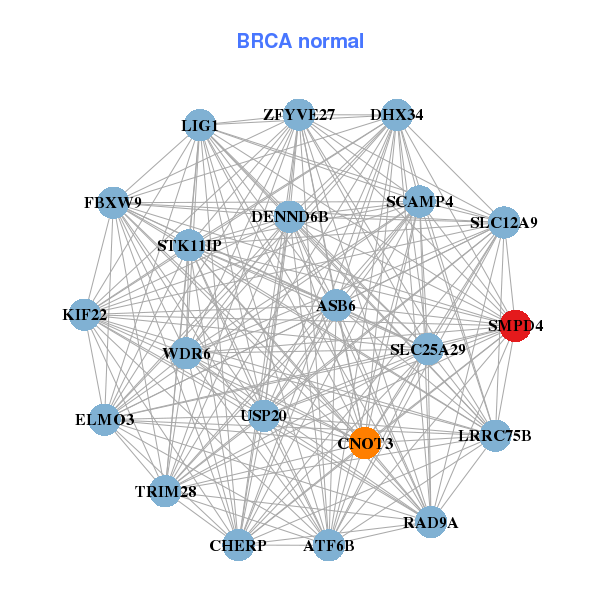
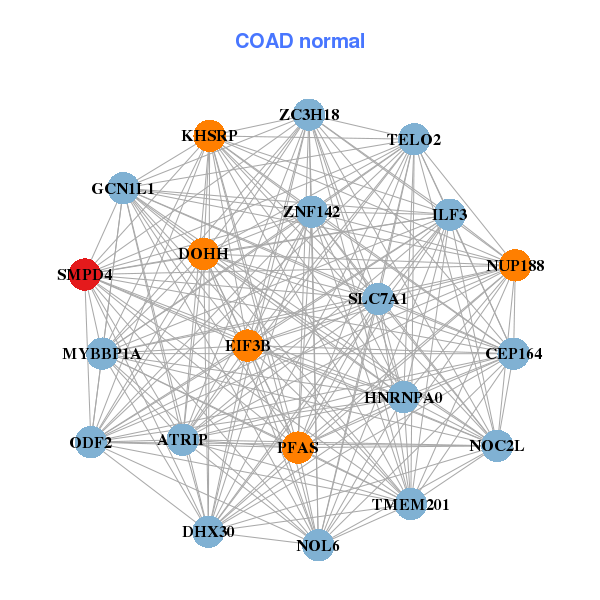
| * Co-Expression network figures were drawn using R package igraph. Only the top 20 genes with the highest correlations were shown. Red circle: input gene, orange circle: cell metabolism gene, sky circle: other gene |
: Open all plots for all cancer types
| Top |
: Open all interacting genes' information including KEGG pathway for all interacting genes from DAVID
| Top |
| Pharmacological Information for SMPD4 |
| DB Category | DB Name | DB's ID and Url link |
| * Gene Centered Interaction Network. |
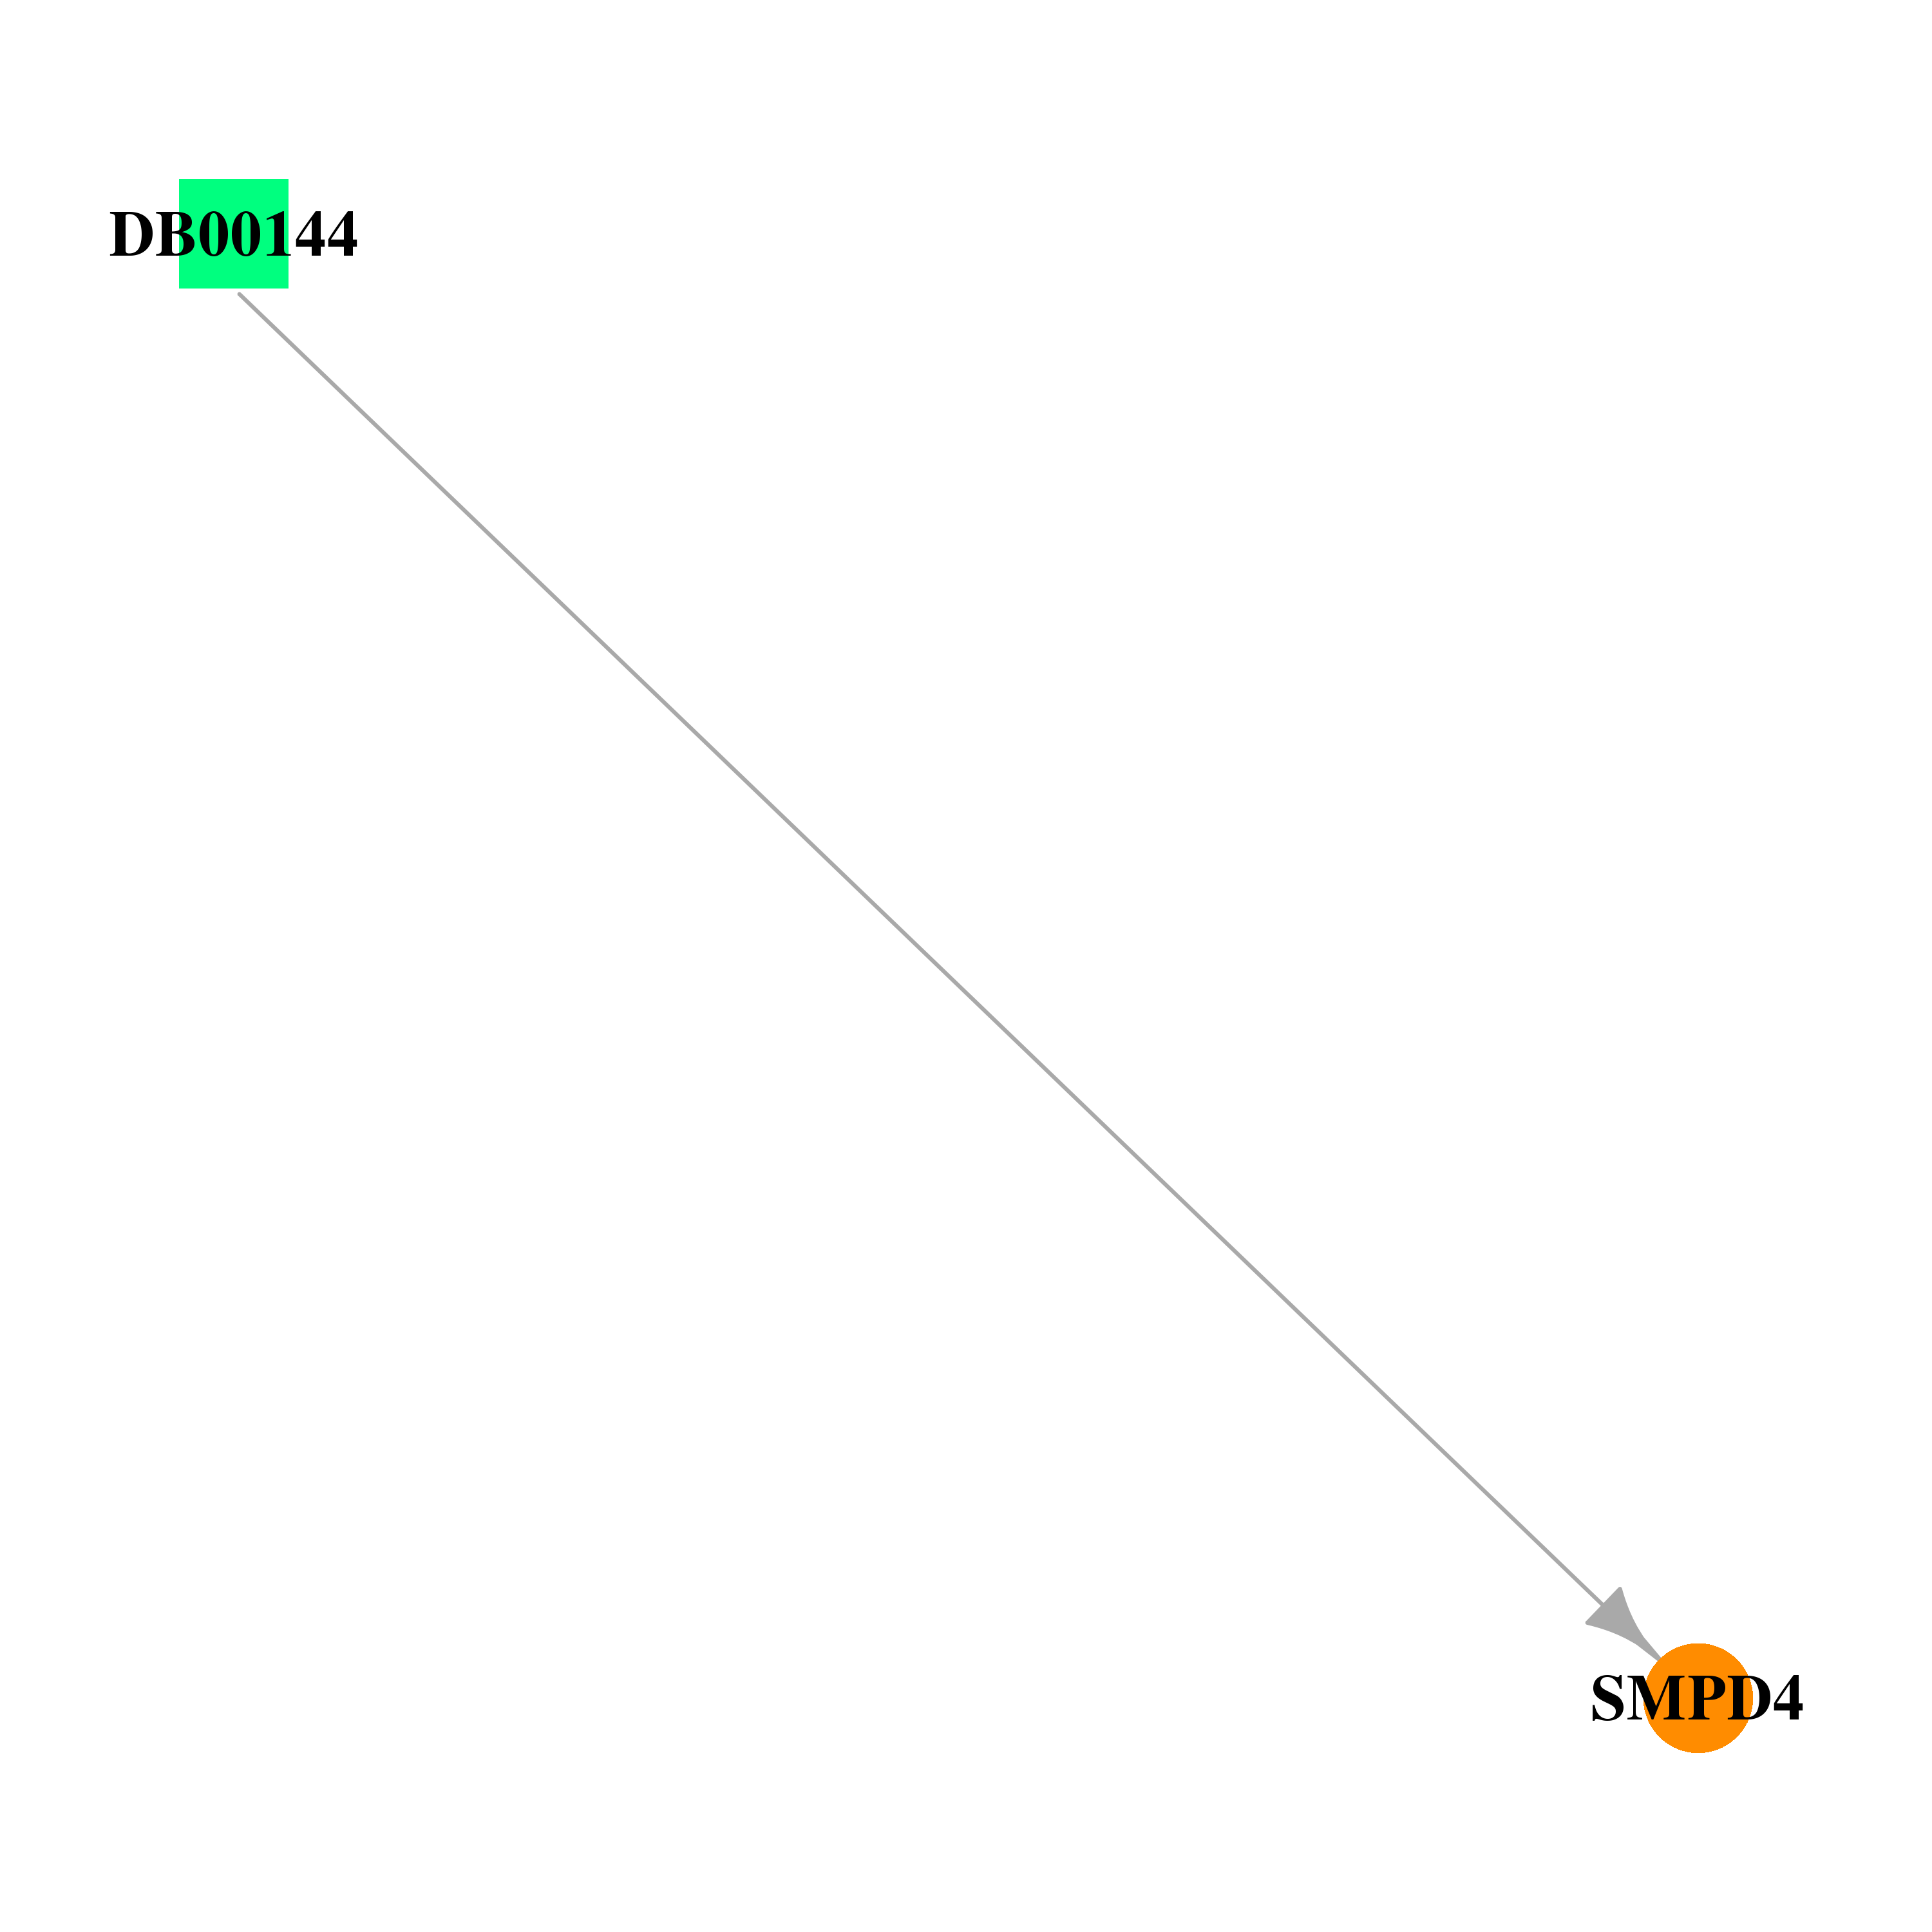 |
| * Drug Centered Interaction Network. |
| DrugBank ID | Target Name | Drug Groups | Generic Name | Drug Centered Network | Drug Structure |
| DB00144 | sphingomyelin phosphodiesterase 4, neutral membrane (neutral sphingomyelinase-3) | approved; nutraceutical | Phosphatidylserine |  |  |
| Top |
| Cross referenced IDs for SMPD4 |
| * We obtained these cross-references from Uniprot database. It covers 150 different DBs, 18 categories. http://www.uniprot.org/help/cross_references_section |
: Open all cross reference information
|
Copyright © 2016-Present - The Univsersity of Texas Health Science Center at Houston @ |