|
||||||||||||||||||||
| |
| Phenotypic Information (metabolism pathway, cancer, disease, phenome) |
| |
| |
| Gene-Gene Network Information: Co-Expression Network, Interacting Genes & KEGG |
| |
|


| Gene Summary for PIGV |
| Top |
| Phenotypic Information for PIGV(metabolism pathway, cancer, disease, phenome) |
| Cancer | CGAP: PIGV |
| Familial Cancer Database: PIGV | |
| * This gene is included in those cancer gene databases. |
|
|
|
|
|
| . | ||||||||||||||
Oncogene 1 | Significant driver gene in | |||||||||||||||||||
| cf) number; DB name 1 Oncogene; http://nar.oxfordjournals.org/content/35/suppl_1/D721.long, 2 Tumor Suppressor gene; https://bioinfo.uth.edu/TSGene/, 3 Cancer Gene Census; http://www.nature.com/nrc/journal/v4/n3/abs/nrc1299.html, 4 CancerGenes; http://nar.oxfordjournals.org/content/35/suppl_1/D721.long, 5 Network of Cancer Gene; http://ncg.kcl.ac.uk/index.php, 1Therapeutic Vulnerabilities in Cancer; http://cbio.mskcc.org/cancergenomics/statius/ |
| REACTOME_METABOLISM_OF_PROTEINS | |
| OMIM | |
| Orphanet | |
| Disease | KEGG Disease: PIGV |
| MedGen: PIGV (Human Medical Genetics with Condition) | |
| ClinVar: PIGV | |
| Phenotype | MGI: PIGV (International Mouse Phenotyping Consortium) |
| PhenomicDB: PIGV | |
| Mutations for PIGV |
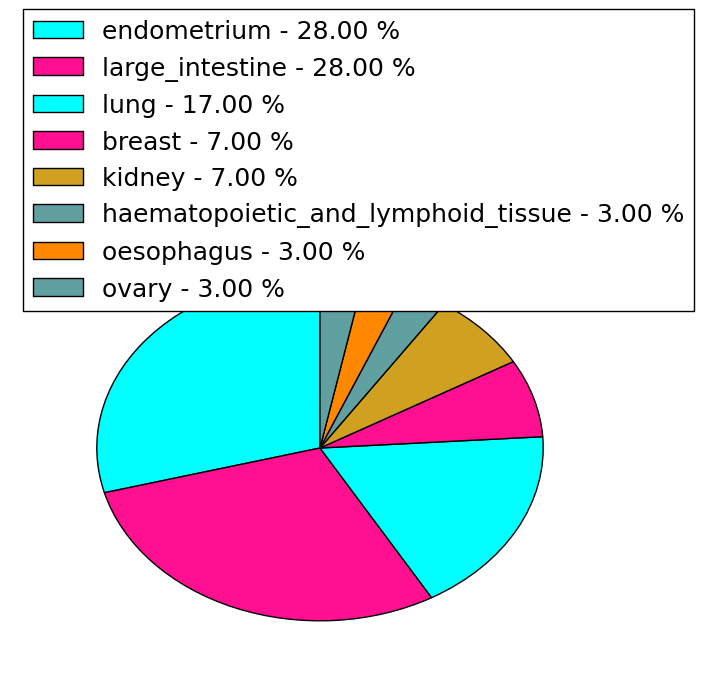
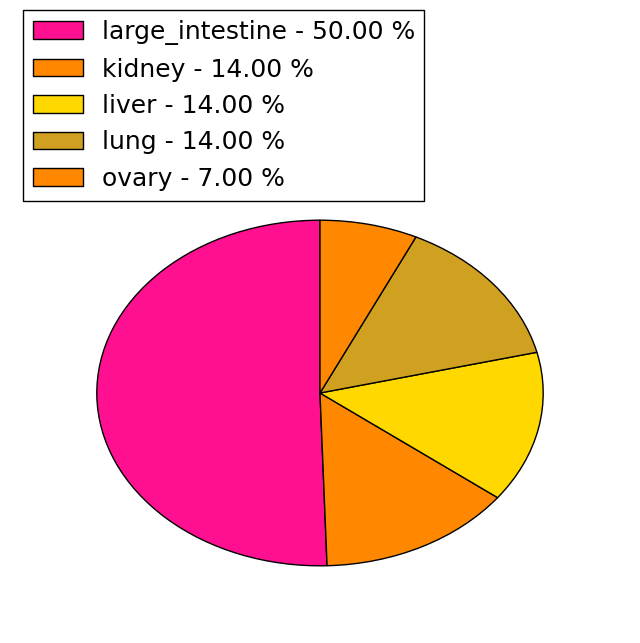
| * Under tables are showing count per each tissue to give us broad intuition about tissue specific mutation patterns.You can go to the detailed page for each mutation database's web site. |
| - Statistics for Tissue and Mutation type | Top |
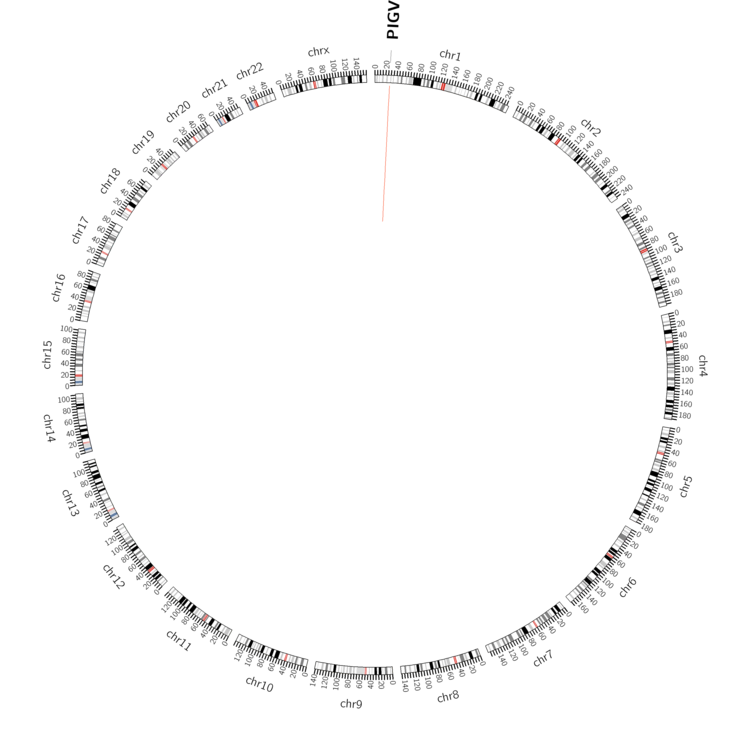 |
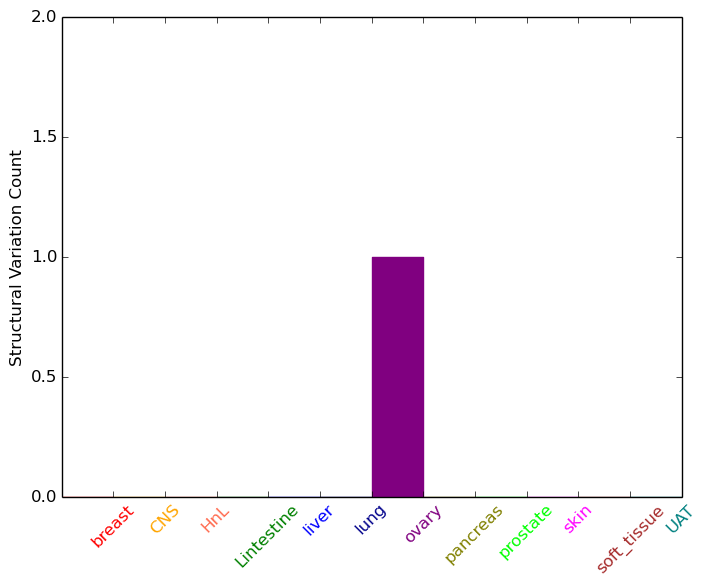
| - For Inter-chromosomal Variations |
| There's no inter-chromosomal structural variation. |
| - For Intra-chromosomal Variations |
| * Intra-chromosomal variantions includes 'intrachromosomal amplicon to amplicon', 'intrachromosomal amplicon to non-amplified dna', 'intrachromosomal deletion', 'intrachromosomal fold-back inversion', 'intrachromosomal inversion', 'intrachromosomal tandem duplication', 'Intrachromosomal unknown type', 'intrachromosomal with inverted orientation', 'intrachromosomal with non-inverted orientation'. |
 |
| Sample | Symbol_a | Chr_a | Start_a | End_a | Symbol_b | Chr_b | Start_b | End_b |
| ovary | PIGV | chr1 | 27121707 | 27121727 | PIGV | chr1 | 27121880 | 27121900 |
| cf) Tissue number; Tissue name (1;Breast, 2;Central_nervous_system, 3;Haematopoietic_and_lymphoid_tissue, 4;Large_intestine, 5;Liver, 6;Lung, 7;Ovary, 8;Pancreas, 9;Prostate, 10;Skin, 11;Soft_tissue, 12;Upper_aerodigestive_tract) |
| * From mRNA Sanger sequences, Chitars2.0 arranged chimeric transcripts. This table shows PIGV related fusion information. |
| ID | Head Gene | Tail Gene | Accession | Gene_a | qStart_a | qEnd_a | Chromosome_a | tStart_a | tEnd_a | Gene_a | qStart_a | qEnd_a | Chromosome_a | tStart_a | tEnd_a |
| Top |
| There's no copy number variation information in COSMIC data for this gene. |
| Top |
|
 |
| Top |
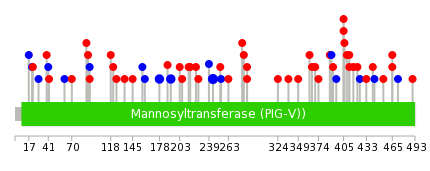
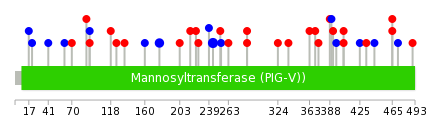
| Stat. for Non-Synonymous SNVs (# total SNVs=28) | (# total SNVs=14) |
 |  |
(# total SNVs=0) | (# total SNVs=0) |
| Top |
| * When you move the cursor on each content, you can see more deailed mutation information on the Tooltip. Those are primary_site,primary_histology,mutation(aa),pubmedID. |
| GRCh37 position | Mutation(aa) | Unique sampleID count |
| chr1:27121257-27121257 | p.S244S | 3 |
| chr1:27121059-27121059 | p.F178F | 2 |
| chr1:27124247-27124247 | p.S465Y | 2 |
| chr1:27121101-27121101 | p.S192S | 2 |
| chr1:27121133-27121133 | p.R203H | 1 |
| chr1:27124103-27124103 | p.P417L | 1 |
| chr1:27120612-27120612 | p.F29F | 1 |
| chr1:27121364-27121364 | p.A280V | 1 |
| chr1:27120887-27120887 | p.S121L | 1 |
| chr1:27121688-27121688 | p.V388E | 1 |
| Top |
|
 |
| Point Mutation/ Tissue ID | 1 | 2 | 3 | 4 | 5 | 6 | 7 | 8 | 9 | 10 | 11 | 12 | 13 | 14 | 15 | 16 | 17 | 18 | 19 | 20 |
| # sample | 3 | 1 | 10 | 1 | 1 | 4 | 1 | 2 | 7 | 4 | 5 | |||||||||
| # mutation | 4 | 1 | 10 | 1 | 1 | 4 | 1 | 2 | 8 | 4 | 8 | |||||||||
| nonsynonymous SNV | 1 | 1 | 4 | 3 | 1 | 6 | 3 | 8 | ||||||||||||
| synonymous SNV | 3 | 6 | 1 | 1 | 1 | 1 | 1 | 2 | 1 |
| cf) Tissue ID; Tissue type (1; BLCA[Bladder Urothelial Carcinoma], 2; BRCA[Breast invasive carcinoma], 3; CESC[Cervical squamous cell carcinoma and endocervical adenocarcinoma], 4; COAD[Colon adenocarcinoma], 5; GBM[Glioblastoma multiforme], 6; Glioma Low Grade, 7; HNSC[Head and Neck squamous cell carcinoma], 8; KICH[Kidney Chromophobe], 9; KIRC[Kidney renal clear cell carcinoma], 10; KIRP[Kidney renal papillary cell carcinoma], 11; LAML[Acute Myeloid Leukemia], 12; LUAD[Lung adenocarcinoma], 13; LUSC[Lung squamous cell carcinoma], 14; OV[Ovarian serous cystadenocarcinoma ], 15; PAAD[Pancreatic adenocarcinoma], 16; PRAD[Prostate adenocarcinoma], 17; SKCM[Skin Cutaneous Melanoma], 18:STAD[Stomach adenocarcinoma], 19:THCA[Thyroid carcinoma], 20:UCEC[Uterine Corpus Endometrial Carcinoma]) |
| Top |
| * We represented just top 10 SNVs. When you move the cursor on each content, you can see more deailed mutation information on the Tooltip. Those are primary_site, primary_histology, mutation(aa), pubmedID. |
| Genomic Position | Mutation(aa) | Unique sampleID count |
| chr1:27121257 | p.S244S,PIGV | 3 |
| chr1:27124247 | p.S465F,PIGV | 2 |
| chr1:27121059 | p.F178F,PIGV | 2 |
| chr1:27121497 | p.G61G,PIGV | 1 |
| chr1:27120708 | p.A253V,PIGV | 1 |
| chr1:27124128 | p.E425E,PIGV | 1 |
| chr1:27121172 | p.H70Y,PIGV | 1 |
| chr1:27121534 | p.L254L,PIGV | 1 |
| chr1:27120733 | p.T433S,PIGV | 1 |
| chr1:27124150 | p.F88V,PIGV | 1 |
| * Copy number data were extracted from TCGA using R package TCGA-Assembler. The URLs of all public data files on TCGA DCC data server were gathered on Jan-05-2015. Function ProcessCNAData in TCGA-Assembler package was used to obtain gene-level copy number value which is calculated as the average copy number of the genomic region of a gene. |
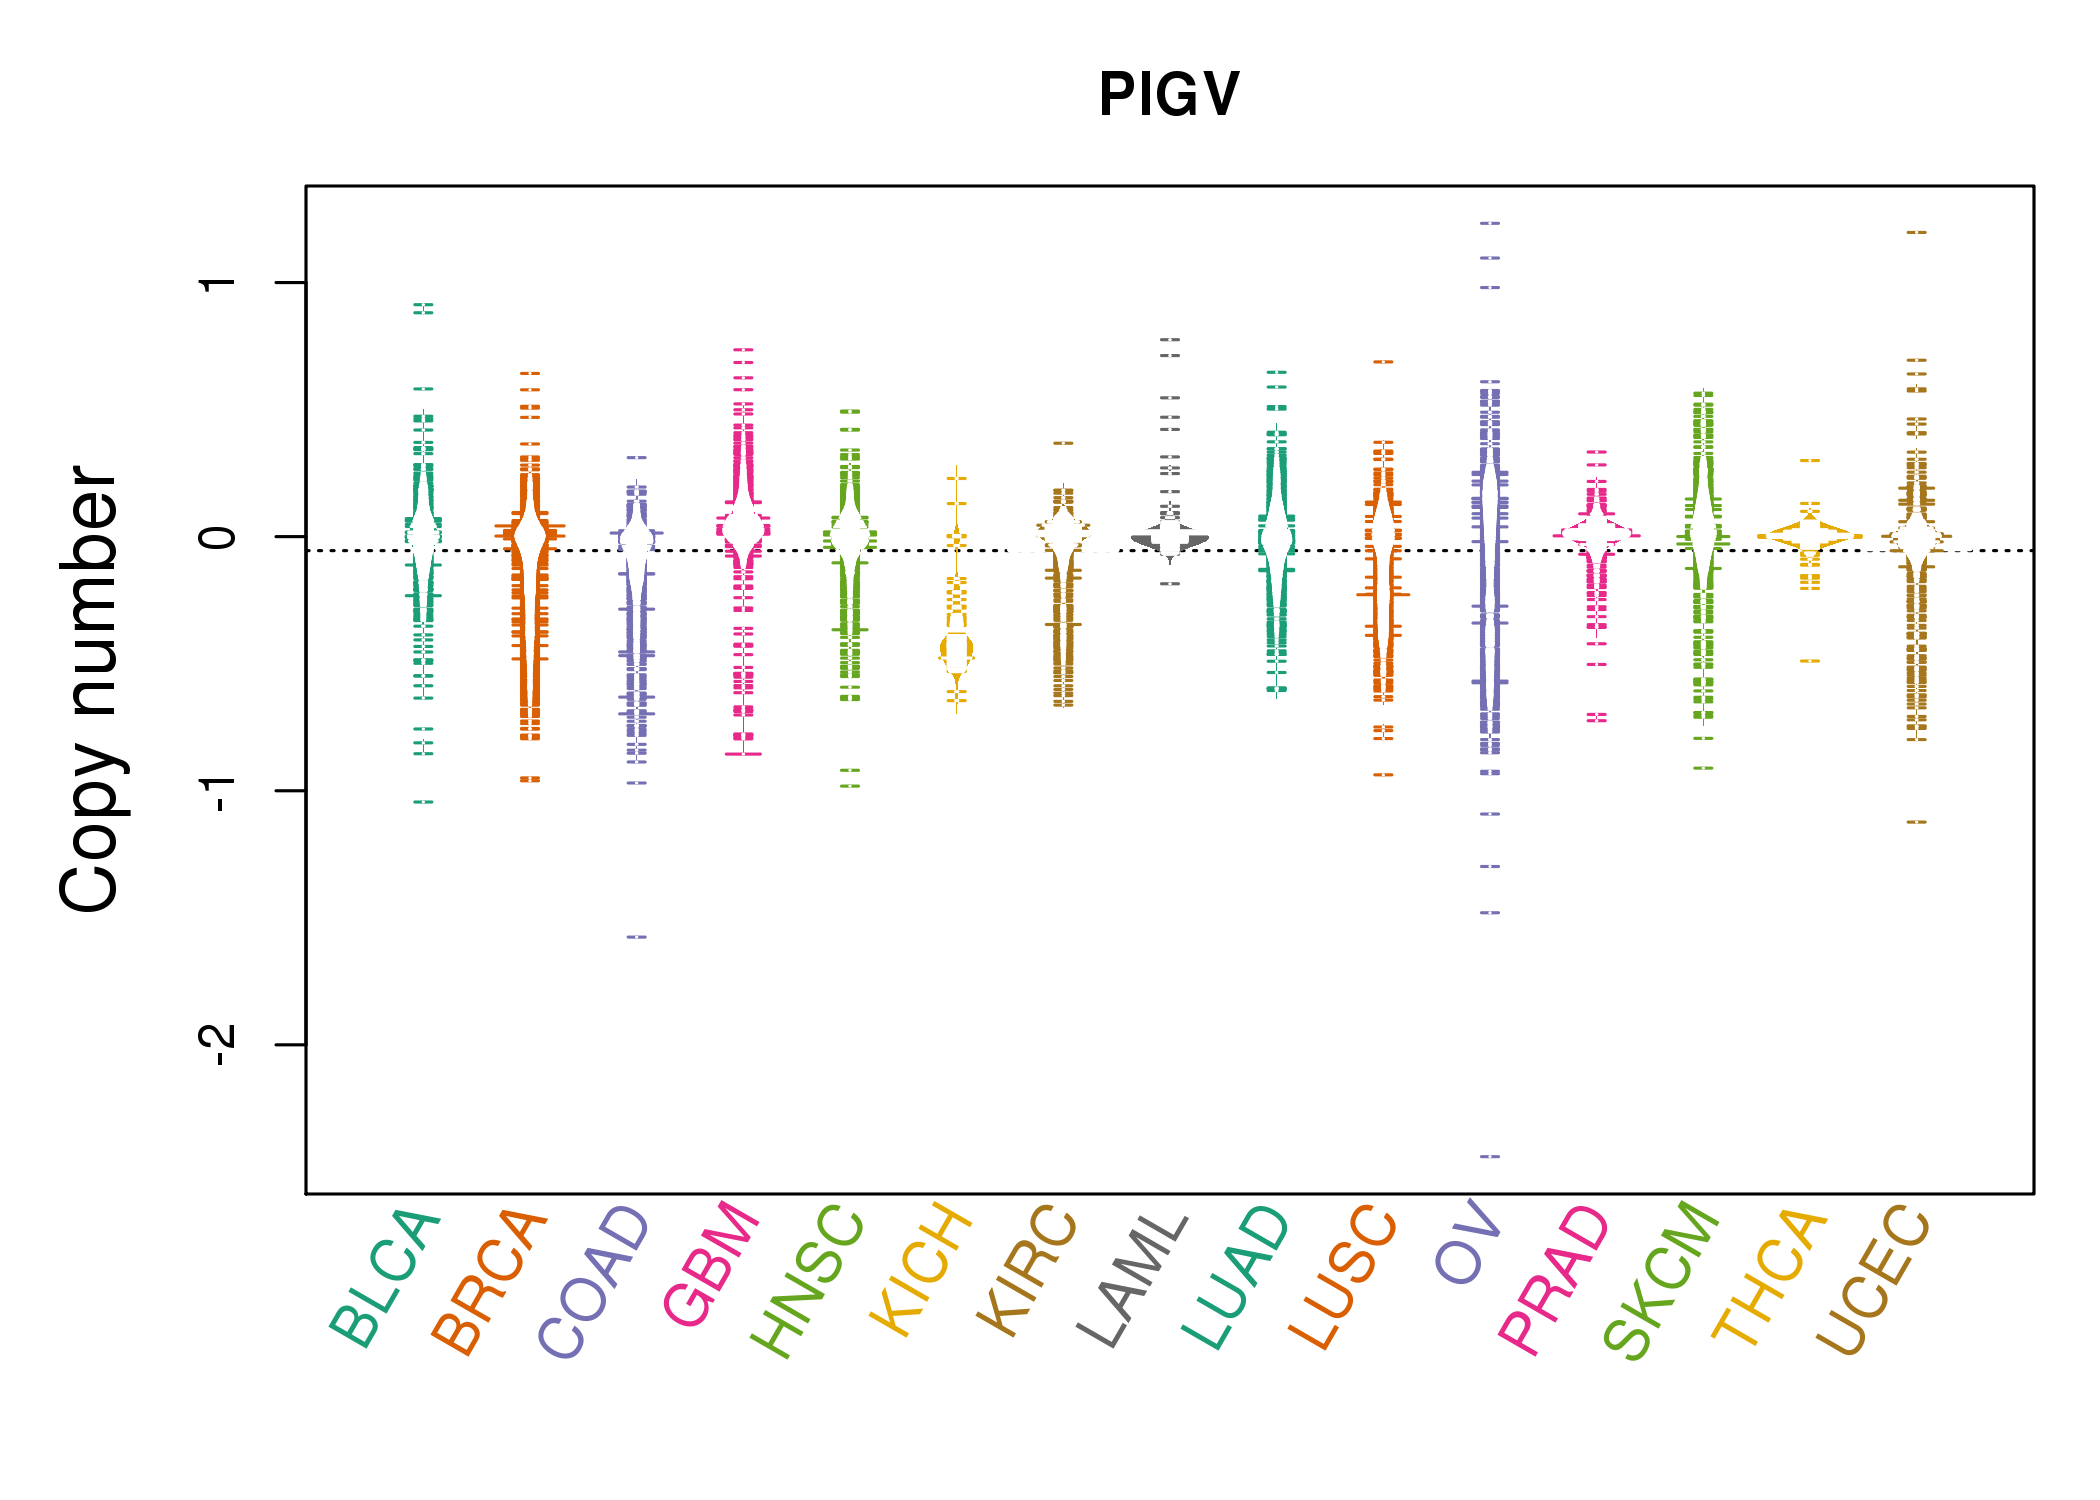 |
| cf) Tissue ID[Tissue type]: BLCA[Bladder Urothelial Carcinoma], BRCA[Breast invasive carcinoma], CESC[Cervical squamous cell carcinoma and endocervical adenocarcinoma], COAD[Colon adenocarcinoma], GBM[Glioblastoma multiforme], Glioma Low Grade, HNSC[Head and Neck squamous cell carcinoma], KICH[Kidney Chromophobe], KIRC[Kidney renal clear cell carcinoma], KIRP[Kidney renal papillary cell carcinoma], LAML[Acute Myeloid Leukemia], LUAD[Lung adenocarcinoma], LUSC[Lung squamous cell carcinoma], OV[Ovarian serous cystadenocarcinoma ], PAAD[Pancreatic adenocarcinoma], PRAD[Prostate adenocarcinoma], SKCM[Skin Cutaneous Melanoma], STAD[Stomach adenocarcinoma], THCA[Thyroid carcinoma], UCEC[Uterine Corpus Endometrial Carcinoma] |
| Top |
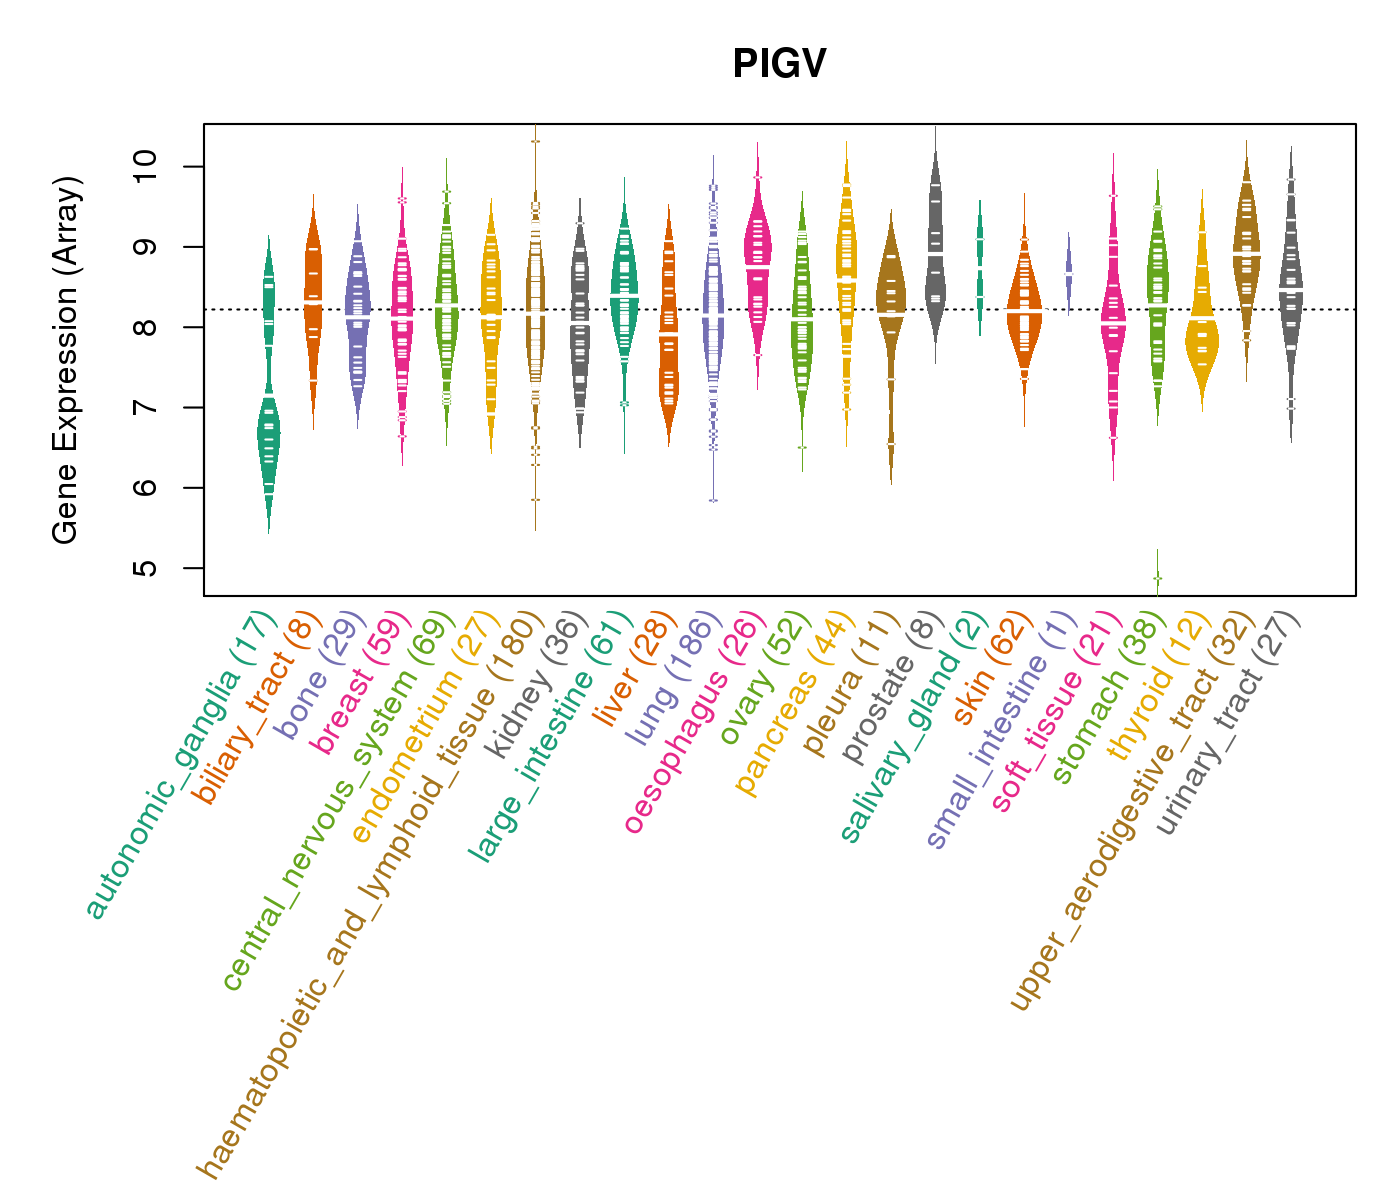
| Gene Expression for PIGV |
| * CCLE gene expression data were extracted from CCLE_Expression_Entrez_2012-10-18.res: Gene-centric RMA-normalized mRNA expression data. |
 |
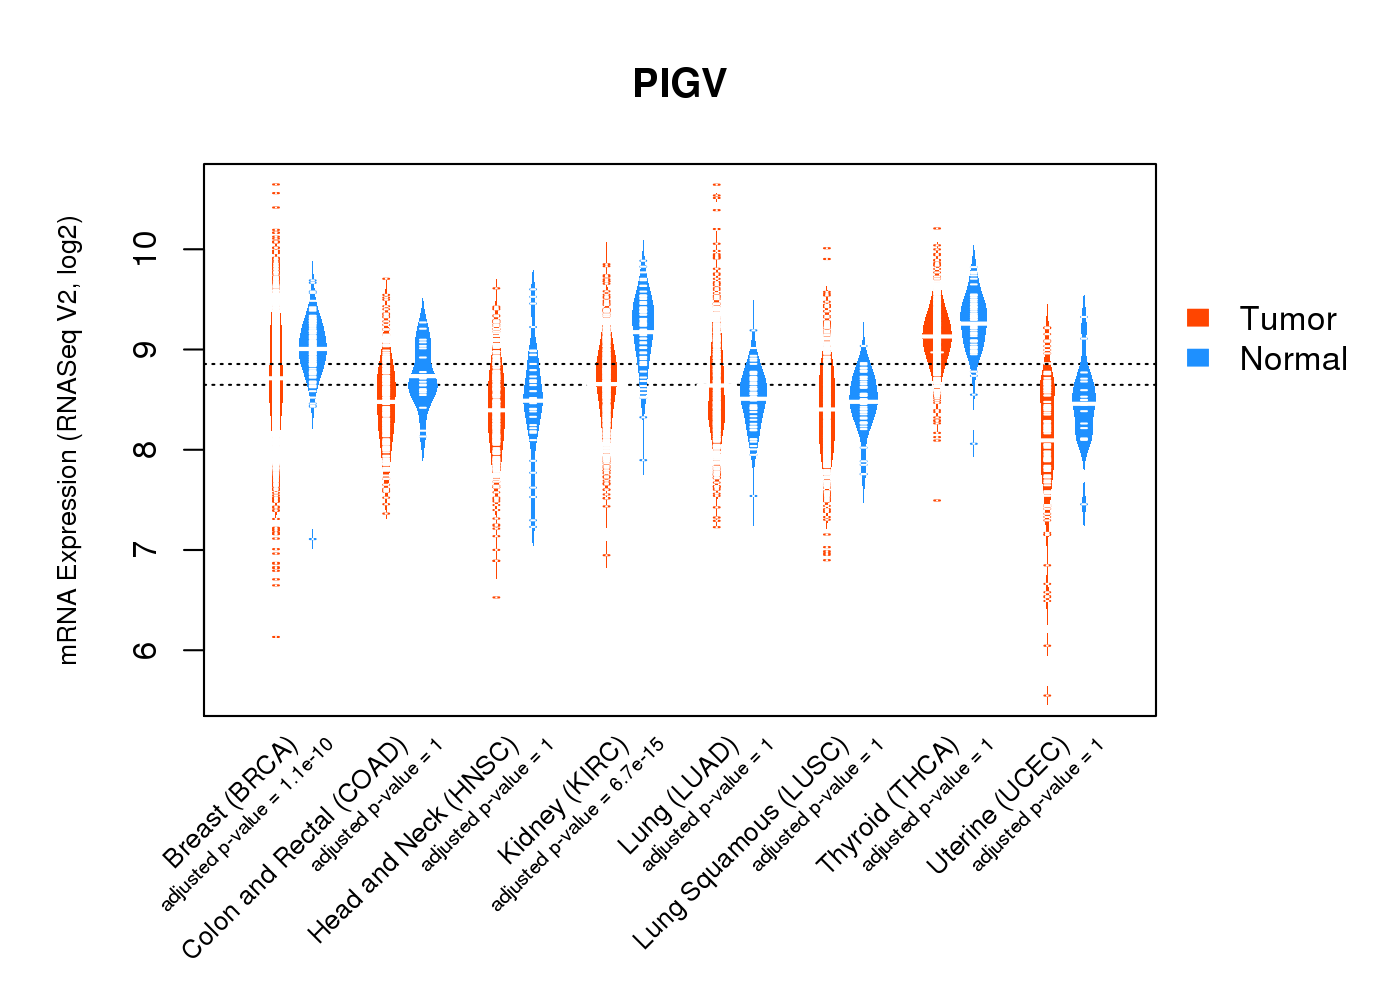
| * Normalized gene expression data of RNASeqV2 was extracted from TCGA using R package TCGA-Assembler. The URLs of all public data files on TCGA DCC data server were gathered at Jan-05-2015. Only eight cancer types have enough normal control samples for differential expression analysis. (t test, adjusted p<0.05 (using Benjamini-Hochberg FDR)) |
 |
| Top |
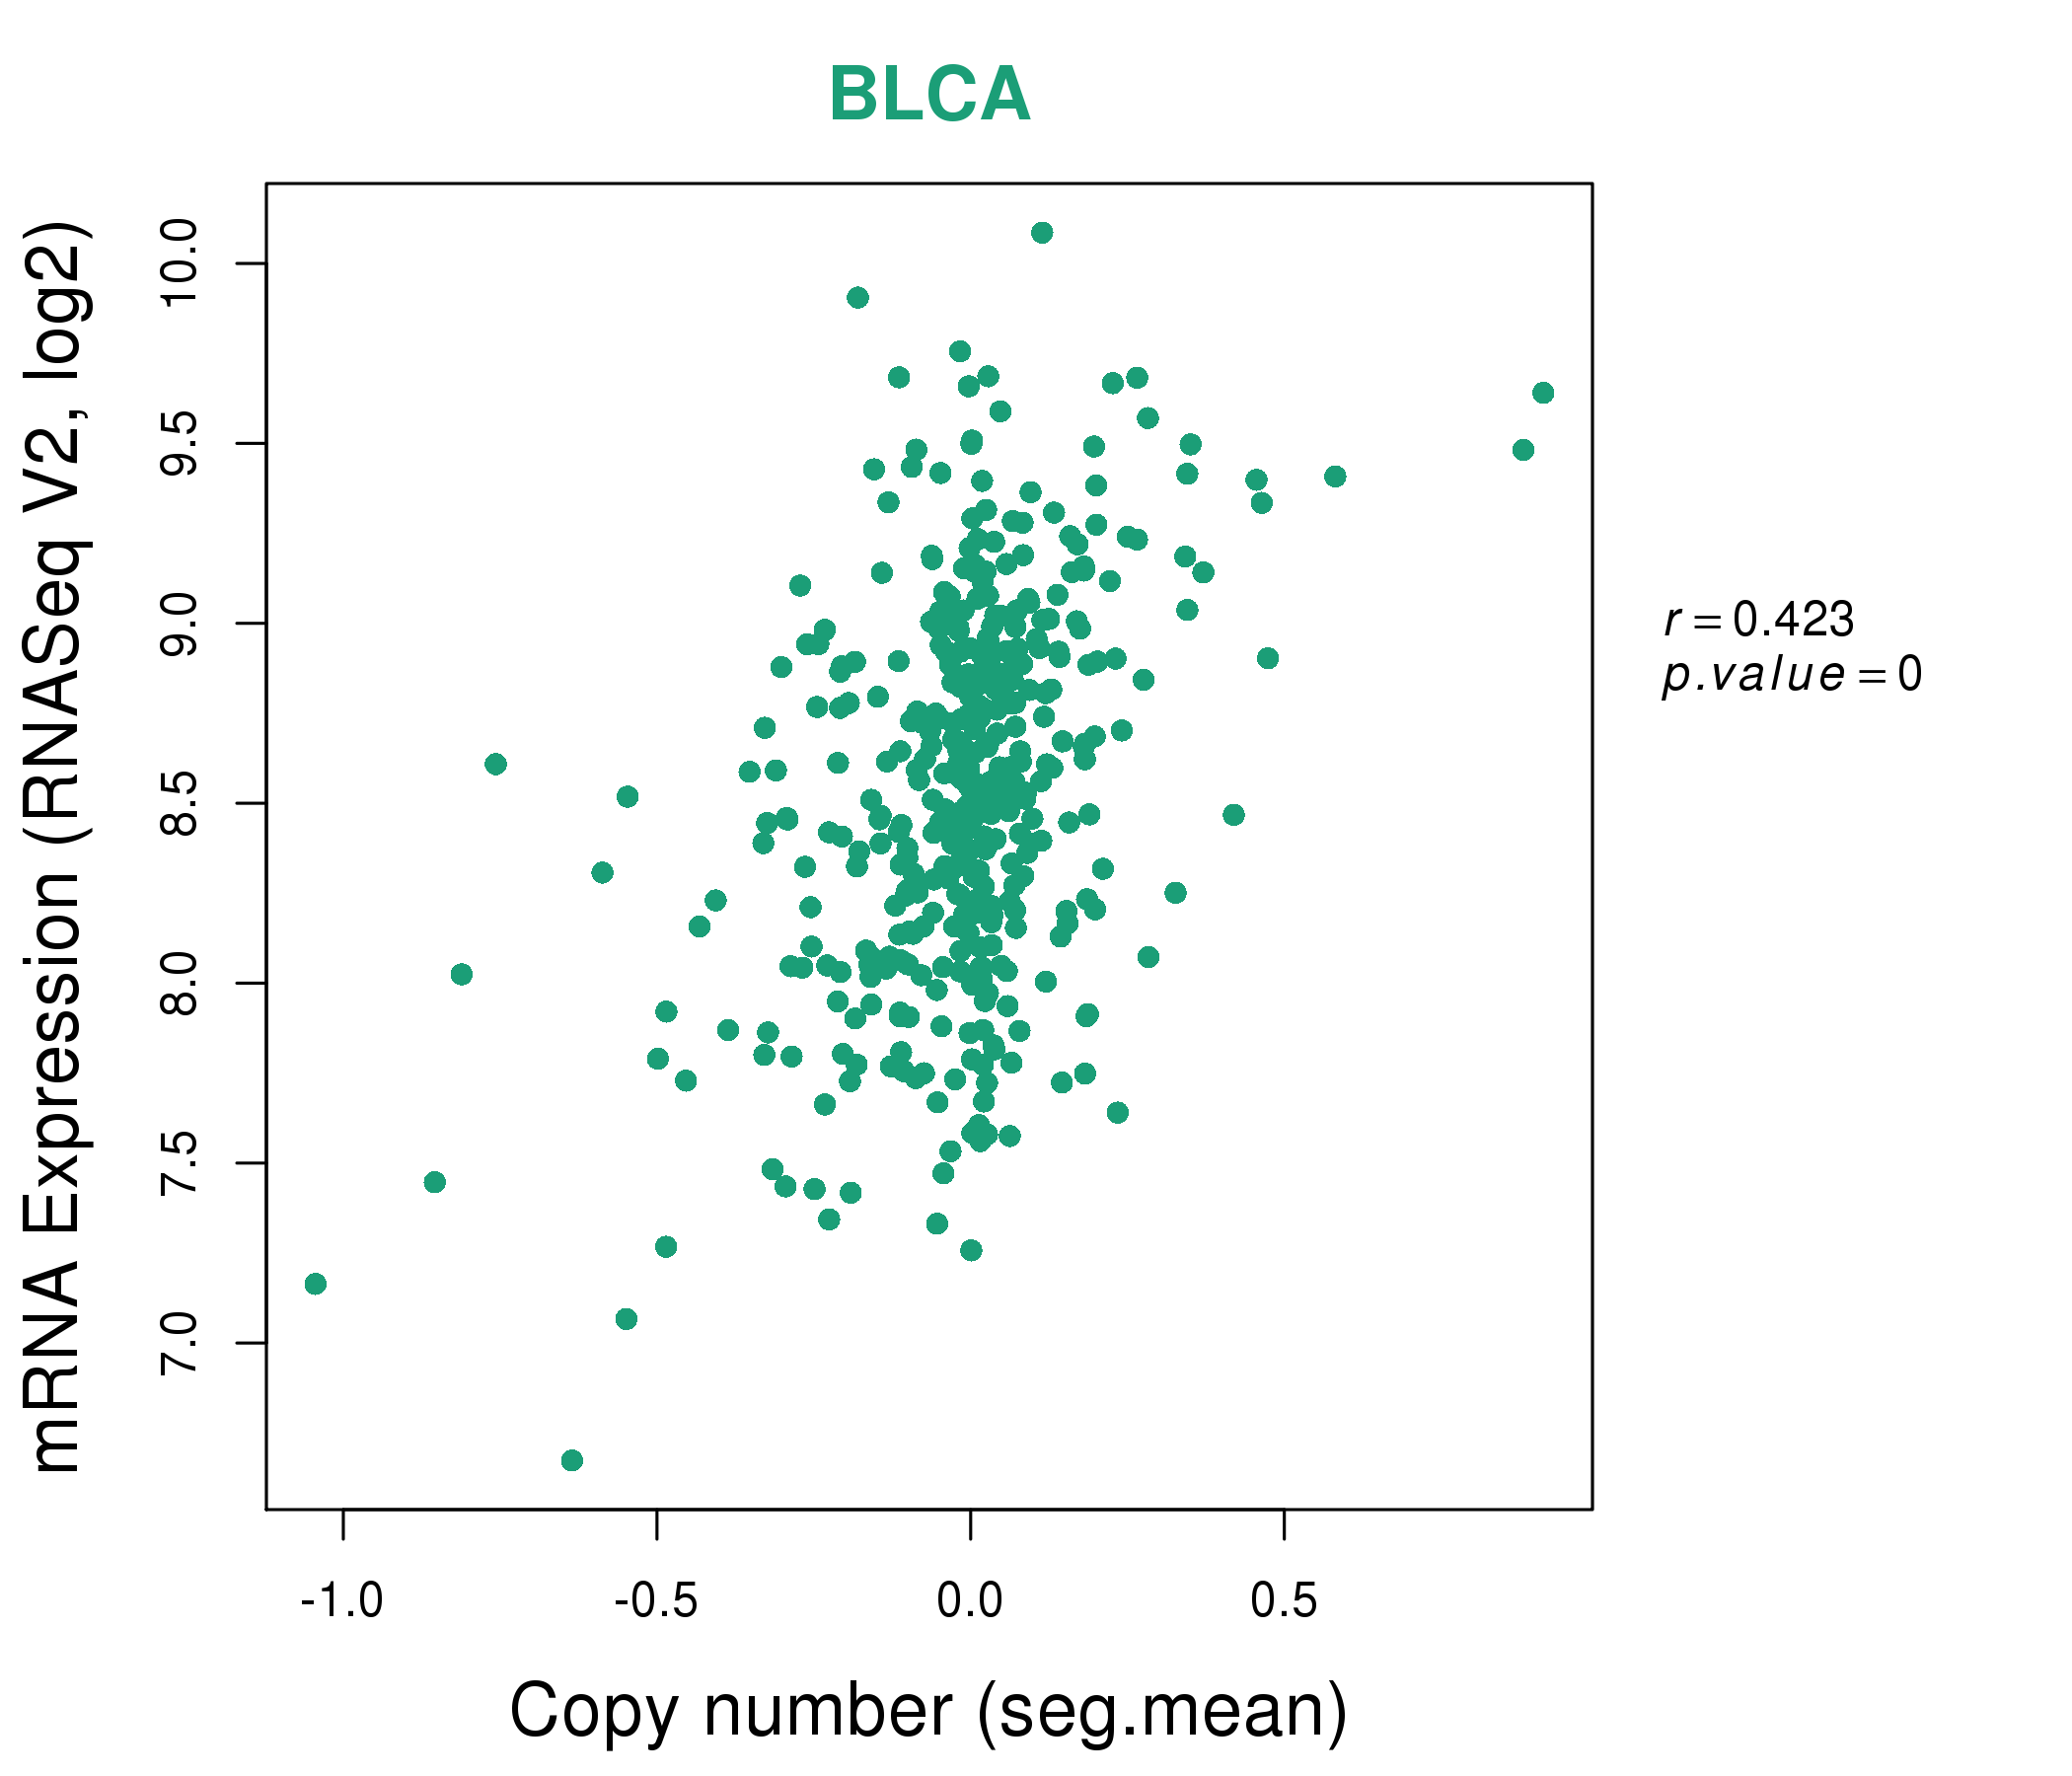
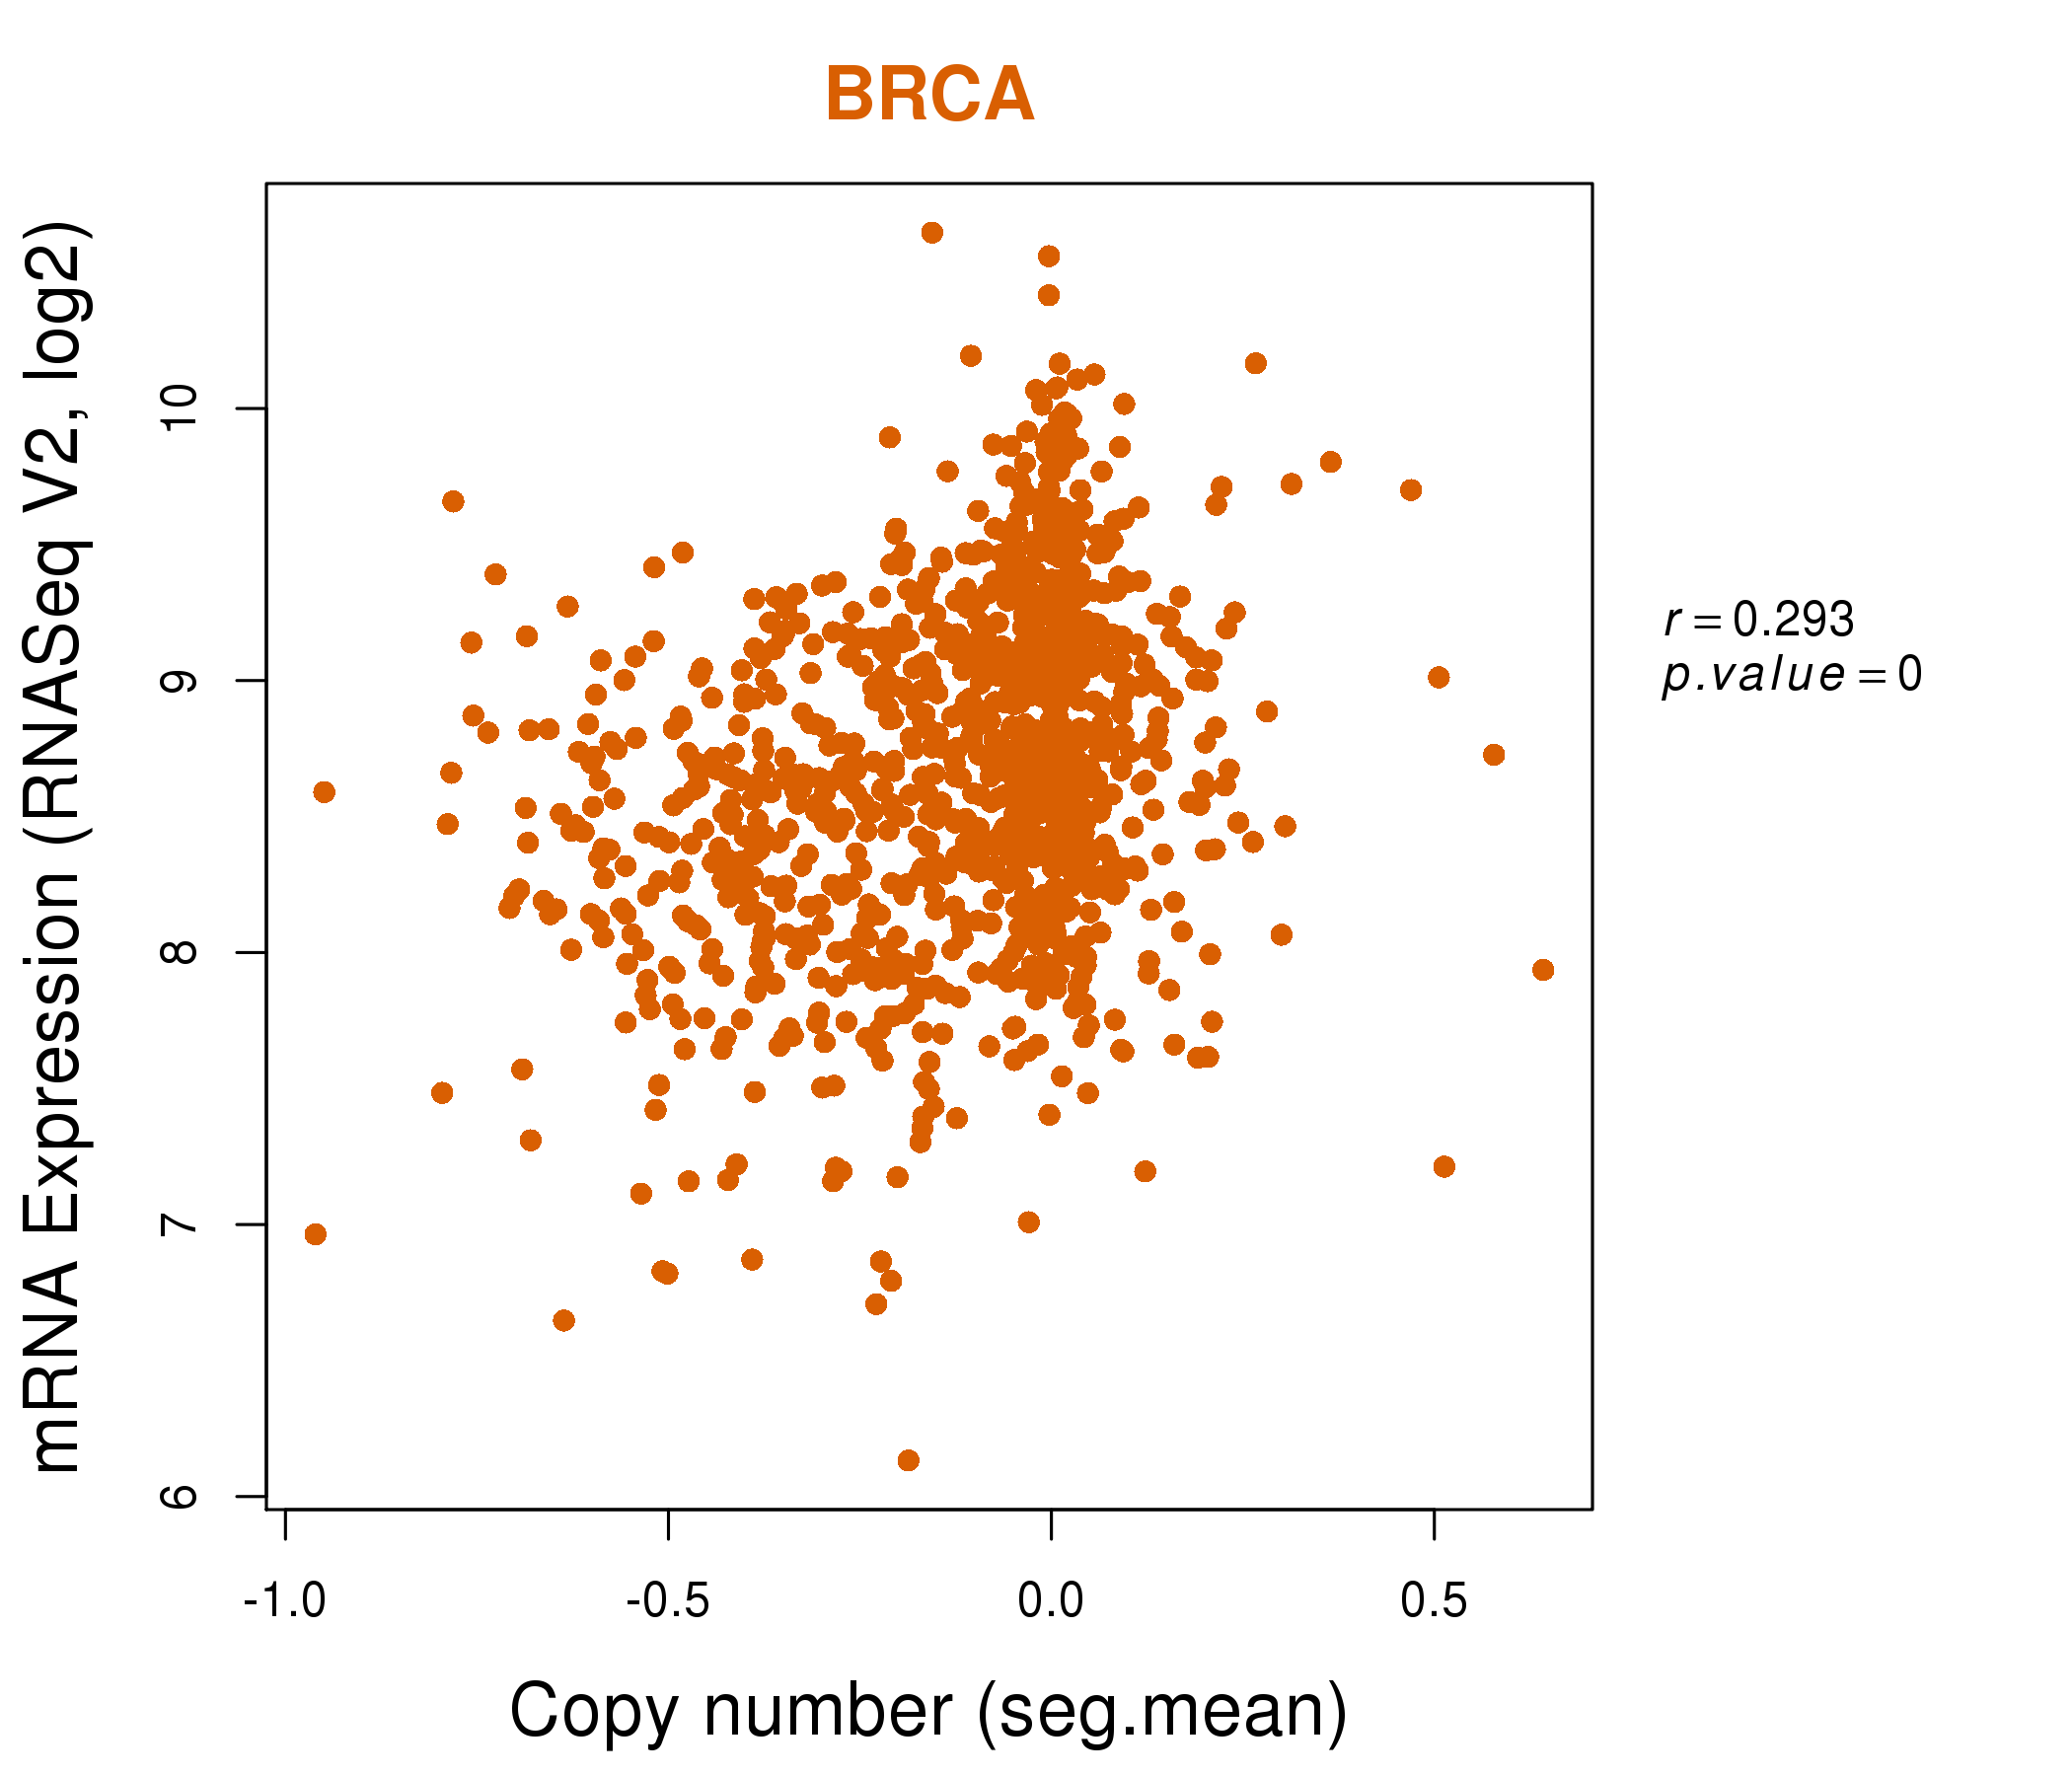
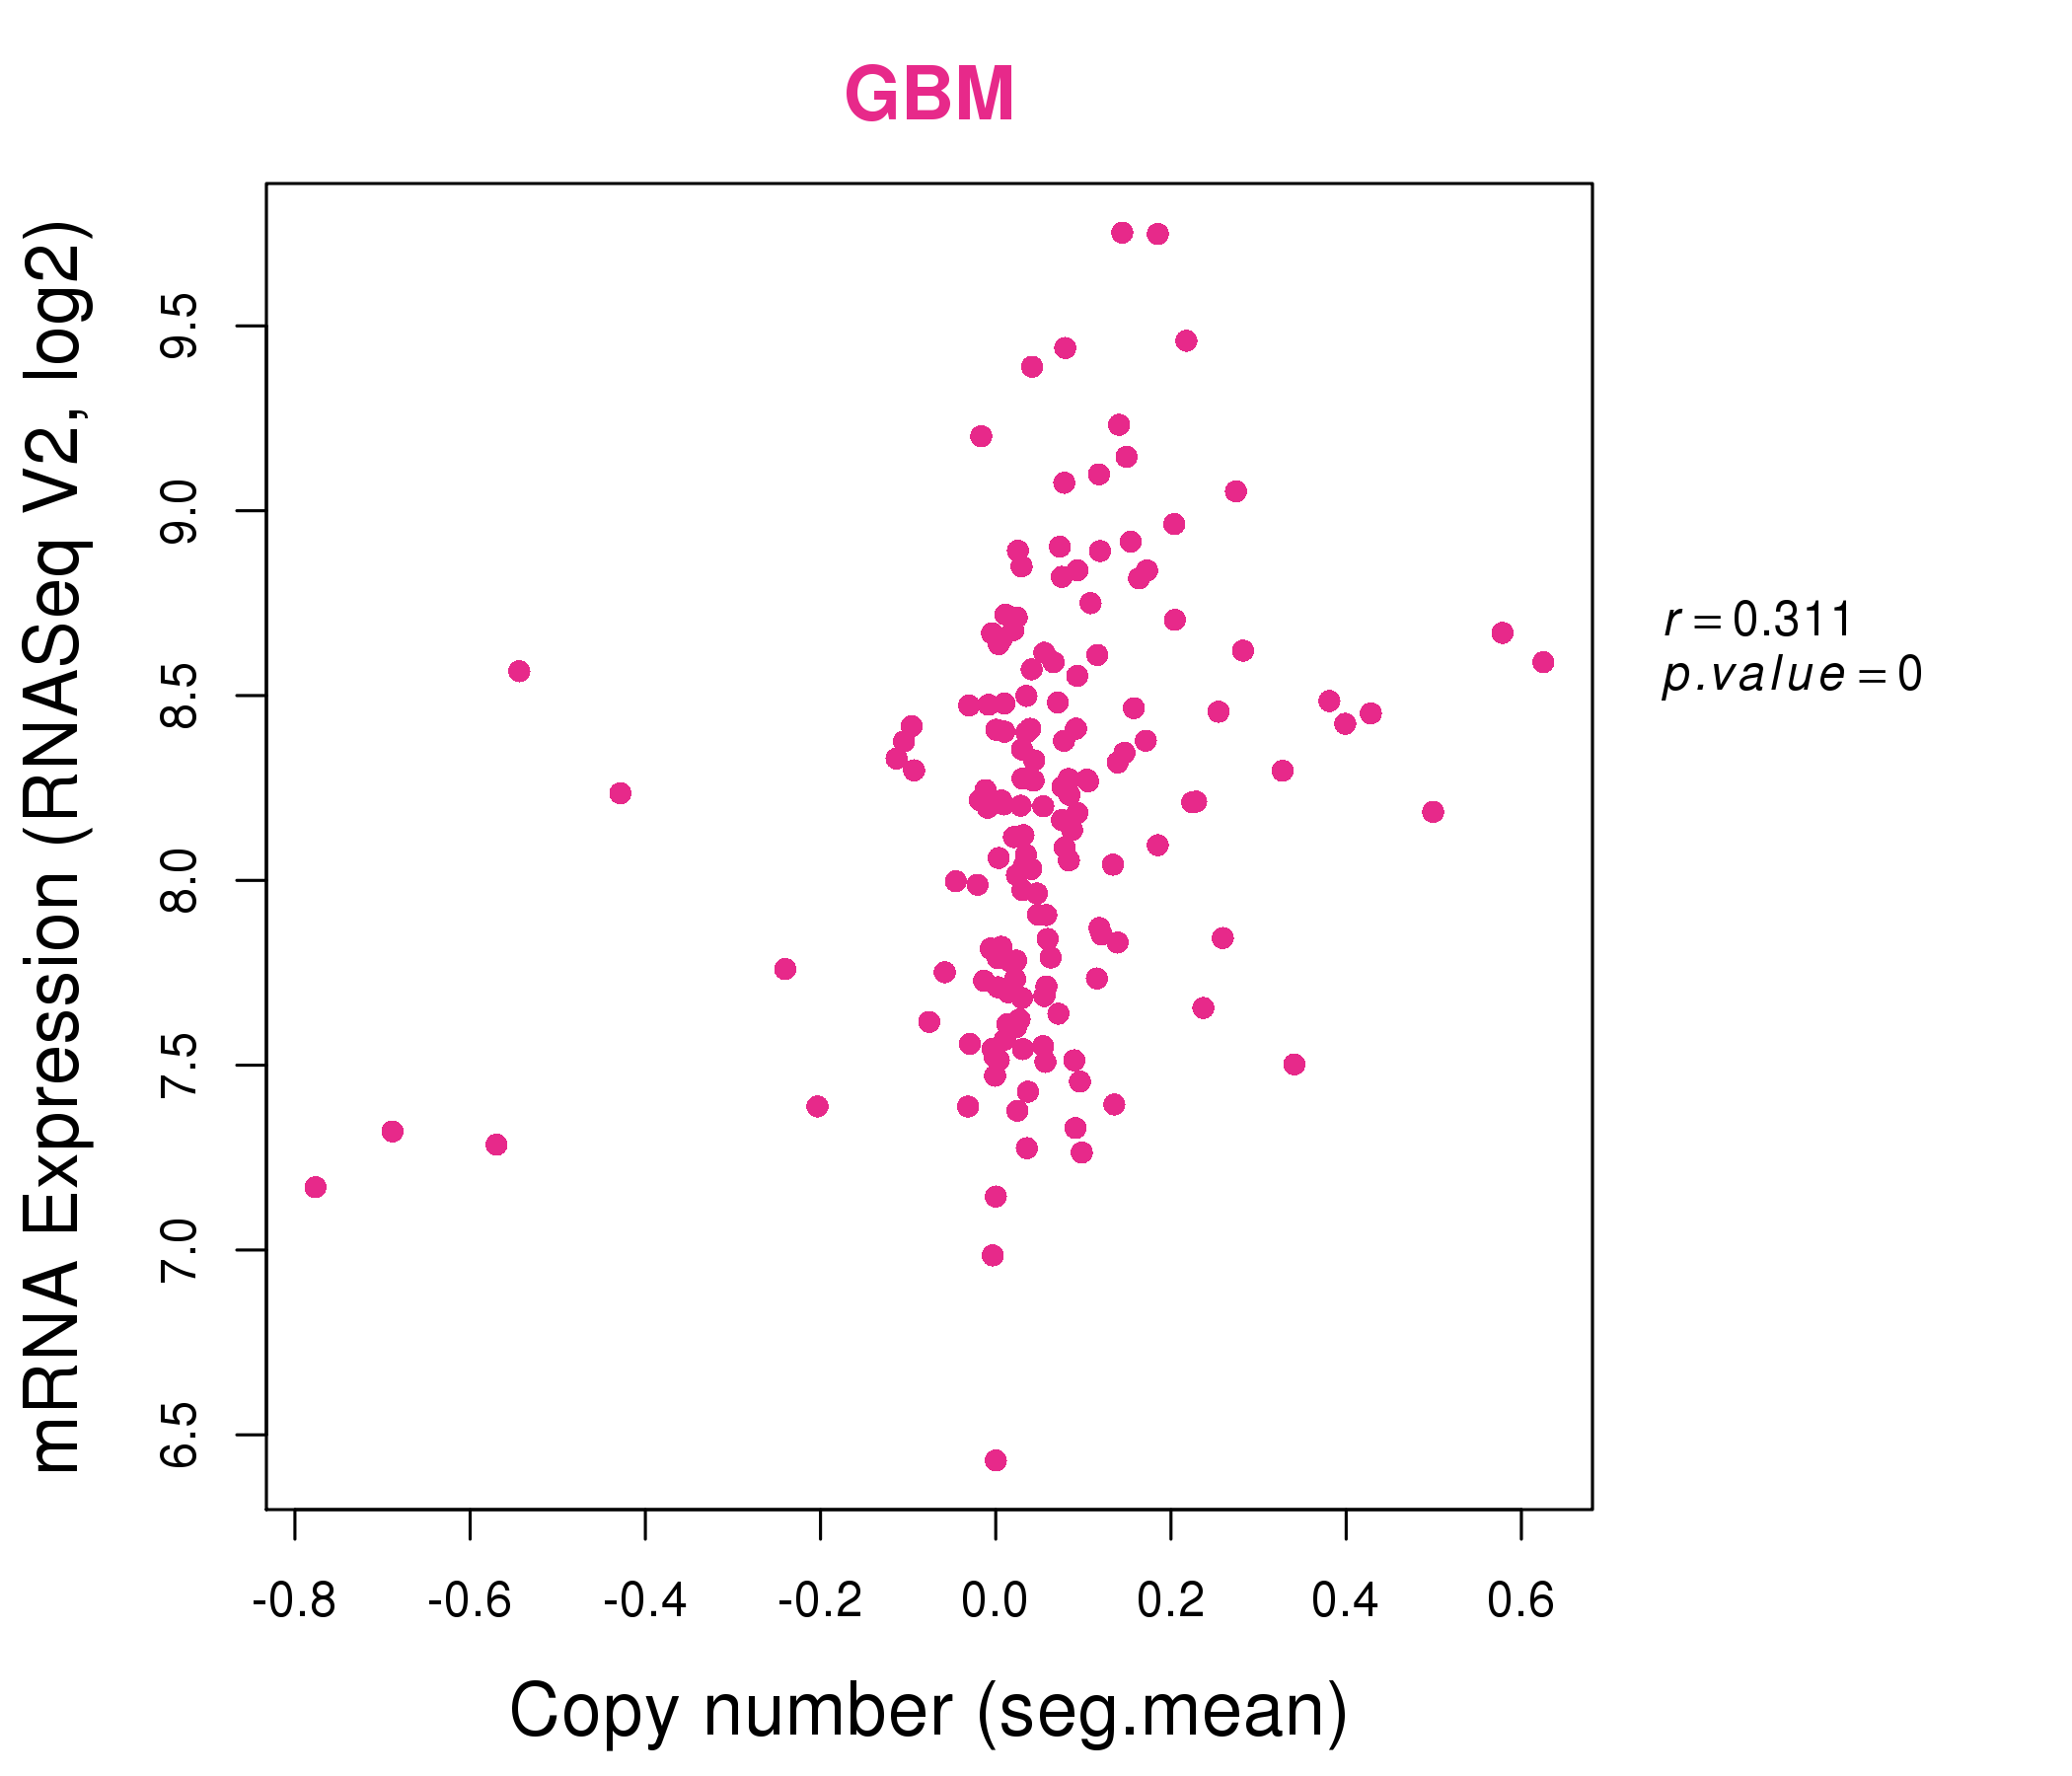
| * This plots show the correlation between CNV and gene expression. |
: Open all plots for all cancer types
 |
|
 |
|
| Top |
| Gene-Gene Network Information |
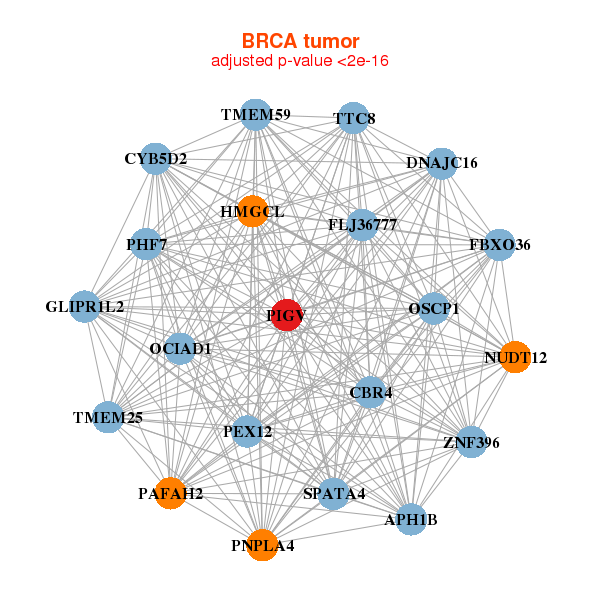
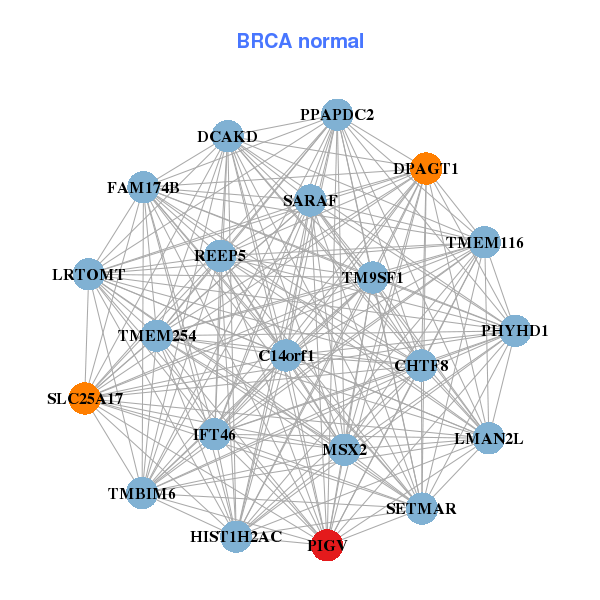
| * Co-Expression network figures were drawn using R package igraph. Only the top 20 genes with the highest correlations were shown. Red circle: input gene, orange circle: cell metabolism gene, sky circle: other gene |
: Open all plots for all cancer types
 |
|
| APH1B,CBR4,CYB5D2,DNAJC16,FBXO36,FLJ36777,GLIPR1L2, HMGCL,NUDT12,OCIAD1,OSCP1,PAFAH2,PEX12,PHF7, PIGV,PNPLA4,SPATA4,TMEM25,TMEM59,TTC8,ZNF396 | TMEM254,C14orf1,CHTF8,DCAKD,DPAGT1,FAM174B,HIST1H2AC, IFT46,LMAN2L,LRTOMT,MSX2,PHYHD1,PIGV,PPAPDC2, REEP5,SETMAR,SLC25A17,TM9SF1,TMBIM6,TMEM116,SARAF |
 |
|
| PPP1R36,C16orf58,KDF1,ATP1A1-AS1,EIF4EBP3,MTFR1L,FLJ39582, GALE,GPN2,HMGCL,LOC100130581,PAFAH2,PIGV,SMPDL3B, SUMF1,TAF12,TMEM42,TMEM50A,TMEM60,TRAPPC6A,ZCWPW1 | AKR7A2,RBBP8NL,NOA1,COX15,DALRD3,ERGIC3,FRAT2, GOLPH3L,HMGCL,IGBP1,IMPA2,MRPS18B,NUDT16P1,PARS2, PGAP2,PIGV,QARS,RAB25,ZBED9,SIRT5,ZNF524 |
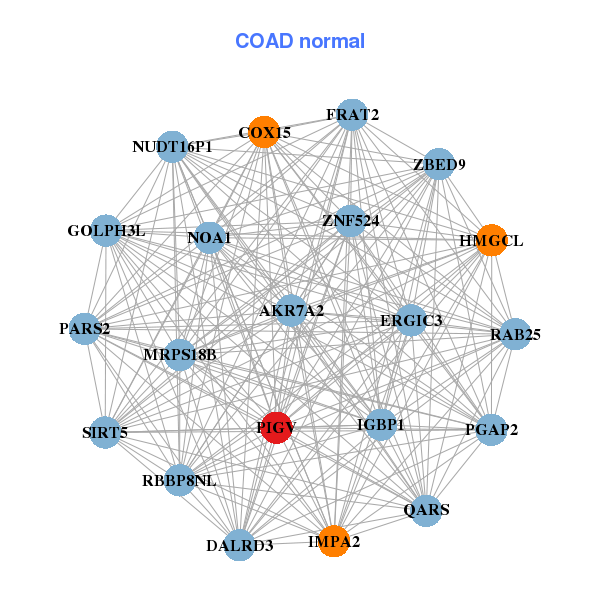
| * Co-Expression network figures were drawn using R package igraph. Only the top 20 genes with the highest correlations were shown. Red circle: input gene, orange circle: cell metabolism gene, sky circle: other gene |
: Open all plots for all cancer types
| Top |
: Open all interacting genes' information including KEGG pathway for all interacting genes from DAVID
| Top |
| Pharmacological Information for PIGV |
| There's no related Drug. |
| Top |
| Cross referenced IDs for PIGV |
| * We obtained these cross-references from Uniprot database. It covers 150 different DBs, 18 categories. http://www.uniprot.org/help/cross_references_section |
: Open all cross reference information
|
Copyright © 2016-Present - The Univsersity of Texas Health Science Center at Houston @ |