|
||||||||||||||||||||||||||||||||||||||||||||||||||||||||||||||||||||||||||||||||||||||||||||||||||||||||||||||||||||||||||||||||||||||||||||||||||||||||||||||||||||||||||||||||||||||||||||||||||||||||||||||||||||||||||||||||||||||||||||||||||||||||||||||||||||||||||||||||||||||||||||||||||||||||||||||||||||||||||
| |
| Phenotypic Information (metabolism pathway, cancer, disease, phenome) |
| |
| |
| Gene-Gene Network Information: Co-Expression Network, Interacting Genes & KEGG |
| |
|


| Gene Summary for NUP133 |
| Top |
| Phenotypic Information for NUP133(metabolism pathway, cancer, disease, phenome) |
| Cancer | CGAP: NUP133 |
| Familial Cancer Database: NUP133 | |
| * This gene is included in those cancer gene databases. |
|
|
|
|
|
| . | ||||||||||||||||||||||||||||||||||||||||||||||||||||||||||||||||||||||||||||||||||||||||||||||||||||||||||||||||||||||||||||||||||||||||||||||||||||||||||||||||||||||||||||||||||||||||||||||||||||||||||||||||||||||||||||||||||||||||||||||||||||||||||||||||||||||||||||||||||||||||||||||||||||||||||||||||||||
Oncogene 1 | Significant driver gene in | |||||||||||||||||||||||||||||||||||||||||||||||||||||||||||||||||||||||||||||||||||||||||||||||||||||||||||||||||||||||||||||||||||||||||||||||||||||||||||||||||||||||||||||||||||||||||||||||||||||||||||||||||||||||||||||||||||||||||||||||||||||||||||||||||||||||||||||||||||||||||||||||||||||||||||||||||||||||||
| cf) number; DB name 1 Oncogene; http://nar.oxfordjournals.org/content/35/suppl_1/D721.long, 2 Tumor Suppressor gene; https://bioinfo.uth.edu/TSGene/, 3 Cancer Gene Census; http://www.nature.com/nrc/journal/v4/n3/abs/nrc1299.html, 4 CancerGenes; http://nar.oxfordjournals.org/content/35/suppl_1/D721.long, 5 Network of Cancer Gene; http://ncg.kcl.ac.uk/index.php, 1Therapeutic Vulnerabilities in Cancer; http://cbio.mskcc.org/cancergenomics/statius/ |
| REACTOME_METABOLISM_OF_NON_CODING_RNA REACTOME_METABOLISM_OF_RNA REACTOME_METABOLISM_OF_CARBOHYDRATES | |
| OMIM | 607613; gene. |
| Orphanet | |
| Disease | KEGG Disease: NUP133 |
| MedGen: NUP133 (Human Medical Genetics with Condition) | |
| ClinVar: NUP133 | |
| Phenotype | MGI: NUP133 (International Mouse Phenotyping Consortium) |
| PhenomicDB: NUP133 | |
| Mutations for NUP133 |
| * Under tables are showing count per each tissue to give us broad intuition about tissue specific mutation patterns.You can go to the detailed page for each mutation database's web site. |
| There's no structural variation information in COSMIC data for this gene. |
| * From mRNA Sanger sequences, Chitars2.0 arranged chimeric transcripts. This table shows NUP133 related fusion information. |
| ID | Head Gene | Tail Gene | Accession | Gene_a | qStart_a | qEnd_a | Chromosome_a | tStart_a | tEnd_a | Gene_a | qStart_a | qEnd_a | Chromosome_a | tStart_a | tEnd_a |
| DA418651 | MUSK | 1 | 123 | 9 | 113530241 | 113530363 | NUP133 | 122 | 616 | 1 | 229623244 | 229631796 | |
| AA326630 | SYT1 | 1 | 218 | 12 | 79470195 | 79470412 | NUP133 | 211 | 358 | 1 | 229611451 | 229611596 | |
| AW895718 | NUP133 | 304 | 405 | 1 | 229592841 | 229593017 | FAF1 | 399 | 421 | 1 | 51407501 | 51407526 | |
| Top |
| Mutation type/ Tissue ID | brca | cns | cerv | endome | haematopo | kidn | Lintest | liver | lung | ns | ovary | pancre | prost | skin | stoma | thyro | urina | |||
| Total # sample | 1 | 2 | 1 | |||||||||||||||||
| GAIN (# sample) | 1 | 2 | 1 | |||||||||||||||||
| LOSS (# sample) |
| cf) Tissue ID; Tissue type (1; Breast, 2; Central_nervous_system, 3; Cervix, 4; Endometrium, 5; Haematopoietic_and_lymphoid_tissue, 6; Kidney, 7; Large_intestine, 8; Liver, 9; Lung, 10; NS, 11; Ovary, 12; Pancreas, 13; Prostate, 14; Skin, 15; Stomach, 16; Thyroid, 17; Urinary_tract) |
| Top |
|
 |
| Top |
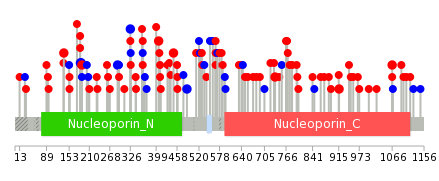
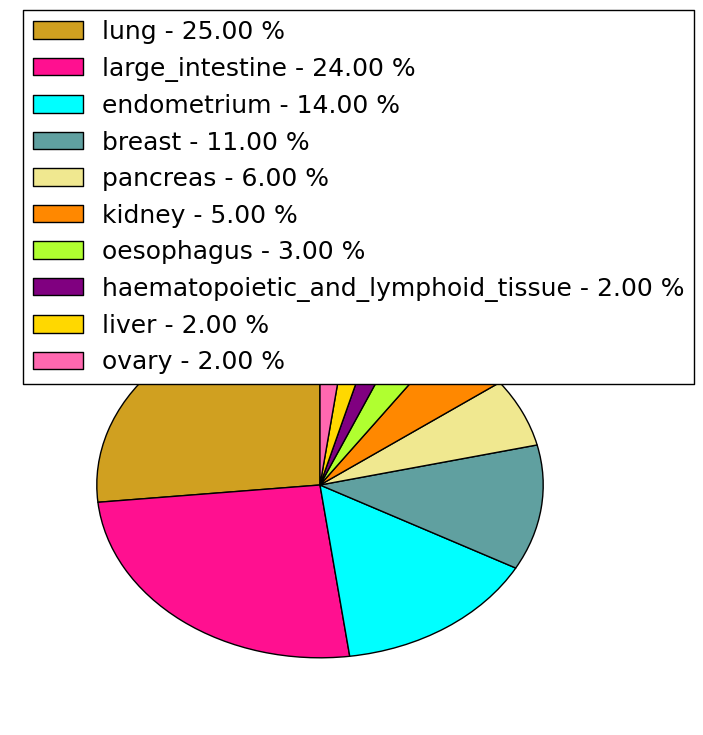
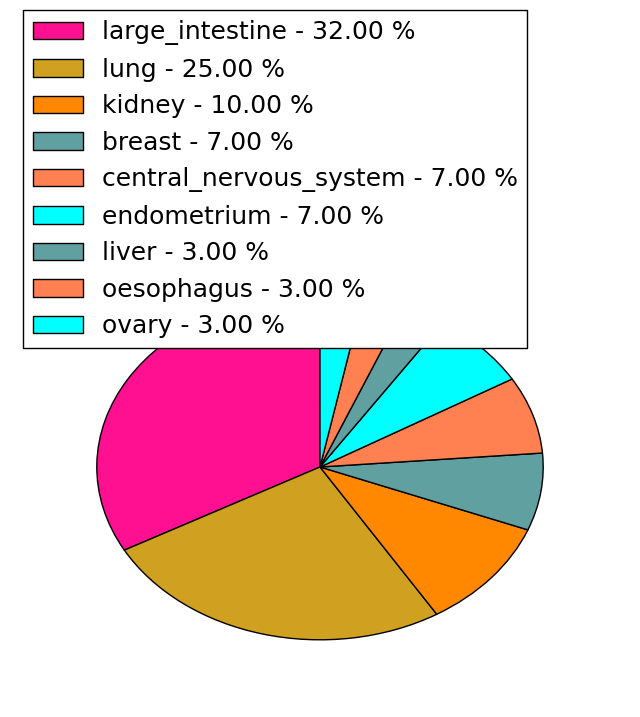
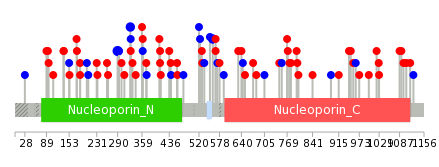
| Stat. for Non-Synonymous SNVs (# total SNVs=77) | (# total SNVs=28) |
 |  |
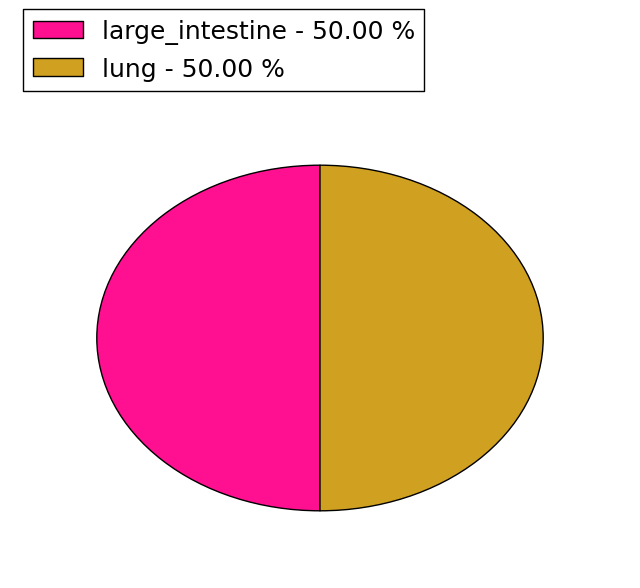
(# total SNVs=2) | (# total SNVs=0) |
 |
| Top |
| * When you move the cursor on each content, you can see more deailed mutation information on the Tooltip. Those are primary_site,primary_histology,mutation(aa),pubmedID. |
| GRCh37 position | Mutation(aa) | Unique sampleID count |
| chr1:229635512-229635512 | p.S189R | 3 |
| chr1:229635521-229635521 | p.Y186Y | 3 |
| chr1:229623211-229623211 | p.? | 3 |
| chr1:229631310-229631310 | p.G326G | 2 |
| chr1:229613400-229613400 | p.D567G | 2 |
| chr1:229622162-229622162 | p.L486L | 2 |
| chr1:229599292-229599292 | p.Q895* | 2 |
| chr1:229601261-229601261 | p.M735I | 2 |
| chr1:229636604-229636604 | p.V138I | 2 |
| chr1:229631744-229631744 | p.T290T | 2 |
| Top |
|
 |
| Point Mutation/ Tissue ID | 1 | 2 | 3 | 4 | 5 | 6 | 7 | 8 | 9 | 10 | 11 | 12 | 13 | 14 | 15 | 16 | 17 | 18 | 19 | 20 |
| # sample | 3 | 19 | 2 | 2 | 4 | 1 | 14 | 9 | 3 | 1 | 1 | 6 | 7 | 1 | 11 | |||||
| # mutation | 3 | 18 | 2 | 2 | 4 | 1 | 16 | 9 | 3 | 1 | 1 | 7 | 9 | 1 | 12 | |||||
| nonsynonymous SNV | 2 | 13 | 2 | 2 | 11 | 7 | 2 | 1 | 1 | 6 | 5 | 1 | 10 | |||||||
| synonymous SNV | 1 | 5 | 2 | 2 | 1 | 5 | 2 | 1 | 1 | 4 | 2 |
| cf) Tissue ID; Tissue type (1; BLCA[Bladder Urothelial Carcinoma], 2; BRCA[Breast invasive carcinoma], 3; CESC[Cervical squamous cell carcinoma and endocervical adenocarcinoma], 4; COAD[Colon adenocarcinoma], 5; GBM[Glioblastoma multiforme], 6; Glioma Low Grade, 7; HNSC[Head and Neck squamous cell carcinoma], 8; KICH[Kidney Chromophobe], 9; KIRC[Kidney renal clear cell carcinoma], 10; KIRP[Kidney renal papillary cell carcinoma], 11; LAML[Acute Myeloid Leukemia], 12; LUAD[Lung adenocarcinoma], 13; LUSC[Lung squamous cell carcinoma], 14; OV[Ovarian serous cystadenocarcinoma ], 15; PAAD[Pancreatic adenocarcinoma], 16; PRAD[Prostate adenocarcinoma], 17; SKCM[Skin Cutaneous Melanoma], 18:STAD[Stomach adenocarcinoma], 19:THCA[Thyroid carcinoma], 20:UCEC[Uterine Corpus Endometrial Carcinoma]) |
| Top |
| * We represented just top 10 SNVs. When you move the cursor on each content, you can see more deailed mutation information on the Tooltip. Those are primary_site, primary_histology, mutation(aa), pubmedID. |
| Genomic Position | Mutation(aa) | Unique sampleID count |
| chr1:229631744 | p.T290T | 3 |
| chr1:229613423 | p.R559R | 2 |
| chr1:229631310 | p.G326G | 2 |
| chr1:229580678 | p.S309C | 1 |
| chr1:229611466 | p.V138I | 1 |
| chr1:229631689 | p.Q1106P | 1 |
| chr1:229594042 | p.V801L | 1 |
| chr1:229619833 | p.F590F | 1 |
| chr1:229635528 | p.E440K | 1 |
| chr1:229600616 | p.D301Y | 1 |
| * Copy number data were extracted from TCGA using R package TCGA-Assembler. The URLs of all public data files on TCGA DCC data server were gathered on Jan-05-2015. Function ProcessCNAData in TCGA-Assembler package was used to obtain gene-level copy number value which is calculated as the average copy number of the genomic region of a gene. |
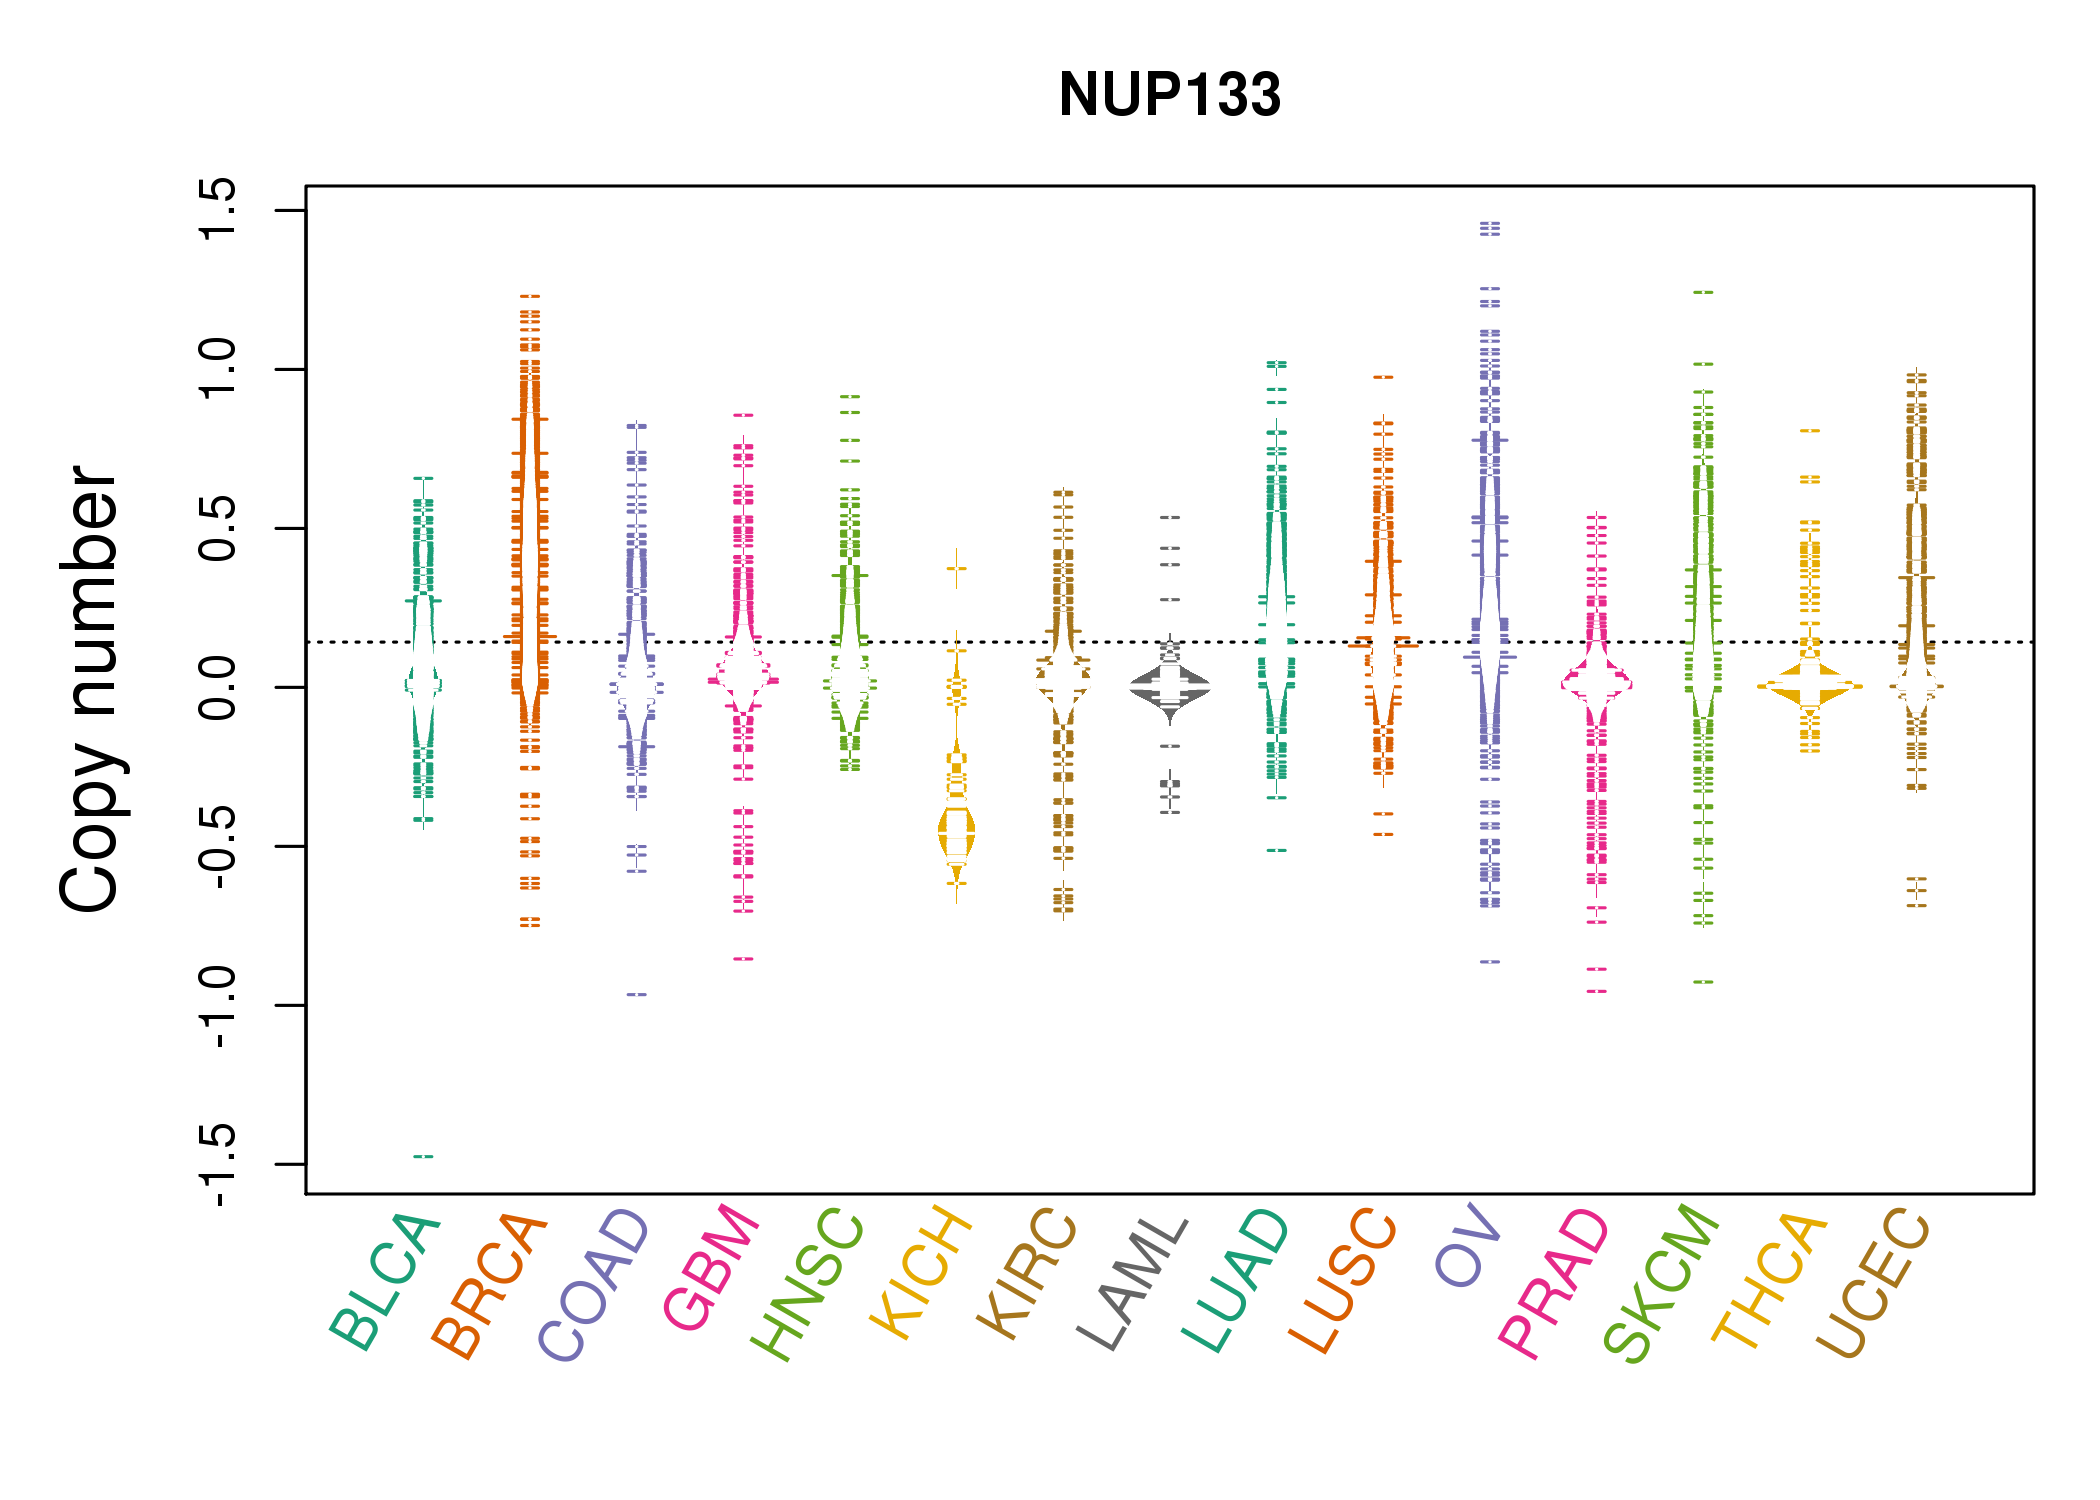 |
| cf) Tissue ID[Tissue type]: BLCA[Bladder Urothelial Carcinoma], BRCA[Breast invasive carcinoma], CESC[Cervical squamous cell carcinoma and endocervical adenocarcinoma], COAD[Colon adenocarcinoma], GBM[Glioblastoma multiforme], Glioma Low Grade, HNSC[Head and Neck squamous cell carcinoma], KICH[Kidney Chromophobe], KIRC[Kidney renal clear cell carcinoma], KIRP[Kidney renal papillary cell carcinoma], LAML[Acute Myeloid Leukemia], LUAD[Lung adenocarcinoma], LUSC[Lung squamous cell carcinoma], OV[Ovarian serous cystadenocarcinoma ], PAAD[Pancreatic adenocarcinoma], PRAD[Prostate adenocarcinoma], SKCM[Skin Cutaneous Melanoma], STAD[Stomach adenocarcinoma], THCA[Thyroid carcinoma], UCEC[Uterine Corpus Endometrial Carcinoma] |
| Top |
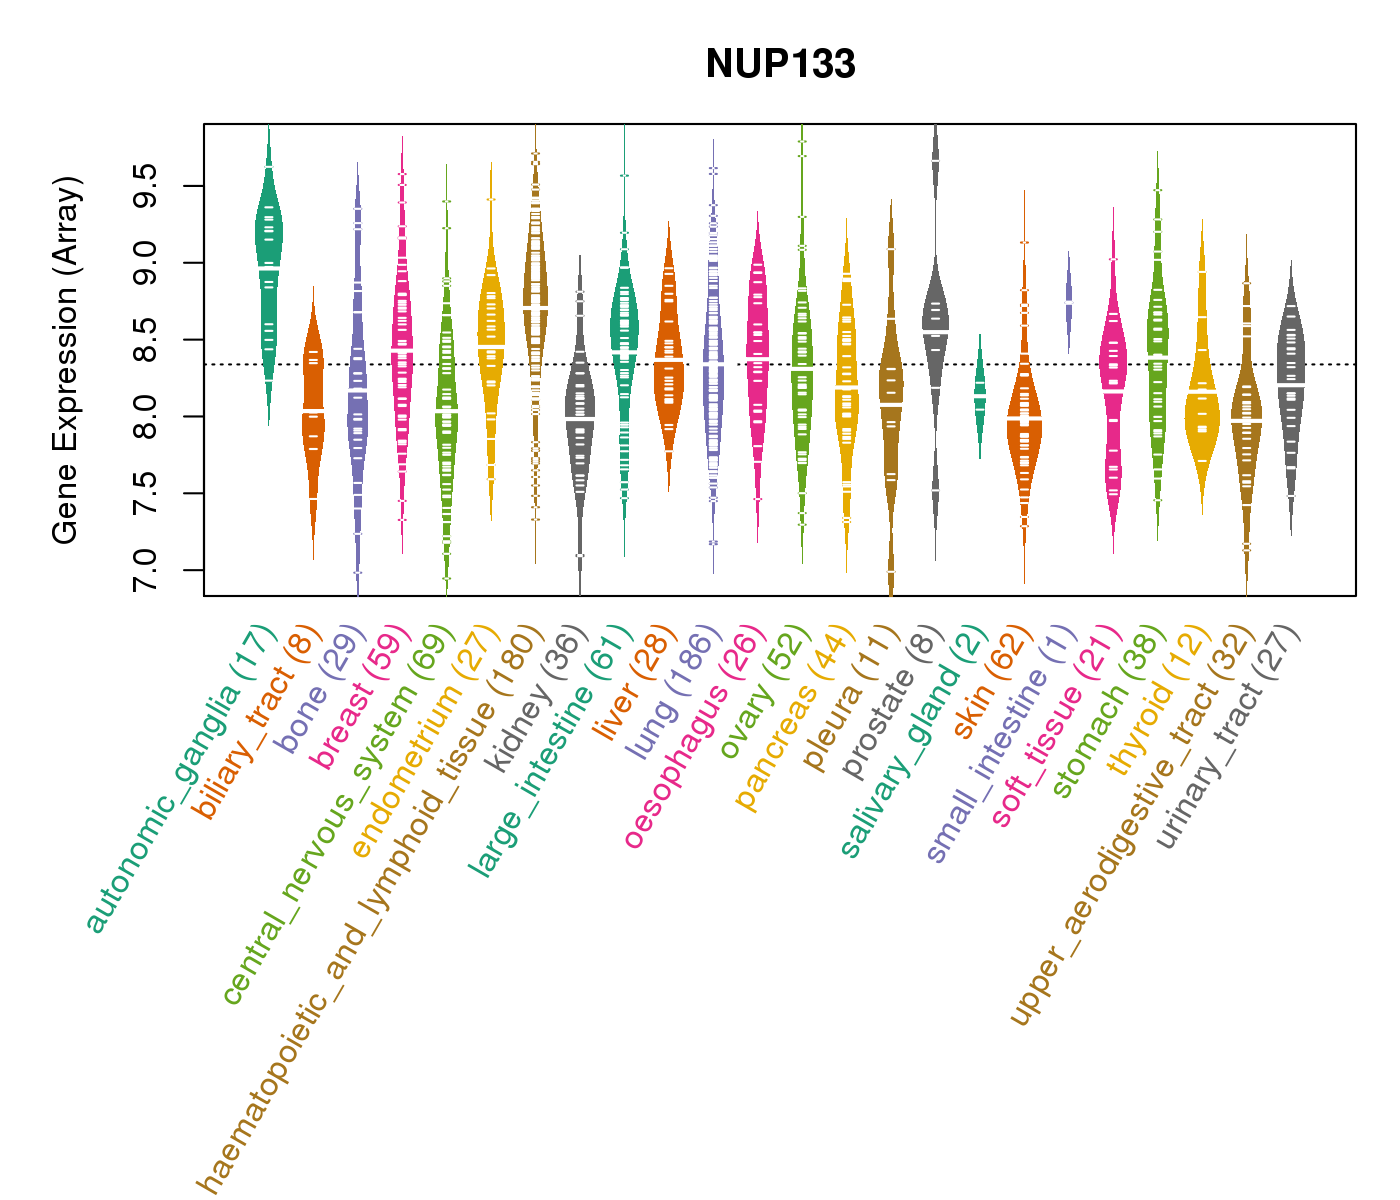
| Gene Expression for NUP133 |
| * CCLE gene expression data were extracted from CCLE_Expression_Entrez_2012-10-18.res: Gene-centric RMA-normalized mRNA expression data. |
 |
| * Normalized gene expression data of RNASeqV2 was extracted from TCGA using R package TCGA-Assembler. The URLs of all public data files on TCGA DCC data server were gathered at Jan-05-2015. Only eight cancer types have enough normal control samples for differential expression analysis. (t test, adjusted p<0.05 (using Benjamini-Hochberg FDR)) |
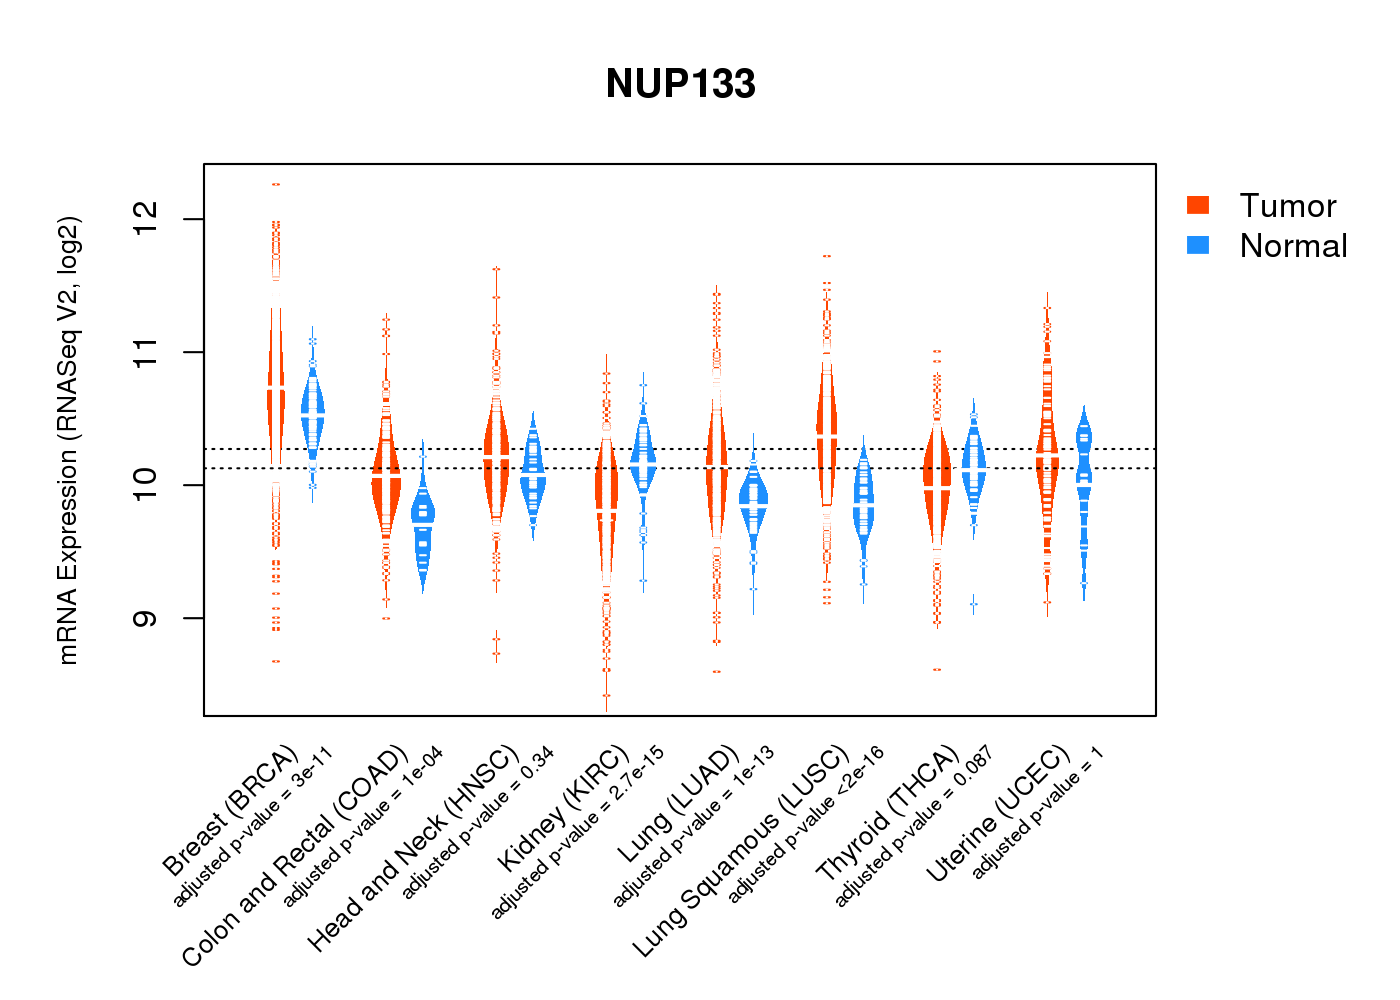 |
| Top |
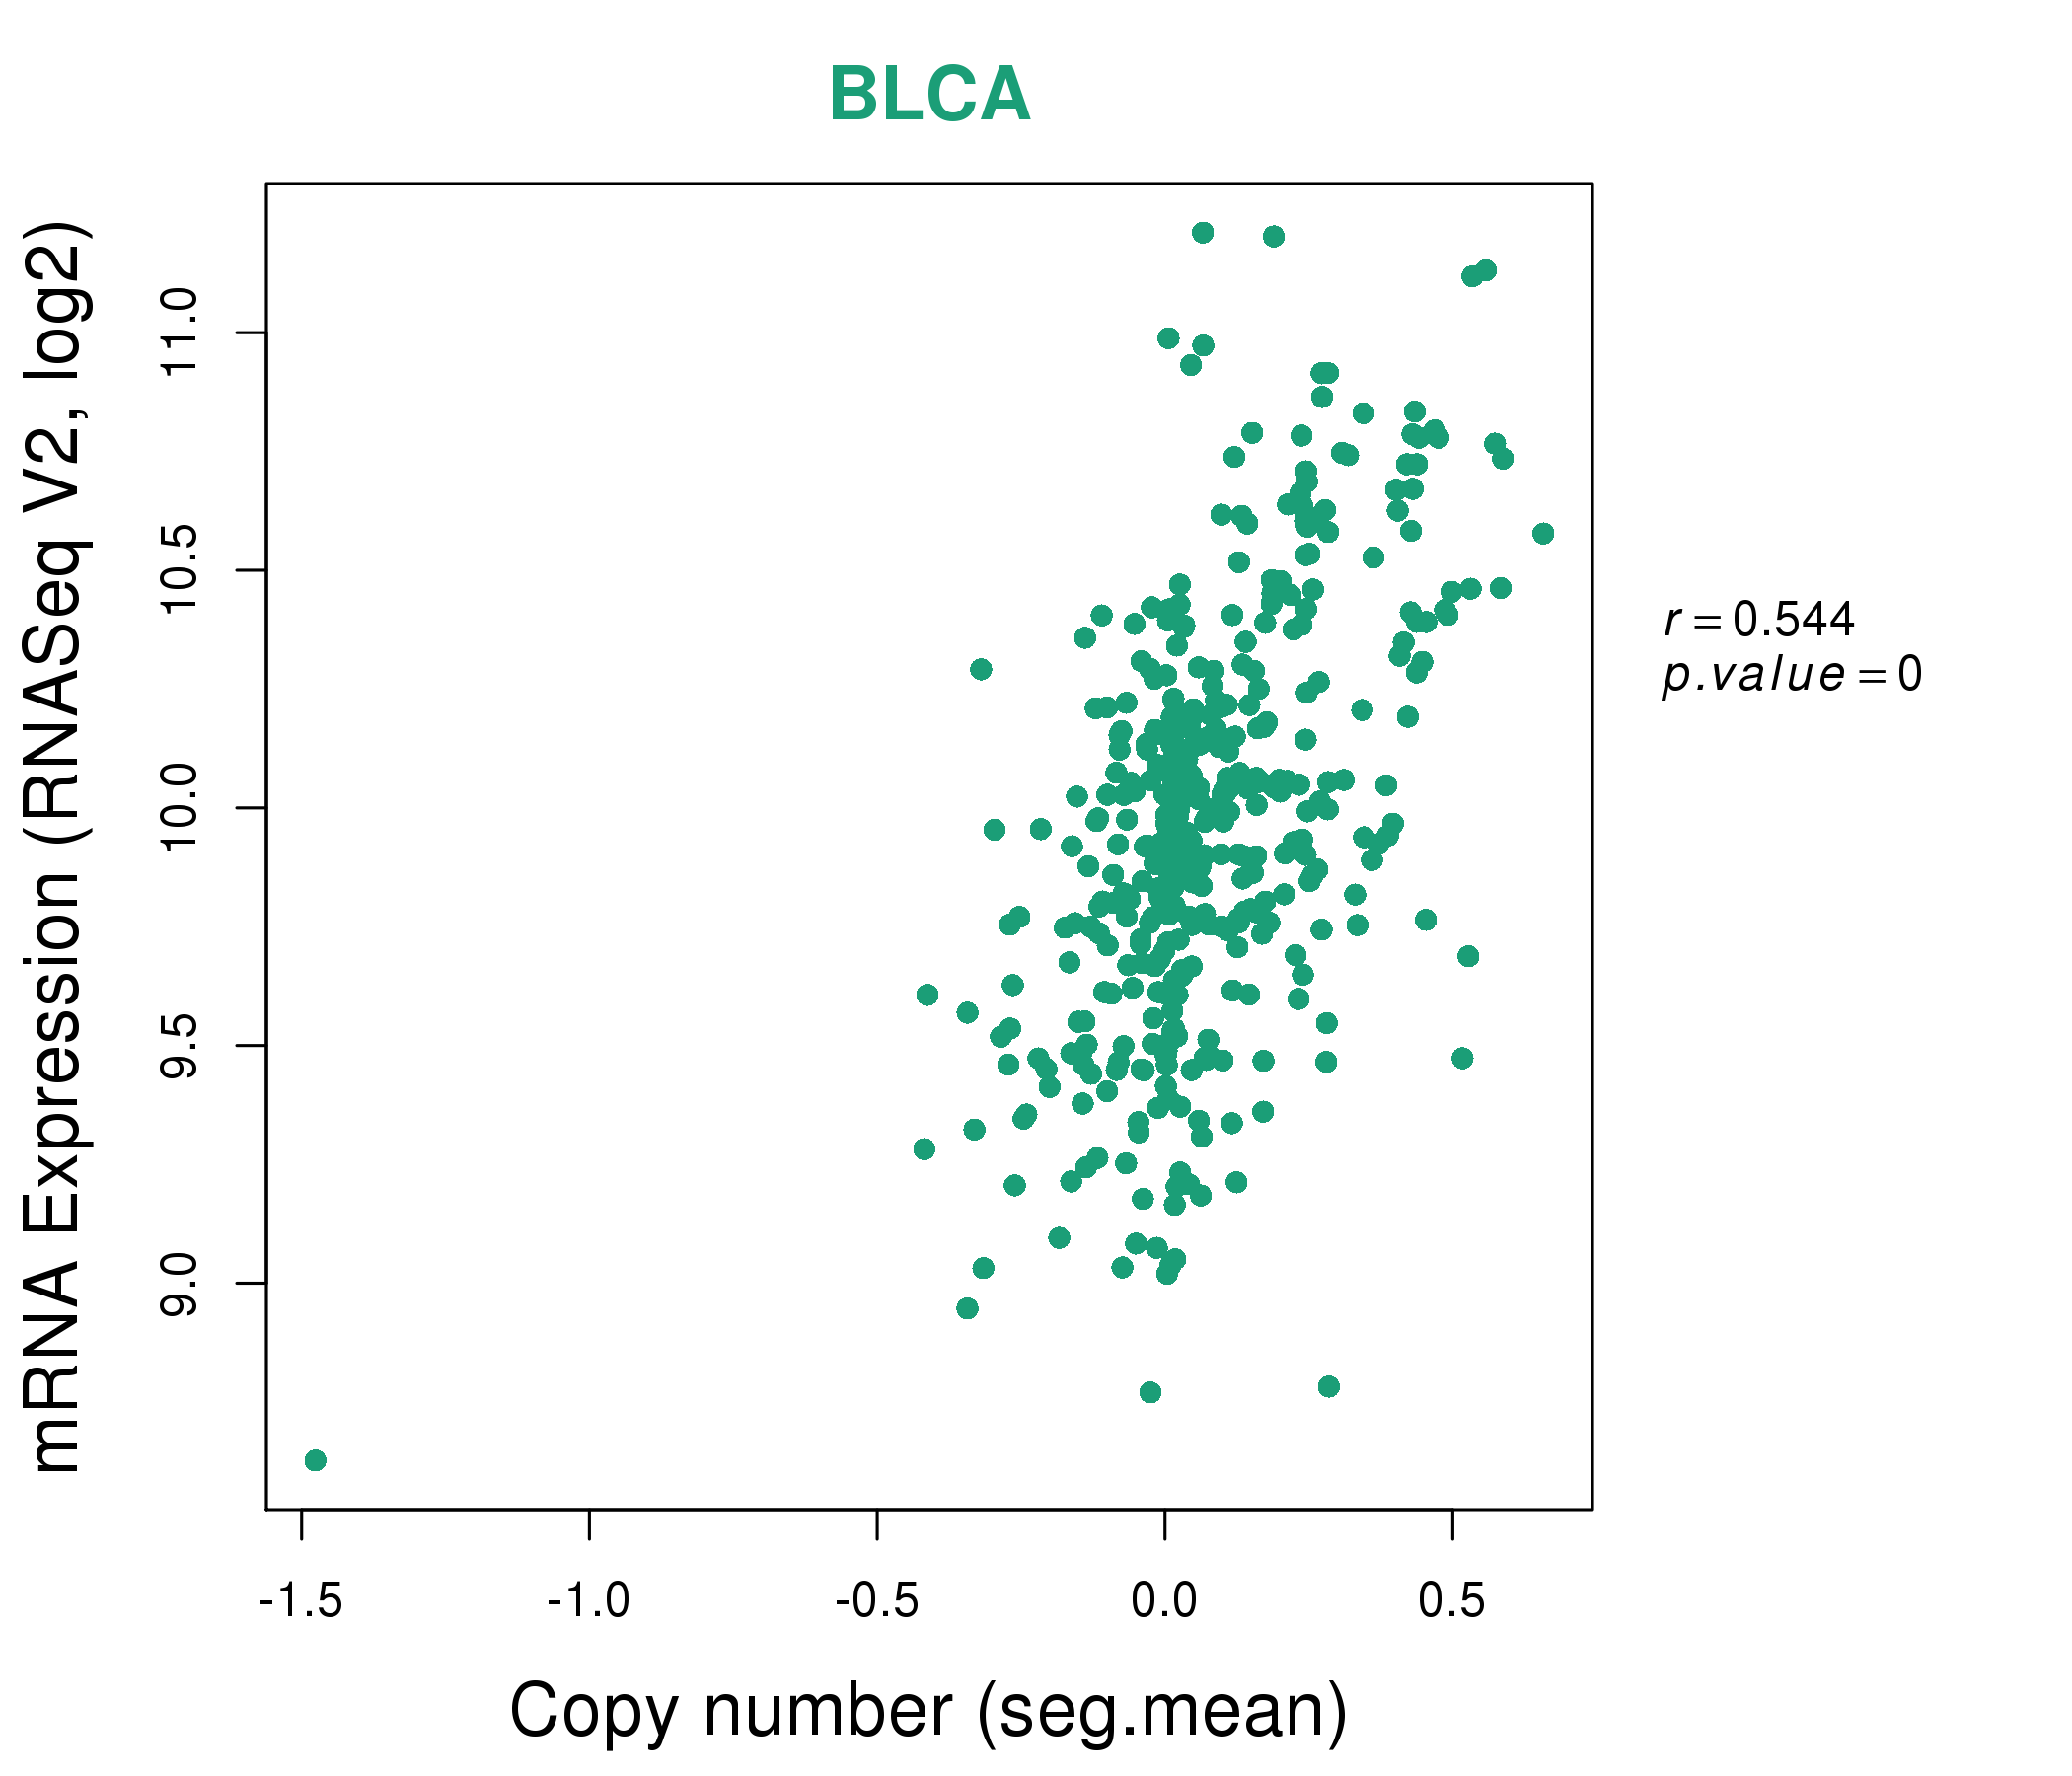
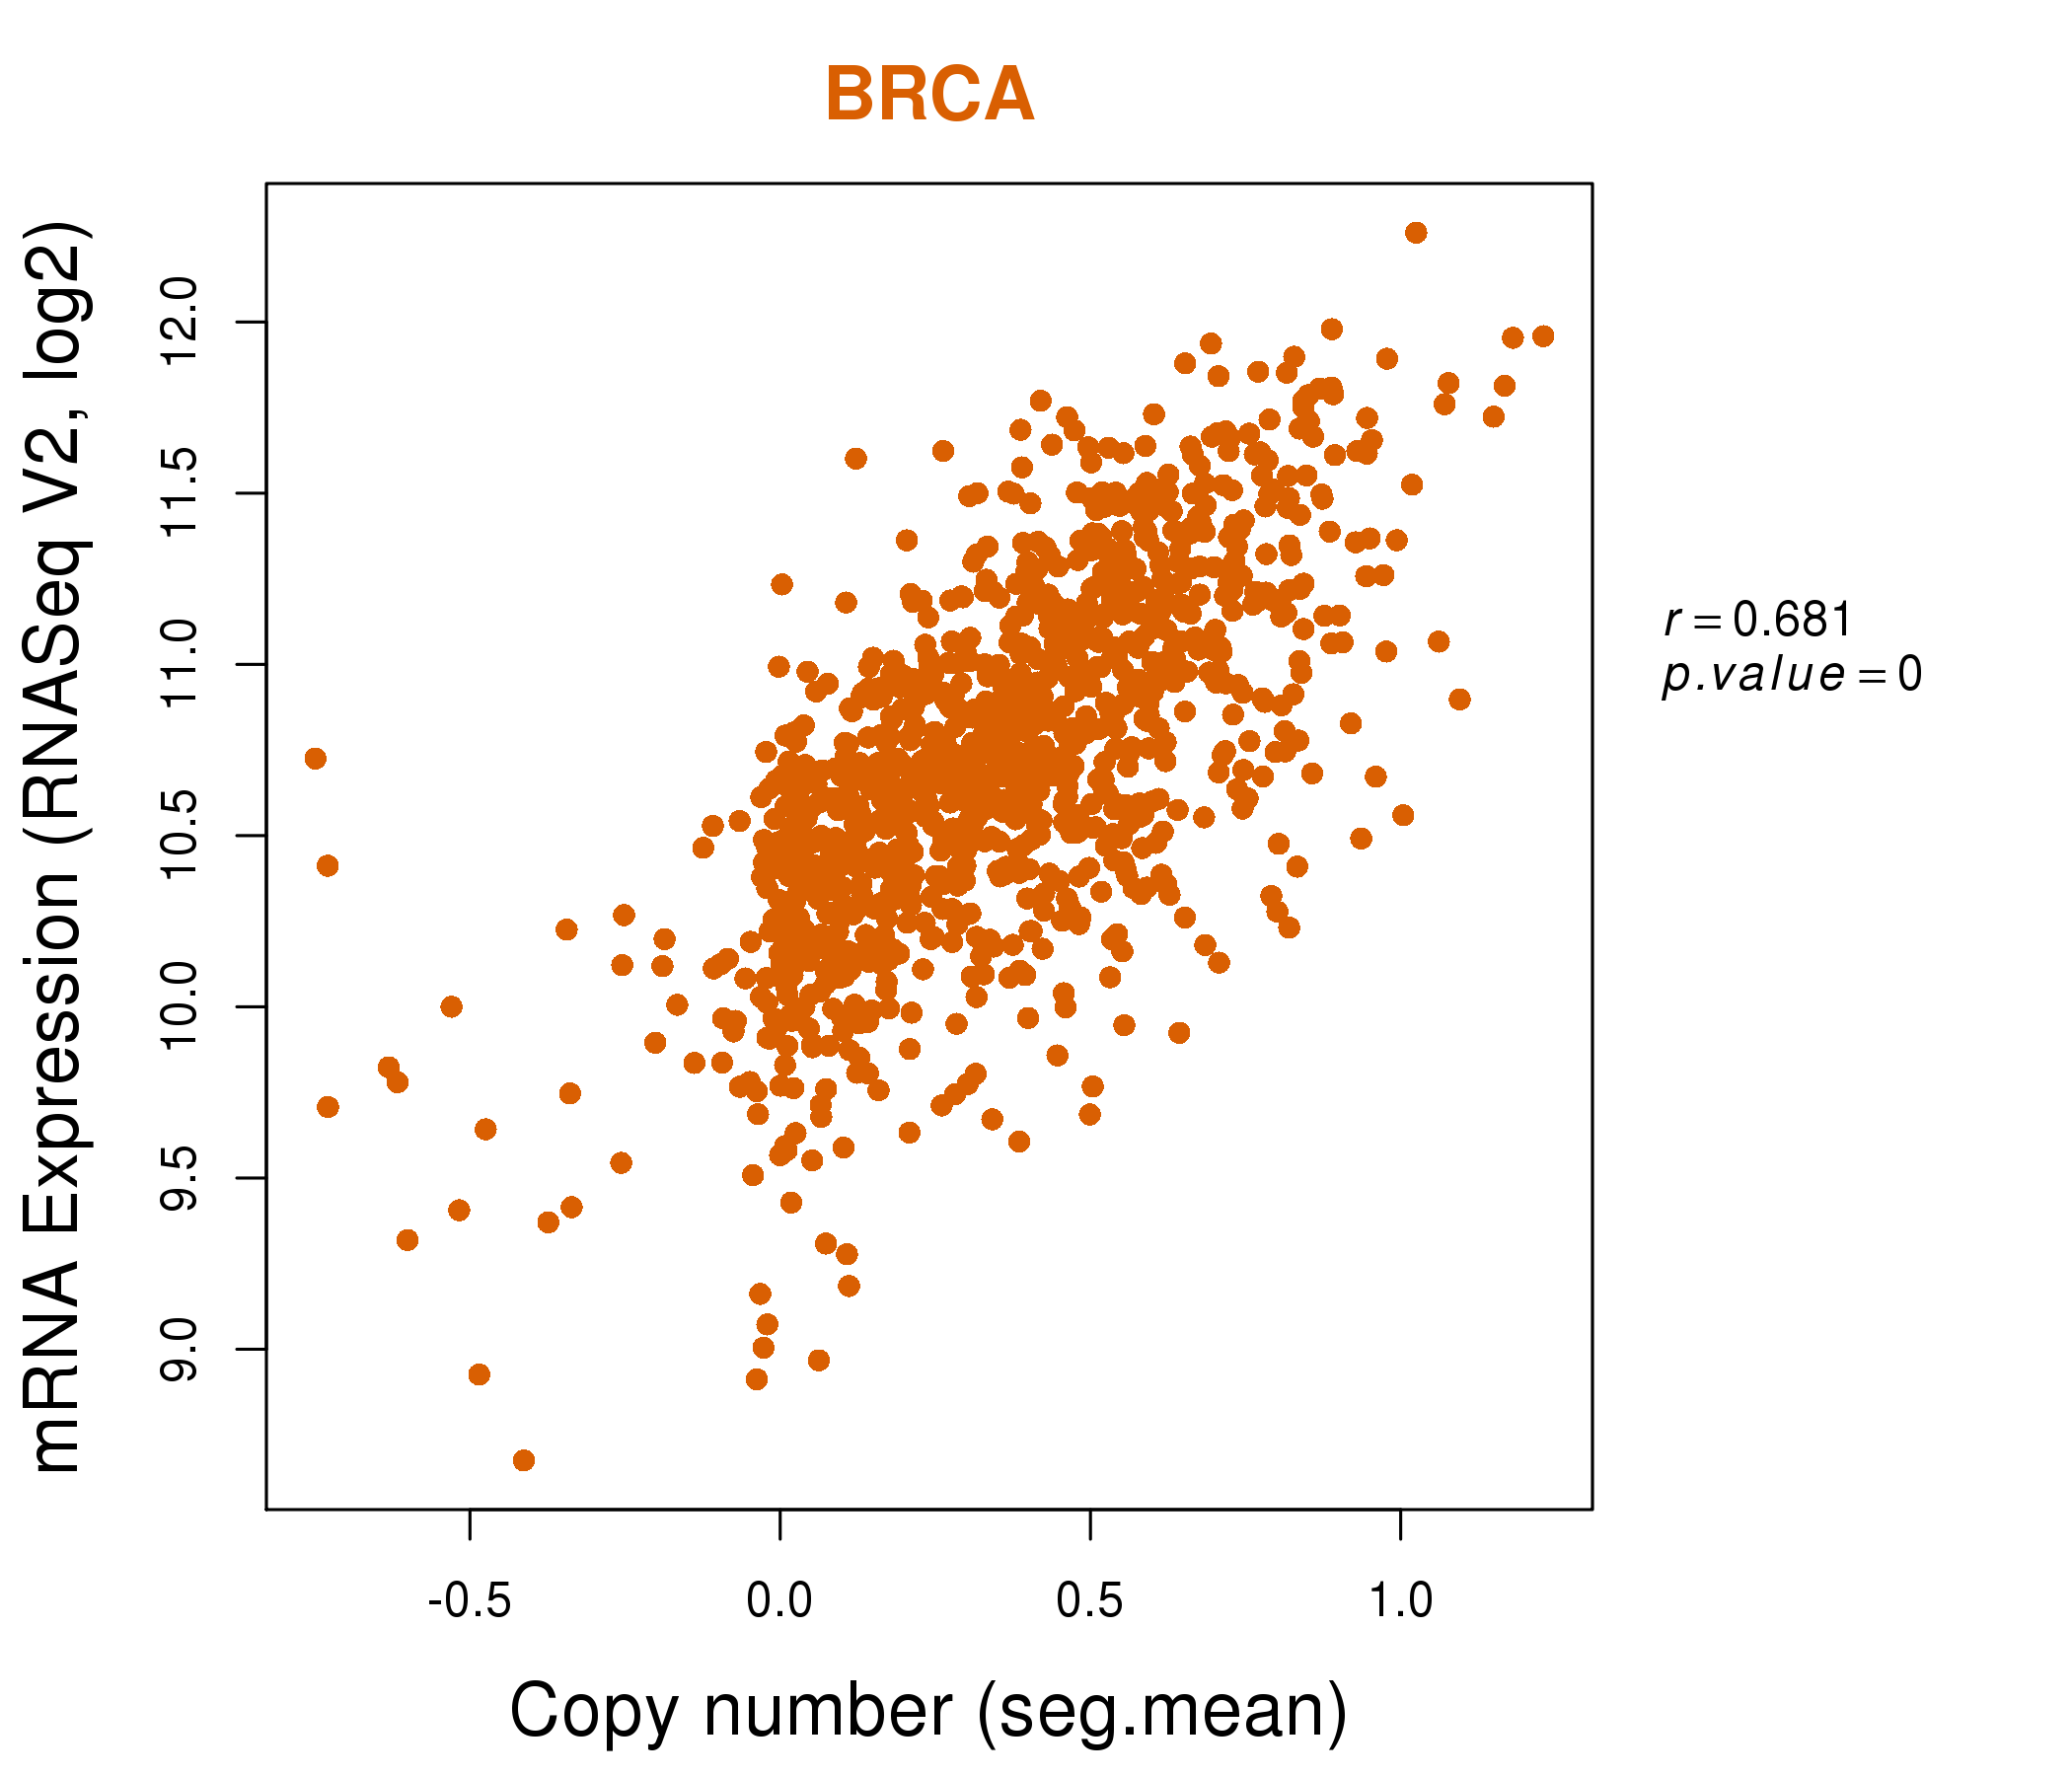
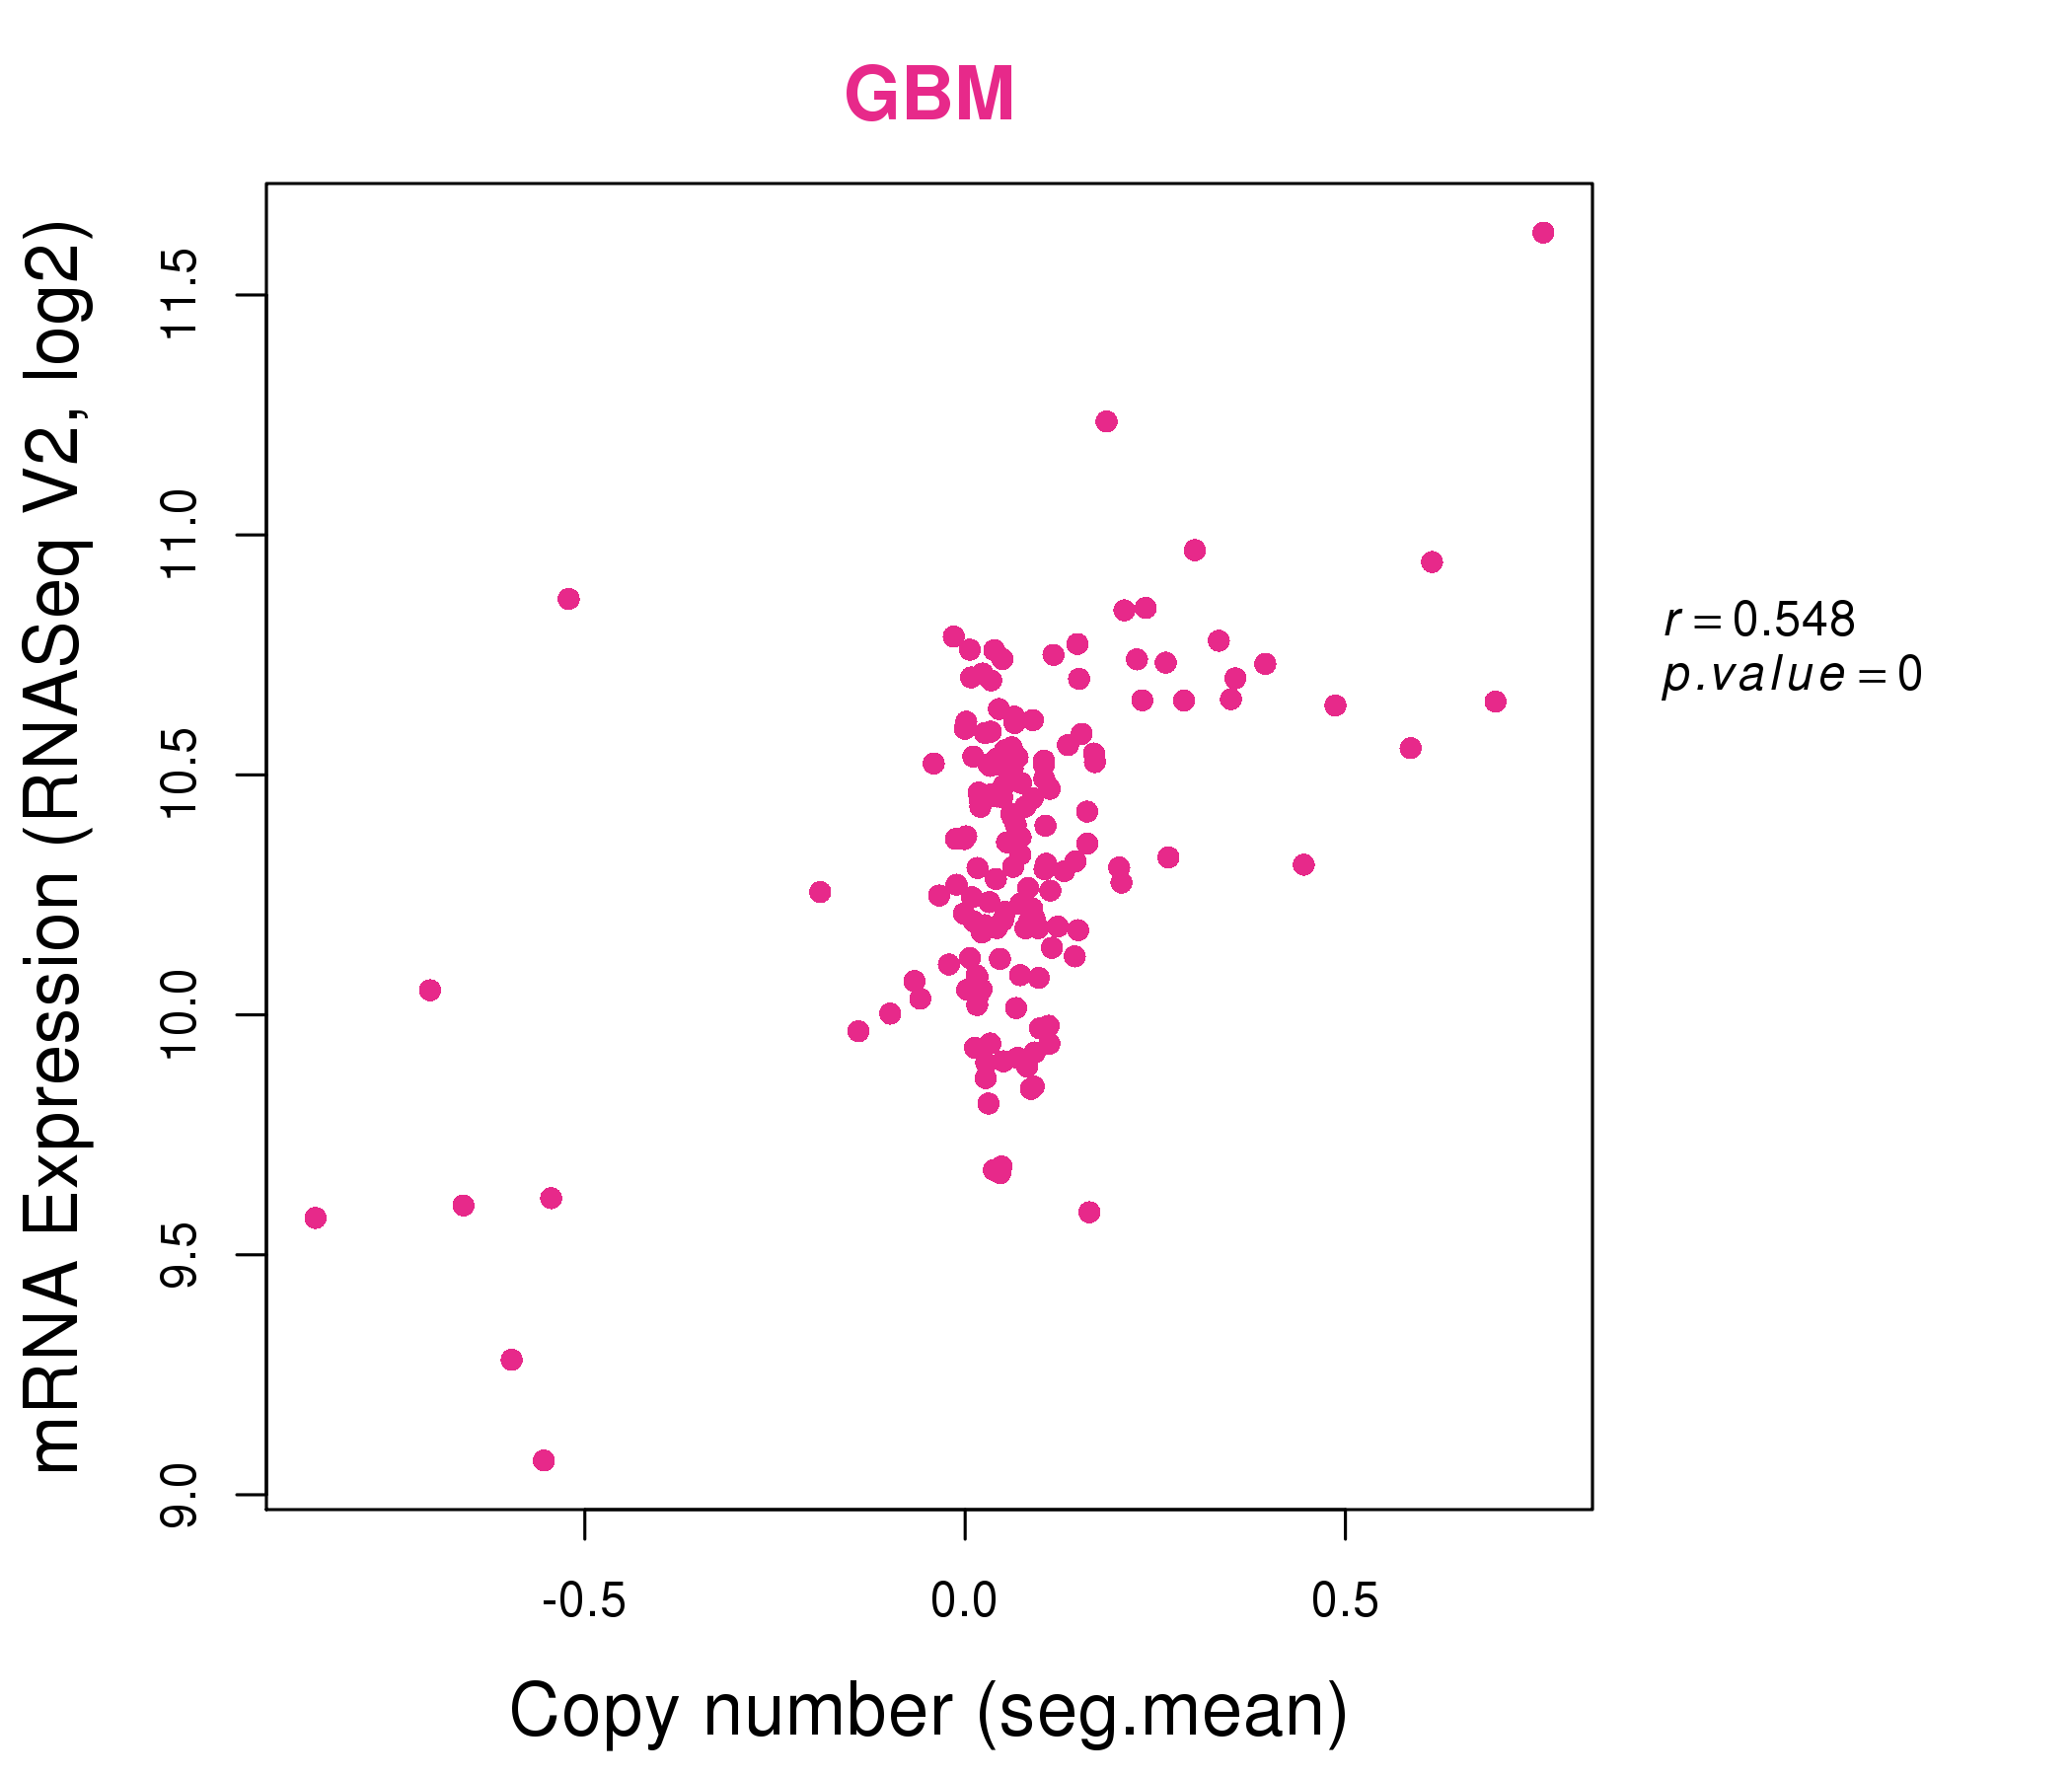
| * This plots show the correlation between CNV and gene expression. |
: Open all plots for all cancer types
 |
|
 |
|
| Top |
| Gene-Gene Network Information |
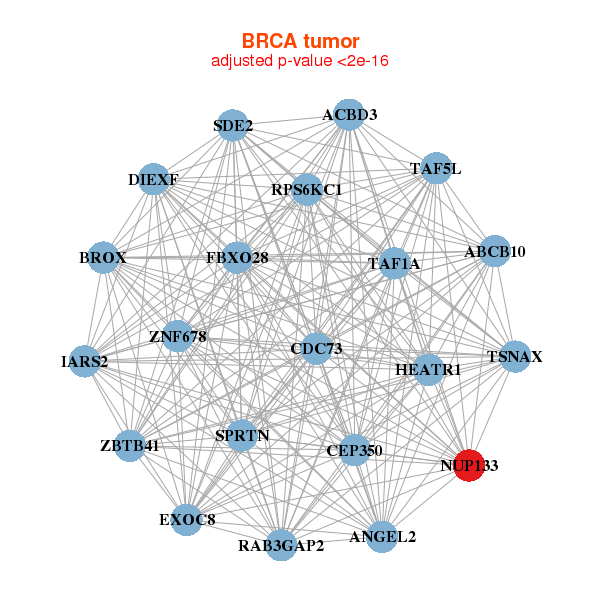
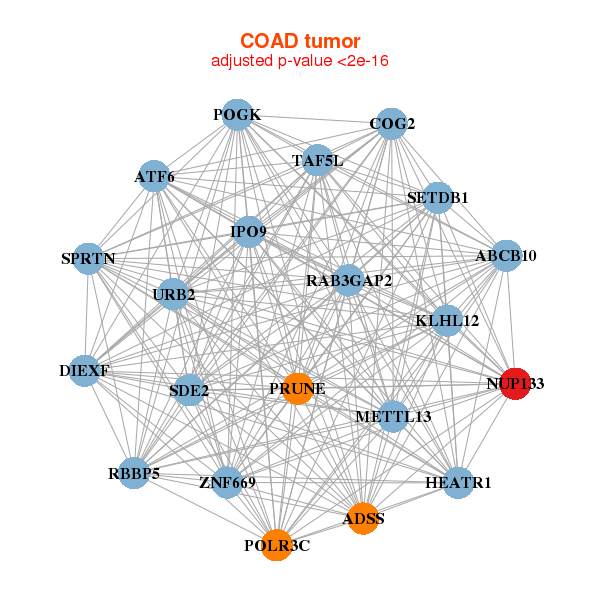
| * Co-Expression network figures were drawn using R package igraph. Only the top 20 genes with the highest correlations were shown. Red circle: input gene, orange circle: cell metabolism gene, sky circle: other gene |
: Open all plots for all cancer types
 |
|
| ABCB10,ACBD3,ANGEL2,DIEXF,SPRTN,SDE2,BROX, CDC73,CEP350,EXOC8,FBXO28,HEATR1,IARS2,NUP133, RAB3GAP2,RPS6KC1,TAF1A,TAF5L,TSNAX,ZBTB41,ZNF678 | API5,CDC23,CEP57,CNOT7,CTDSPL2,DDX18,DHX40, GOSR1,GPBP1,KIAA1143,LOC144438,MATR3,NUCKS1,NUDT21, NUP133,RAD17,RSBN1,SLC30A9,SMAD4,STAG2,TRMT5 |
 |
|
| ABCB10,ADSS,ATF6,DIEXF,SPRTN,SDE2,COG2, HEATR1,IPO9,KLHL12,METTL13,NUP133,POGK,POLR3C, PRUNE,RAB3GAP2,RBBP5,SETDB1,TAF5L,URB2,ZNF669 | ARHGEF9,CDK5RAP2,CKAP5,DHX57,GEMIN5,INTS2,IPO9, KIAA0586,KIAA1549,MTAP,NUP133,NUP205,PREPL,SKIV2L2, SUPT16H,TFCP2,TMEM194A,TOP2B,TTLL5,UBAP2L,WDR82 |
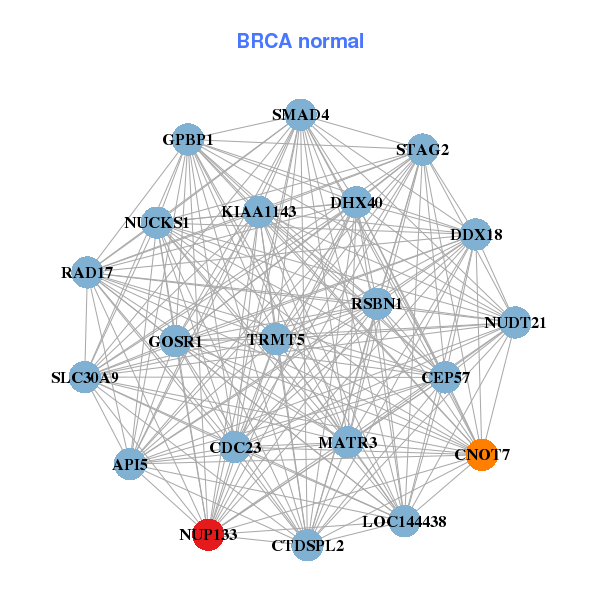
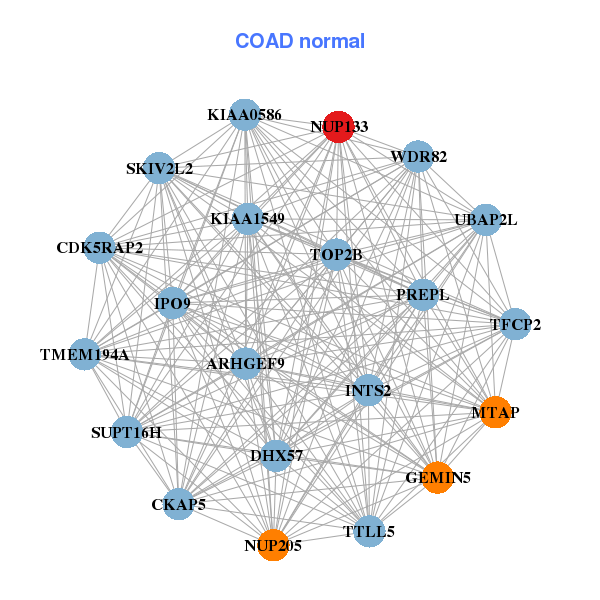
| * Co-Expression network figures were drawn using R package igraph. Only the top 20 genes with the highest correlations were shown. Red circle: input gene, orange circle: cell metabolism gene, sky circle: other gene |
: Open all plots for all cancer types
| Top |
: Open all interacting genes' information including KEGG pathway for all interacting genes from DAVID
| Top |
| Pharmacological Information for NUP133 |
| There's no related Drug. |
| Top |
| Cross referenced IDs for NUP133 |
| * We obtained these cross-references from Uniprot database. It covers 150 different DBs, 18 categories. http://www.uniprot.org/help/cross_references_section |
: Open all cross reference information
|
Copyright © 2016-Present - The Univsersity of Texas Health Science Center at Houston @ |