|
||||||||||||||||||||
| |
| Phenotypic Information (metabolism pathway, cancer, disease, phenome) |
| |
| |
| Gene-Gene Network Information: Co-Expression Network, Interacting Genes & KEGG |
| |
|


| Gene Summary for CNDP2 |
| Basic gene info. | Gene symbol | CNDP2 |
| Gene name | CNDP dipeptidase 2 (metallopeptidase M20 family) | |
| Synonyms | CN2|CPGL|HEL-S-13|HsT2298|PEPA | |
| Cytomap | UCSC genome browser: 18q22.3 | |
| Genomic location | chr18 :72166822-72190689 | |
| Type of gene | protein-coding | |
| RefGenes | NM_001168499.1, NM_018235.2, | |
| Ensembl id | ENSG00000133313 | |
| Description | cytosolic non-specific dipeptidasecytosolic nonspecific dipeptidaseepididymis secretory protein Li 13glutamate carboxypeptidase-like protein 1peptidase A | |
| Modification date | 20141222 | |
| dbXrefs | MIM : 169800 | |
| HGNC : HGNC | ||
| Ensembl : ENSG00000133313 | ||
| HPRD : 09893 | ||
| Vega : OTTHUMG00000132853 | ||
| Protein | UniProt: go to UniProt's Cross Reference DB Table | |
| Expression | CleanEX: HS_CNDP2 | |
| BioGPS: 55748 | ||
| Gene Expression Atlas: ENSG00000133313 | ||
| The Human Protein Atlas: ENSG00000133313 | ||
| Pathway | NCI Pathway Interaction Database: CNDP2 | |
| KEGG: CNDP2 | ||
| REACTOME: CNDP2 | ||
| ConsensusPathDB | ||
| Pathway Commons: CNDP2 | ||
| Metabolism | MetaCyc: CNDP2 | |
| HUMANCyc: CNDP2 | ||
| Regulation | Ensembl's Regulation: ENSG00000133313 | |
| miRBase: chr18 :72,166,822-72,190,689 | ||
| TargetScan: NM_001168499 | ||
| cisRED: ENSG00000133313 | ||
| Context | iHOP: CNDP2 | |
| cancer metabolism search in PubMed: CNDP2 | ||
| UCL Cancer Institute: CNDP2 | ||
| Assigned class in ccmGDB | C | |
| Top |
| Phenotypic Information for CNDP2(metabolism pathway, cancer, disease, phenome) |
| Cancer | CGAP: CNDP2 |
| Familial Cancer Database: CNDP2 | |
| * This gene is included in those cancer gene databases. |
|
|
|
|
|
| . | ||||||||||||||
Oncogene 1 | Significant driver gene in | |||||||||||||||||||
| cf) number; DB name 1 Oncogene; http://nar.oxfordjournals.org/content/35/suppl_1/D721.long, 2 Tumor Suppressor gene; https://bioinfo.uth.edu/TSGene/, 3 Cancer Gene Census; http://www.nature.com/nrc/journal/v4/n3/abs/nrc1299.html, 4 CancerGenes; http://nar.oxfordjournals.org/content/35/suppl_1/D721.long, 5 Network of Cancer Gene; http://ncg.kcl.ac.uk/index.php, 1Therapeutic Vulnerabilities in Cancer; http://cbio.mskcc.org/cancergenomics/statius/ |
| REACTOME_SULFUR_AMINO_ACID_METABOLISM REACTOME_METABOLISM_OF_AMINO_ACIDS_AND_DERIVATIVES | |
| OMIM | |
| Orphanet | |
| Disease | KEGG Disease: CNDP2 |
| MedGen: CNDP2 (Human Medical Genetics with Condition) | |
| ClinVar: CNDP2 | |
| Phenotype | MGI: CNDP2 (International Mouse Phenotyping Consortium) |
| PhenomicDB: CNDP2 | |
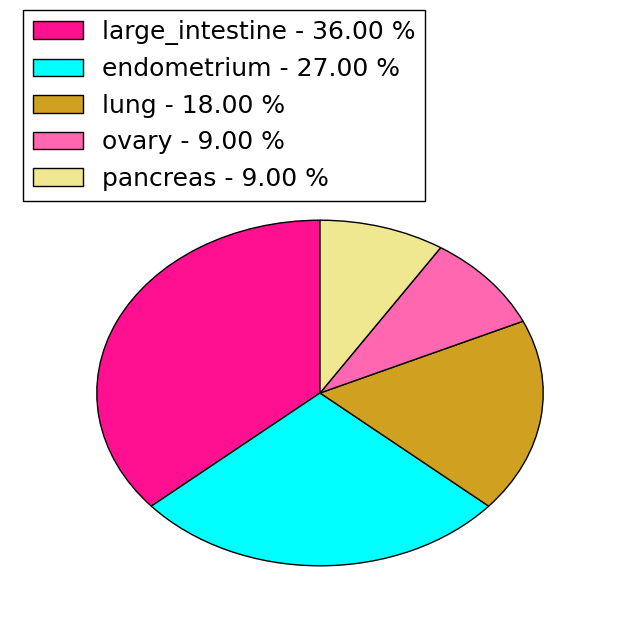
| Mutations for CNDP2 |
| * Under tables are showing count per each tissue to give us broad intuition about tissue specific mutation patterns.You can go to the detailed page for each mutation database's web site. |
| - Statistics for Tissue and Mutation type | Top |
 |
| - For Inter-chromosomal Variations |
| There's no inter-chromosomal structural variation. |
| - For Intra-chromosomal Variations |
| * Intra-chromosomal variantions includes 'intrachromosomal amplicon to amplicon', 'intrachromosomal amplicon to non-amplified dna', 'intrachromosomal deletion', 'intrachromosomal fold-back inversion', 'intrachromosomal inversion', 'intrachromosomal tandem duplication', 'Intrachromosomal unknown type', 'intrachromosomal with inverted orientation', 'intrachromosomal with non-inverted orientation'. |
 |
| Sample | Symbol_a | Chr_a | Start_a | End_a | Symbol_b | Chr_b | Start_b | End_b |
| pancreas | CNDP2 | chr18 | 72185587 | 72185607 | CNDP2 | chr18 | 72185671 | 72185691 |
| cf) Tissue number; Tissue name (1;Breast, 2;Central_nervous_system, 3;Haematopoietic_and_lymphoid_tissue, 4;Large_intestine, 5;Liver, 6;Lung, 7;Ovary, 8;Pancreas, 9;Prostate, 10;Skin, 11;Soft_tissue, 12;Upper_aerodigestive_tract) |
| * From mRNA Sanger sequences, Chitars2.0 arranged chimeric transcripts. This table shows CNDP2 related fusion information. |
| ID | Head Gene | Tail Gene | Accession | Gene_a | qStart_a | qEnd_a | Chromosome_a | tStart_a | tEnd_a | Gene_a | qStart_a | qEnd_a | Chromosome_a | tStart_a | tEnd_a |
| BF853131 | PAX8 | 11 | 248 | 2 | 114001208 | 114001444 | CNDP2 | 237 | 497 | 18 | 72176191 | 72176450 | |
| AA367702 | RYBP | 1 | 211 | 3 | 72475567 | 72475777 | CNDP2 | 211 | 404 | 18 | 72168680 | 72173247 | |
| BQ329957 | CNDP2 | 2 | 255 | 18 | 72176197 | 72176450 | PAX8 | 244 | 480 | 2 | 114001208 | 114001444 | |
| BI010777 | CNDP2 | 12 | 261 | 18 | 72176191 | 72176440 | FRYL | 261 | 310 | 4 | 48741147 | 48741196 | |
| BI010769 | CNDP2 | 21 | 255 | 18 | 72176204 | 72176440 | PAX8 | 255 | 485 | 2 | 114001208 | 114001438 | |
| AI906669 | CNDP2 | 10 | 184 | 18 | 72186290 | 72187366 | ALKBH5 | 178 | 364 | 17 | 18112395 | 18112581 | |
| BF846333 | CNDP2 | 28 | 269 | 18 | 72173231 | 72178184 | CNDP2 | 266 | 443 | 18 | 72167146 | 72168618 | |
| BF814523 | CNDP2 | 9 | 207 | 18 | 72163620 | 72167268 | RPL9 | 200 | 407 | 4 | 39455744 | 39456258 | |
| Top |
| There's no copy number variation information in COSMIC data for this gene. |
| Top |
|
 |
| Top |
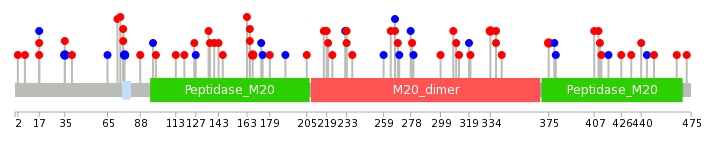
| Stat. for Non-Synonymous SNVs (# total SNVs=46) | (# total SNVs=11) |
 |  |
(# total SNVs=0) | (# total SNVs=1) |
 |
| Top |
| * When you move the cursor on each content, you can see more deailed mutation information on the Tooltip. Those are primary_site,primary_histology,mutation(aa),pubmedID. |
| GRCh37 position | Mutation(aa) | Unique sampleID count |
| chr18:72168608-72168608 | p.P35P | 2 |
| chr18:72183517-72183517 | p.E320K | 2 |
| chr18:72178091-72178091 | p.E167G | 2 |
| chr18:72183560-72183561 | p.R334I | 2 |
| chr18:72185789-72185789 | p.K375M | 2 |
| chr18:72173106-72173106 | p.P76Q | 2 |
| chr18:72173110-72173110 | p.L77L | 2 |
| chr18:72180851-72180851 | p.A267V | 1 |
| chr18:72186318-72186318 | p.E449K | 1 |
| chr18:72173170-72173170 | p.Y97Y | 1 |
| Top |
|
 |
| Point Mutation/ Tissue ID | 1 | 2 | 3 | 4 | 5 | 6 | 7 | 8 | 9 | 10 | 11 | 12 | 13 | 14 | 15 | 16 | 17 | 18 | 19 | 20 |
| # sample | 3 | 2 | 1 | 12 | 2 | 3 | 1 | 5 | 2 | 9 | 5 | 4 | ||||||||
| # mutation | 3 | 2 | 1 | 12 | 2 | 3 | 1 | 5 | 2 | 8 | 5 | 5 | ||||||||
| nonsynonymous SNV | 2 | 2 | 1 | 9 | 2 | 1 | 1 | 2 | 2 | 2 | 4 | 2 | ||||||||
| synonymous SNV | 1 | 3 | 2 | 3 | 6 | 1 | 3 |
| cf) Tissue ID; Tissue type (1; BLCA[Bladder Urothelial Carcinoma], 2; BRCA[Breast invasive carcinoma], 3; CESC[Cervical squamous cell carcinoma and endocervical adenocarcinoma], 4; COAD[Colon adenocarcinoma], 5; GBM[Glioblastoma multiforme], 6; Glioma Low Grade, 7; HNSC[Head and Neck squamous cell carcinoma], 8; KICH[Kidney Chromophobe], 9; KIRC[Kidney renal clear cell carcinoma], 10; KIRP[Kidney renal papillary cell carcinoma], 11; LAML[Acute Myeloid Leukemia], 12; LUAD[Lung adenocarcinoma], 13; LUSC[Lung squamous cell carcinoma], 14; OV[Ovarian serous cystadenocarcinoma ], 15; PAAD[Pancreatic adenocarcinoma], 16; PRAD[Prostate adenocarcinoma], 17; SKCM[Skin Cutaneous Melanoma], 18:STAD[Stomach adenocarcinoma], 19:THCA[Thyroid carcinoma], 20:UCEC[Uterine Corpus Endometrial Carcinoma]) |
| Top |
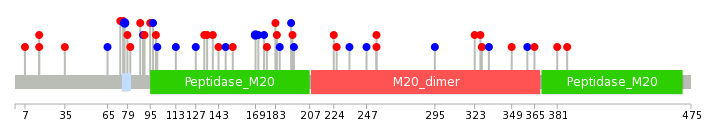
| * We represented just top 10 SNVs. When you move the cursor on each content, you can see more deailed mutation information on the Tooltip. Those are primary_site, primary_histology, mutation(aa), pubmedID. |
| Genomic Position | Mutation(aa) | Unique sampleID count |
| chr18:72173110 | p.K169K,CNDP2 | 2 |
| chr18:72180810 | p.L77L | 2 |
| chr18:72186318 | p.G295G,CNDP2 | 1 |
| chr18:72178113 | p.Y97Y | 1 |
| chr18:72180828 | p.G171G,CNDP2 | 1 |
| chr18:72183552 | p.V323A,CNDP2 | 1 |
| chr18:72173106 | p.H99R | 1 |
| chr18:72187269 | p.I175I,CNDP2 | 1 |
| chr18:72178114 | p.L327F,CNDP2 | 1 |
| chr18:72180833 | p.S113S | 1 |
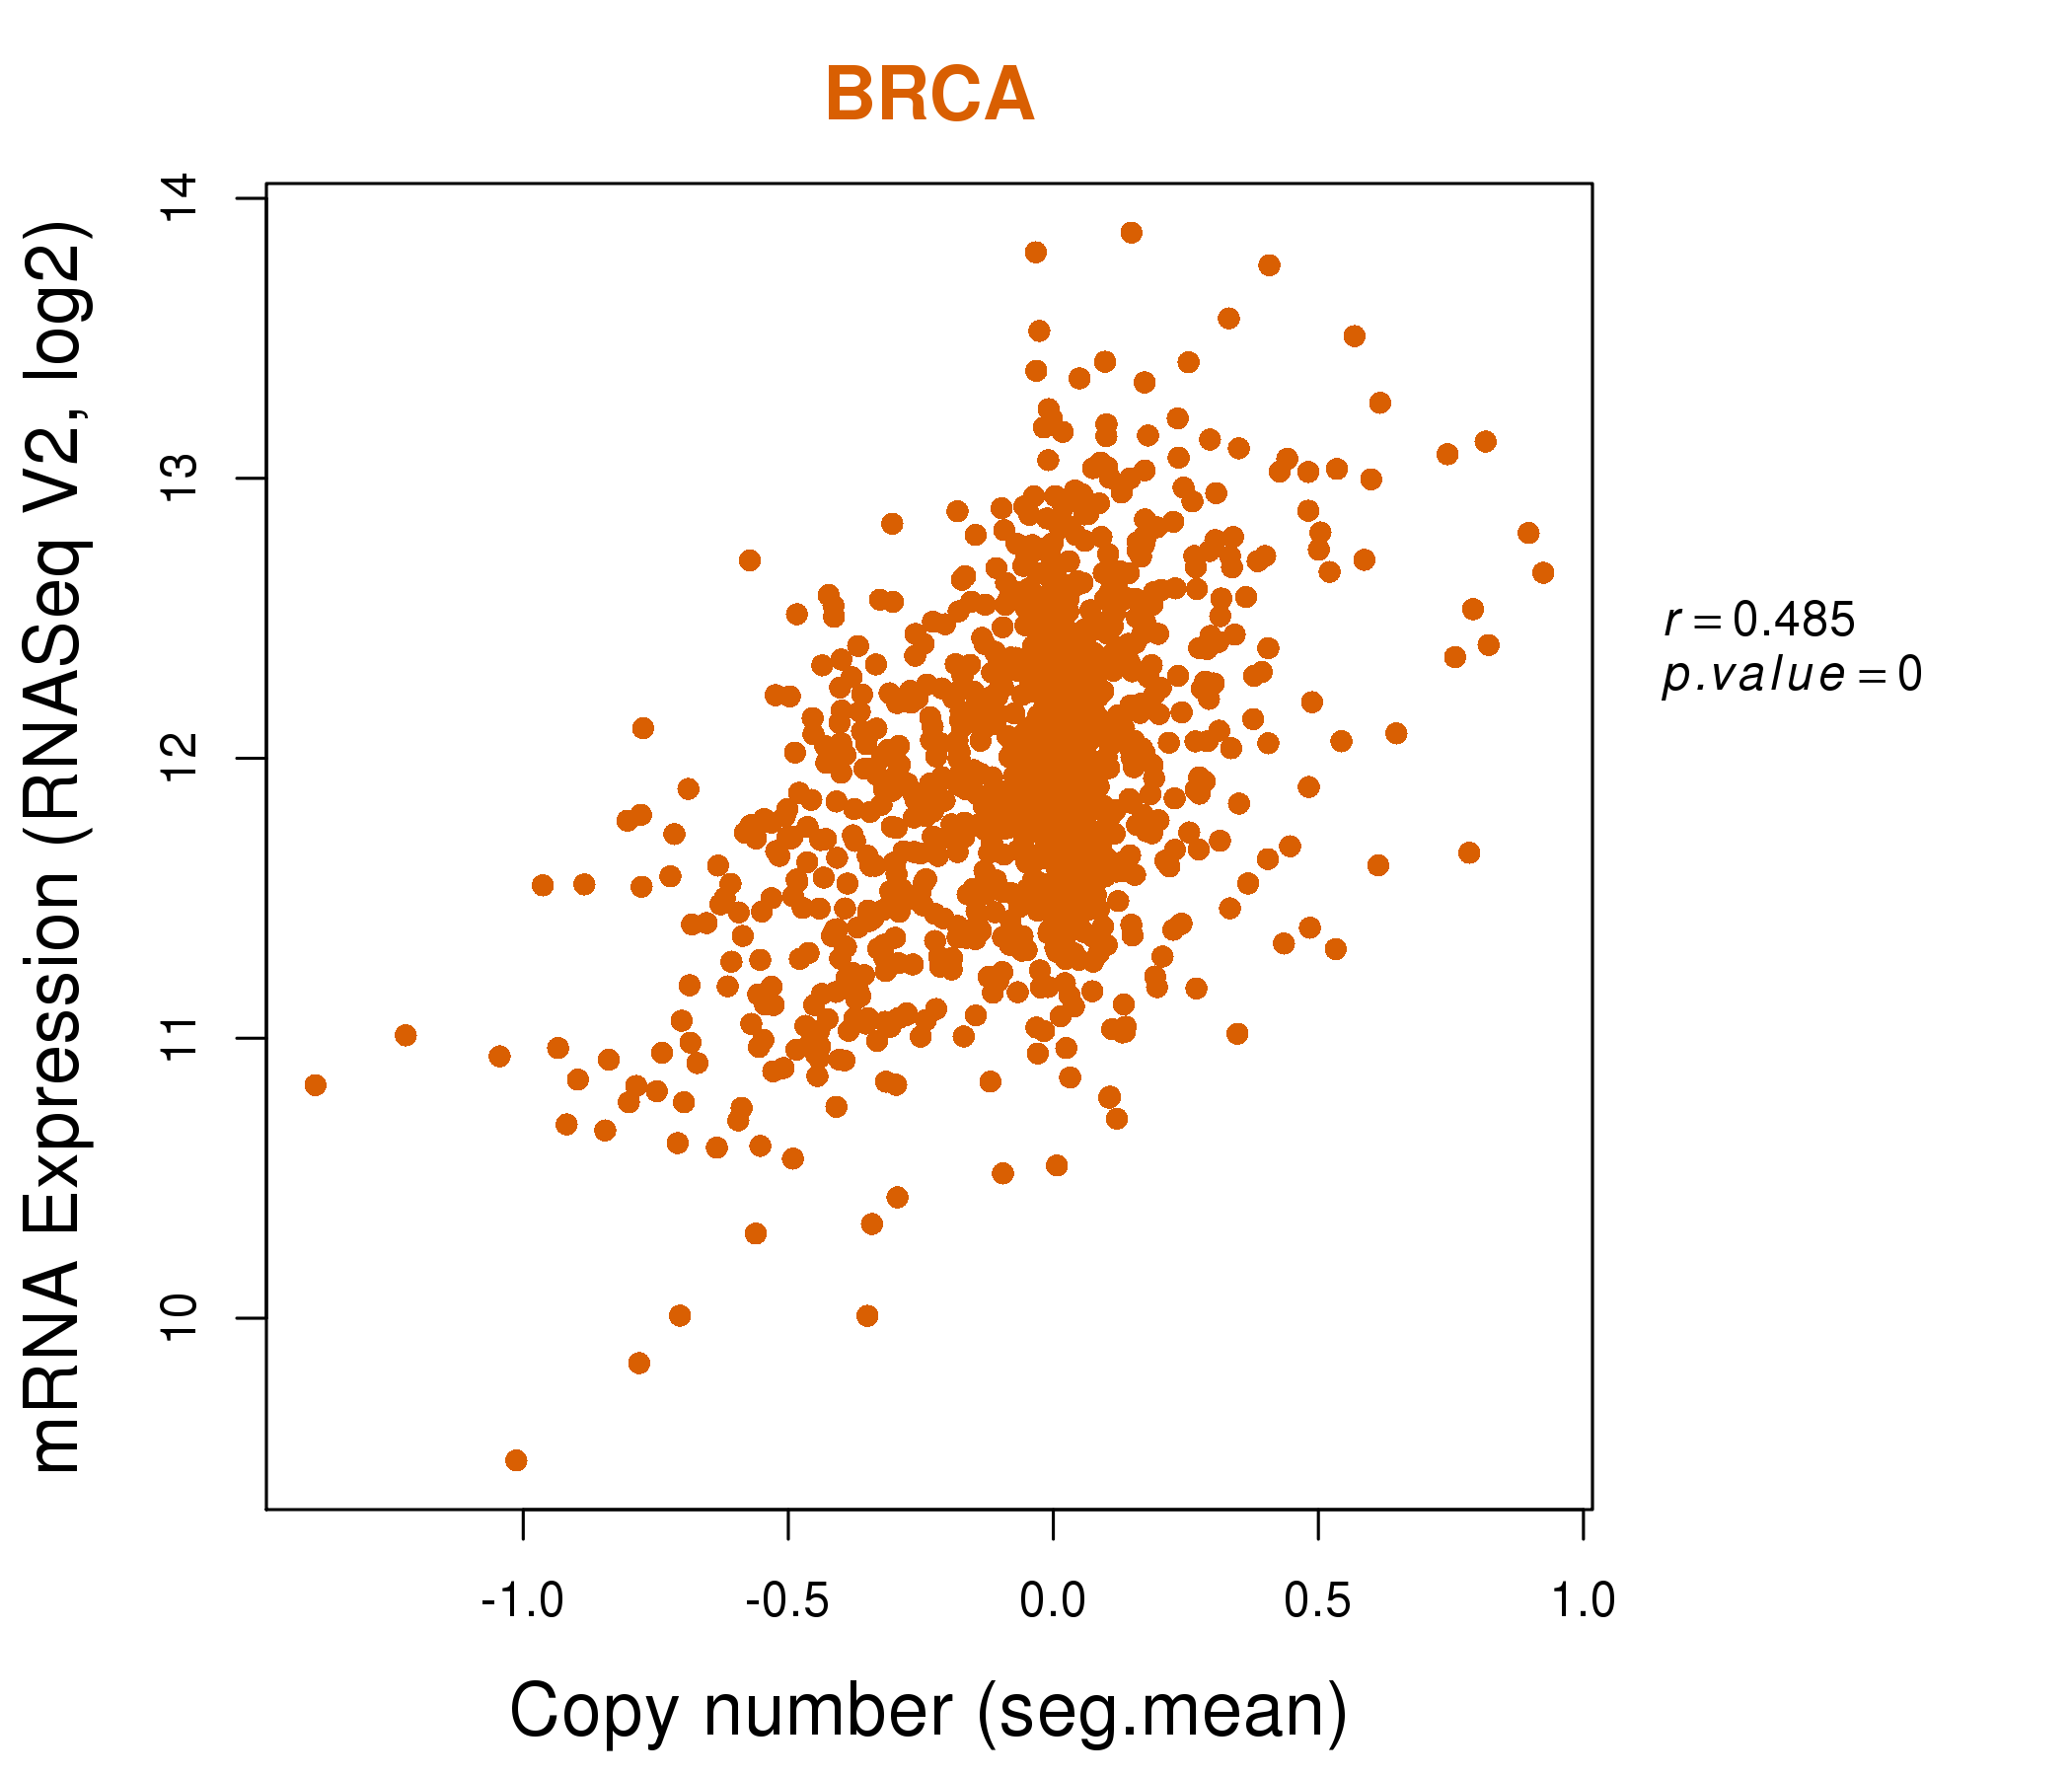
| * Copy number data were extracted from TCGA using R package TCGA-Assembler. The URLs of all public data files on TCGA DCC data server were gathered on Jan-05-2015. Function ProcessCNAData in TCGA-Assembler package was used to obtain gene-level copy number value which is calculated as the average copy number of the genomic region of a gene. |
 |
| cf) Tissue ID[Tissue type]: BLCA[Bladder Urothelial Carcinoma], BRCA[Breast invasive carcinoma], CESC[Cervical squamous cell carcinoma and endocervical adenocarcinoma], COAD[Colon adenocarcinoma], GBM[Glioblastoma multiforme], Glioma Low Grade, HNSC[Head and Neck squamous cell carcinoma], KICH[Kidney Chromophobe], KIRC[Kidney renal clear cell carcinoma], KIRP[Kidney renal papillary cell carcinoma], LAML[Acute Myeloid Leukemia], LUAD[Lung adenocarcinoma], LUSC[Lung squamous cell carcinoma], OV[Ovarian serous cystadenocarcinoma ], PAAD[Pancreatic adenocarcinoma], PRAD[Prostate adenocarcinoma], SKCM[Skin Cutaneous Melanoma], STAD[Stomach adenocarcinoma], THCA[Thyroid carcinoma], UCEC[Uterine Corpus Endometrial Carcinoma] |
| Top |
| Gene Expression for CNDP2 |
| * CCLE gene expression data were extracted from CCLE_Expression_Entrez_2012-10-18.res: Gene-centric RMA-normalized mRNA expression data. |
 |
| * Normalized gene expression data of RNASeqV2 was extracted from TCGA using R package TCGA-Assembler. The URLs of all public data files on TCGA DCC data server were gathered at Jan-05-2015. Only eight cancer types have enough normal control samples for differential expression analysis. (t test, adjusted p<0.05 (using Benjamini-Hochberg FDR)) |
 |
| Top |
| * This plots show the correlation between CNV and gene expression. |
: Open all plots for all cancer types
 |
|
 |
|

| Top |
| Gene-Gene Network Information |
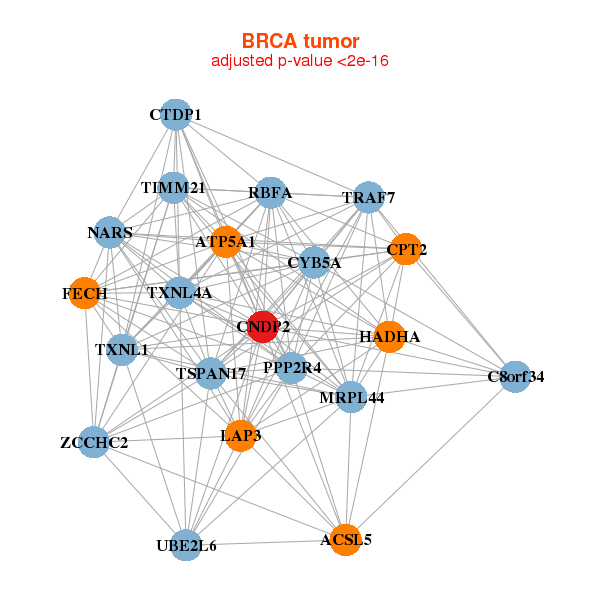
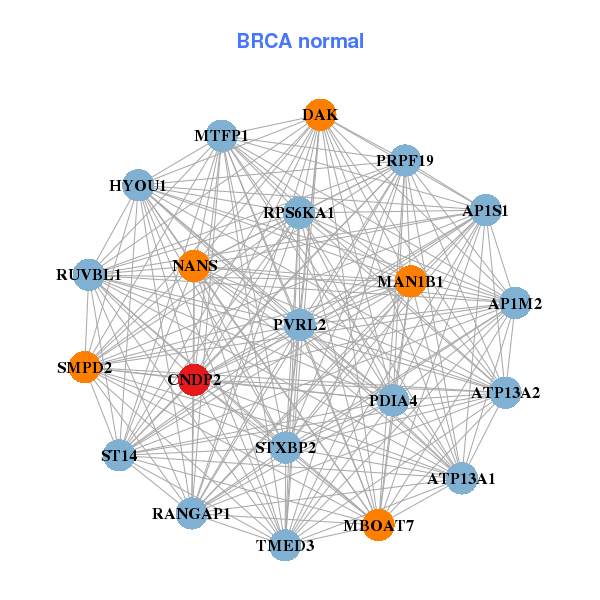
| * Co-Expression network figures were drawn using R package igraph. Only the top 20 genes with the highest correlations were shown. Red circle: input gene, orange circle: cell metabolism gene, sky circle: other gene |
: Open all plots for all cancer types
 |
|
| ACSL5,ATP5A1,RBFA,TIMM21,C8orf34,CNDP2,CPT2, CTDP1,CYB5A,FECH,HADHA,LAP3,MRPL44,NARS, PPP2R4,TRAF7,TSPAN17,TXNL1,TXNL4A,UBE2L6,ZCCHC2 | AP1M2,AP1S1,ATP13A1,ATP13A2,CNDP2,DAK,HYOU1, MAN1B1,MBOAT7,MTFP1,NANS,PDIA4,PRPF19,PVRL2, RANGAP1,RPS6KA1,RUVBL1,SMPD2,ST14,STXBP2,TMED3 |
 |
|
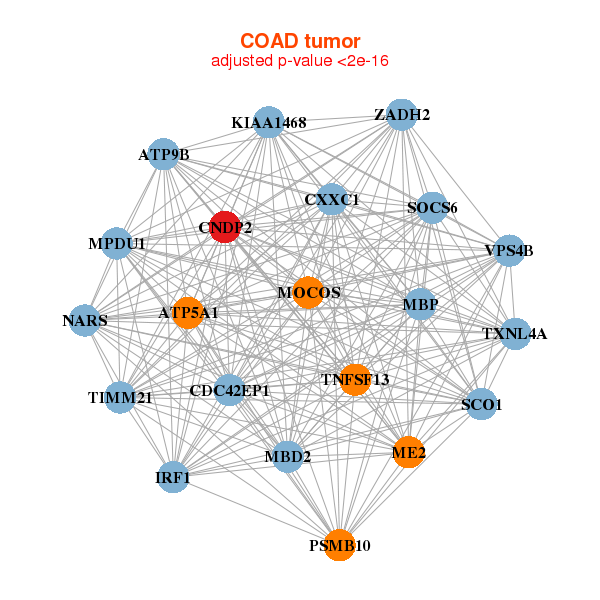
| ATP5A1,ATP9B,TIMM21,CDC42EP1,CNDP2,CXXC1,IRF1, KIAA1468,MBD2,MBP,ME2,MOCOS,MPDU1,NARS, PSMB10,SCO1,SOCS6,TNFSF13,TXNL4A,VPS4B,ZADH2 | ACE2,ACY3,ANPEP,PLEKHS1,LINC00479,CA13,CDHR2, CNDP2,DGAT1,ESPL1,RMDN3,GK,GK3P,SLC52A1, HNF4G,MYO1A,PCK2,PLCB3,SLC2A5,SLC5A1,TM4SF20 |

| * Co-Expression network figures were drawn using R package igraph. Only the top 20 genes with the highest correlations were shown. Red circle: input gene, orange circle: cell metabolism gene, sky circle: other gene |
: Open all plots for all cancer types
| Top |
: Open all interacting genes' information including KEGG pathway for all interacting genes from DAVID
| Top |
| Pharmacological Information for CNDP2 |
| There's no related Drug. |
| Top |
| Cross referenced IDs for CNDP2 |
| * We obtained these cross-references from Uniprot database. It covers 150 different DBs, 18 categories. http://www.uniprot.org/help/cross_references_section |
: Open all cross reference information
|
Copyright © 2016-Present - The Univsersity of Texas Health Science Center at Houston @ |