|
||||||||||||||||||||
| |
| Phenotypic Information (metabolism pathway, cancer, disease, phenome) |
| |
| |
| Gene-Gene Network Information: Co-Expression Network, Interacting Genes & KEGG |
| |
|


| Gene Summary for OGDHL |
| Top |
| Phenotypic Information for OGDHL(metabolism pathway, cancer, disease, phenome) |
| Cancer | CGAP: OGDHL |
| Familial Cancer Database: OGDHL | |
| * This gene is included in those cancer gene databases. |
|
|
|
|
|
|
| ||||||||||||||
Oncogene 1 | Significant driver gene in | |||||||||||||||||||
| cf) number; DB name 1 Oncogene; http://nar.oxfordjournals.org/content/35/suppl_1/D721.long, 2 Tumor Suppressor gene; https://bioinfo.uth.edu/TSGene/, 3 Cancer Gene Census; http://www.nature.com/nrc/journal/v4/n3/abs/nrc1299.html, 4 CancerGenes; http://nar.oxfordjournals.org/content/35/suppl_1/D721.long, 5 Network of Cancer Gene; http://ncg.kcl.ac.uk/index.php, 1Therapeutic Vulnerabilities in Cancer; http://cbio.mskcc.org/cancergenomics/statius/ |
| KEGG_TRYPTOPHAN_METABOLISM | |
| OMIM | |
| Orphanet | |
| Disease | KEGG Disease: OGDHL |
| MedGen: OGDHL (Human Medical Genetics with Condition) | |
| ClinVar: OGDHL | |
| Phenotype | MGI: OGDHL (International Mouse Phenotyping Consortium) |
| PhenomicDB: OGDHL | |
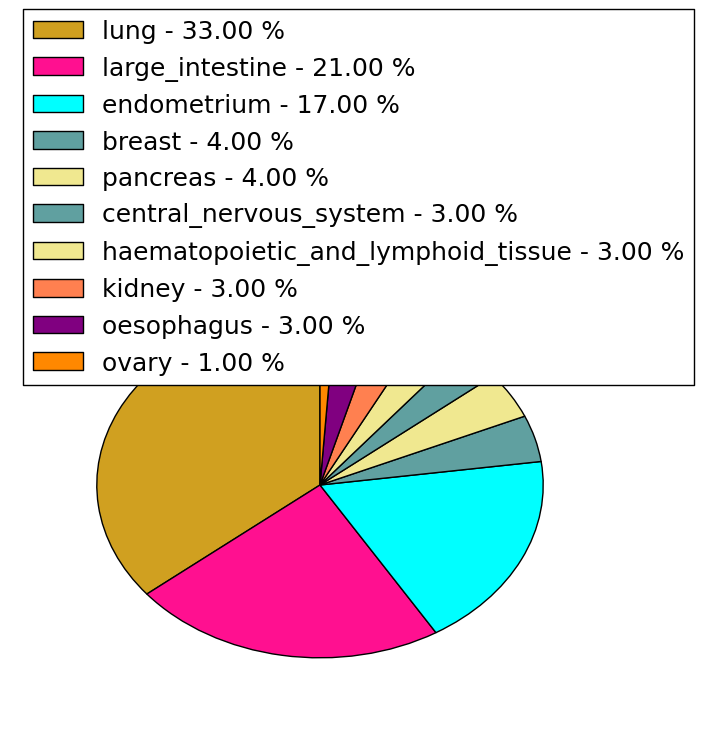
| Mutations for OGDHL |
| * Under tables are showing count per each tissue to give us broad intuition about tissue specific mutation patterns.You can go to the detailed page for each mutation database's web site. |
| - Statistics for Tissue and Mutation type | Top |
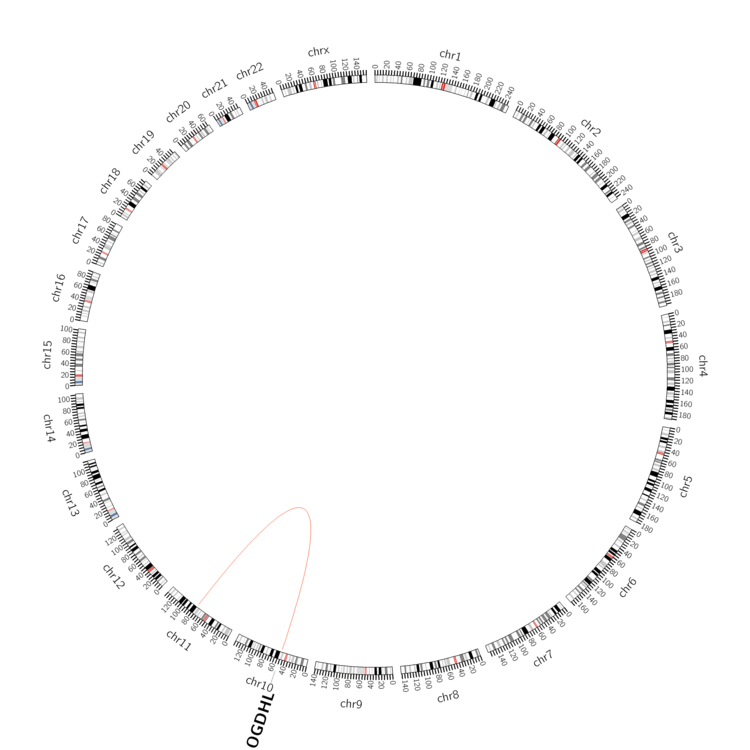 |
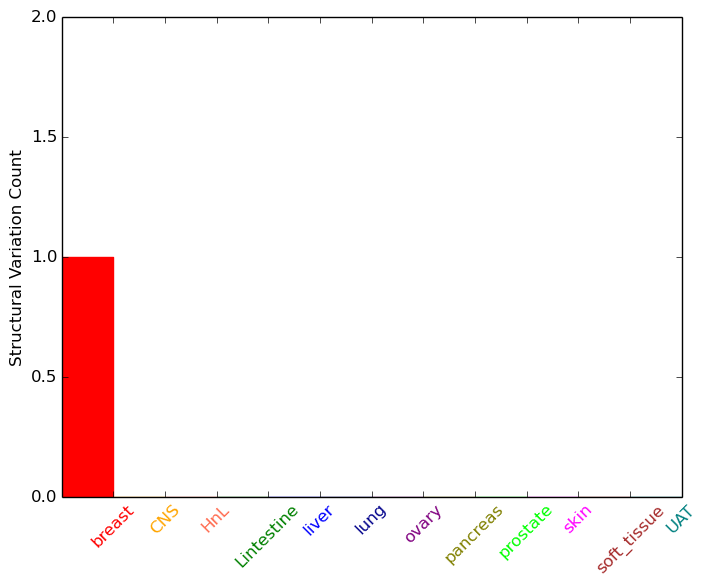
| - For Inter-chromosomal Variations |
| * Inter-chromosomal variantions includes 'interchromosomal amplicon to amplicon', 'interchromosomal amplicon to non-amplified dna', 'interchromosomal insertion', 'Interchromosomal unknown type'. |
 |
| - For Intra-chromosomal Variations |
| There's no intra-chromosomal structural variation. |
| Sample | Symbol_a | Chr_a | Start_a | End_a | Symbol_b | Chr_b | Start_b | End_b |
| breast | OGDHL | chr10 | 50957260 | 50957260 | NDUFC2-KCTD14 | chr11 | 77760435 | 77760435 |
| cf) Tissue number; Tissue name (1;Breast, 2;Central_nervous_system, 3;Haematopoietic_and_lymphoid_tissue, 4;Large_intestine, 5;Liver, 6;Lung, 7;Ovary, 8;Pancreas, 9;Prostate, 10;Skin, 11;Soft_tissue, 12;Upper_aerodigestive_tract) |
| * From mRNA Sanger sequences, Chitars2.0 arranged chimeric transcripts. This table shows OGDHL related fusion information. |
| ID | Head Gene | Tail Gene | Accession | Gene_a | qStart_a | qEnd_a | Chromosome_a | tStart_a | tEnd_a | Gene_a | qStart_a | qEnd_a | Chromosome_a | tStart_a | tEnd_a |
| BP348542 | OGDHL | 1 | 392 | 10 | 50942936 | 50970356 | OGDHL | 388 | 581 | 10 | 50964915 | 50966550 | |
| Top |
| There's no copy number variation information in COSMIC data for this gene. |
| Top |
|
 |
| Top |
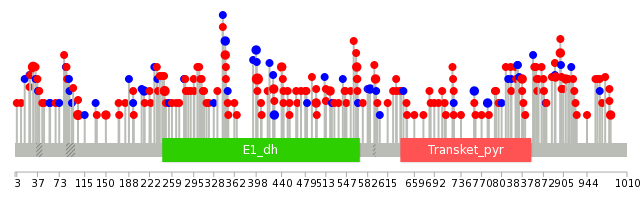
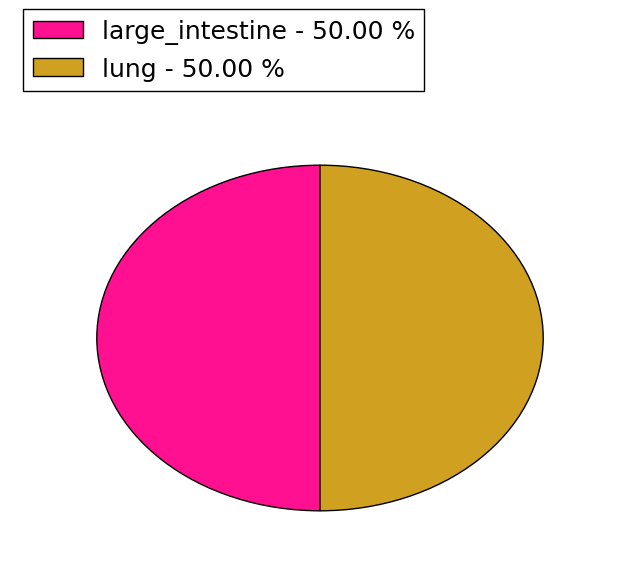
| Stat. for Non-Synonymous SNVs (# total SNVs=127) | (# total SNVs=32) |
 | 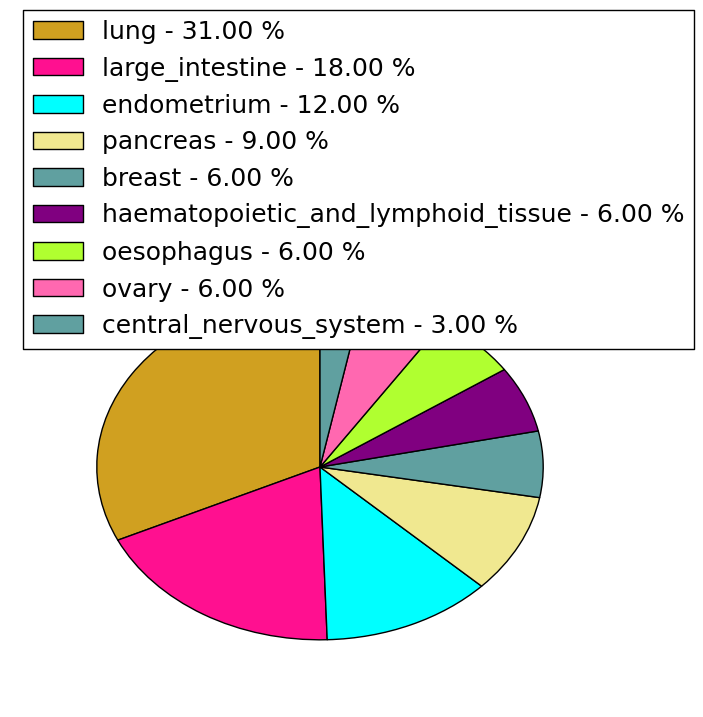 |
(# total SNVs=2) | (# total SNVs=0) |
 |
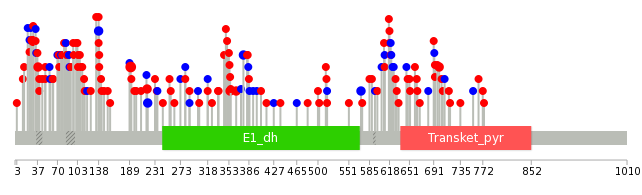
| Top |
| * When you move the cursor on each content, you can see more deailed mutation information on the Tooltip. Those are primary_site,primary_histology,mutation(aa),pubmedID. |
| GRCh37 position | Mutation(aa) | Unique sampleID count |
| chr10:50954894-50954894 | p.A400T | 6 |
| chr10:50966551-50966551 | p.R30C | 4 |
| chr10:50959882-50959882 | p.R247H | 3 |
| chr10:50964886-50964886 | p.R104Q | 3 |
| chr10:50944482-50944482 | p.G892E | 2 |
| chr10:50954898-50954898 | p.D398D | 2 |
| chr10:50955203-50955203 | p.R347C | 2 |
| chr10:50947856-50947856 | p.P724S | 2 |
| chr10:50955213-50955213 | p.E343E | 2 |
| chr10:50954813-50954813 | p.V427I | 2 |
| Top |
|
 |
| Point Mutation/ Tissue ID | 1 | 2 | 3 | 4 | 5 | 6 | 7 | 8 | 9 | 10 | 11 | 12 | 13 | 14 | 15 | 16 | 17 | 18 | 19 | 20 |
| # sample | 6 | 5 | 1 | 17 | 3 | 9 | 2 | 1 | 24 | 11 | 2 | 1 | 1 | 38 | 11 | 2 | 16 | |||
| # mutation | 6 | 5 | 1 | 19 | 3 | 9 | 2 | 1 | 25 | 11 | 2 | 1 | 1 | 48 | 13 | 2 | 21 | |||
| nonsynonymous SNV | 4 | 4 | 1 | 14 | 3 | 8 | 2 | 17 | 5 | 1 | 36 | 7 | 2 | 17 | ||||||
| synonymous SNV | 2 | 1 | 5 | 1 | 1 | 8 | 6 | 2 | 1 | 12 | 6 | 4 |
| cf) Tissue ID; Tissue type (1; BLCA[Bladder Urothelial Carcinoma], 2; BRCA[Breast invasive carcinoma], 3; CESC[Cervical squamous cell carcinoma and endocervical adenocarcinoma], 4; COAD[Colon adenocarcinoma], 5; GBM[Glioblastoma multiforme], 6; Glioma Low Grade, 7; HNSC[Head and Neck squamous cell carcinoma], 8; KICH[Kidney Chromophobe], 9; KIRC[Kidney renal clear cell carcinoma], 10; KIRP[Kidney renal papillary cell carcinoma], 11; LAML[Acute Myeloid Leukemia], 12; LUAD[Lung adenocarcinoma], 13; LUSC[Lung squamous cell carcinoma], 14; OV[Ovarian serous cystadenocarcinoma ], 15; PAAD[Pancreatic adenocarcinoma], 16; PRAD[Prostate adenocarcinoma], 17; SKCM[Skin Cutaneous Melanoma], 18:STAD[Stomach adenocarcinoma], 19:THCA[Thyroid carcinoma], 20:UCEC[Uterine Corpus Endometrial Carcinoma]) |
| Top |
| * We represented just top 10 SNVs. When you move the cursor on each content, you can see more deailed mutation information on the Tooltip. Those are primary_site, primary_histology, mutation(aa), pubmedID. |
| Genomic Position | Mutation(aa) | Unique sampleID count |
| chr10:50954894 | p.A191T,OGDHL | 4 |
| chr10:50966551 | p.R30C,OGDHL | 3 |
| chr10:50952143 | p.S365F,OGDHL | 2 |
| chr10:50946288 | p.K355N,OGDHL | 2 |
| chr10:50952707 | p.E700K,OGDHL | 2 |
| chr10:50955201 | p.A571A,OGDHL | 2 |
| chr10:50952736 | p.R138R,OGDHL | 2 |
| chr10:50944432 | p.V219V,OGDHL | 2 |
| chr10:50954808 | p.R38H,OGDHL | 2 |
| chr10:50959882 | p.V218I,OGDHL | 2 |
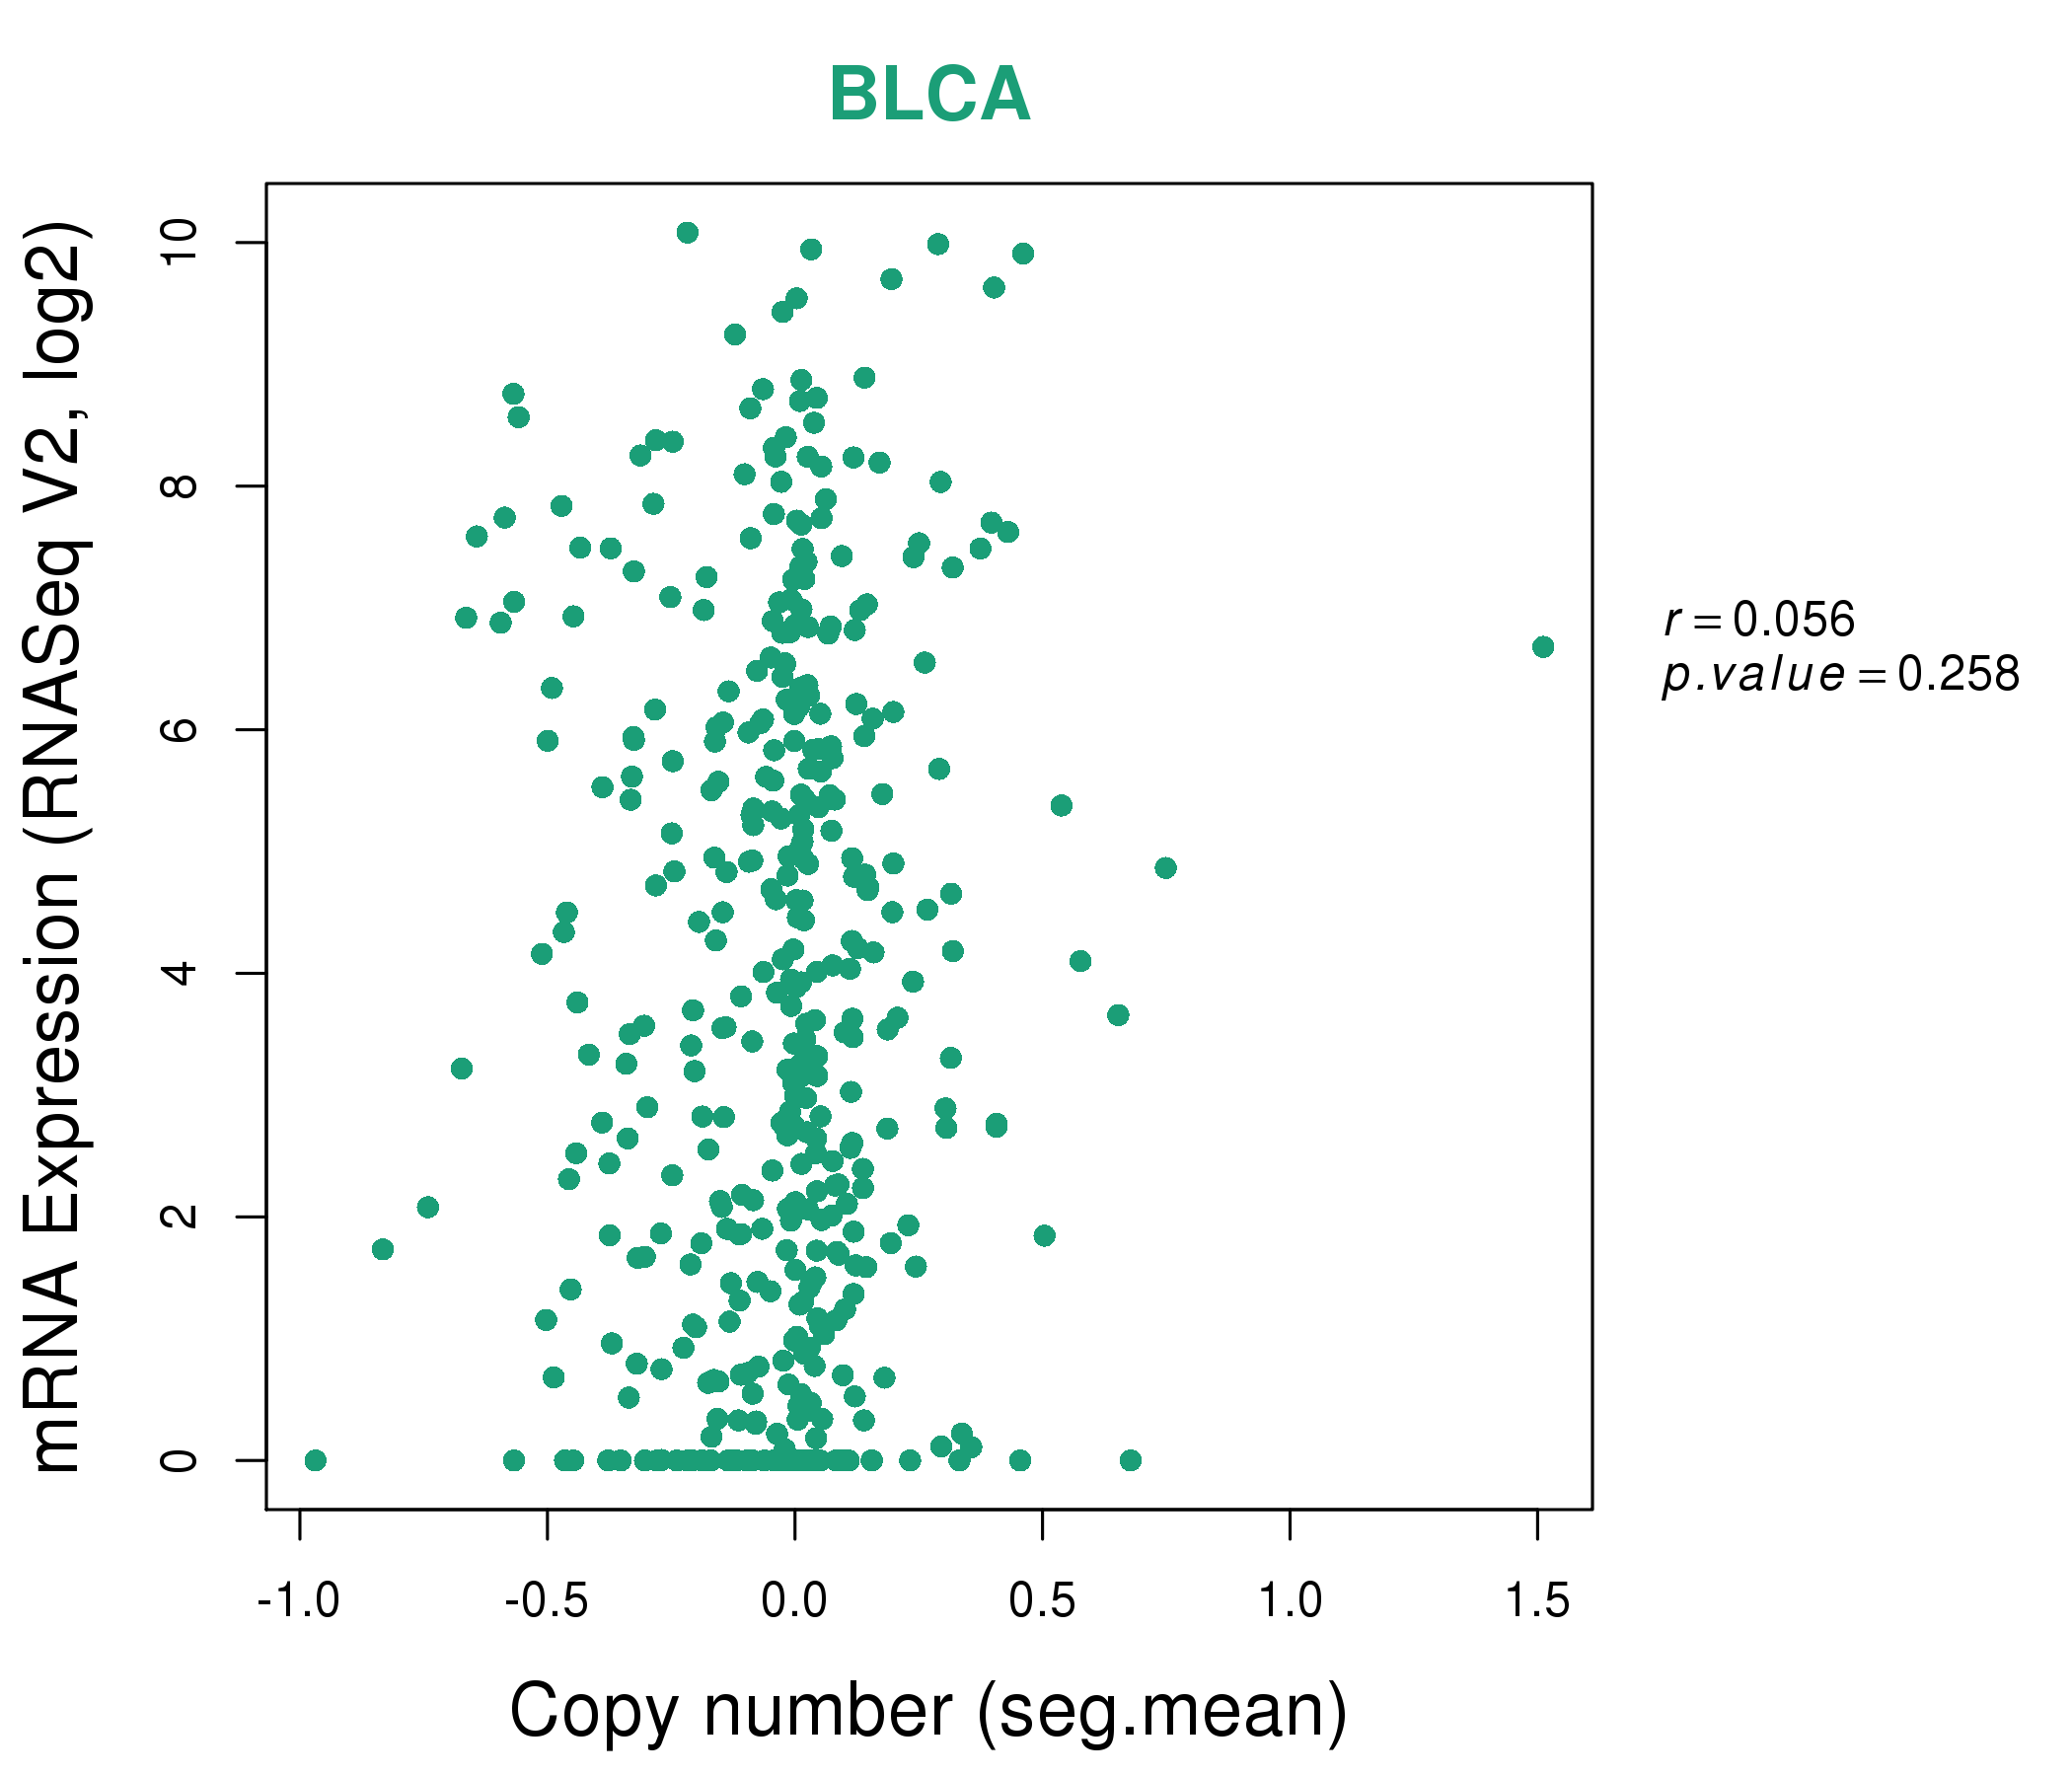
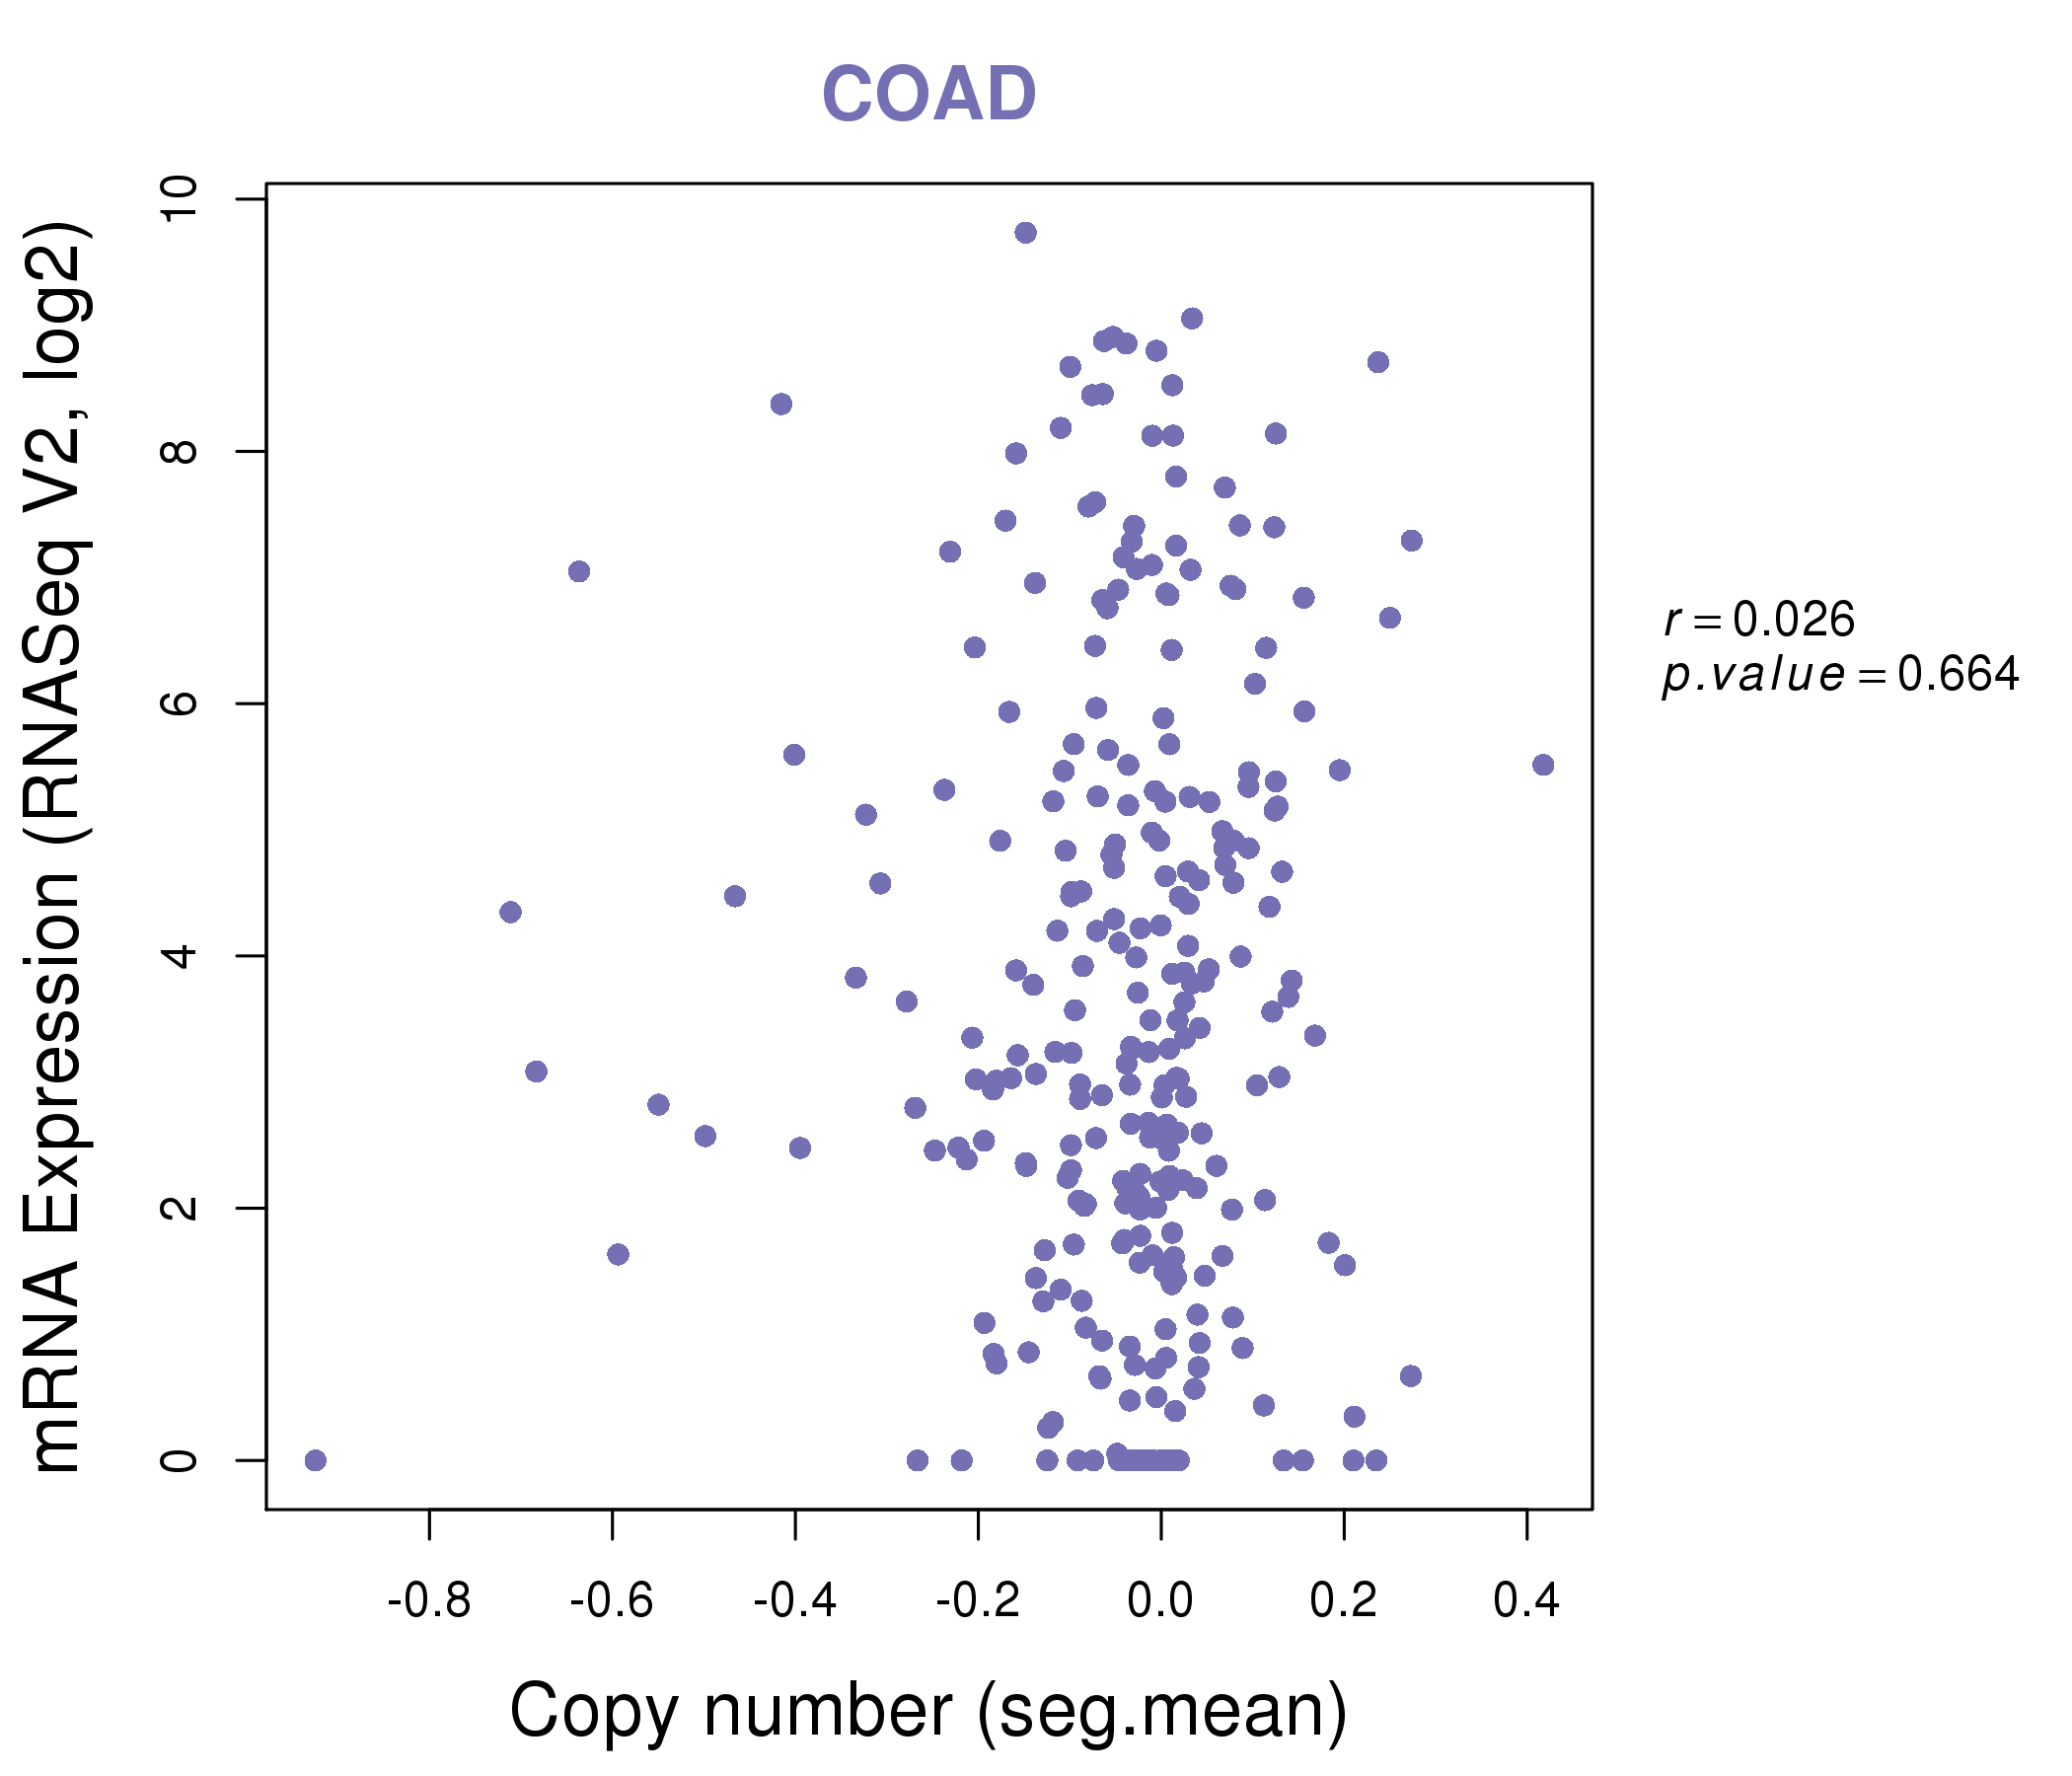
| * Copy number data were extracted from TCGA using R package TCGA-Assembler. The URLs of all public data files on TCGA DCC data server were gathered on Jan-05-2015. Function ProcessCNAData in TCGA-Assembler package was used to obtain gene-level copy number value which is calculated as the average copy number of the genomic region of a gene. |
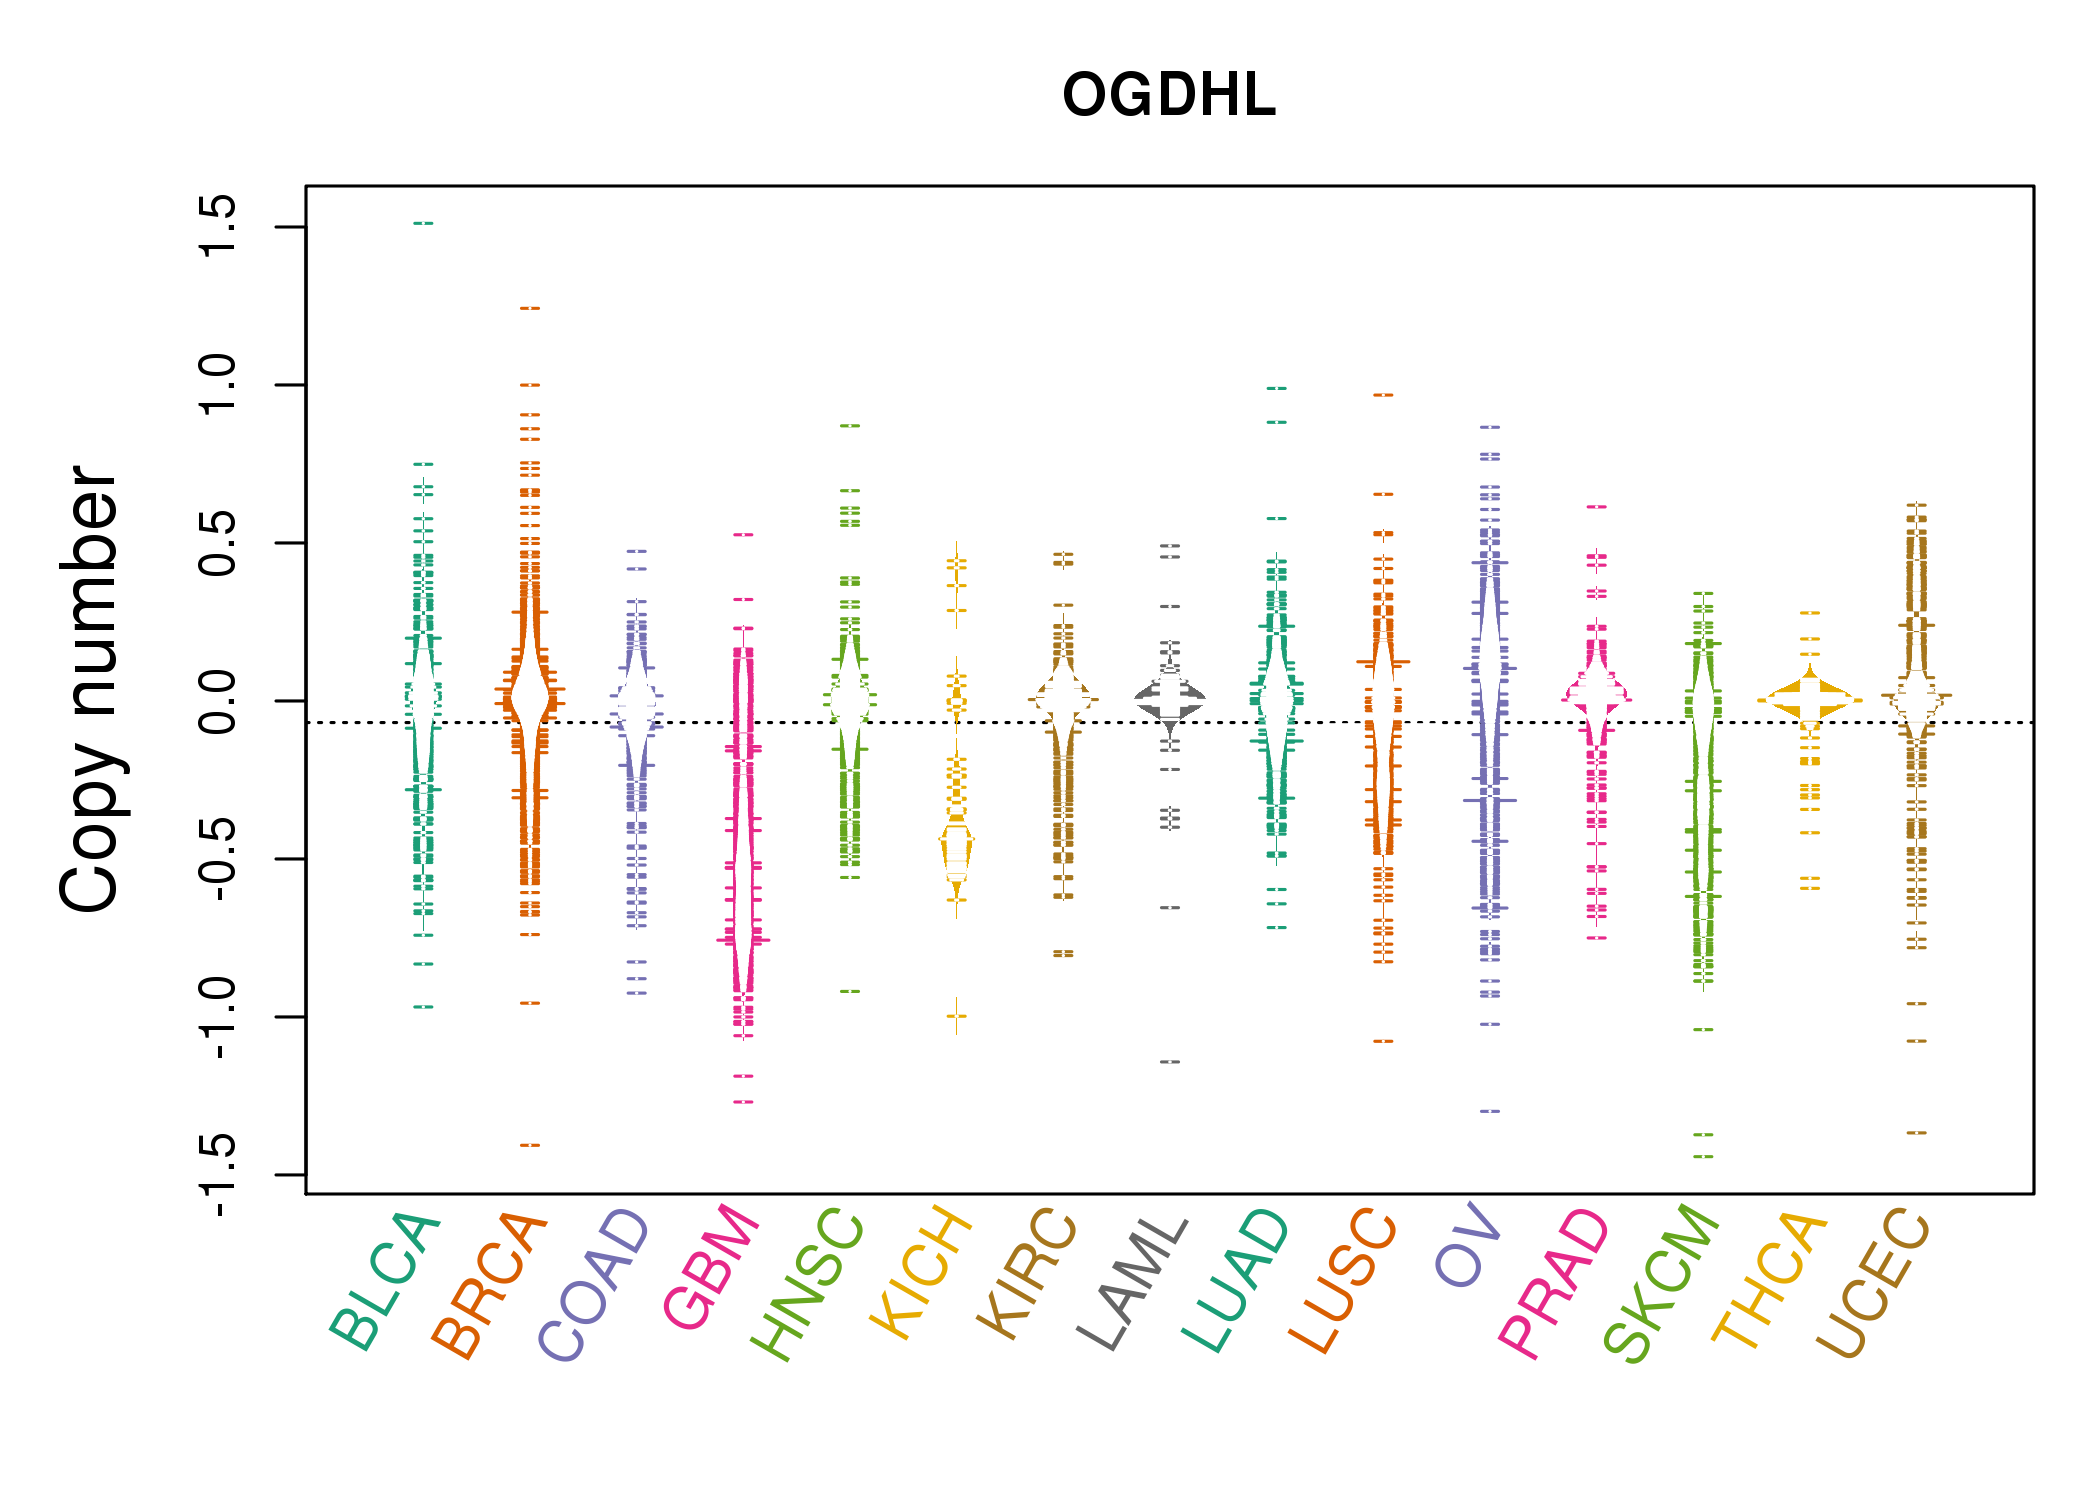 |
| cf) Tissue ID[Tissue type]: BLCA[Bladder Urothelial Carcinoma], BRCA[Breast invasive carcinoma], CESC[Cervical squamous cell carcinoma and endocervical adenocarcinoma], COAD[Colon adenocarcinoma], GBM[Glioblastoma multiforme], Glioma Low Grade, HNSC[Head and Neck squamous cell carcinoma], KICH[Kidney Chromophobe], KIRC[Kidney renal clear cell carcinoma], KIRP[Kidney renal papillary cell carcinoma], LAML[Acute Myeloid Leukemia], LUAD[Lung adenocarcinoma], LUSC[Lung squamous cell carcinoma], OV[Ovarian serous cystadenocarcinoma ], PAAD[Pancreatic adenocarcinoma], PRAD[Prostate adenocarcinoma], SKCM[Skin Cutaneous Melanoma], STAD[Stomach adenocarcinoma], THCA[Thyroid carcinoma], UCEC[Uterine Corpus Endometrial Carcinoma] |
| Top |
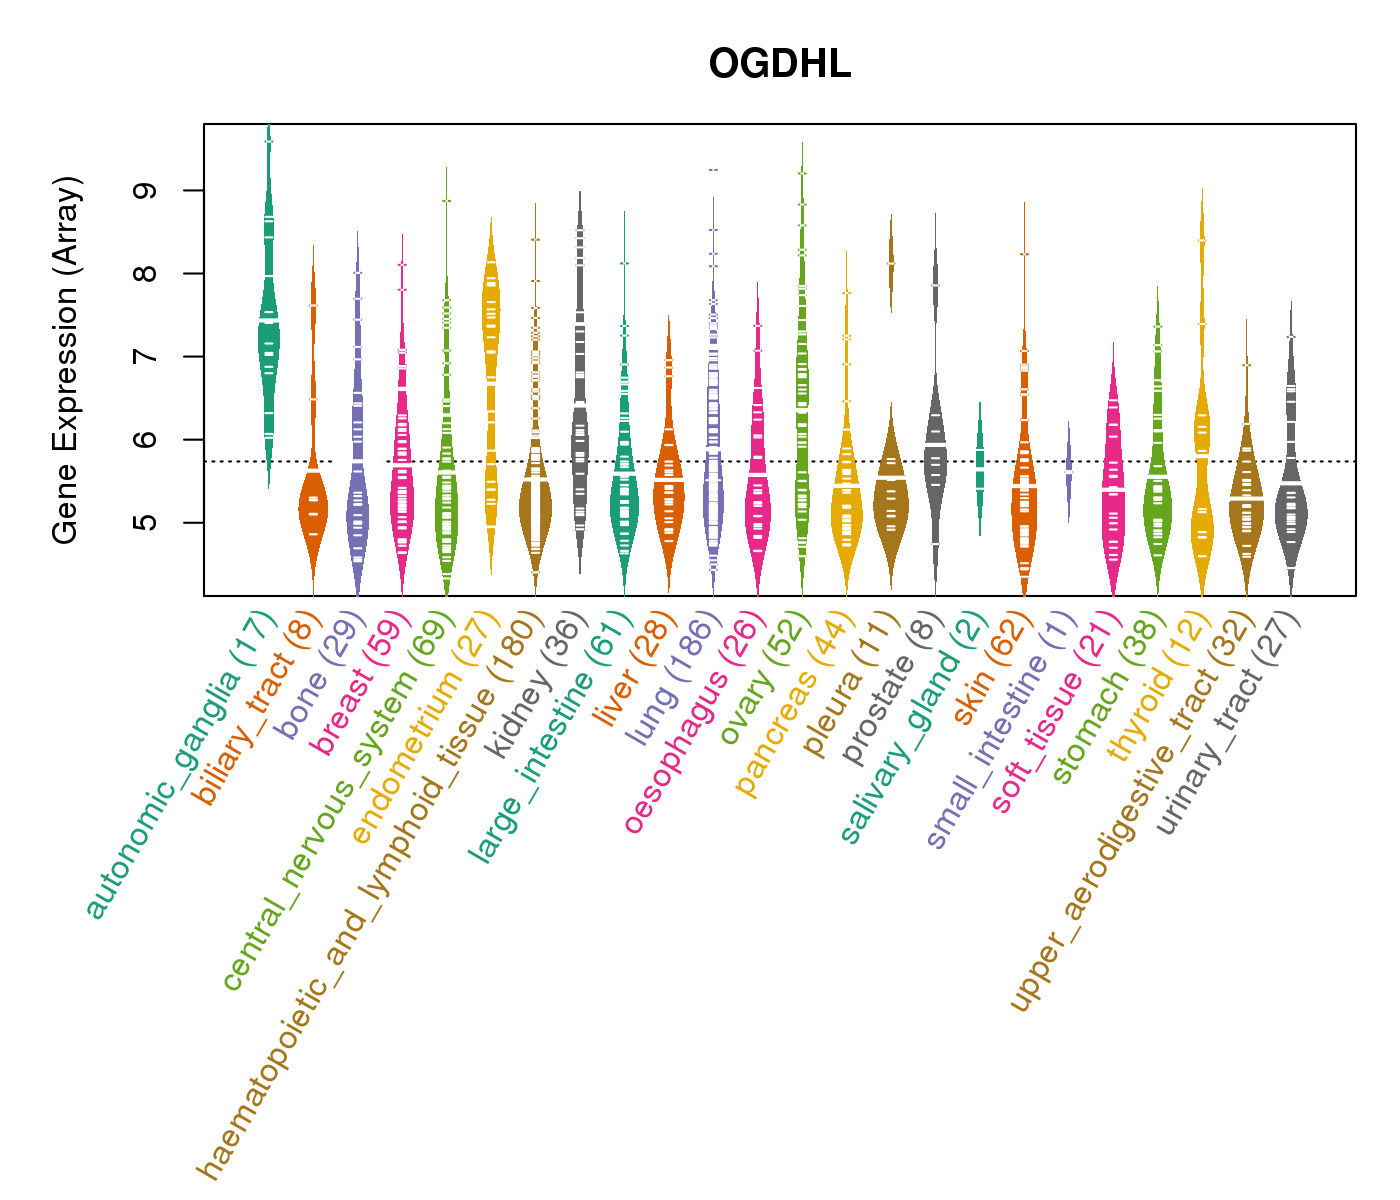
| Gene Expression for OGDHL |
| * CCLE gene expression data were extracted from CCLE_Expression_Entrez_2012-10-18.res: Gene-centric RMA-normalized mRNA expression data. |
 |
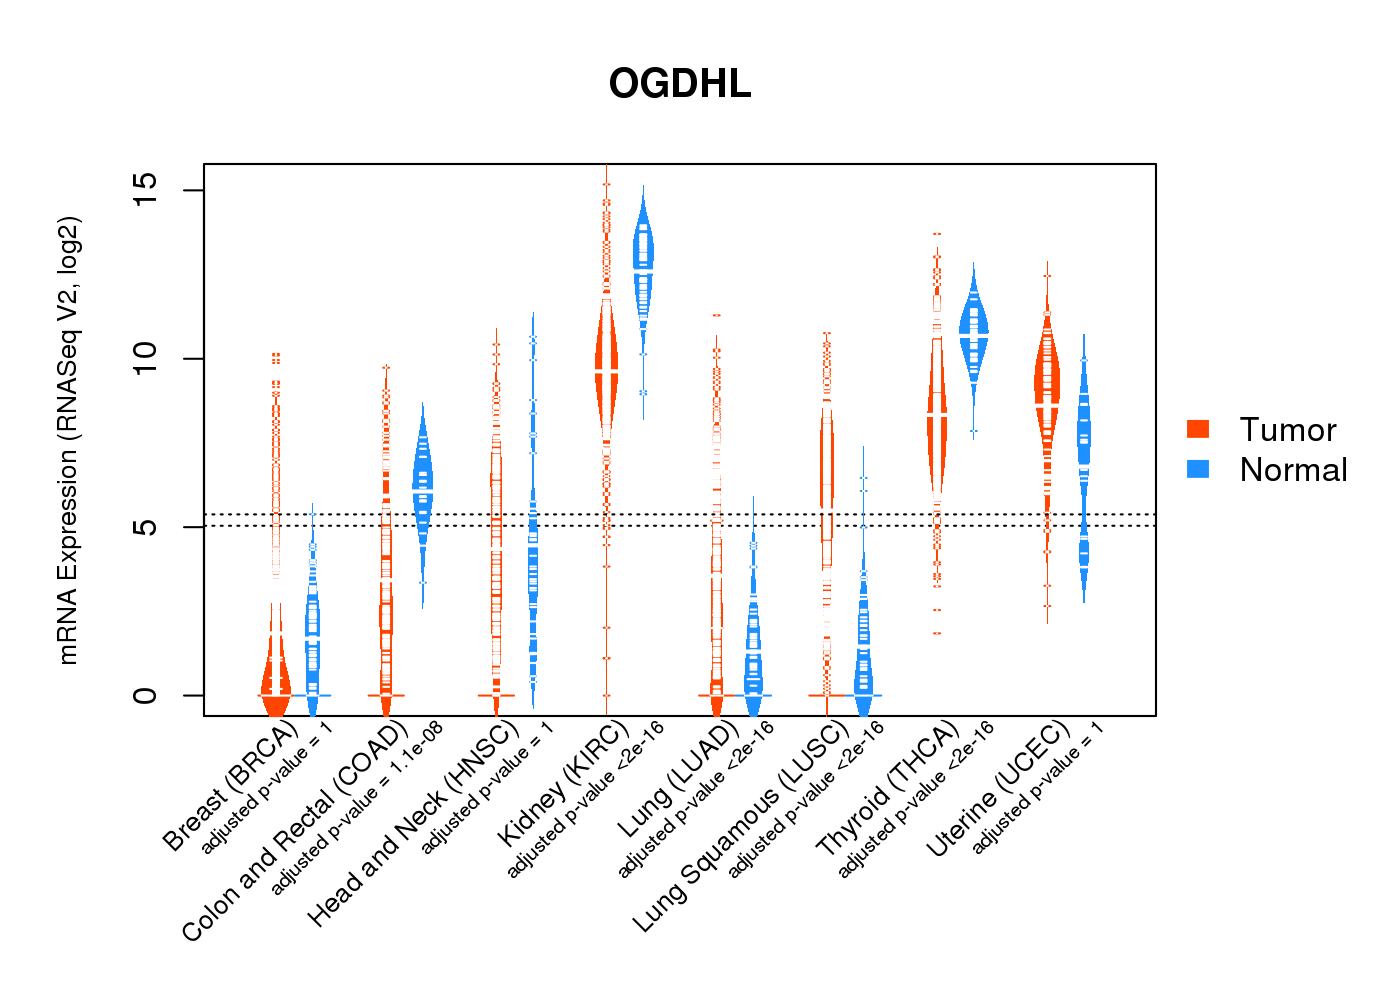
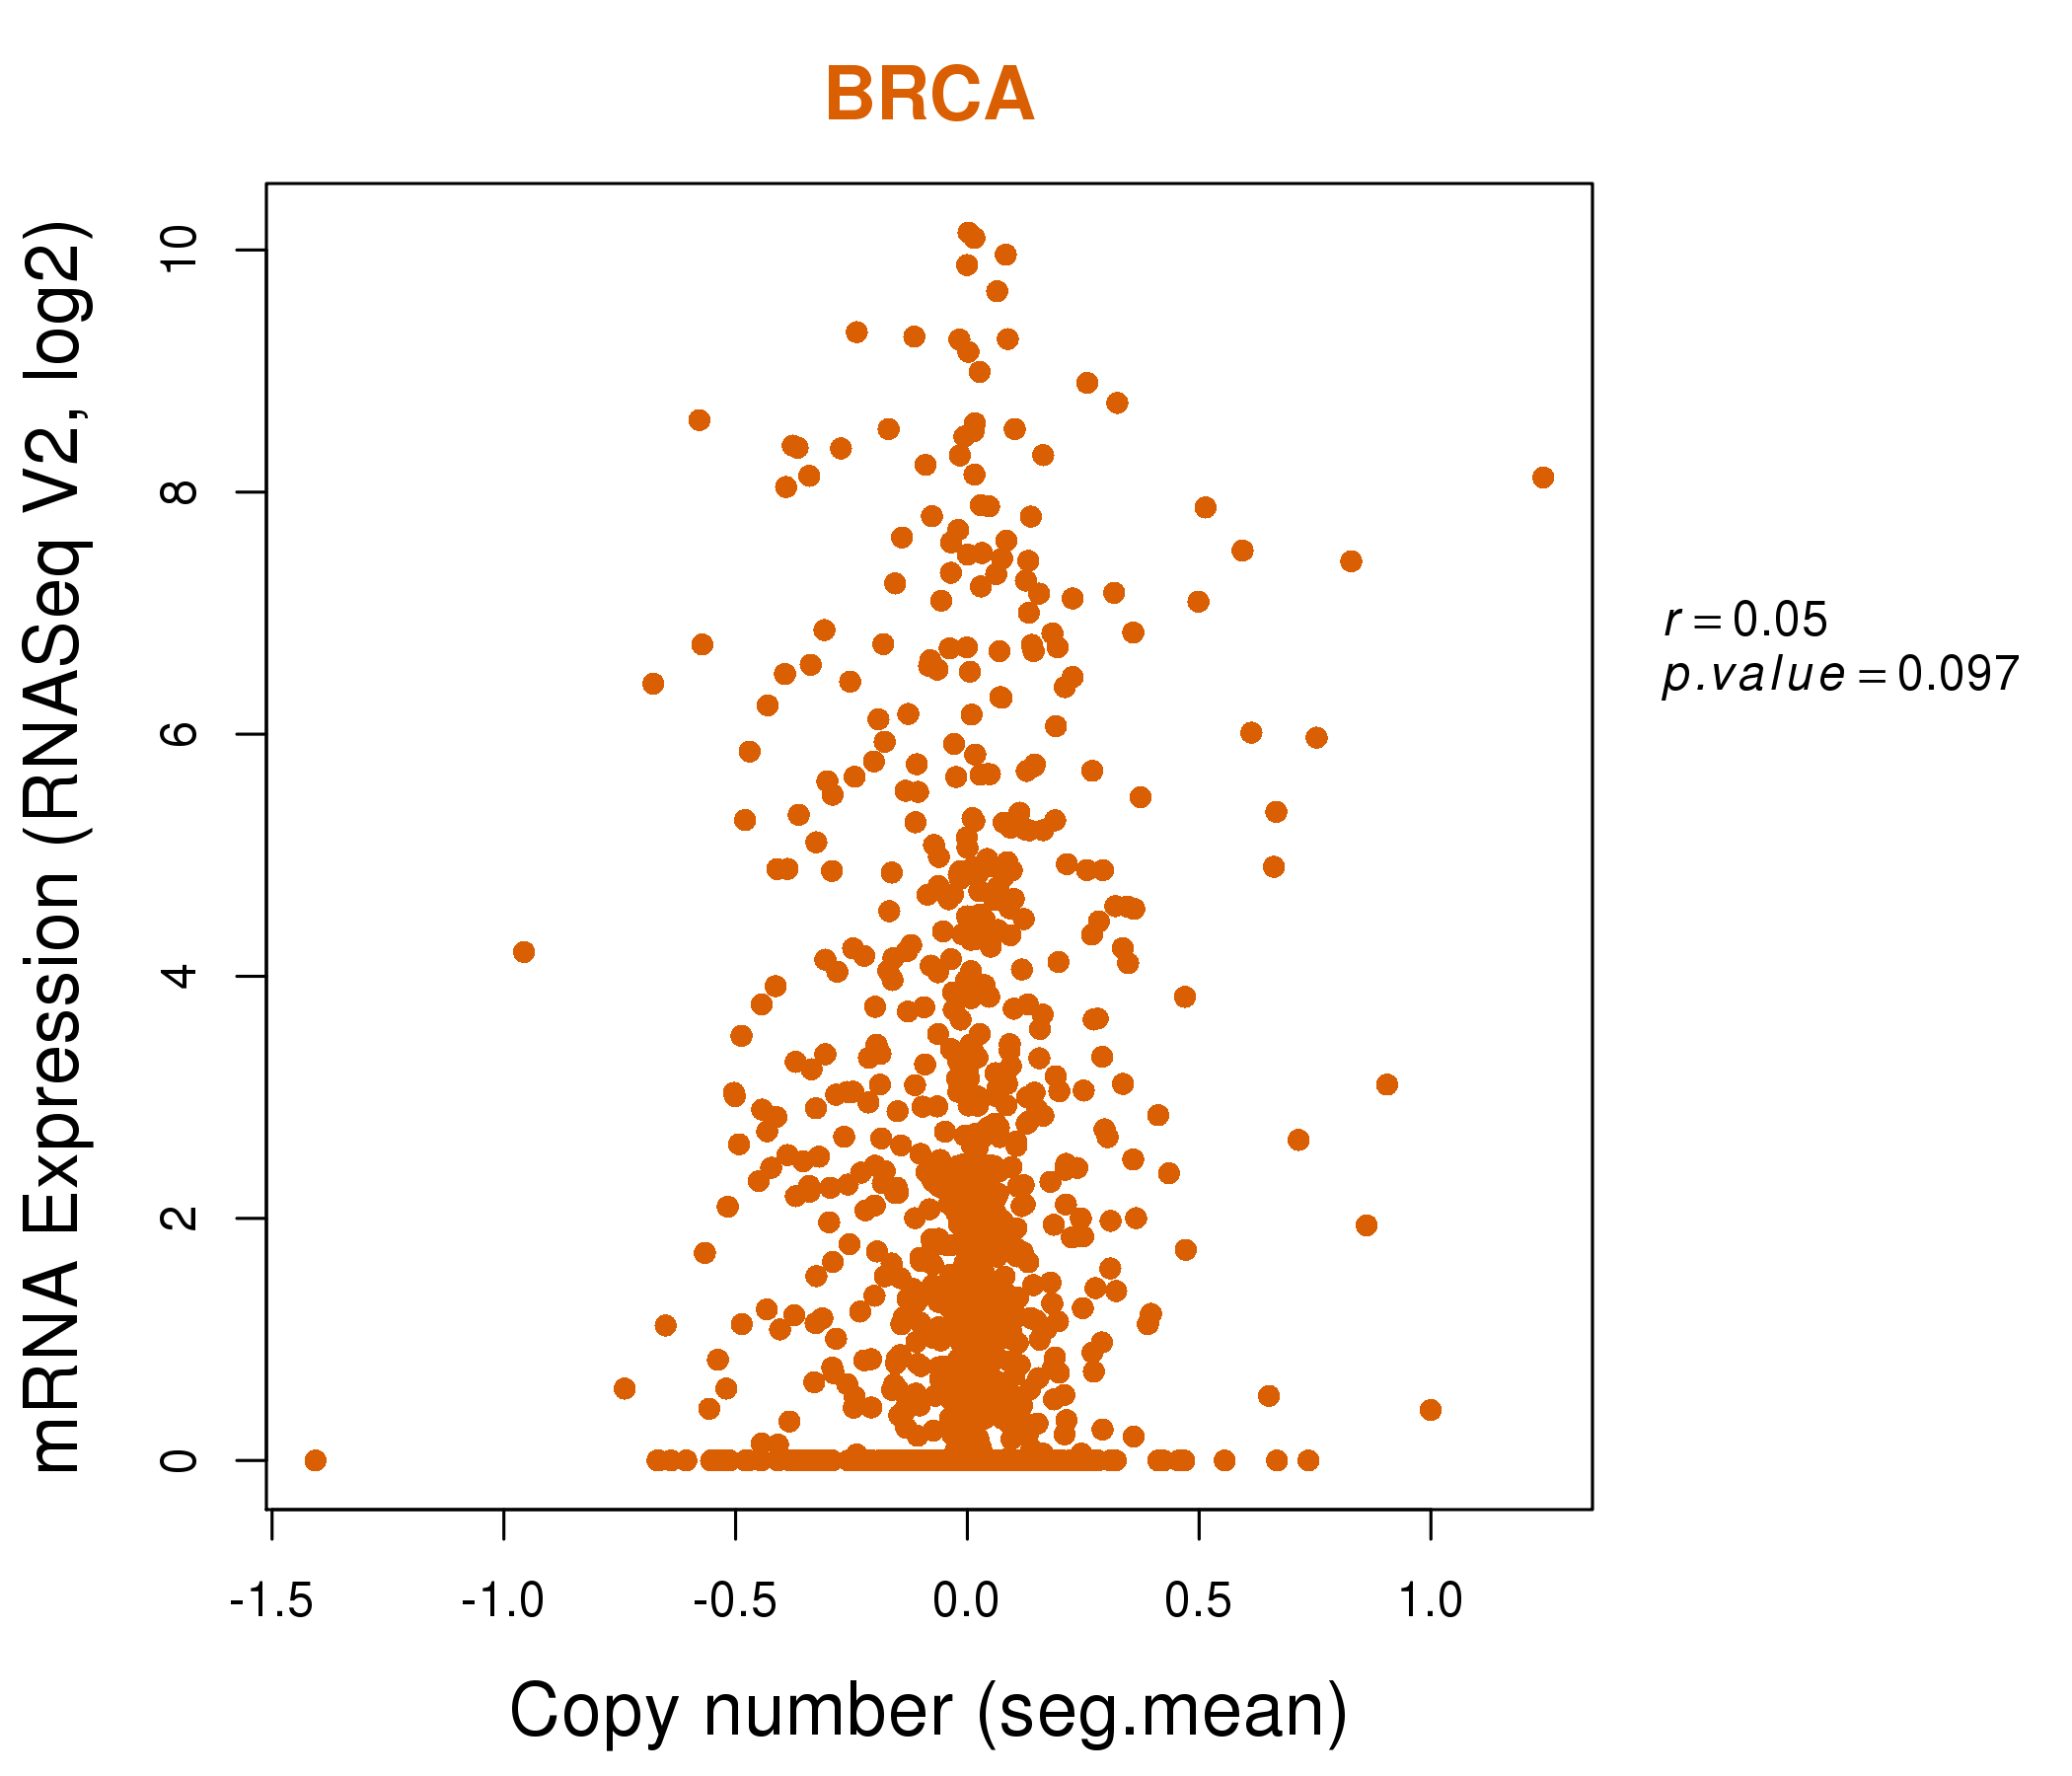
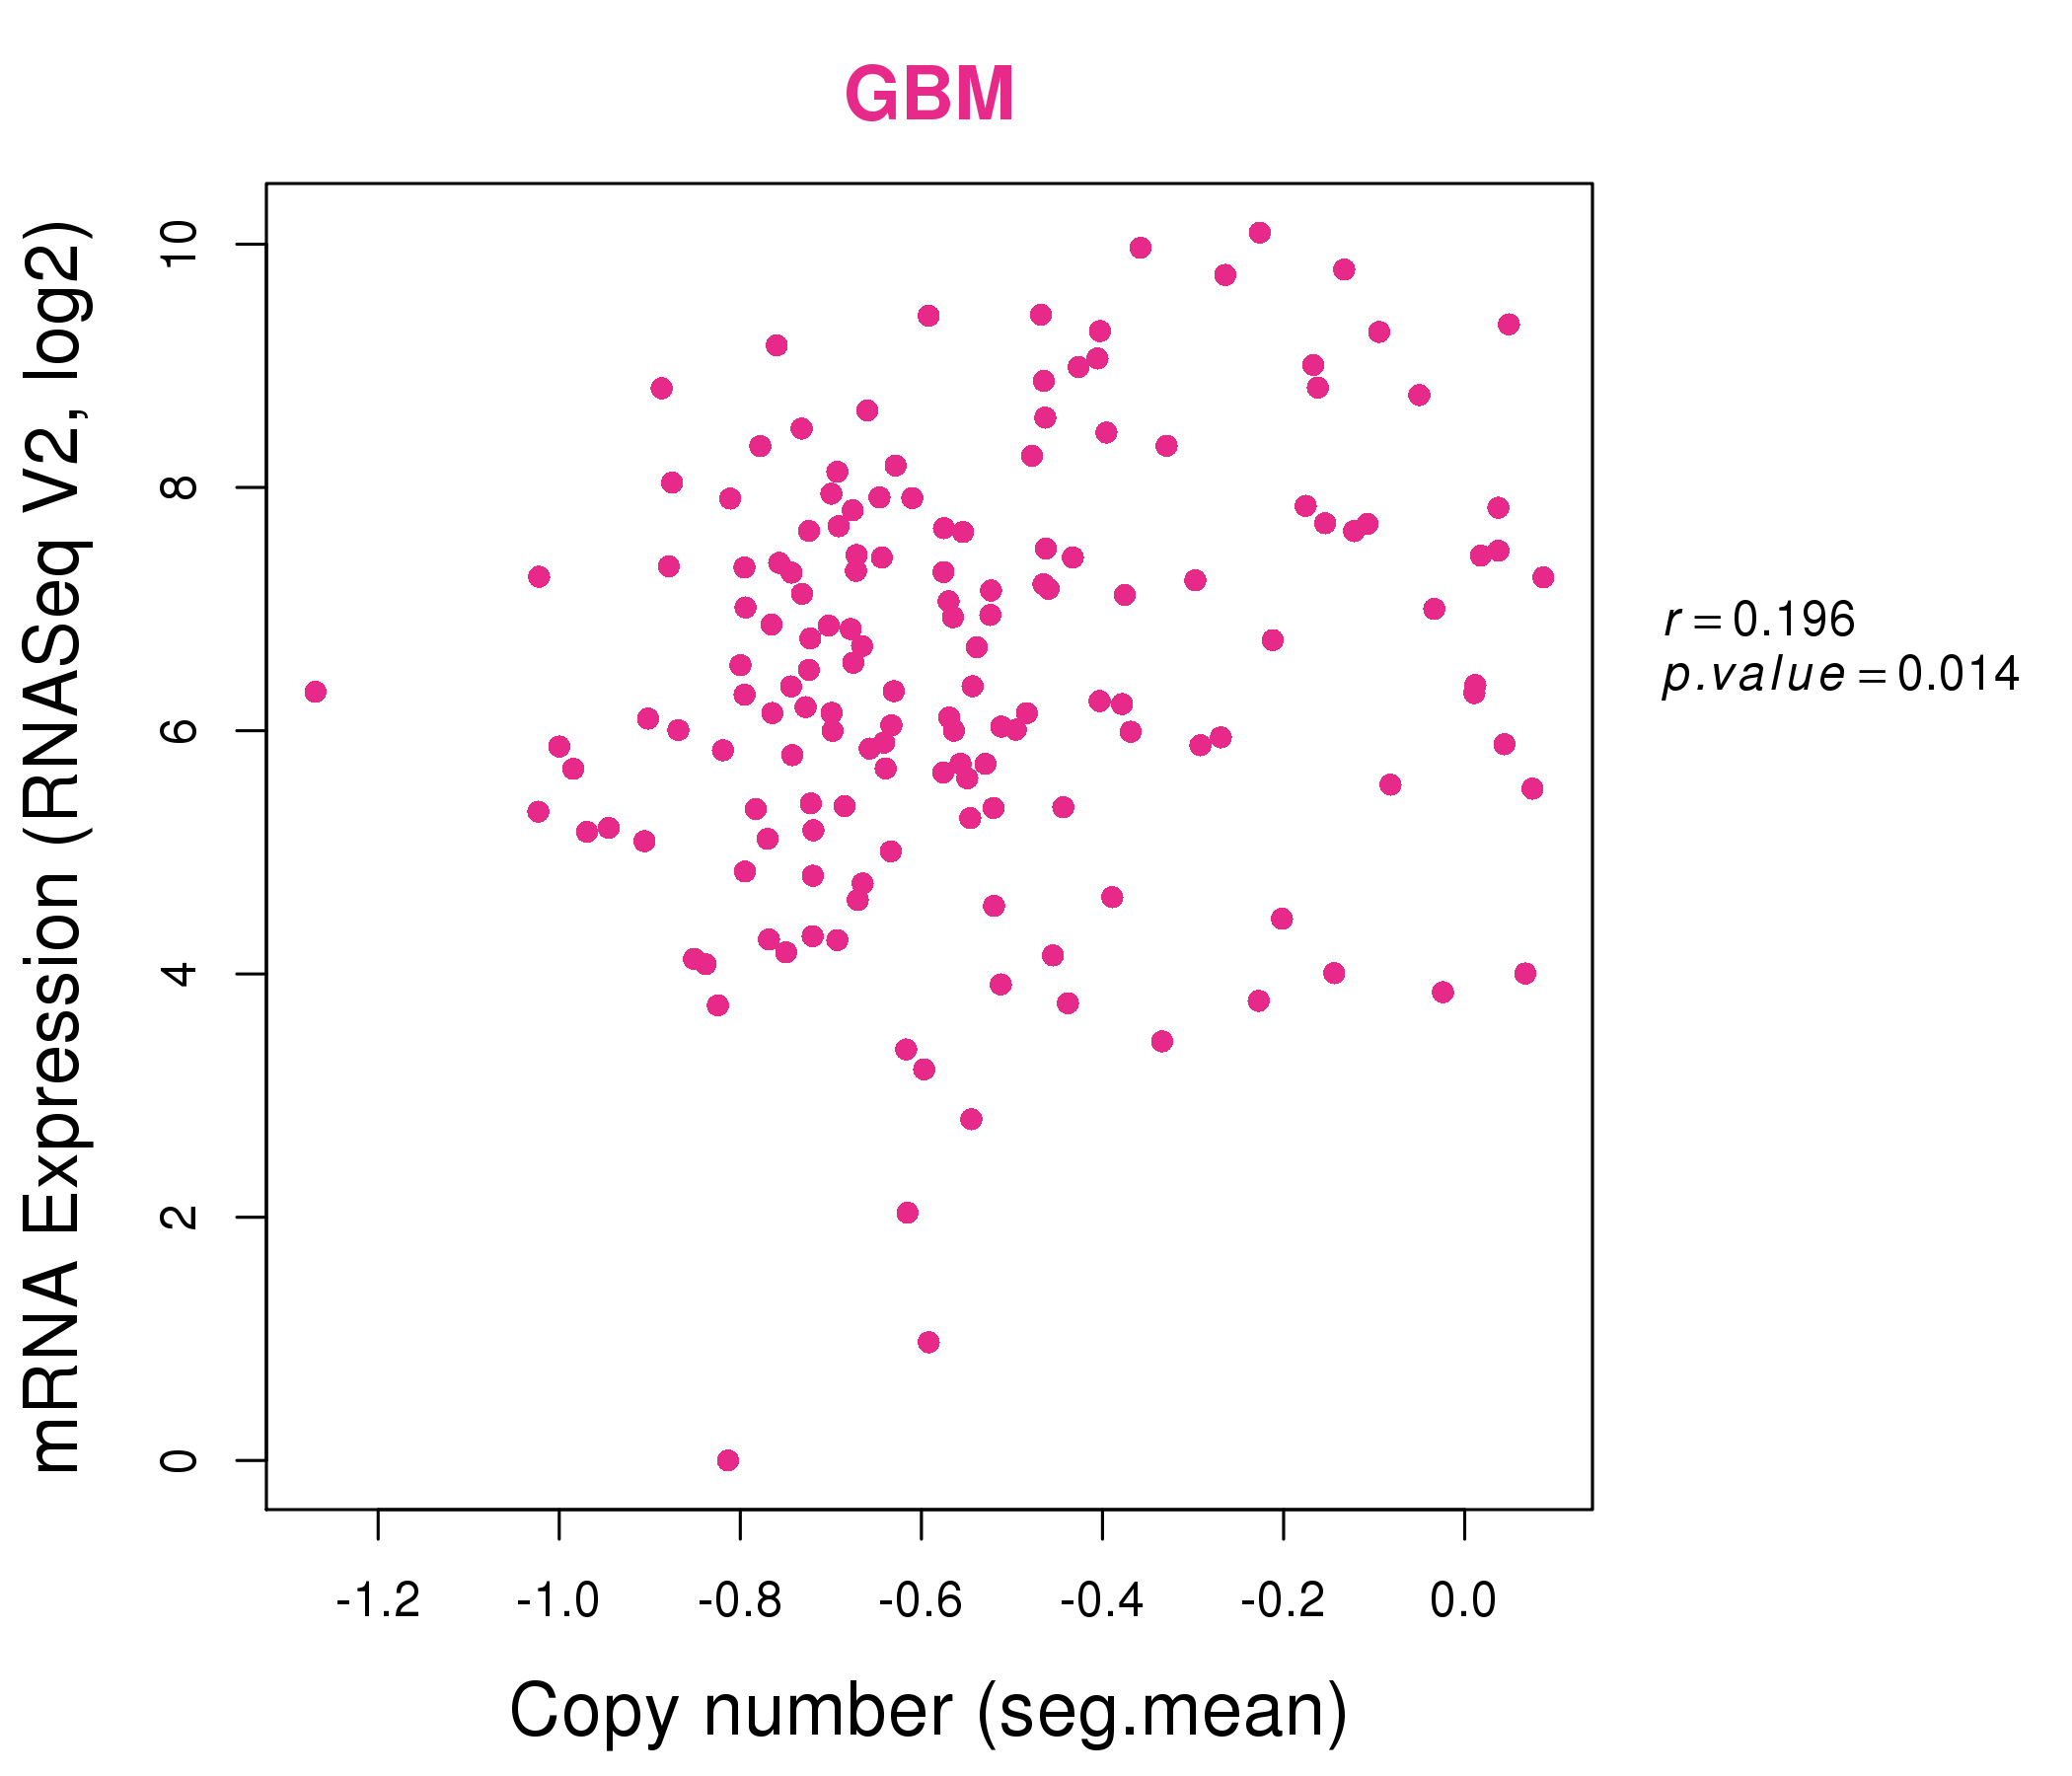
| * Normalized gene expression data of RNASeqV2 was extracted from TCGA using R package TCGA-Assembler. The URLs of all public data files on TCGA DCC data server were gathered at Jan-05-2015. Only eight cancer types have enough normal control samples for differential expression analysis. (t test, adjusted p<0.05 (using Benjamini-Hochberg FDR)) |
 |
| Top |
| * This plots show the correlation between CNV and gene expression. |
: Open all plots for all cancer types
 |
|
 |
|
| Top |
| Gene-Gene Network Information |
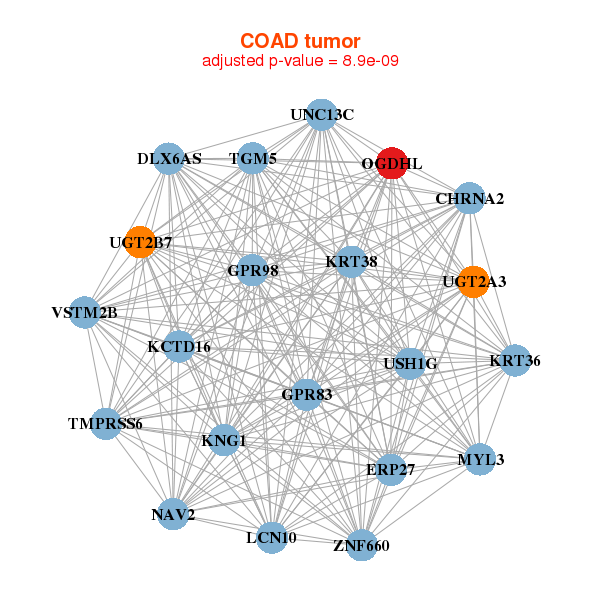
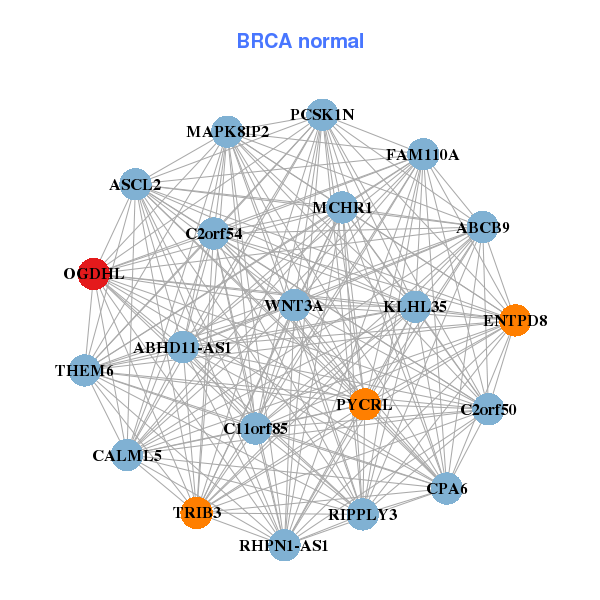
| * Co-Expression network figures were drawn using R package igraph. Only the top 20 genes with the highest correlations were shown. Red circle: input gene, orange circle: cell metabolism gene, sky circle: other gene |
: Open all plots for all cancer types
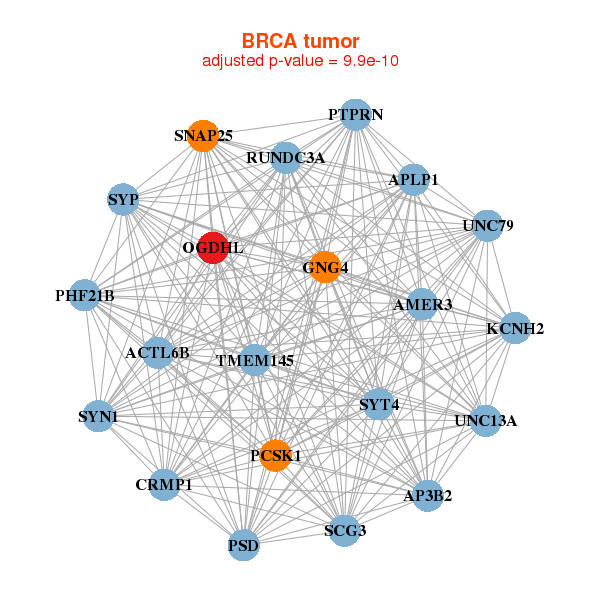 |
|
| ACTL6B,AP3B2,APLP1,CRMP1,AMER3,GNG4,KCNH2, UNC79,OGDHL,PCSK1,PHF21B,PSD,PTPRN,RUNDC3A, SCG3,SNAP25,SYN1,SYP,SYT4,TMEM145,UNC13A | ABCB9,ASCL2,C11orf85,C2orf50,C2orf54,RHPN1-AS1,THEM6, CALML5,CPA6,RIPPLY3,ENTPD8,FAM110A,KLHL35,MAPK8IP2, MCHR1,OGDHL,PCSK1N,PYCRL,TRIB3,ABHD11-AS1,WNT3A |
 |
|
| CHRNA2,DLX6AS,ERP27,GPR83,GPR98,KCTD16,KNG1, KRT36,KRT38,LCN10,MYL3,NAV2,OGDHL,TGM5, TMPRSS6,UGT2A3,UGT2B7,UNC13C,USH1G,VSTM2B,ZNF660 | AEBP1,AFAP1L2,ARHGAP20,BMX,CHAT,CORO2B,EMX2, EMX2OS,GSPT2,HOXD3,HOXD8,HTR3E,KLK13,MAN1C1, MEGF9,MFGE8,OGDHL,PCDHGA9,SH2D7,TMEM150C,TSPYL1 |
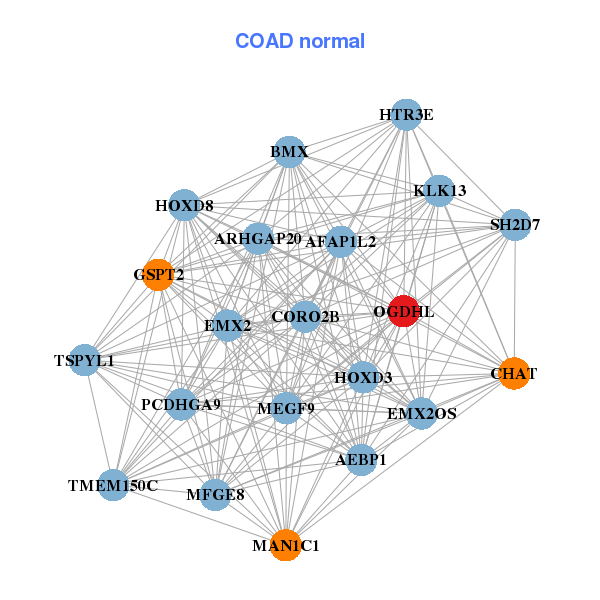
| * Co-Expression network figures were drawn using R package igraph. Only the top 20 genes with the highest correlations were shown. Red circle: input gene, orange circle: cell metabolism gene, sky circle: other gene |
: Open all plots for all cancer types
| Top |
: Open all interacting genes' information including KEGG pathway for all interacting genes from DAVID
| Top |
| Pharmacological Information for OGDHL |
| There's no related Drug. |
| Top |
| Cross referenced IDs for OGDHL |
| * We obtained these cross-references from Uniprot database. It covers 150 different DBs, 18 categories. http://www.uniprot.org/help/cross_references_section |
: Open all cross reference information
|
Copyright © 2016-Present - The Univsersity of Texas Health Science Center at Houston @ |