|
||||||||||||||||||||||||||||||||||||||||||||||||||||||||||||||||||||||||||||||||||||||||||||||||||||||||||||||||||||||||||||||||||||||||||||||||||||||||||||||||||||||||||||||||||||||||||||||||||||||||||||||||||||||||||||||||||||||||||||||||||||||||||||||||||||||||||||||||||||||||||||||||||||||||||||||||||||||||||
| |
| Phenotypic Information (metabolism pathway, cancer, disease, phenome) |
| |
| |
| Gene-Gene Network Information: Co-Expression Network, Interacting Genes & KEGG |
| |
|


| Gene Summary for CSGALNACT1 |
| Top |
| Phenotypic Information for CSGALNACT1(metabolism pathway, cancer, disease, phenome) |
| Cancer | CGAP: CSGALNACT1 |
| Familial Cancer Database: CSGALNACT1 | |
| * This gene is included in those cancer gene databases. |
|
|
|
|
|
|
| ||||||||||||||||||||||||||||||||||||||||||||||||||||||||||||||||||||||||||||||||||||||||||||||||||||||||||||||||||||||||||||||||||||||||||||||||||||||||||||||||||||||||||||||||||||||||||||||||||||||||||||||||||||||||||||||||||||||||||||||||||||||||||||||||||||||||||||||||||||||||||||||||||||||||||||||||||||
Oncogene 1 | Significant driver gene in | |||||||||||||||||||||||||||||||||||||||||||||||||||||||||||||||||||||||||||||||||||||||||||||||||||||||||||||||||||||||||||||||||||||||||||||||||||||||||||||||||||||||||||||||||||||||||||||||||||||||||||||||||||||||||||||||||||||||||||||||||||||||||||||||||||||||||||||||||||||||||||||||||||||||||||||||||||||||||
| cf) number; DB name 1 Oncogene; http://nar.oxfordjournals.org/content/35/suppl_1/D721.long, 2 Tumor Suppressor gene; https://bioinfo.uth.edu/TSGene/, 3 Cancer Gene Census; http://www.nature.com/nrc/journal/v4/n3/abs/nrc1299.html, 4 CancerGenes; http://nar.oxfordjournals.org/content/35/suppl_1/D721.long, 5 Network of Cancer Gene; http://ncg.kcl.ac.uk/index.php, 1Therapeutic Vulnerabilities in Cancer; http://cbio.mskcc.org/cancergenomics/statius/ |
| REACTOME_METABOLISM_OF_CARBOHYDRATES | |
| Mutations for CSGALNACT1 |
| * Under tables are showing count per each tissue to give us broad intuition about tissue specific mutation patterns.You can go to the detailed page for each mutation database's web site. |
| - Statistics for Tissue and Mutation type | Top |
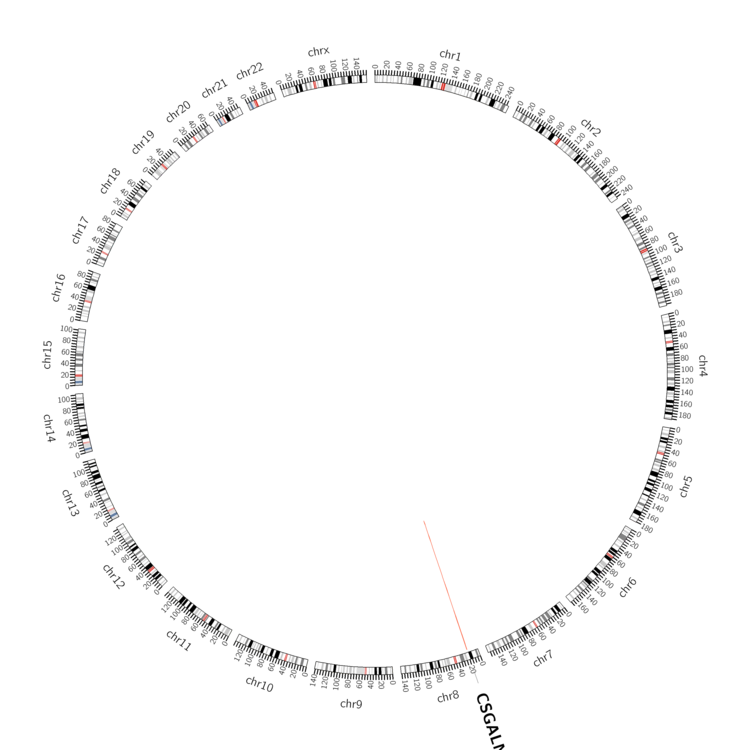 |
| - For Inter-chromosomal Variations |
| There's no inter-chromosomal structural variation. |
| - For Intra-chromosomal Variations |
| * Intra-chromosomal variantions includes 'intrachromosomal amplicon to amplicon', 'intrachromosomal amplicon to non-amplified dna', 'intrachromosomal deletion', 'intrachromosomal fold-back inversion', 'intrachromosomal inversion', 'intrachromosomal tandem duplication', 'Intrachromosomal unknown type', 'intrachromosomal with inverted orientation', 'intrachromosomal with non-inverted orientation'. |
 |
| Sample | Symbol_a | Chr_a | Start_a | End_a | Symbol_b | Chr_b | Start_b | End_b |
| ovary | CSGALNACT1 | chr8 | 19314788 | 19314808 | CSGALNACT1 | chr8 | 19314912 | 19314932 |
| ovary | CSGALNACT1 | chr8 | 19533956 | 19533976 | CSGALNACT1 | chr8 | 19536386 | 19536406 |
| cf) Tissue number; Tissue name (1;Breast, 2;Central_nervous_system, 3;Haematopoietic_and_lymphoid_tissue, 4;Large_intestine, 5;Liver, 6;Lung, 7;Ovary, 8;Pancreas, 9;Prostate, 10;Skin, 11;Soft_tissue, 12;Upper_aerodigestive_tract) |
| * From mRNA Sanger sequences, Chitars2.0 arranged chimeric transcripts. This table shows CSGALNACT1 related fusion information. |
| ID | Head Gene | Tail Gene | Accession | Gene_a | qStart_a | qEnd_a | Chromosome_a | tStart_a | tEnd_a | Gene_a | qStart_a | qEnd_a | Chromosome_a | tStart_a | tEnd_a |
| DB148679 | COPG2 | 1 | 411 | 7 | 130301920 | 130353577 | CSGALNACT1 | 407 | 513 | 8 | 19315938 | 19316044 | |
| DW420626 | CSGALNACT1 | 17 | 84 | 8 | 19589501 | 19589568 | CSGALNACT1 | 83 | 300 | 8 | 19591592 | 19591809 | |
| N52914 | CSGALNACT1 | 1 | 167 | 8 | 19300761 | 19300961 | LARGE | 152 | 586 | 22 | 33790310 | 33790740 | |
| CV347923 | CSGALNACT1 | 1 | 157 | 8 | 19513474 | 19513629 | RNF144B | 144 | 163 | 6 | 18439868 | 18439887 | |
| Top |
| Mutation type/ Tissue ID | brca | cns | cerv | endome | haematopo | kidn | Lintest | liver | lung | ns | ovary | pancre | prost | skin | stoma | thyro | urina | |||
| Total # sample | 3 | 2 | 1 | 3 | 1 | 1 | ||||||||||||||
| GAIN (# sample) | 1 | 1 | 1 | 1 | ||||||||||||||||
| LOSS (# sample) | 3 | 1 | 1 | 2 |
| cf) Tissue ID; Tissue type (1; Breast, 2; Central_nervous_system, 3; Cervix, 4; Endometrium, 5; Haematopoietic_and_lymphoid_tissue, 6; Kidney, 7; Large_intestine, 8; Liver, 9; Lung, 10; NS, 11; Ovary, 12; Pancreas, 13; Prostate, 14; Skin, 15; Stomach, 16; Thyroid, 17; Urinary_tract) |
| Top |
|
 |
| Top |
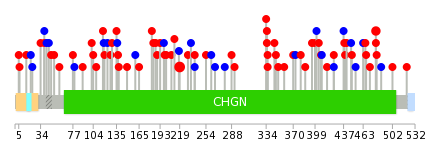
| Stat. for Non-Synonymous SNVs (# total SNVs=50) | (# total SNVs=20) |
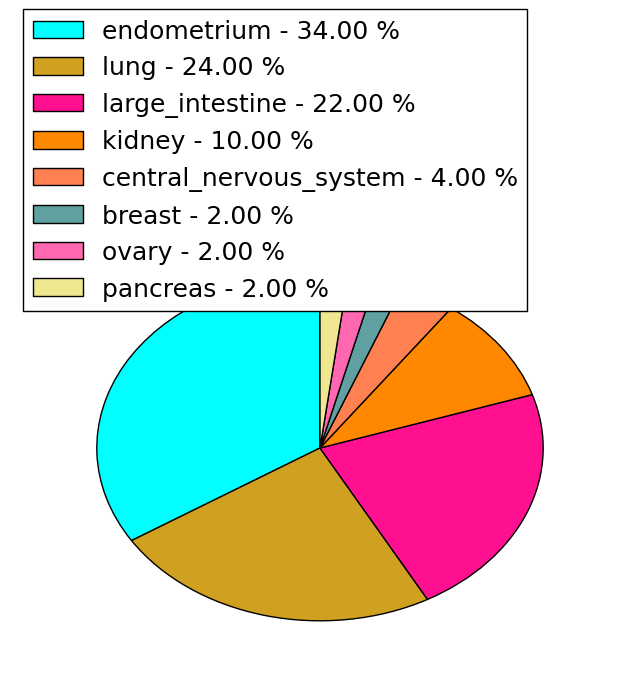 |  |
(# total SNVs=2) | (# total SNVs=0) |
 |
| Top |
| * When you move the cursor on each content, you can see more deailed mutation information on the Tooltip. Those are primary_site,primary_histology,mutation(aa),pubmedID. |
| GRCh37 position | Mutation(aa) | Unique sampleID count |
| chr8:19316132-19316132 | p.D219G | 4 |
| chr8:19363277-19363277 | p.C23* | 2 |
| chr8:19297442-19297443 | p.? | 2 |
| chr8:19277979-19277979 | p.S335Y | 2 |
| chr8:19263452-19263452 | p.R480C | 2 |
| chr8:19363229-19363229 | p.D39D | 2 |
| chr8:19316028-19316028 | p.E254K | 1 |
| chr8:19363035-19363035 | p.A104V | 1 |
| chr8:19266161-19266161 | p.G424G | 1 |
| chr8:19276254-19276254 | p.K380N | 1 |
| Top |
|
 |
| Point Mutation/ Tissue ID | 1 | 2 | 3 | 4 | 5 | 6 | 7 | 8 | 9 | 10 | 11 | 12 | 13 | 14 | 15 | 16 | 17 | 18 | 19 | 20 |
| # sample | 1 | 2 | 1 | 11 | 5 | 1 | 4 | 7 | 5 | 1 | 1 | 1 | 7 | 12 | 1 | 13 | ||||
| # mutation | 1 | 2 | 1 | 9 | 5 | 1 | 4 | 12 | 5 | 1 | 1 | 1 | 7 | 13 | 1 | 14 | ||||
| nonsynonymous SNV | 1 | 1 | 4 | 2 | 3 | 10 | 3 | 1 | 1 | 1 | 5 | 11 | 13 | |||||||
| synonymous SNV | 1 | 1 | 5 | 3 | 1 | 1 | 2 | 2 | 2 | 2 | 1 | 1 |
| cf) Tissue ID; Tissue type (1; BLCA[Bladder Urothelial Carcinoma], 2; BRCA[Breast invasive carcinoma], 3; CESC[Cervical squamous cell carcinoma and endocervical adenocarcinoma], 4; COAD[Colon adenocarcinoma], 5; GBM[Glioblastoma multiforme], 6; Glioma Low Grade, 7; HNSC[Head and Neck squamous cell carcinoma], 8; KICH[Kidney Chromophobe], 9; KIRC[Kidney renal clear cell carcinoma], 10; KIRP[Kidney renal papillary cell carcinoma], 11; LAML[Acute Myeloid Leukemia], 12; LUAD[Lung adenocarcinoma], 13; LUSC[Lung squamous cell carcinoma], 14; OV[Ovarian serous cystadenocarcinoma ], 15; PAAD[Pancreatic adenocarcinoma], 16; PRAD[Prostate adenocarcinoma], 17; SKCM[Skin Cutaneous Melanoma], 18:STAD[Stomach adenocarcinoma], 19:THCA[Thyroid carcinoma], 20:UCEC[Uterine Corpus Endometrial Carcinoma]) |
| Top |
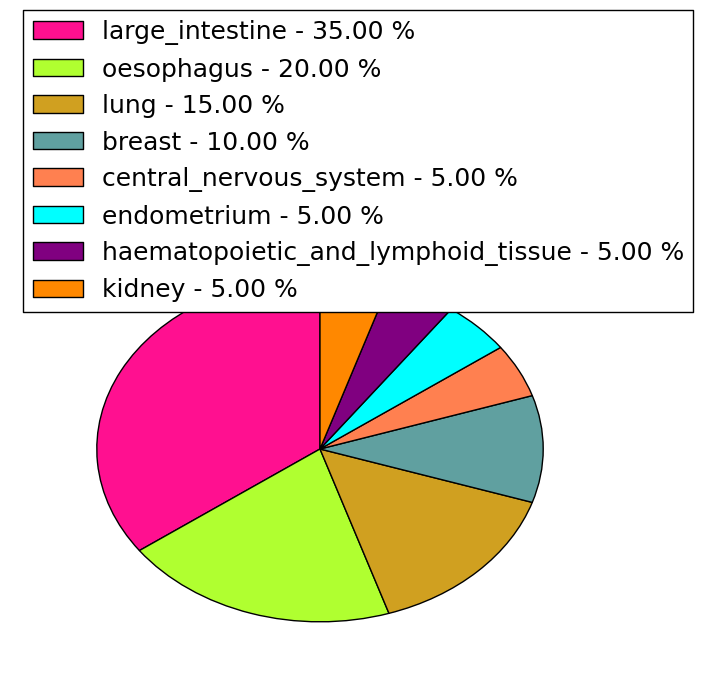
| * We represented just top 10 SNVs. When you move the cursor on each content, you can see more deailed mutation information on the Tooltip. Those are primary_site, primary_histology, mutation(aa), pubmedID. |
| Genomic Position | Mutation(aa) | Unique sampleID count |
| chr8:19316132 | p.D219G,CSGALNACT1 | 4 |
| chr8:19277950 | p.L239L,CSGALNACT1 | 2 |
| chr8:19316071 | p.H399N,CSGALNACT1 | 2 |
| chr8:19277979 | p.G212V,CSGALNACT1 | 2 |
| chr8:19316153 | p.R480C,CSGALNACT1 | 2 |
| chr8:19263452 | p.R345S,CSGALNACT1 | 2 |
| chr8:19363042 | p.S335F,CSGALNACT1 | 2 |
| chr8:19276199 | p.D102N,CSGALNACT1 | 2 |
| chr8:19362961 | p.I266I,CSGALNACT1 | 1 |
| chr8:19277935 | p.I184T,CSGALNACT1 | 1 |
| * Copy number data were extracted from TCGA using R package TCGA-Assembler. The URLs of all public data files on TCGA DCC data server were gathered on Jan-05-2015. Function ProcessCNAData in TCGA-Assembler package was used to obtain gene-level copy number value which is calculated as the average copy number of the genomic region of a gene. |
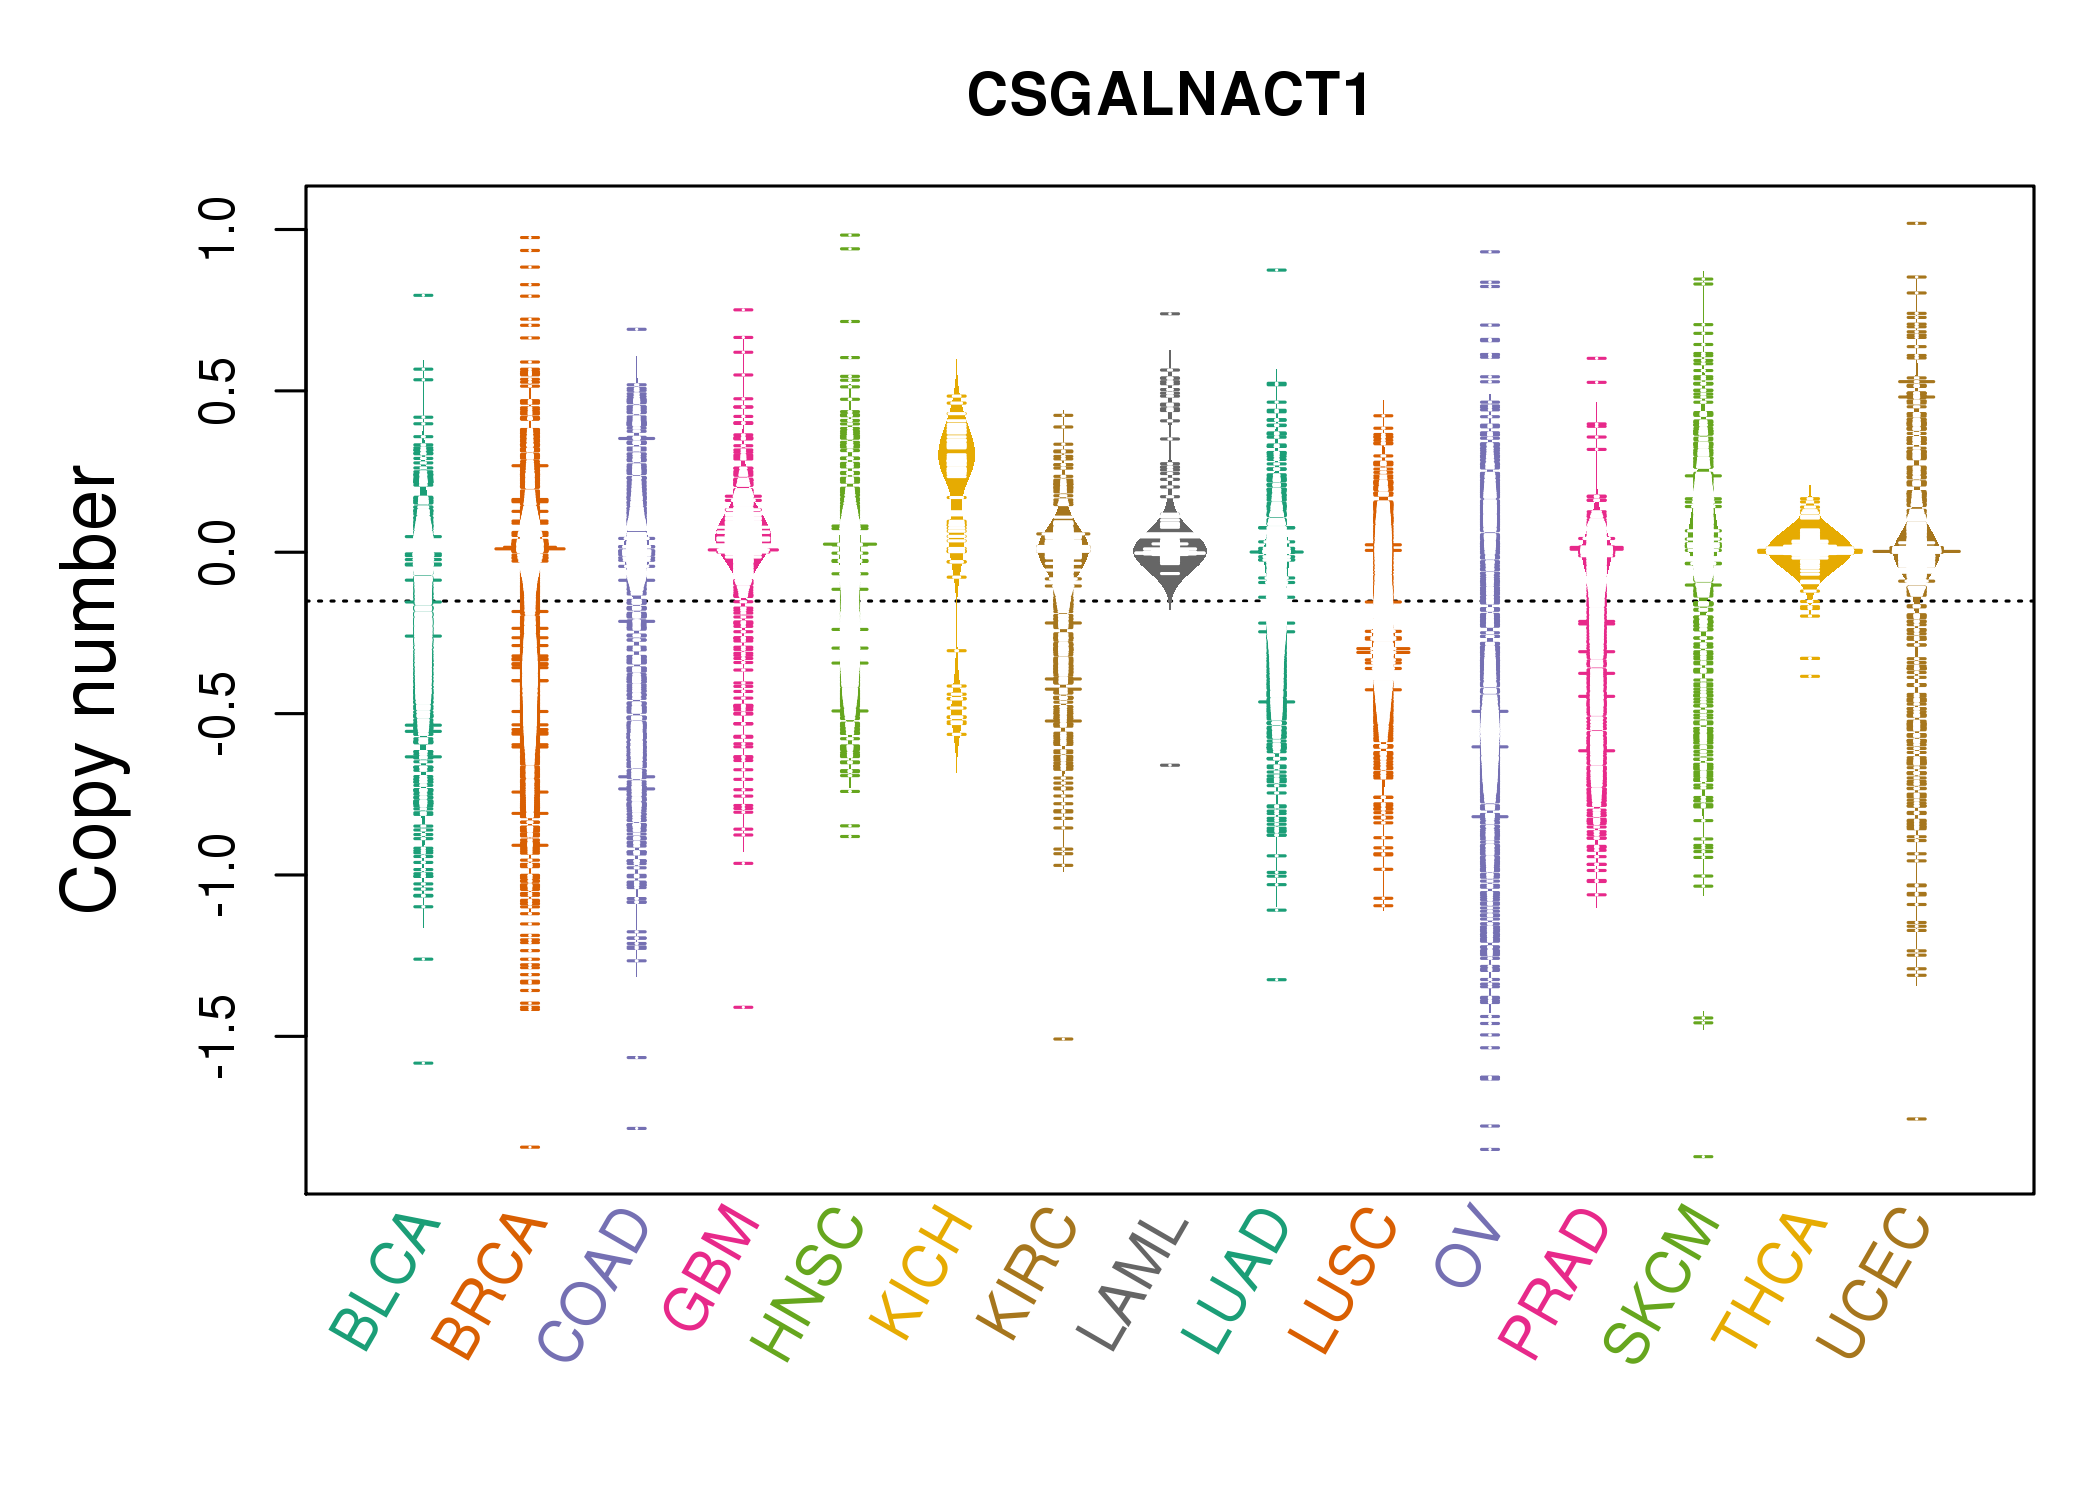 |
| cf) Tissue ID[Tissue type]: BLCA[Bladder Urothelial Carcinoma], BRCA[Breast invasive carcinoma], CESC[Cervical squamous cell carcinoma and endocervical adenocarcinoma], COAD[Colon adenocarcinoma], GBM[Glioblastoma multiforme], Glioma Low Grade, HNSC[Head and Neck squamous cell carcinoma], KICH[Kidney Chromophobe], KIRC[Kidney renal clear cell carcinoma], KIRP[Kidney renal papillary cell carcinoma], LAML[Acute Myeloid Leukemia], LUAD[Lung adenocarcinoma], LUSC[Lung squamous cell carcinoma], OV[Ovarian serous cystadenocarcinoma ], PAAD[Pancreatic adenocarcinoma], PRAD[Prostate adenocarcinoma], SKCM[Skin Cutaneous Melanoma], STAD[Stomach adenocarcinoma], THCA[Thyroid carcinoma], UCEC[Uterine Corpus Endometrial Carcinoma] |
| Top |
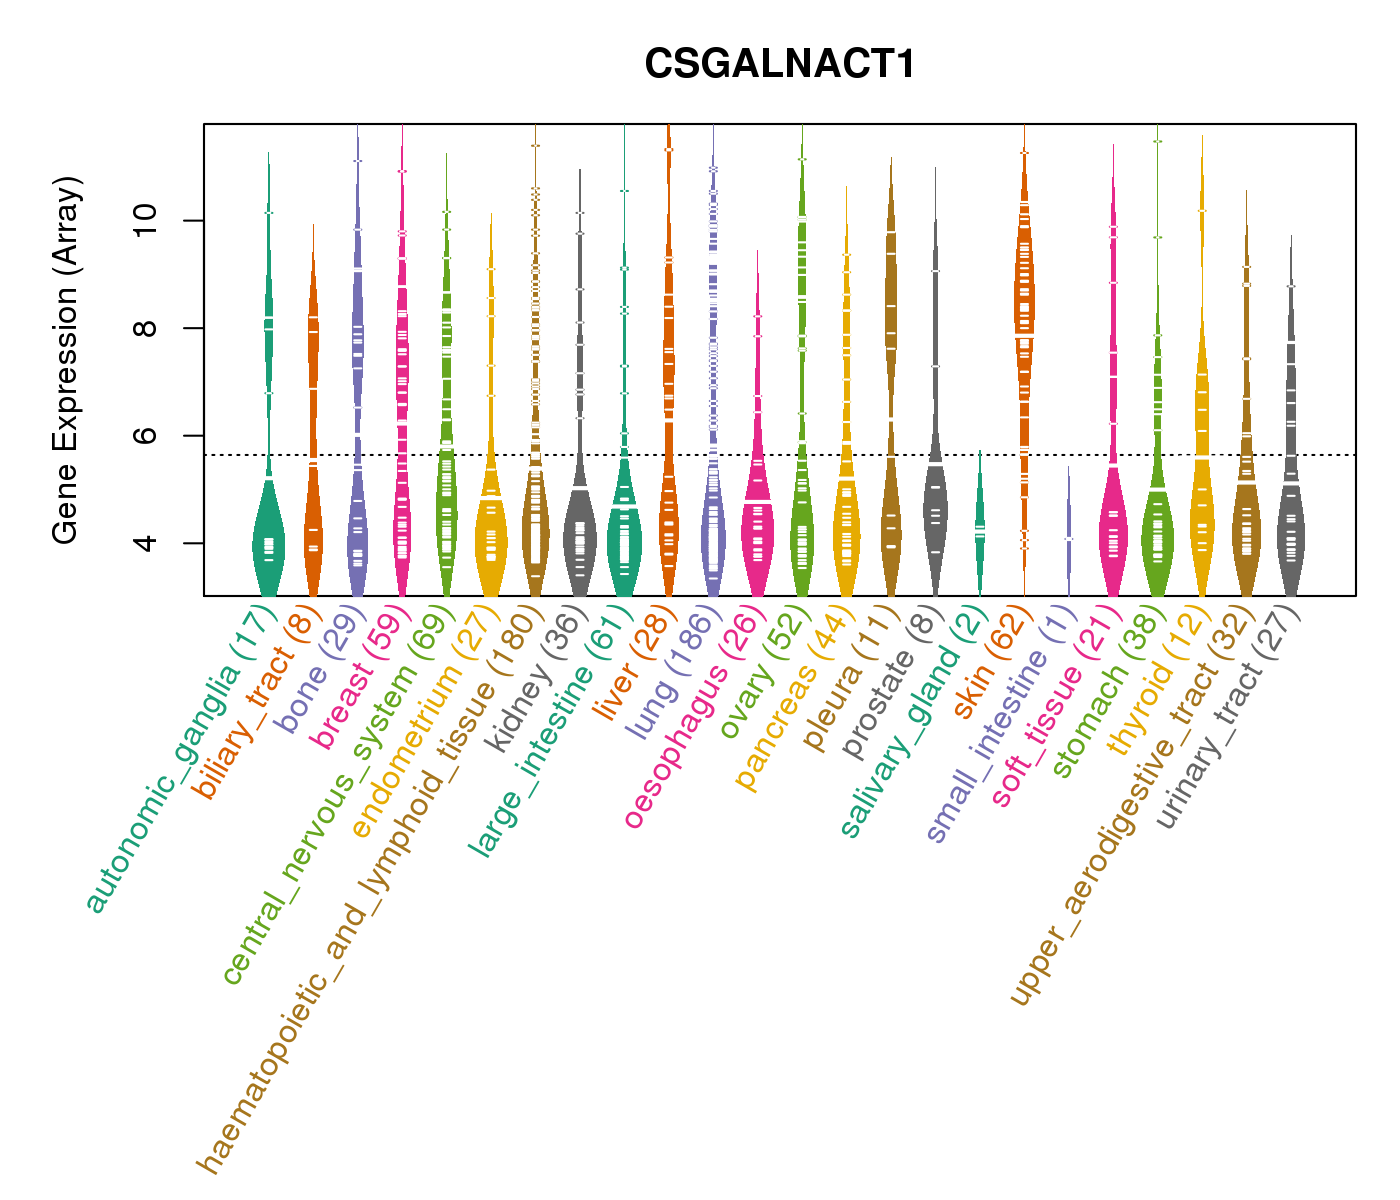
| Gene Expression for CSGALNACT1 |
| * CCLE gene expression data were extracted from CCLE_Expression_Entrez_2012-10-18.res: Gene-centric RMA-normalized mRNA expression data. |
 |
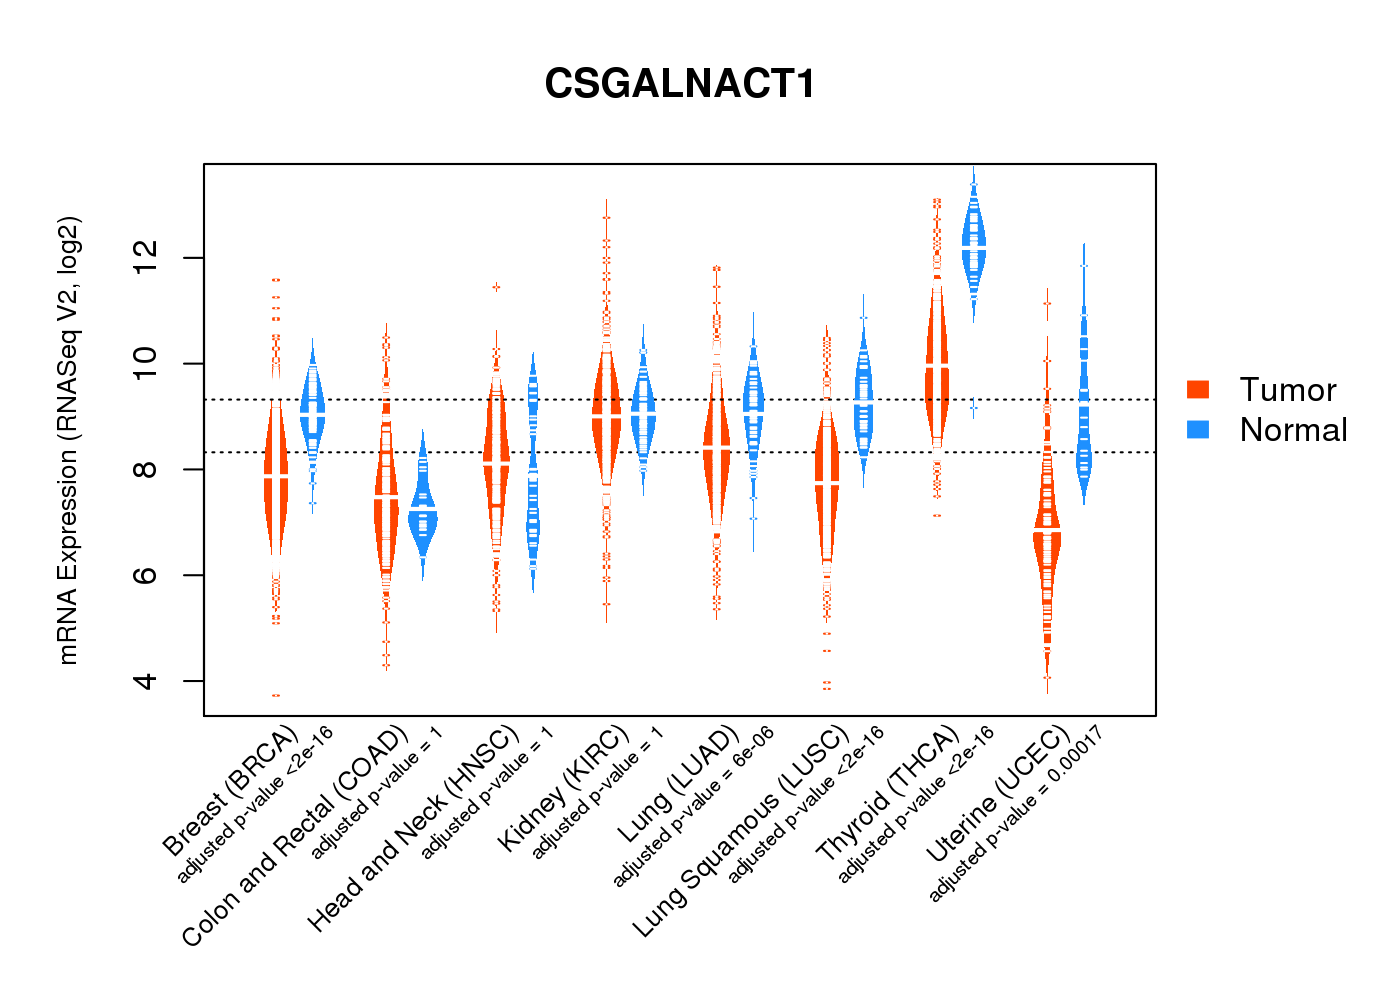
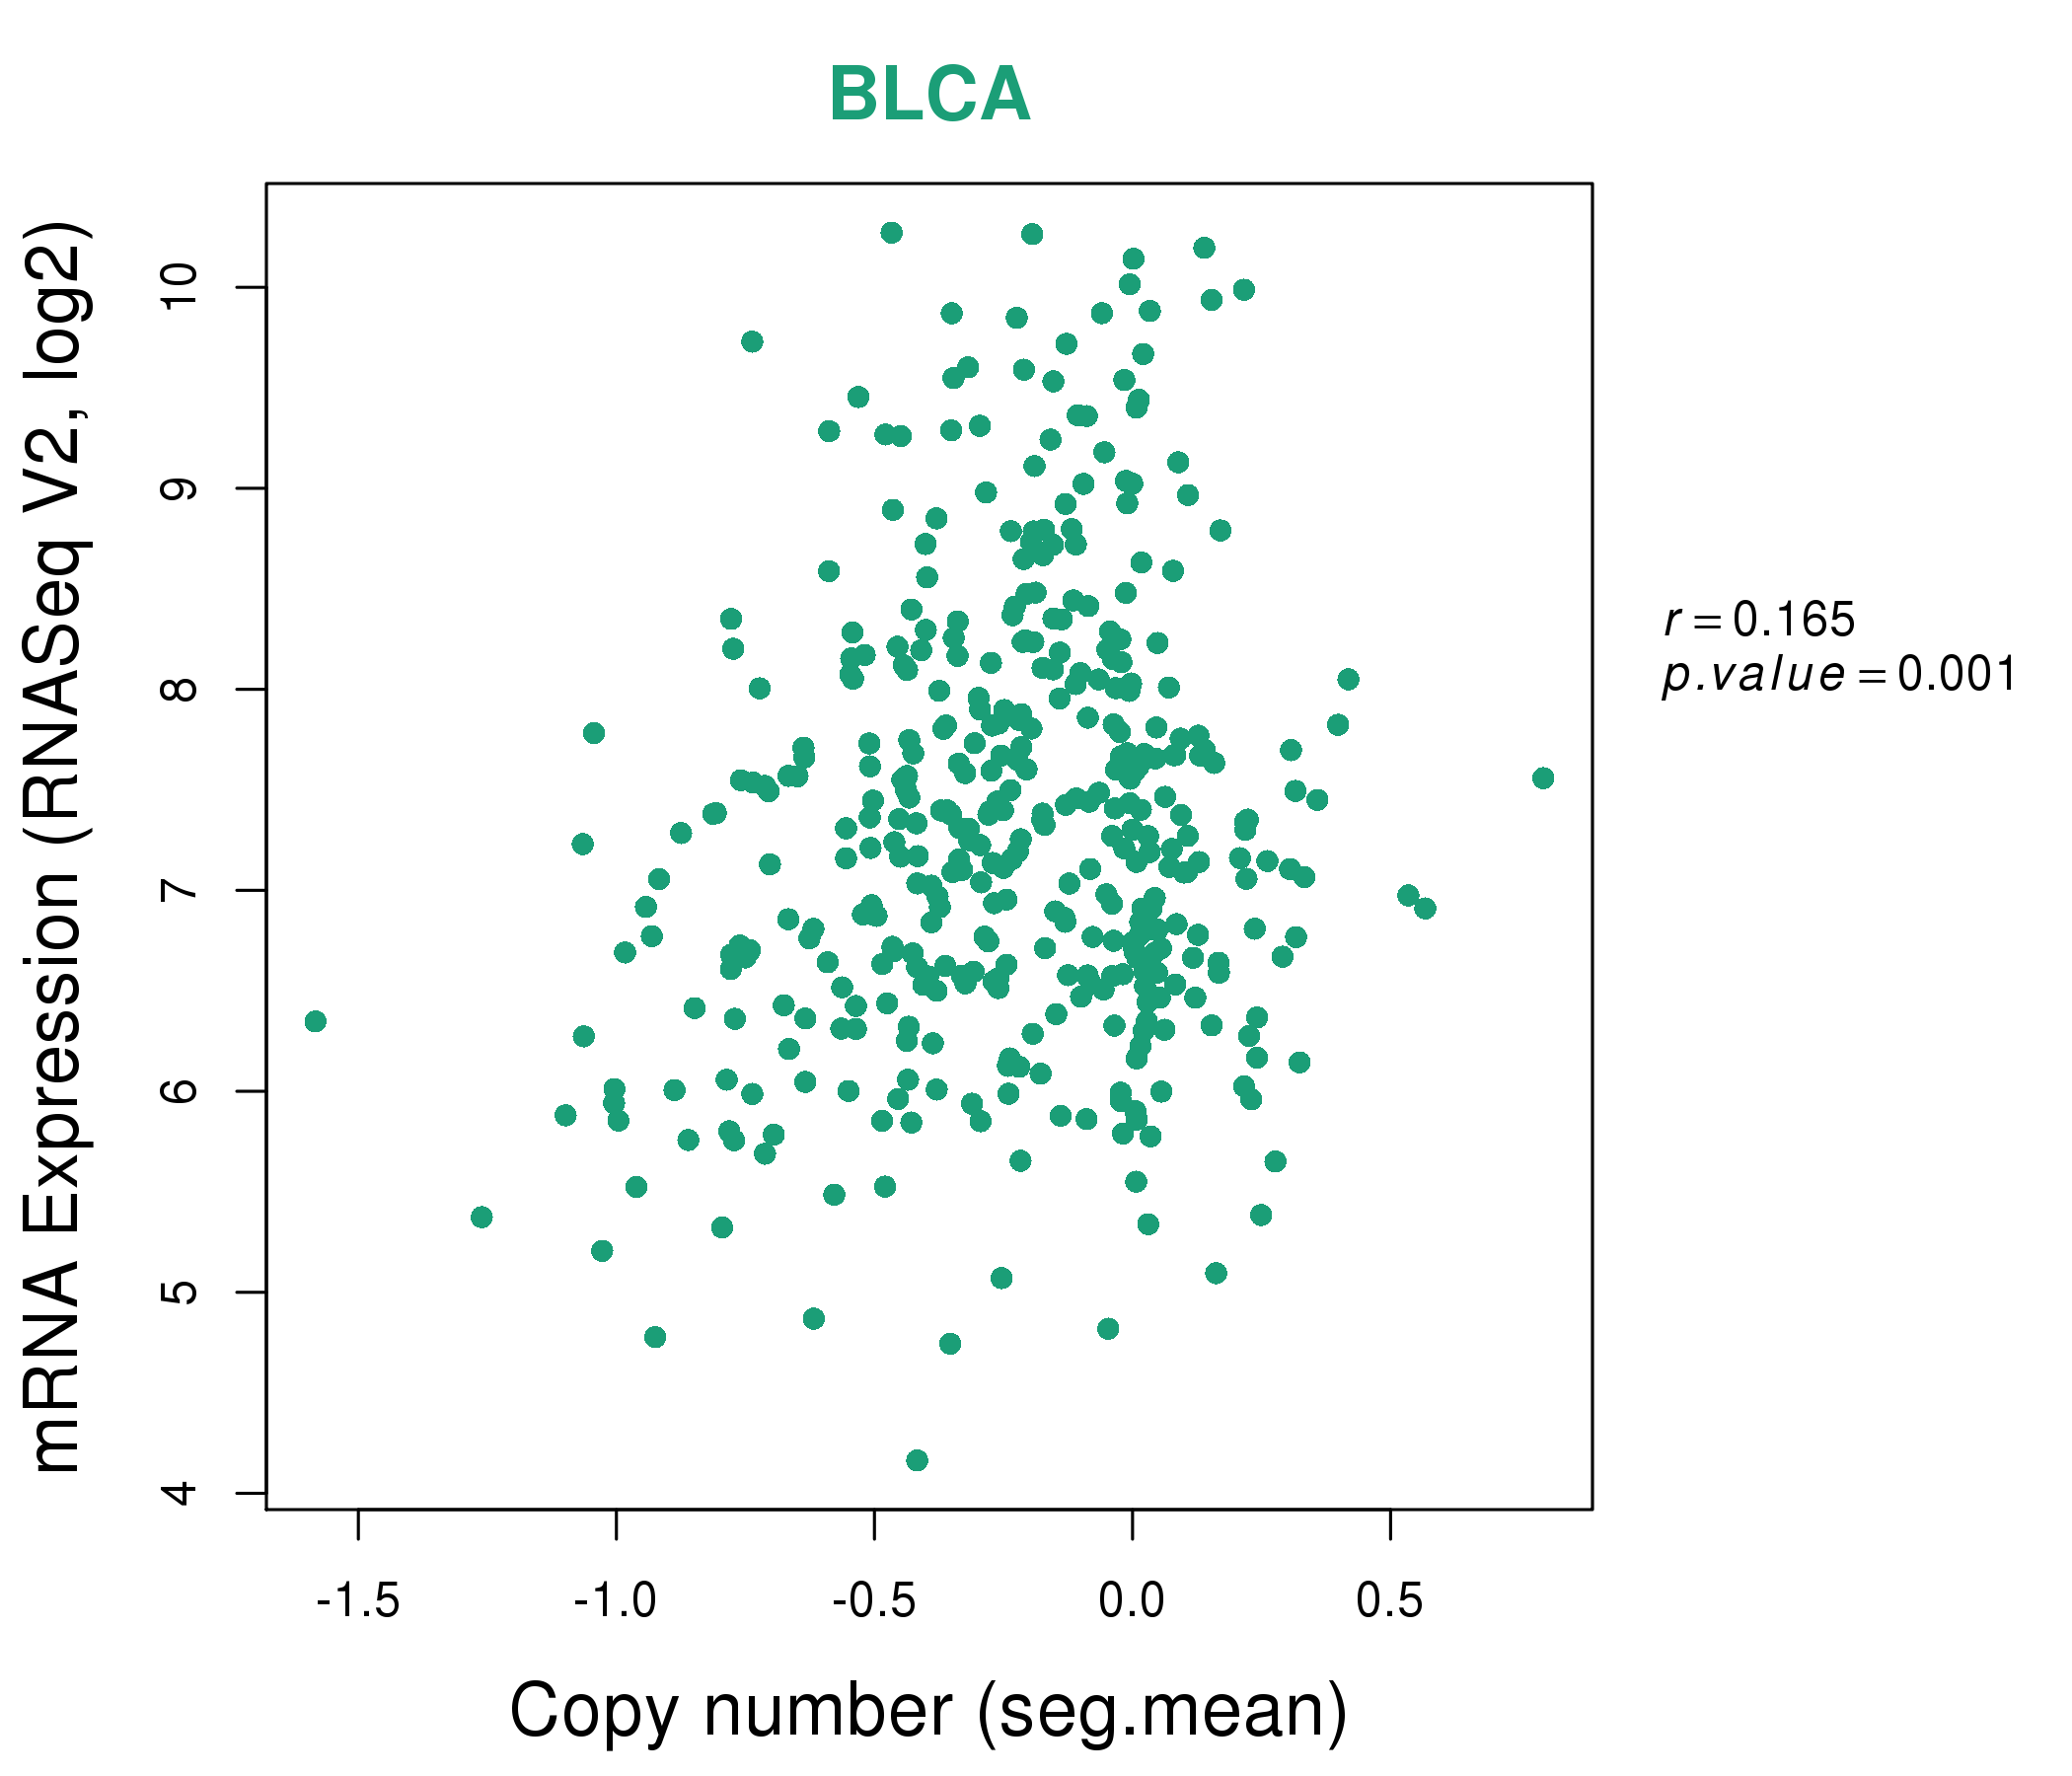
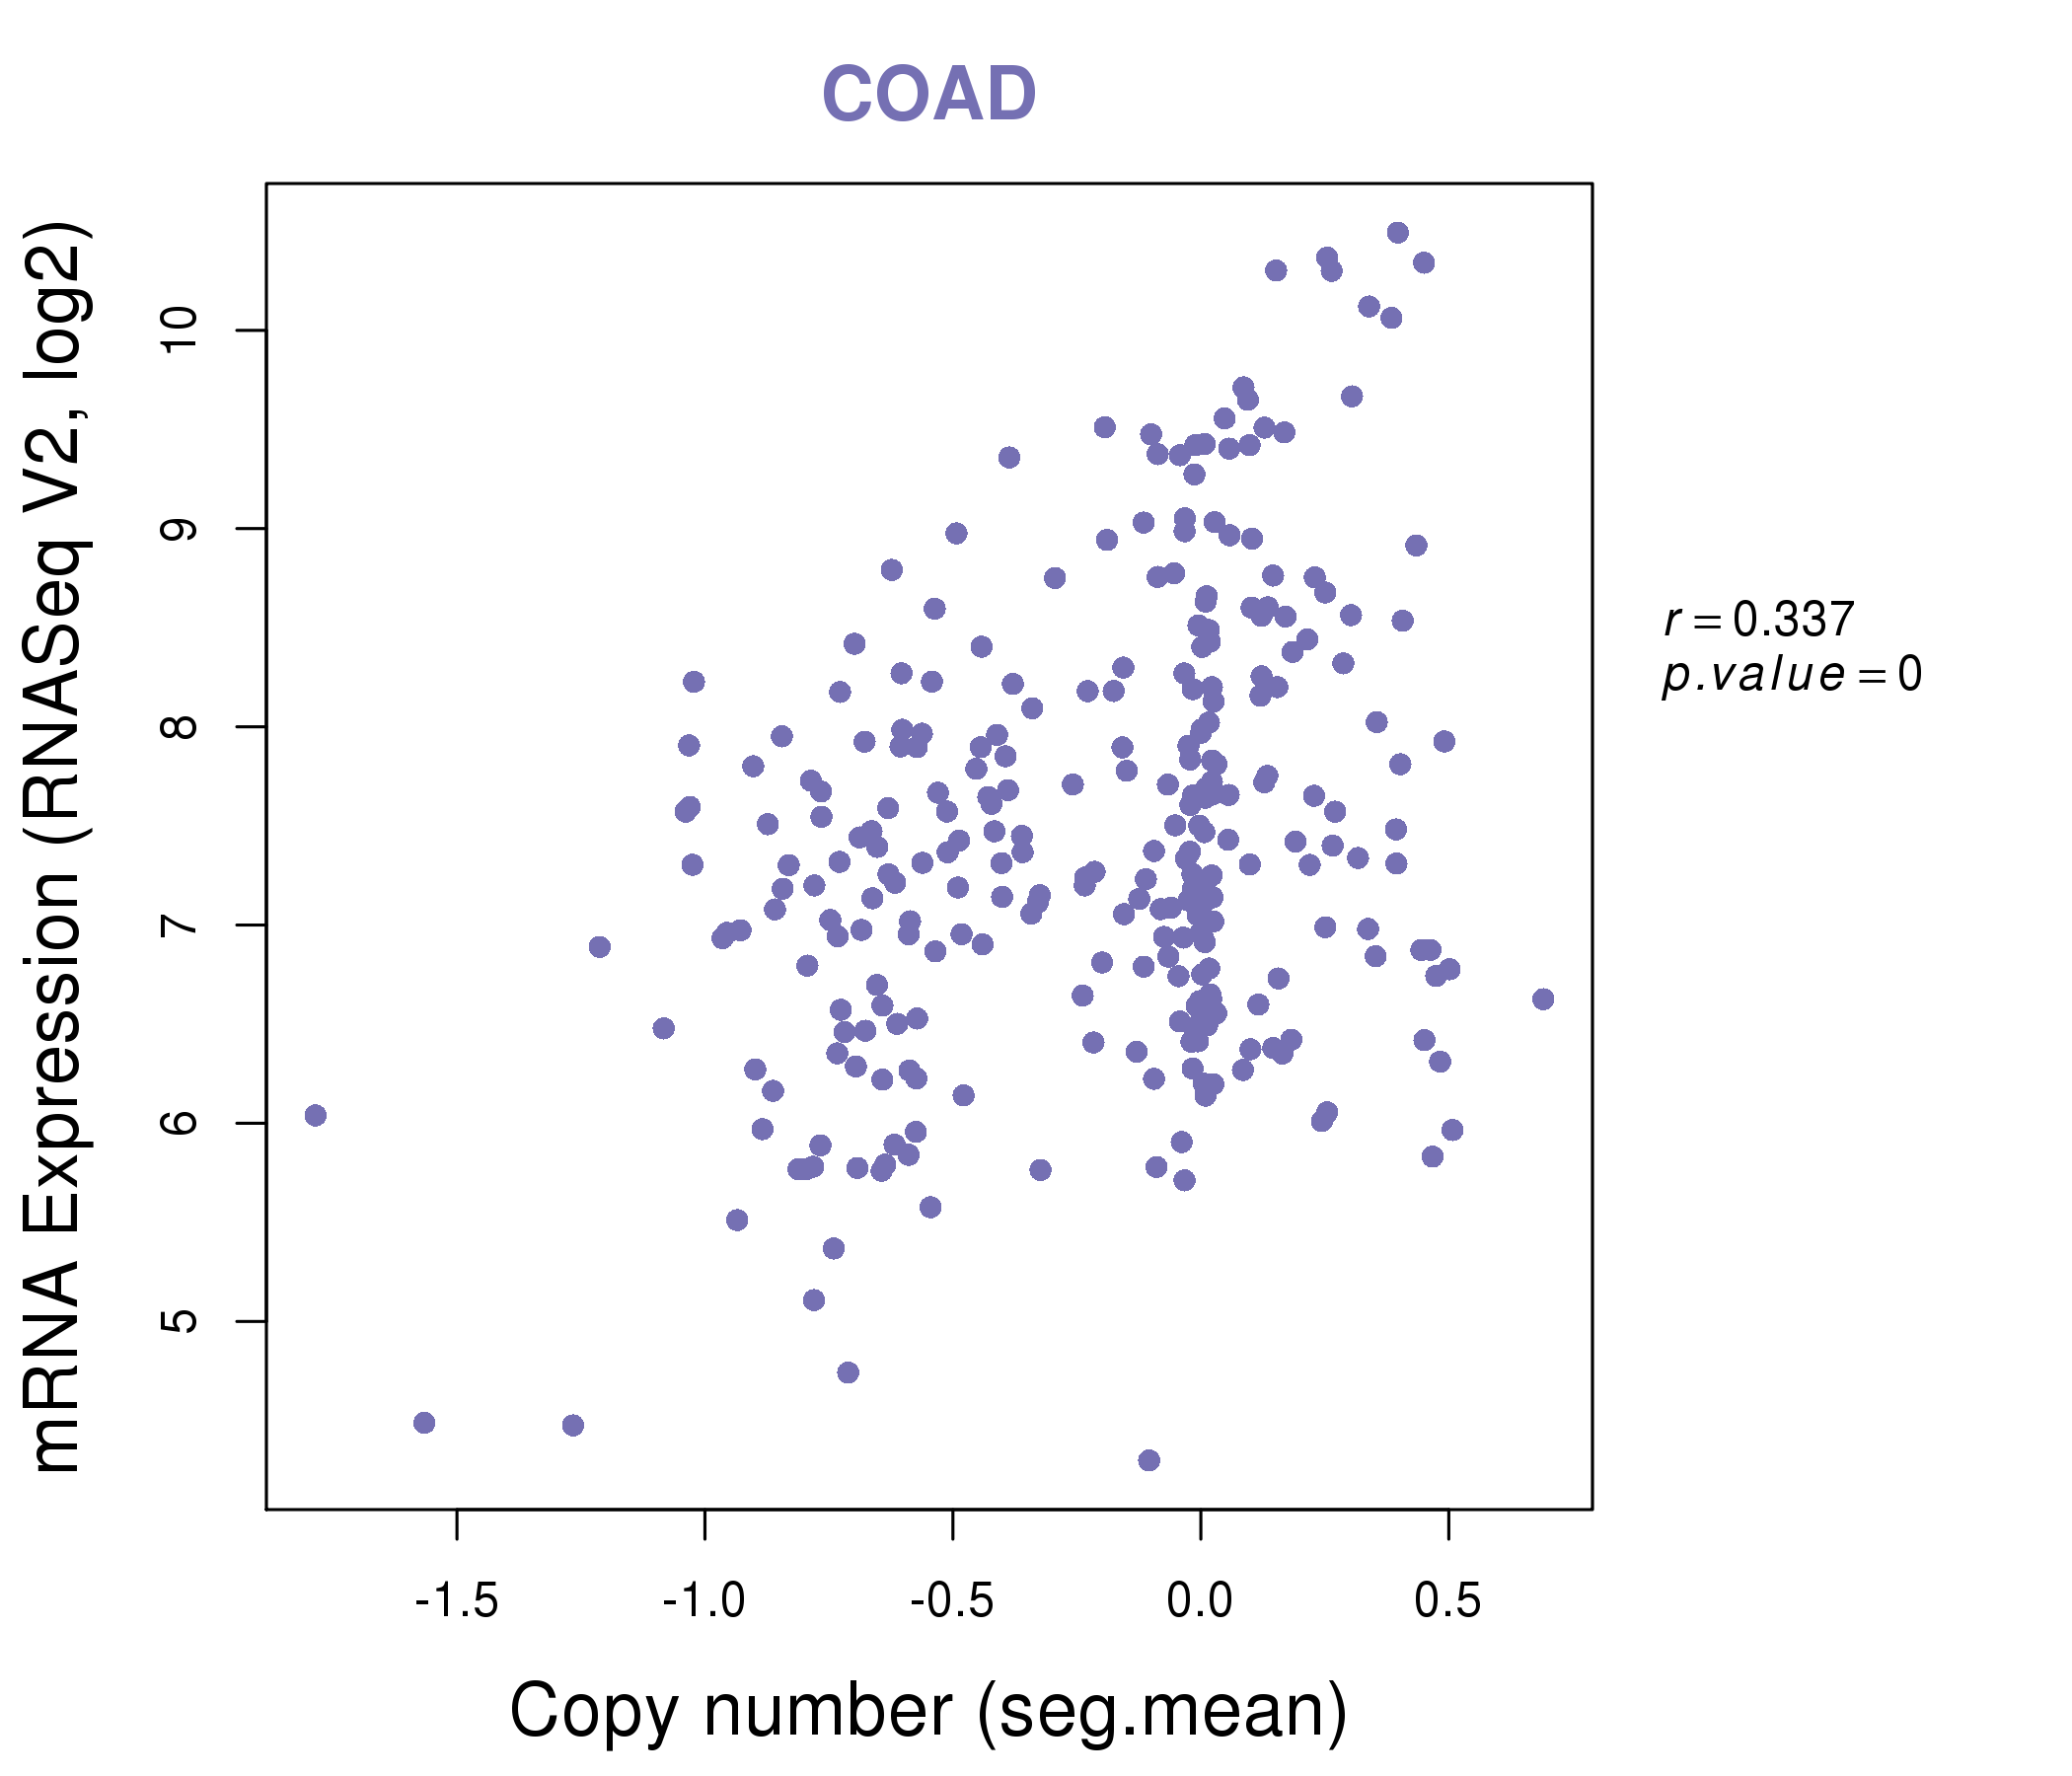
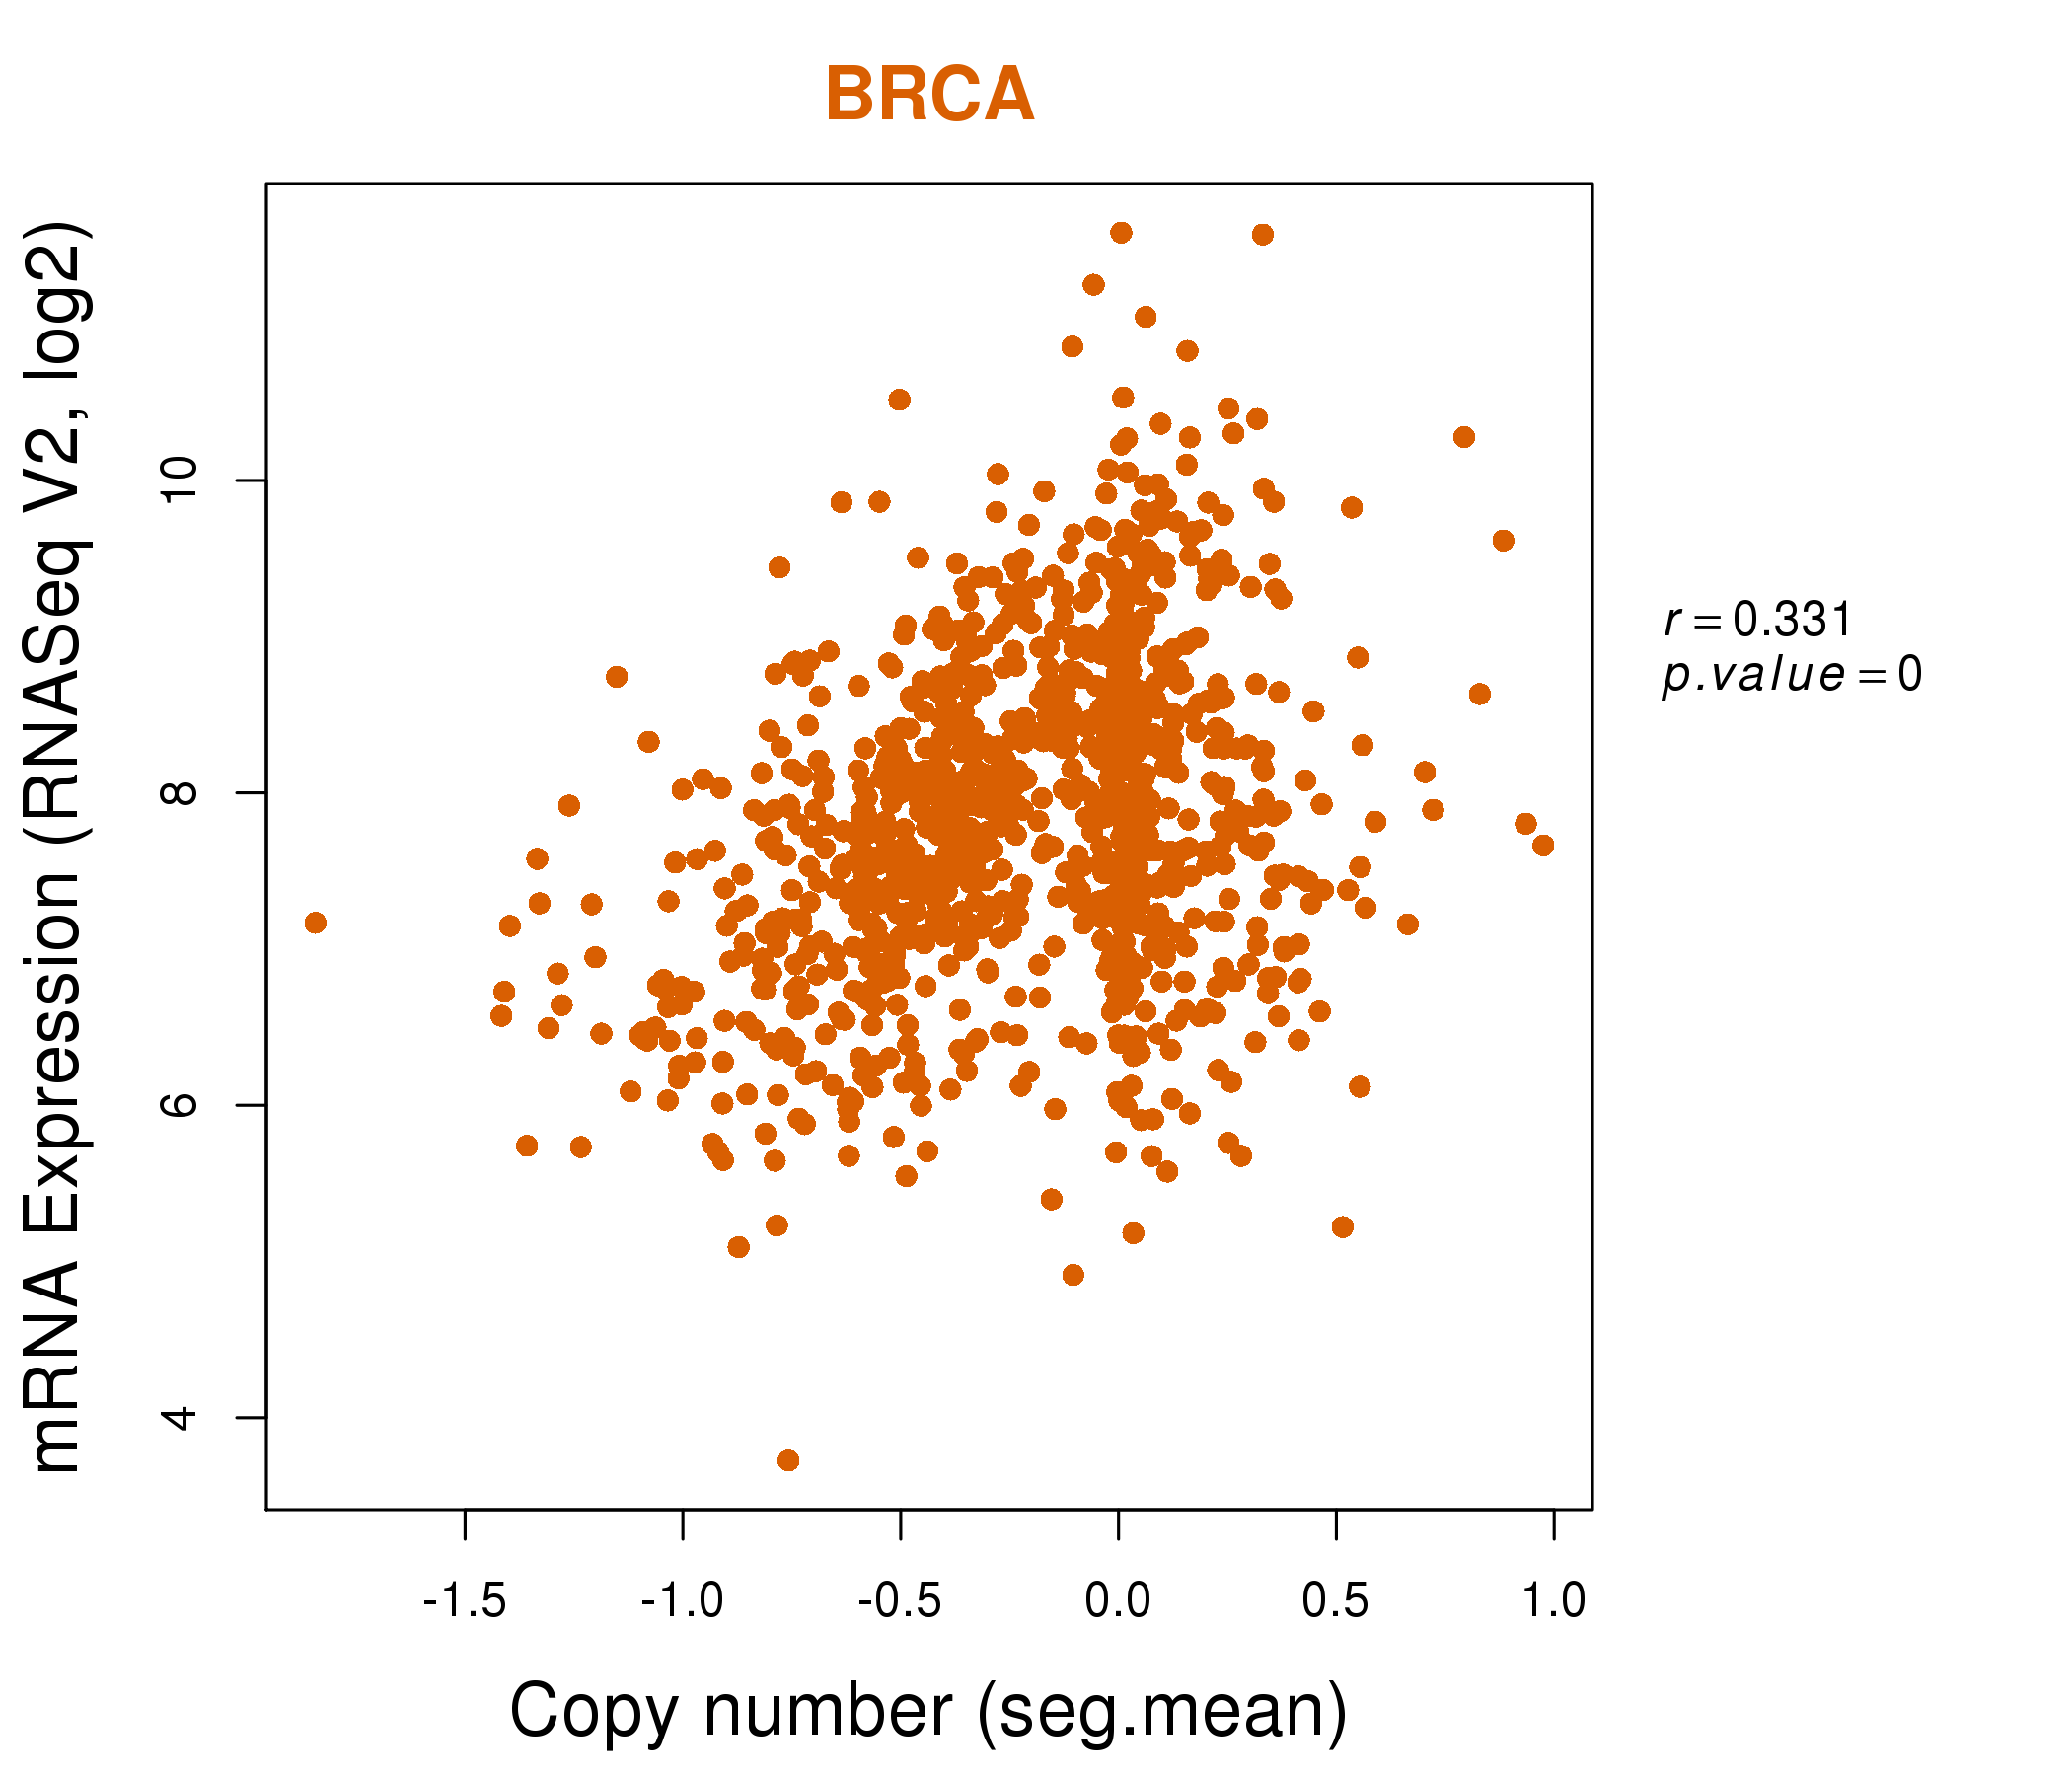
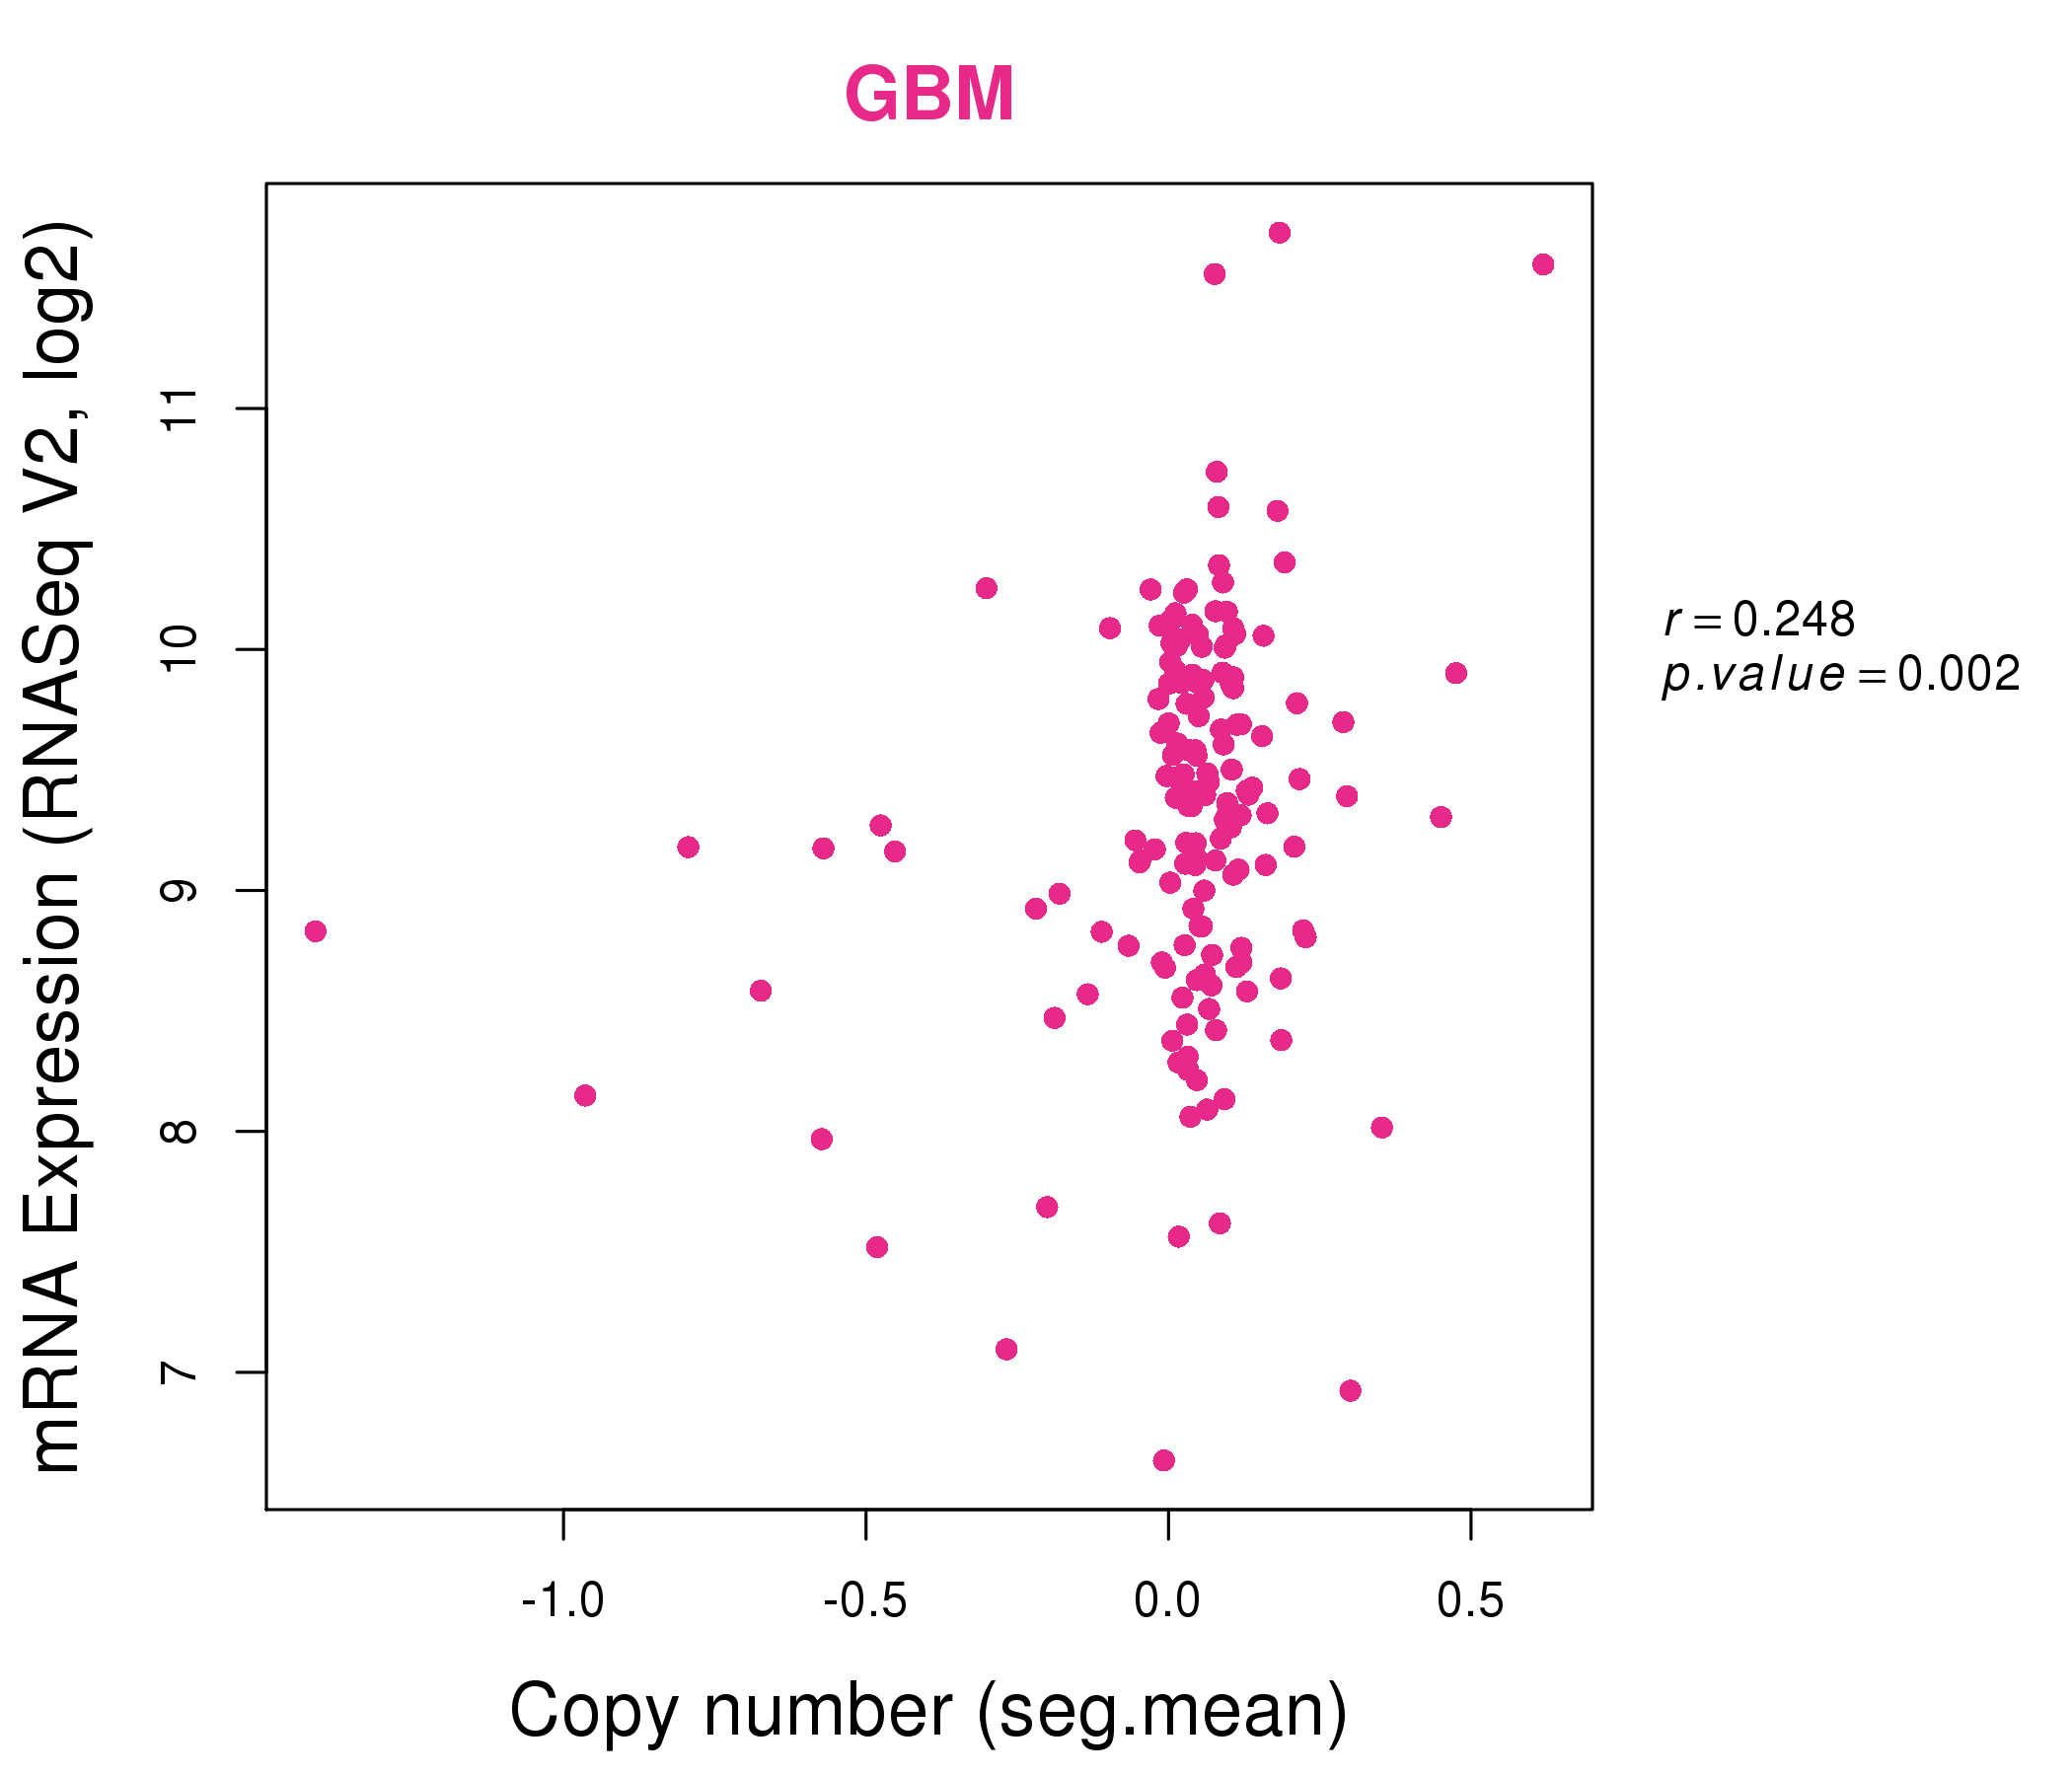
| * Normalized gene expression data of RNASeqV2 was extracted from TCGA using R package TCGA-Assembler. The URLs of all public data files on TCGA DCC data server were gathered at Jan-05-2015. Only eight cancer types have enough normal control samples for differential expression analysis. (t test, adjusted p<0.05 (using Benjamini-Hochberg FDR)) |
 |
| Top |
| * This plots show the correlation between CNV and gene expression. |
: Open all plots for all cancer types
 |
|
 |
|
| Top |
| Gene-Gene Network Information |
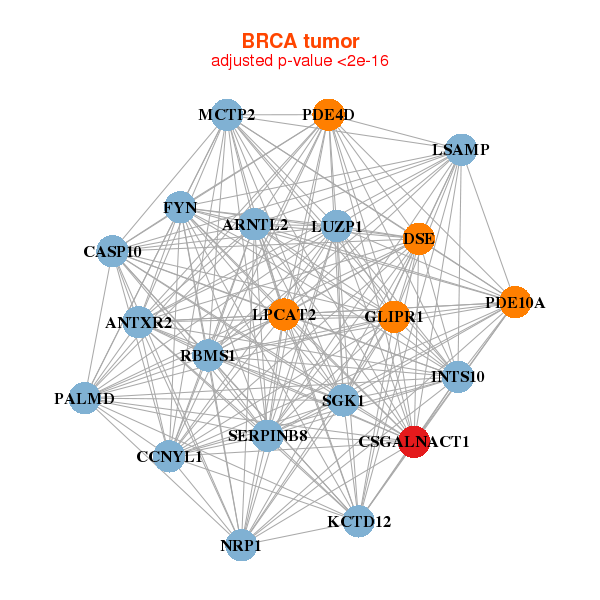
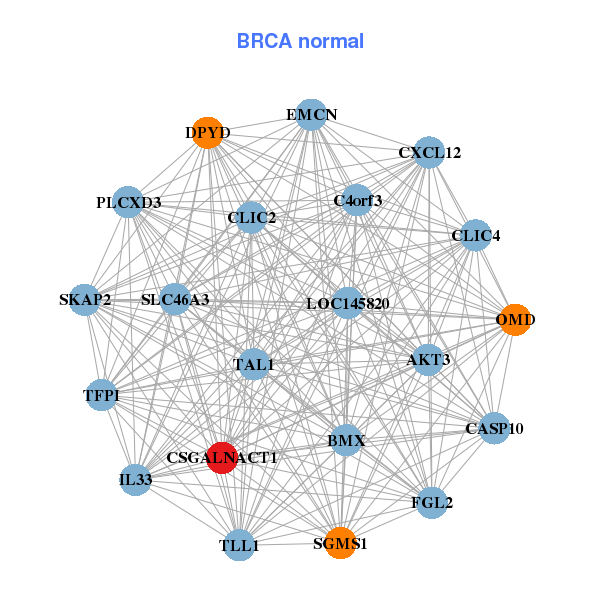
| * Co-Expression network figures were drawn using R package igraph. Only the top 20 genes with the highest correlations were shown. Red circle: input gene, orange circle: cell metabolism gene, sky circle: other gene |
: Open all plots for all cancer types
 |
|
| ANTXR2,ARNTL2,CASP10,CCNYL1,CSGALNACT1,DSE,FYN, GLIPR1,INTS10,KCTD12,LPCAT2,LSAMP,LUZP1,MCTP2, NRP1,PALMD,PDE10A,PDE4D,RBMS1,SERPINB8,SGK1 | AKT3,BMX,C4orf3,CASP10,CLIC2,CLIC4,CSGALNACT1, CXCL12,DPYD,EMCN,FGL2,IL33,LOC145820,OMD, PLCXD3,SGMS1,SKAP2,SLC46A3,TAL1,TFPI,TLL1 |
 |
|
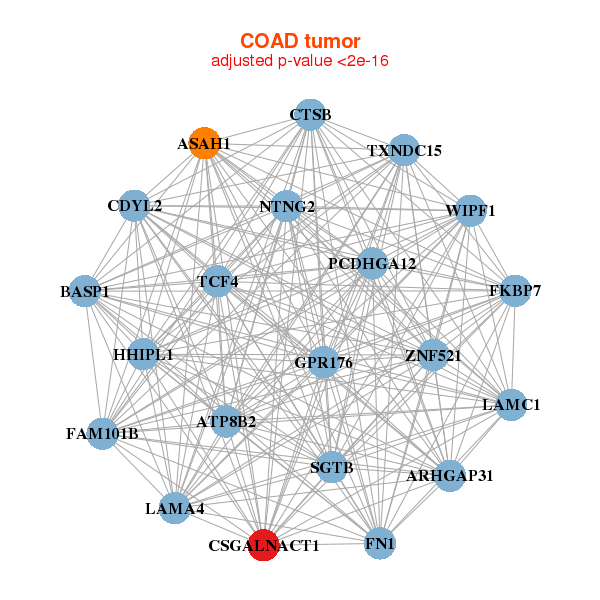
| ARHGAP31,ASAH1,ATP8B2,BASP1,CDYL2,CSGALNACT1,CTSB, FAM101B,FKBP7,FN1,GPR176,HHIPL1,LAMA4,LAMC1, NTNG2,PCDHGA12,SGTB,TCF4,TXNDC15,WIPF1,ZNF521 | AVPR2,CSGALNACT1,F8,FAM13C,GAS1,GLT8D2,HTRA1, JAM2,LDB2,LHFP,LOC285548,LPHN2,OLFML3,PDGFC, RAPGEF4,RECK,SNCAIP,TEK,TGFBR2,TIMP2,ZNF521 |
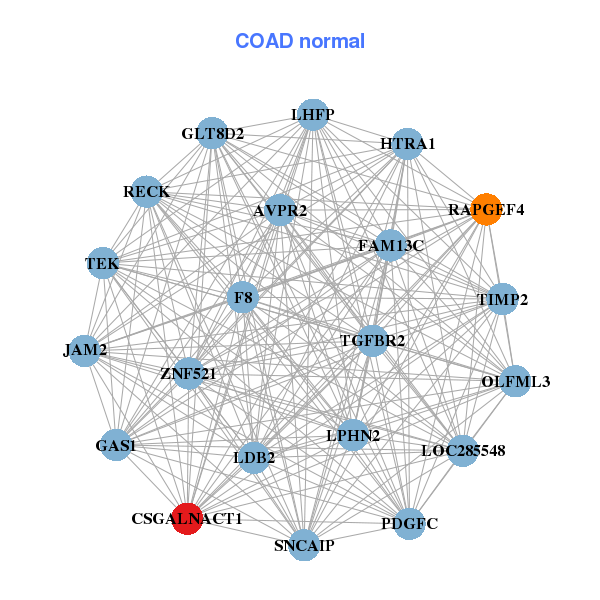
| * Co-Expression network figures were drawn using R package igraph. Only the top 20 genes with the highest correlations were shown. Red circle: input gene, orange circle: cell metabolism gene, sky circle: other gene |
: Open all plots for all cancer types
| Top |
: Open all interacting genes' information including KEGG pathway for all interacting genes from DAVID
| Top |
| Pharmacological Information for CSGALNACT1 |
| There's no related Drug. |
| Top |
| Cross referenced IDs for CSGALNACT1 |
| * We obtained these cross-references from Uniprot database. It covers 150 different DBs, 18 categories. http://www.uniprot.org/help/cross_references_section |
: Open all cross reference information
|
Copyright © 2016-Present - The Univsersity of Texas Health Science Center at Houston @ |