|
||||||||||||||||||||||||||||||||||||||||||||||||||||||||||||||||||||||||||||||||||||||||||||||||||||||||||||||||||||||||||||||||||||||||||||||||||||||||||||||||||||||||||||||||||||||||||||||||||||||||||||||||||||||||||||||||||||||||||||||||||||||||||||||||||||||||||||||||||||||||||||||||||||||||||||||||||||||||||||||||||||||||||||||||||||||||||||||||||||||||||||||||||||||||||||||||||||
| |
| Phenotypic Information (metabolism pathway, cancer, disease, phenome) |
| |
| |
| Gene-Gene Network Information: Co-Expression Network, Interacting Genes & KEGG |
| |
|


| Gene Summary for PRKCD |
| Top |
| Phenotypic Information for PRKCD(metabolism pathway, cancer, disease, phenome) |
| Cancer | CGAP: PRKCD |
| Familial Cancer Database: PRKCD | |
| * This gene is included in those cancer gene databases. |
|
|
|
|
|
| . | ||||||||||||||||||||||||||||||||||||||||||||||||||||||||||||||||||||||||||||||||||||||||||||||||||||||||||||||||||||||||||||||||||||||||||||||||||||||||||||||||||||||||||||||||||||||||||||||||||||||||||||||||||||||||||||||||||||||||||||||||||||||||||||||||||||||||||||||||||||||||||||||||||||||||||||||||||||||||||||||||||||||||||||||||||||||||||||||||||||||||||||||||||||||||||||||
Oncogene 1 | Significant driver gene in | |||||||||||||||||||||||||||||||||||||||||||||||||||||||||||||||||||||||||||||||||||||||||||||||||||||||||||||||||||||||||||||||||||||||||||||||||||||||||||||||||||||||||||||||||||||||||||||||||||||||||||||||||||||||||||||||||||||||||||||||||||||||||||||||||||||||||||||||||||||||||||||||||||||||||||||||||||||||||||||||||||||||||||||||||||||||||||||||||||||||||||||||||||||||||||||||||||
| cf) number; DB name 1 Oncogene; http://nar.oxfordjournals.org/content/35/suppl_1/D721.long, 2 Tumor Suppressor gene; https://bioinfo.uth.edu/TSGene/, 3 Cancer Gene Census; http://www.nature.com/nrc/journal/v4/n3/abs/nrc1299.html, 4 CancerGenes; http://nar.oxfordjournals.org/content/35/suppl_1/D721.long, 5 Network of Cancer Gene; http://ncg.kcl.ac.uk/index.php, 1Therapeutic Vulnerabilities in Cancer; http://cbio.mskcc.org/cancergenomics/statius/ |
| KEGG_FC_GAMMA_R_MEDIATED_PHAGOCYTOSIS REACTOME_METABOLISM_OF_MRNA REACTOME_METABOLISM_OF_RNA | |
| OMIM | 176977; gene. 615559; phenotype. |
| Orphanet | 1572; Common variable immunodeficiency. 300345; Autosomal recessive systemic lupus erythematosus. 3261; Autoimmune lymphoproliferative syndrome. |
| Disease | KEGG Disease: PRKCD |
| MedGen: PRKCD (Human Medical Genetics with Condition) | |
| ClinVar: PRKCD | |
| Phenotype | MGI: PRKCD (International Mouse Phenotyping Consortium) |
| PhenomicDB: PRKCD | |
| Mutations for PRKCD |
| * Under tables are showing count per each tissue to give us broad intuition about tissue specific mutation patterns.You can go to the detailed page for each mutation database's web site. |
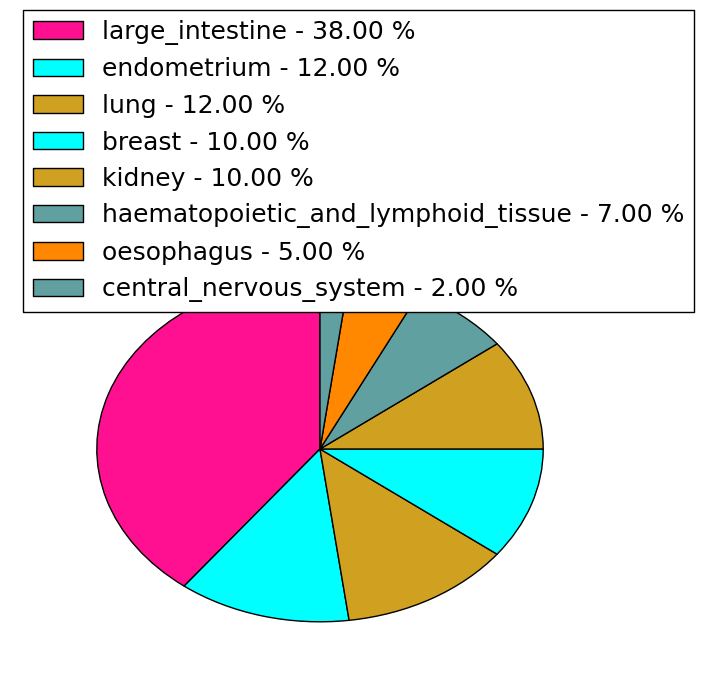
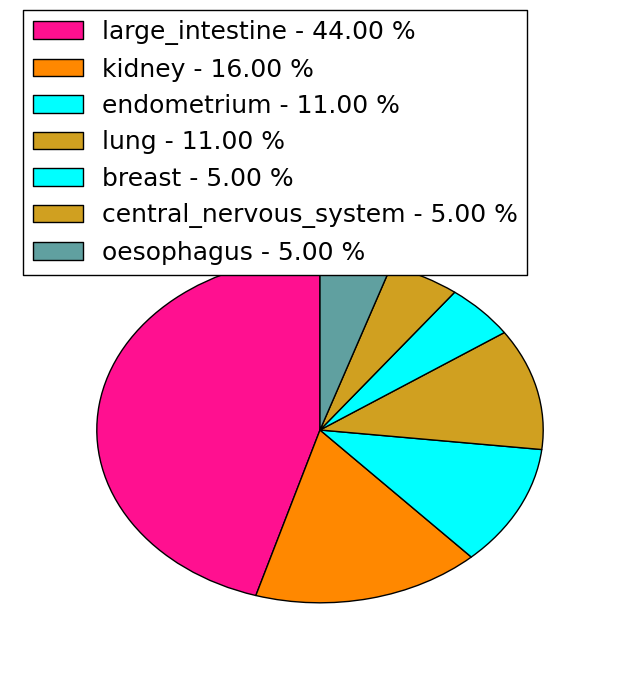
| - Statistics for Tissue and Mutation type | Top |
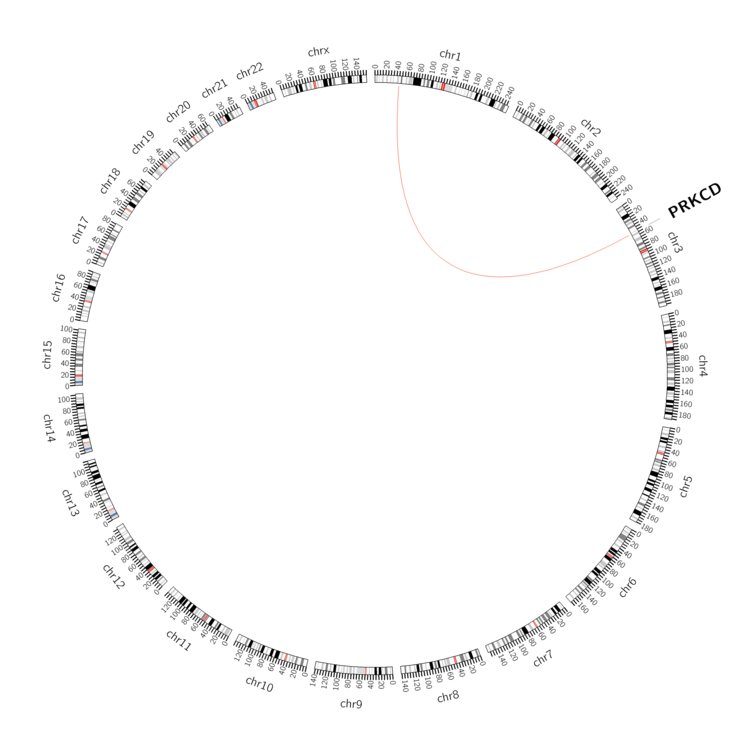 |
| - For Inter-chromosomal Variations |
| * Inter-chromosomal variantions includes 'interchromosomal amplicon to amplicon', 'interchromosomal amplicon to non-amplified dna', 'interchromosomal insertion', 'Interchromosomal unknown type'. |
 |
| - For Intra-chromosomal Variations |
| There's no intra-chromosomal structural variation. |
| Sample | Symbol_a | Chr_a | Start_a | End_a | Symbol_b | Chr_b | Start_b | End_b |
| cf) Tissue number; Tissue name (1;Breast, 2;Central_nervous_system, 3;Haematopoietic_and_lymphoid_tissue, 4;Large_intestine, 5;Liver, 6;Lung, 7;Ovary, 8;Pancreas, 9;Prostate, 10;Skin, 11;Soft_tissue, 12;Upper_aerodigestive_tract) |
| * From mRNA Sanger sequences, Chitars2.0 arranged chimeric transcripts. This table shows PRKCD related fusion information. |
| ID | Head Gene | Tail Gene | Accession | Gene_a | qStart_a | qEnd_a | Chromosome_a | tStart_a | tEnd_a | Gene_a | qStart_a | qEnd_a | Chromosome_a | tStart_a | tEnd_a |
| CA309863 | PRKCD | 2 | 487 | 3 | 53226181 | 53226668 | TFIP11 | 480 | 648 | 22 | 26902770 | 26906073 | |
| BG982322 | PVRL1 | 17 | 142 | 11 | 119535513 | 119535640 | PRKCD | 132 | 277 | 3 | 53222814 | 53223159 | |
| AI457515 | PRKCD | 3 | 280 | 3 | 53226458 | 53226733 | PRKCD | 275 | 588 | 3 | 53217182 | 53219666 | |
| BI021268 | PRKCD | 1 | 231 | 3 | 53219123 | 53219353 | TBC1D8 | 221 | 490 | 2 | 101700156 | 101700425 | |
| AK130023 | PRKCD | 72 | 1785 | 3 | 53224514 | 53226919 | PRKCD | 1779 | 2041 | 3 | 53226391 | 53226653 | |
| Top |
| Mutation type/ Tissue ID | brca | cns | cerv | endome | haematopo | kidn | Lintest | liver | lung | ns | ovary | pancre | prost | skin | stoma | thyro | urina | |||
| Total # sample | 2 | 1 | ||||||||||||||||||
| GAIN (# sample) | 2 | 1 | ||||||||||||||||||
| LOSS (# sample) |
| cf) Tissue ID; Tissue type (1; Breast, 2; Central_nervous_system, 3; Cervix, 4; Endometrium, 5; Haematopoietic_and_lymphoid_tissue, 6; Kidney, 7; Large_intestine, 8; Liver, 9; Lung, 10; NS, 11; Ovary, 12; Pancreas, 13; Prostate, 14; Skin, 15; Stomach, 16; Thyroid, 17; Urinary_tract) |
| Top |
|
 |
| Top |
| Stat. for Non-Synonymous SNVs (# total SNVs=39) | (# total SNVs=18) |
 |  |
(# total SNVs=1) | (# total SNVs=1) |
 |  |
| Top |
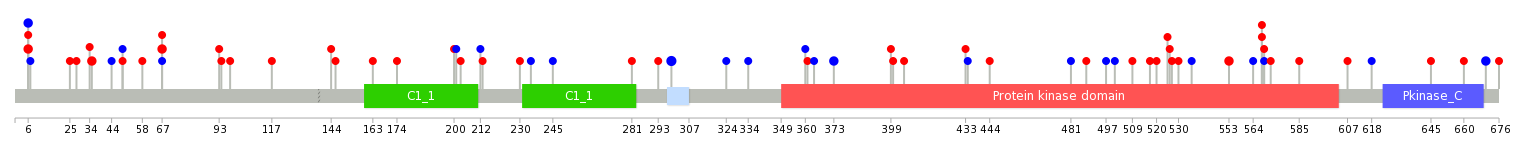
| * When you move the cursor on each content, you can see more deailed mutation information on the Tooltip. Those are primary_site,primary_histology,mutation(aa),pubmedID. |
| GRCh37 position | Mutation(aa) | Unique sampleID count |
| chr3:53219628-53219628 | p.S299S | 3 |
| chr3:53220653-53220653 | p.D434fs*2 | 3 |
| chr3:53212455-53212455 | p.R6H | 3 |
| chr3:53213676-53213676 | p.R67S | 3 |
| chr3:53226261-53226261 | p.F670F | 2 |
| chr3:53223221-53223221 | p.P568S | 2 |
| chr3:53212542-53212542 | p.A35V | 2 |
| chr3:53220215-53220215 | p.E373E | 2 |
| chr3:53212456-53212456 | p.R6R | 2 |
| chr3:53223177-53223177 | p.E553G | 2 |
| Top |
|
 |
| Point Mutation/ Tissue ID | 1 | 2 | 3 | 4 | 5 | 6 | 7 | 8 | 9 | 10 | 11 | 12 | 13 | 14 | 15 | 16 | 17 | 18 | 19 | 20 |
| # sample | 4 | 1 | 15 | 4 | 1 | 6 | 3 | 2 | 6 | 6 | 8 | |||||||||
| # mutation | 4 | 1 | 13 | 4 | 1 | 5 | 3 | 2 | 7 | 6 | 10 | |||||||||
| nonsynonymous SNV | 1 | 1 | 9 | 1 | 1 | 3 | 3 | 2 | 3 | 6 | 7 | |||||||||
| synonymous SNV | 3 | 4 | 3 | 2 | 4 | 3 |
| cf) Tissue ID; Tissue type (1; BLCA[Bladder Urothelial Carcinoma], 2; BRCA[Breast invasive carcinoma], 3; CESC[Cervical squamous cell carcinoma and endocervical adenocarcinoma], 4; COAD[Colon adenocarcinoma], 5; GBM[Glioblastoma multiforme], 6; Glioma Low Grade, 7; HNSC[Head and Neck squamous cell carcinoma], 8; KICH[Kidney Chromophobe], 9; KIRC[Kidney renal clear cell carcinoma], 10; KIRP[Kidney renal papillary cell carcinoma], 11; LAML[Acute Myeloid Leukemia], 12; LUAD[Lung adenocarcinoma], 13; LUSC[Lung squamous cell carcinoma], 14; OV[Ovarian serous cystadenocarcinoma ], 15; PAAD[Pancreatic adenocarcinoma], 16; PRAD[Prostate adenocarcinoma], 17; SKCM[Skin Cutaneous Melanoma], 18:STAD[Stomach adenocarcinoma], 19:THCA[Thyroid carcinoma], 20:UCEC[Uterine Corpus Endometrial Carcinoma]) |
| Top |
| * We represented just top 10 SNVs. When you move the cursor on each content, you can see more deailed mutation information on the Tooltip. Those are primary_site, primary_histology, mutation(aa), pubmedID. |
| Genomic Position | Mutation(aa) | Unique sampleID count |
| chr3:53213676 | p.R67C,PRKCD | 4 |
| chr3:53217202 | p.A35V,PRKCD | 2 |
| chr3:53212542 | p.S299S,PRKCD | 2 |
| chr3:53226261 | p.E553G,PRKCD | 2 |
| chr3:53223177 | p.A213T,PRKCD | 2 |
| chr3:53219628 | p.R6R,PRKCD | 2 |
| chr3:53212456 | p.F670F,PRKCD | 2 |
| chr3:53215603 | p.E34Q,PRKCD | 1 |
| chr3:53223226 | p.Q293K,PRKCD | 1 |
| chr3:53220037 | p.L520I,PRKCD | 1 |
| * Copy number data were extracted from TCGA using R package TCGA-Assembler. The URLs of all public data files on TCGA DCC data server were gathered on Jan-05-2015. Function ProcessCNAData in TCGA-Assembler package was used to obtain gene-level copy number value which is calculated as the average copy number of the genomic region of a gene. |
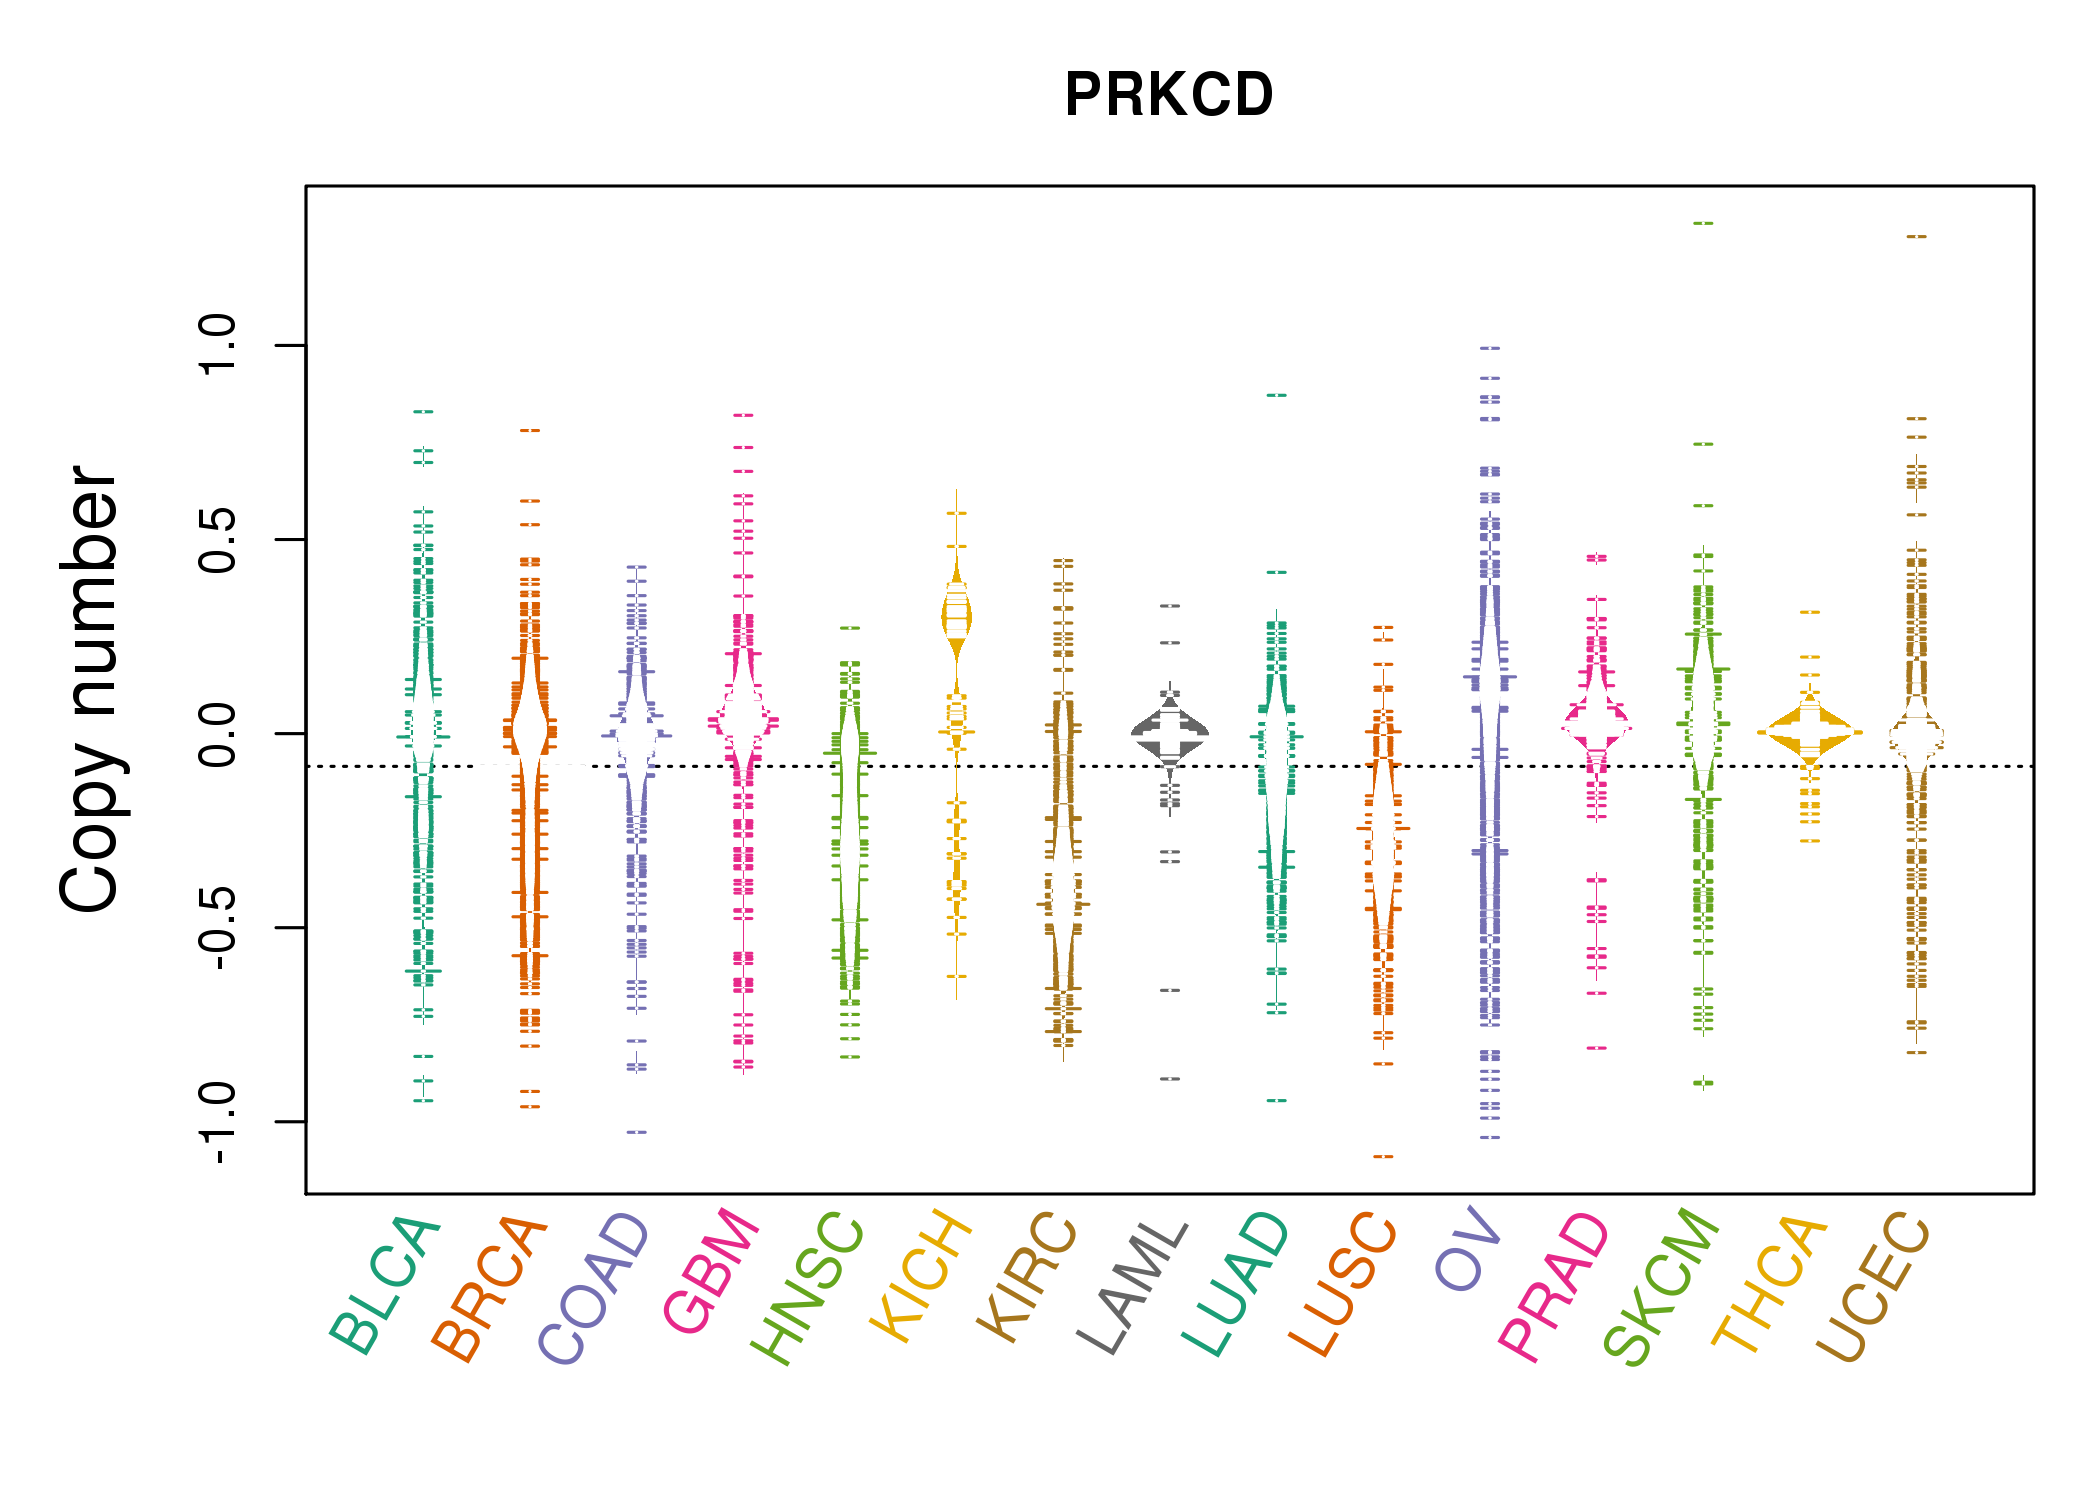 |
| cf) Tissue ID[Tissue type]: BLCA[Bladder Urothelial Carcinoma], BRCA[Breast invasive carcinoma], CESC[Cervical squamous cell carcinoma and endocervical adenocarcinoma], COAD[Colon adenocarcinoma], GBM[Glioblastoma multiforme], Glioma Low Grade, HNSC[Head and Neck squamous cell carcinoma], KICH[Kidney Chromophobe], KIRC[Kidney renal clear cell carcinoma], KIRP[Kidney renal papillary cell carcinoma], LAML[Acute Myeloid Leukemia], LUAD[Lung adenocarcinoma], LUSC[Lung squamous cell carcinoma], OV[Ovarian serous cystadenocarcinoma ], PAAD[Pancreatic adenocarcinoma], PRAD[Prostate adenocarcinoma], SKCM[Skin Cutaneous Melanoma], STAD[Stomach adenocarcinoma], THCA[Thyroid carcinoma], UCEC[Uterine Corpus Endometrial Carcinoma] |
| Top |
| Gene Expression for PRKCD |
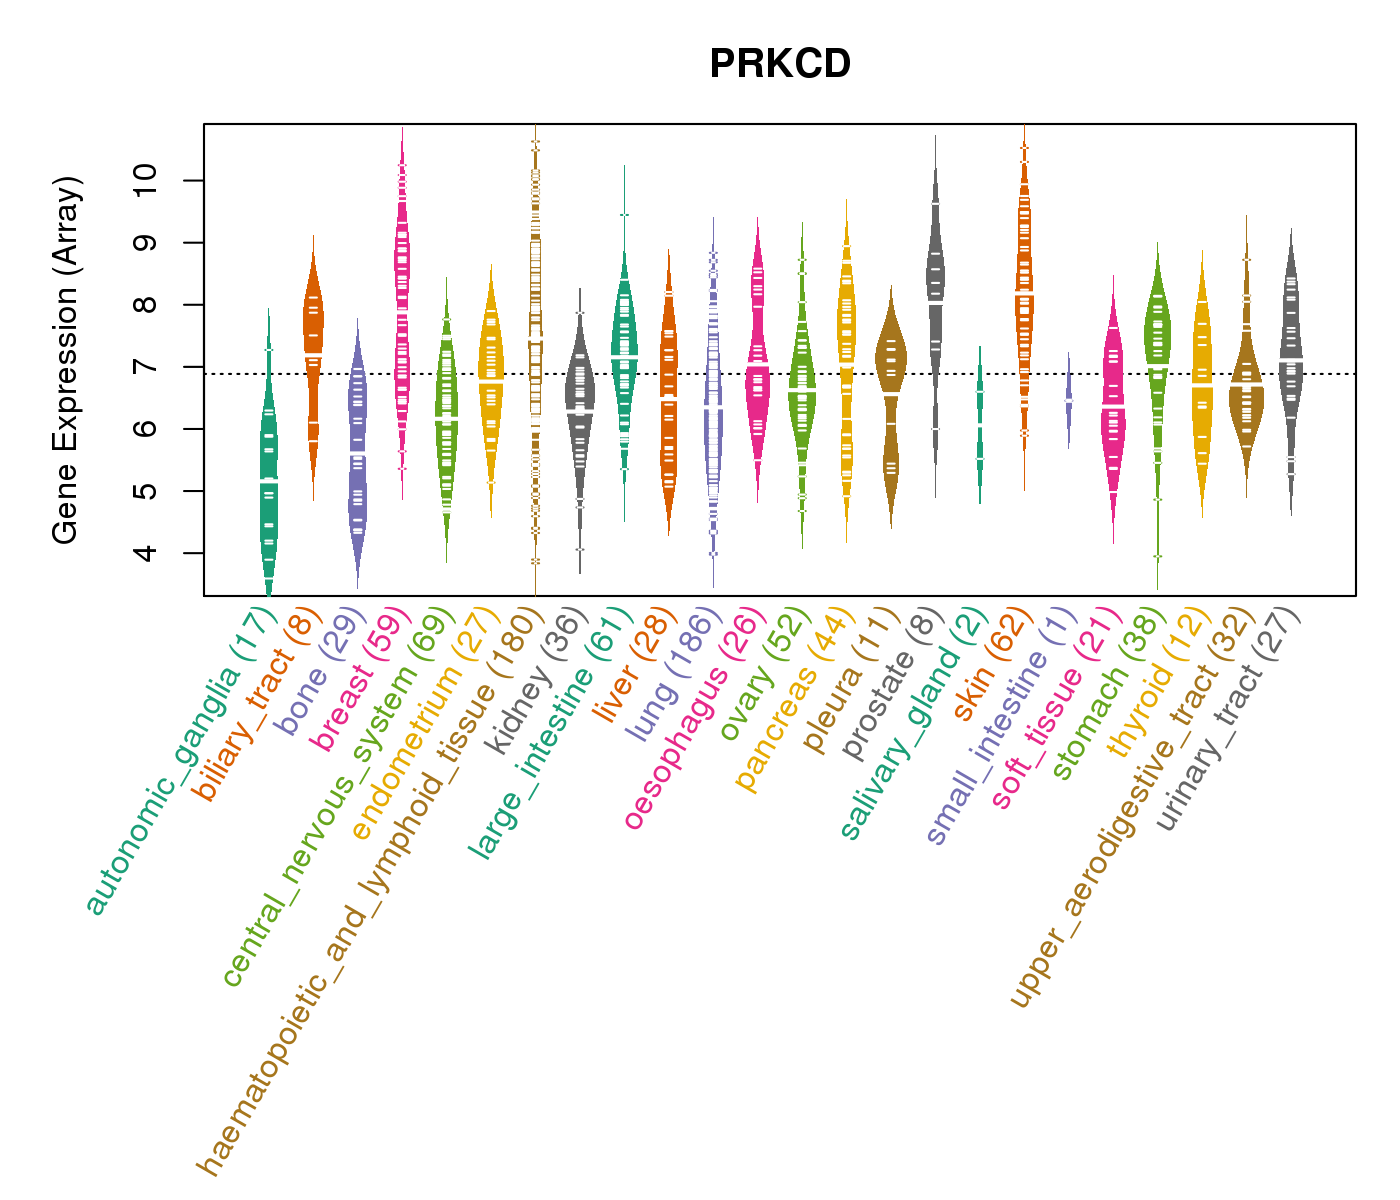
| * CCLE gene expression data were extracted from CCLE_Expression_Entrez_2012-10-18.res: Gene-centric RMA-normalized mRNA expression data. |
 |
| Top |
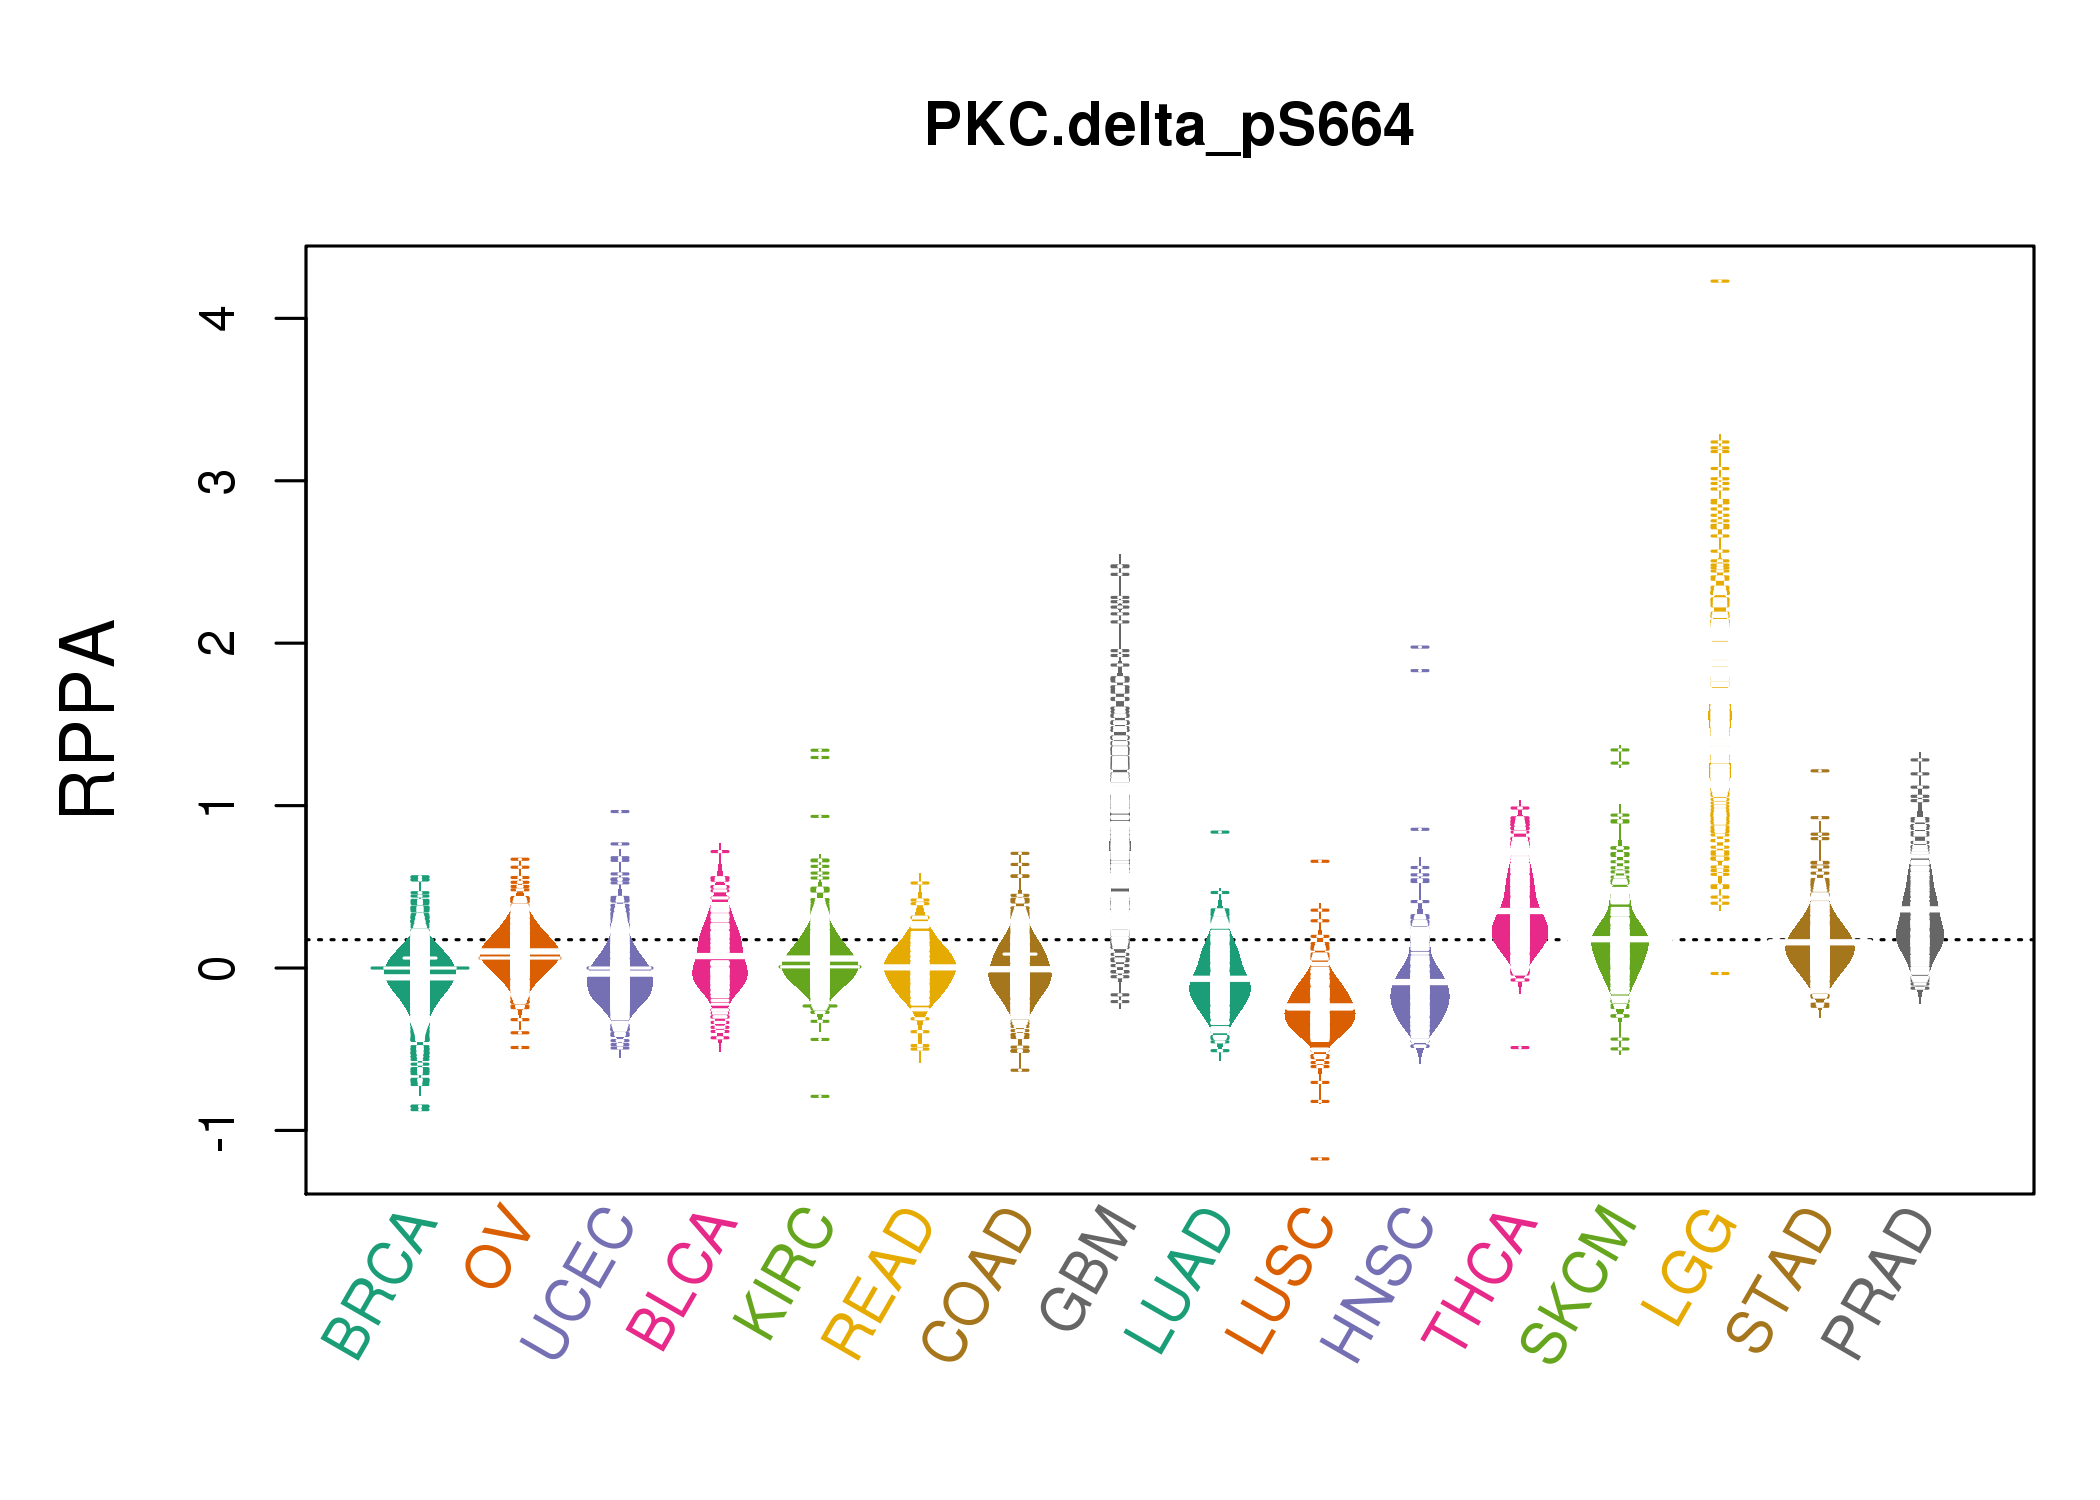
| *RPPA protein expression data were extracted from TCPA (The Cancer Proteome Atlas). Normalized data based on replicated based normalization (RBN) was used to draw following figures. |
 |
| * Normalized gene expression data of RNASeqV2 was extracted from TCGA using R package TCGA-Assembler. The URLs of all public data files on TCGA DCC data server were gathered at Jan-05-2015. Only eight cancer types have enough normal control samples for differential expression analysis. (t test, adjusted p<0.05 (using Benjamini-Hochberg FDR)) |
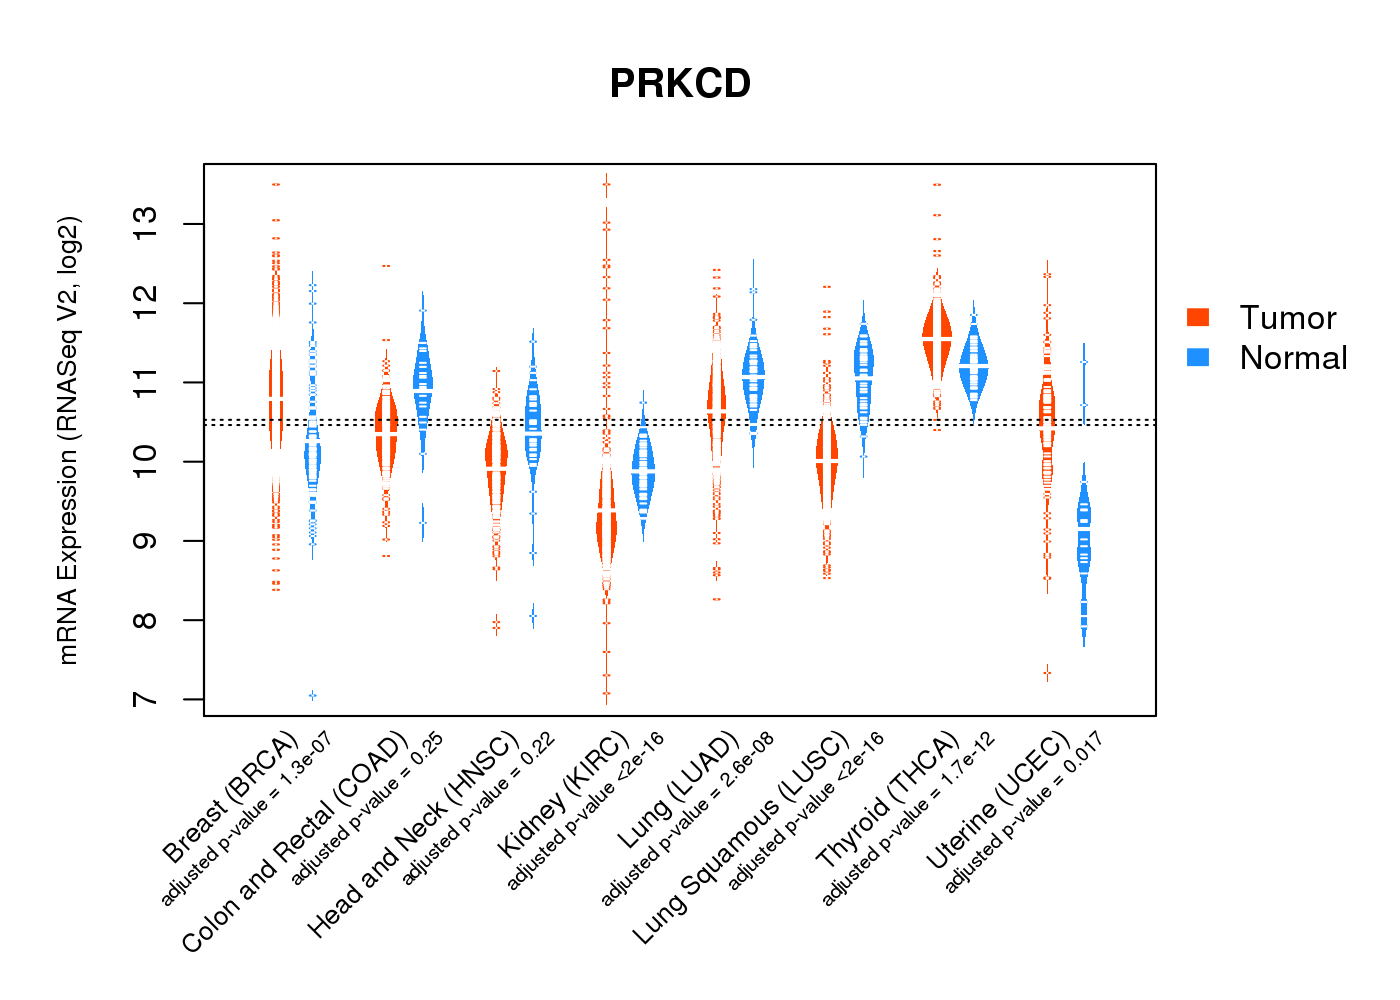 |
| Top |
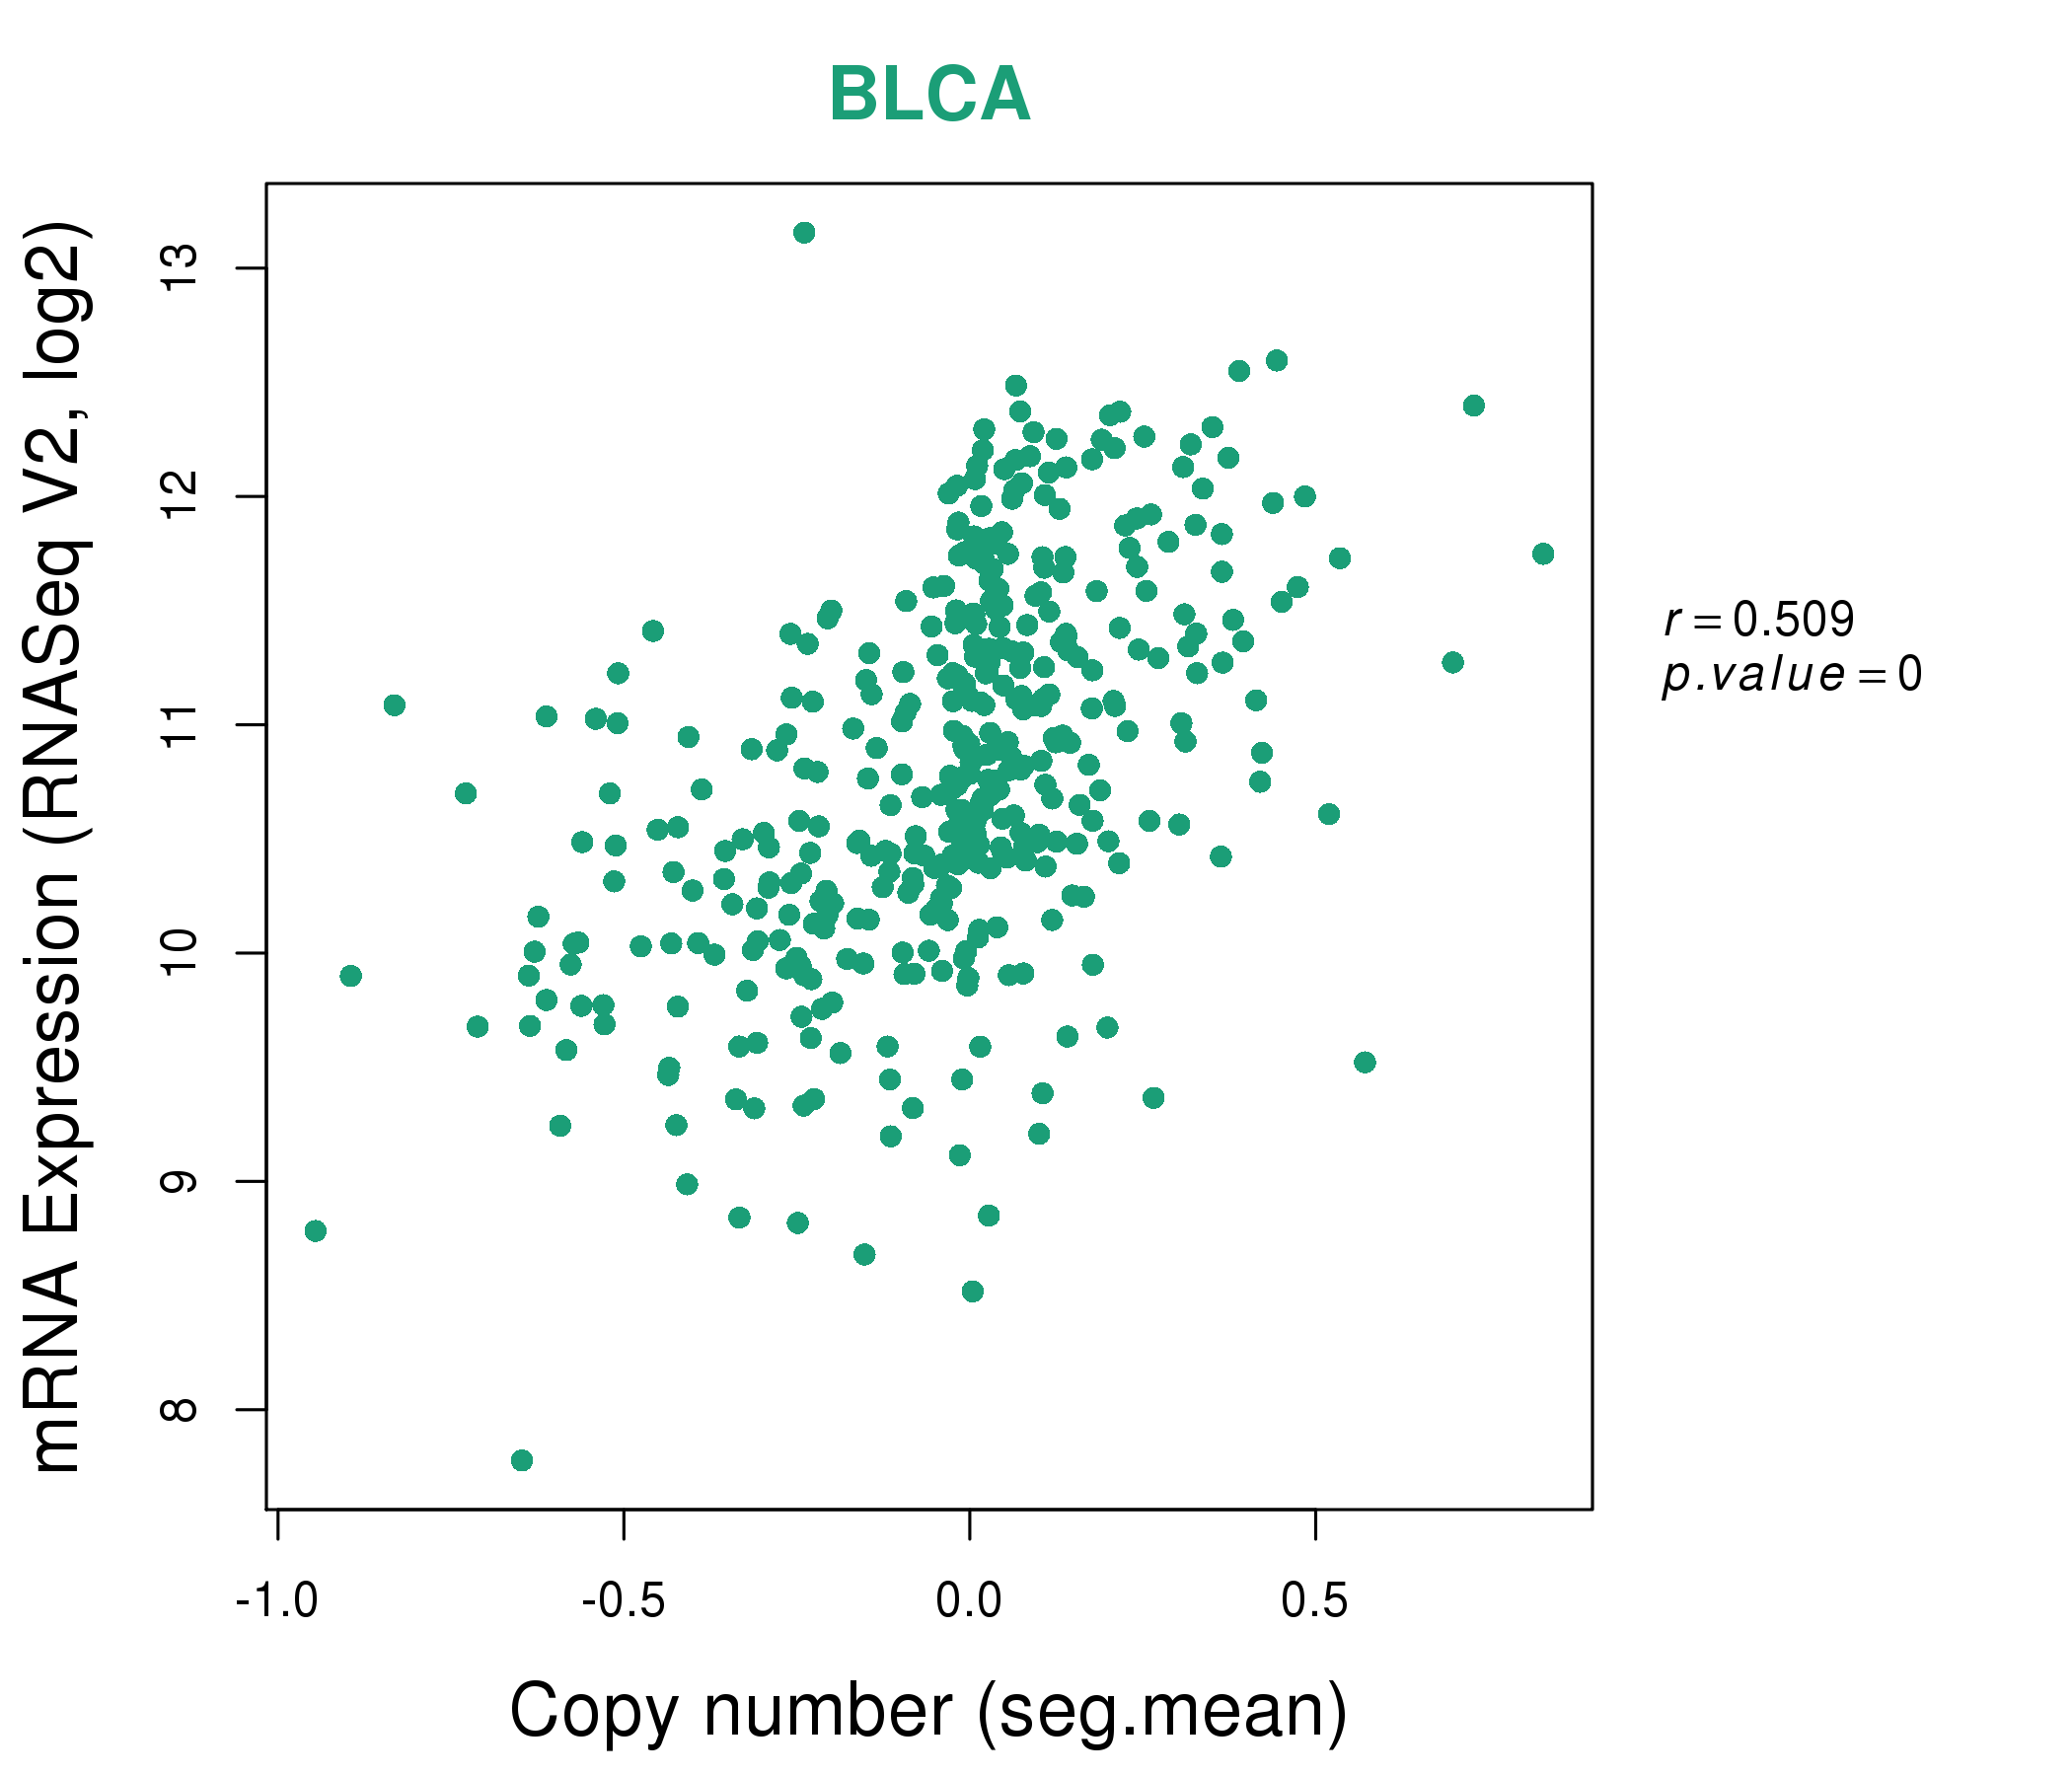
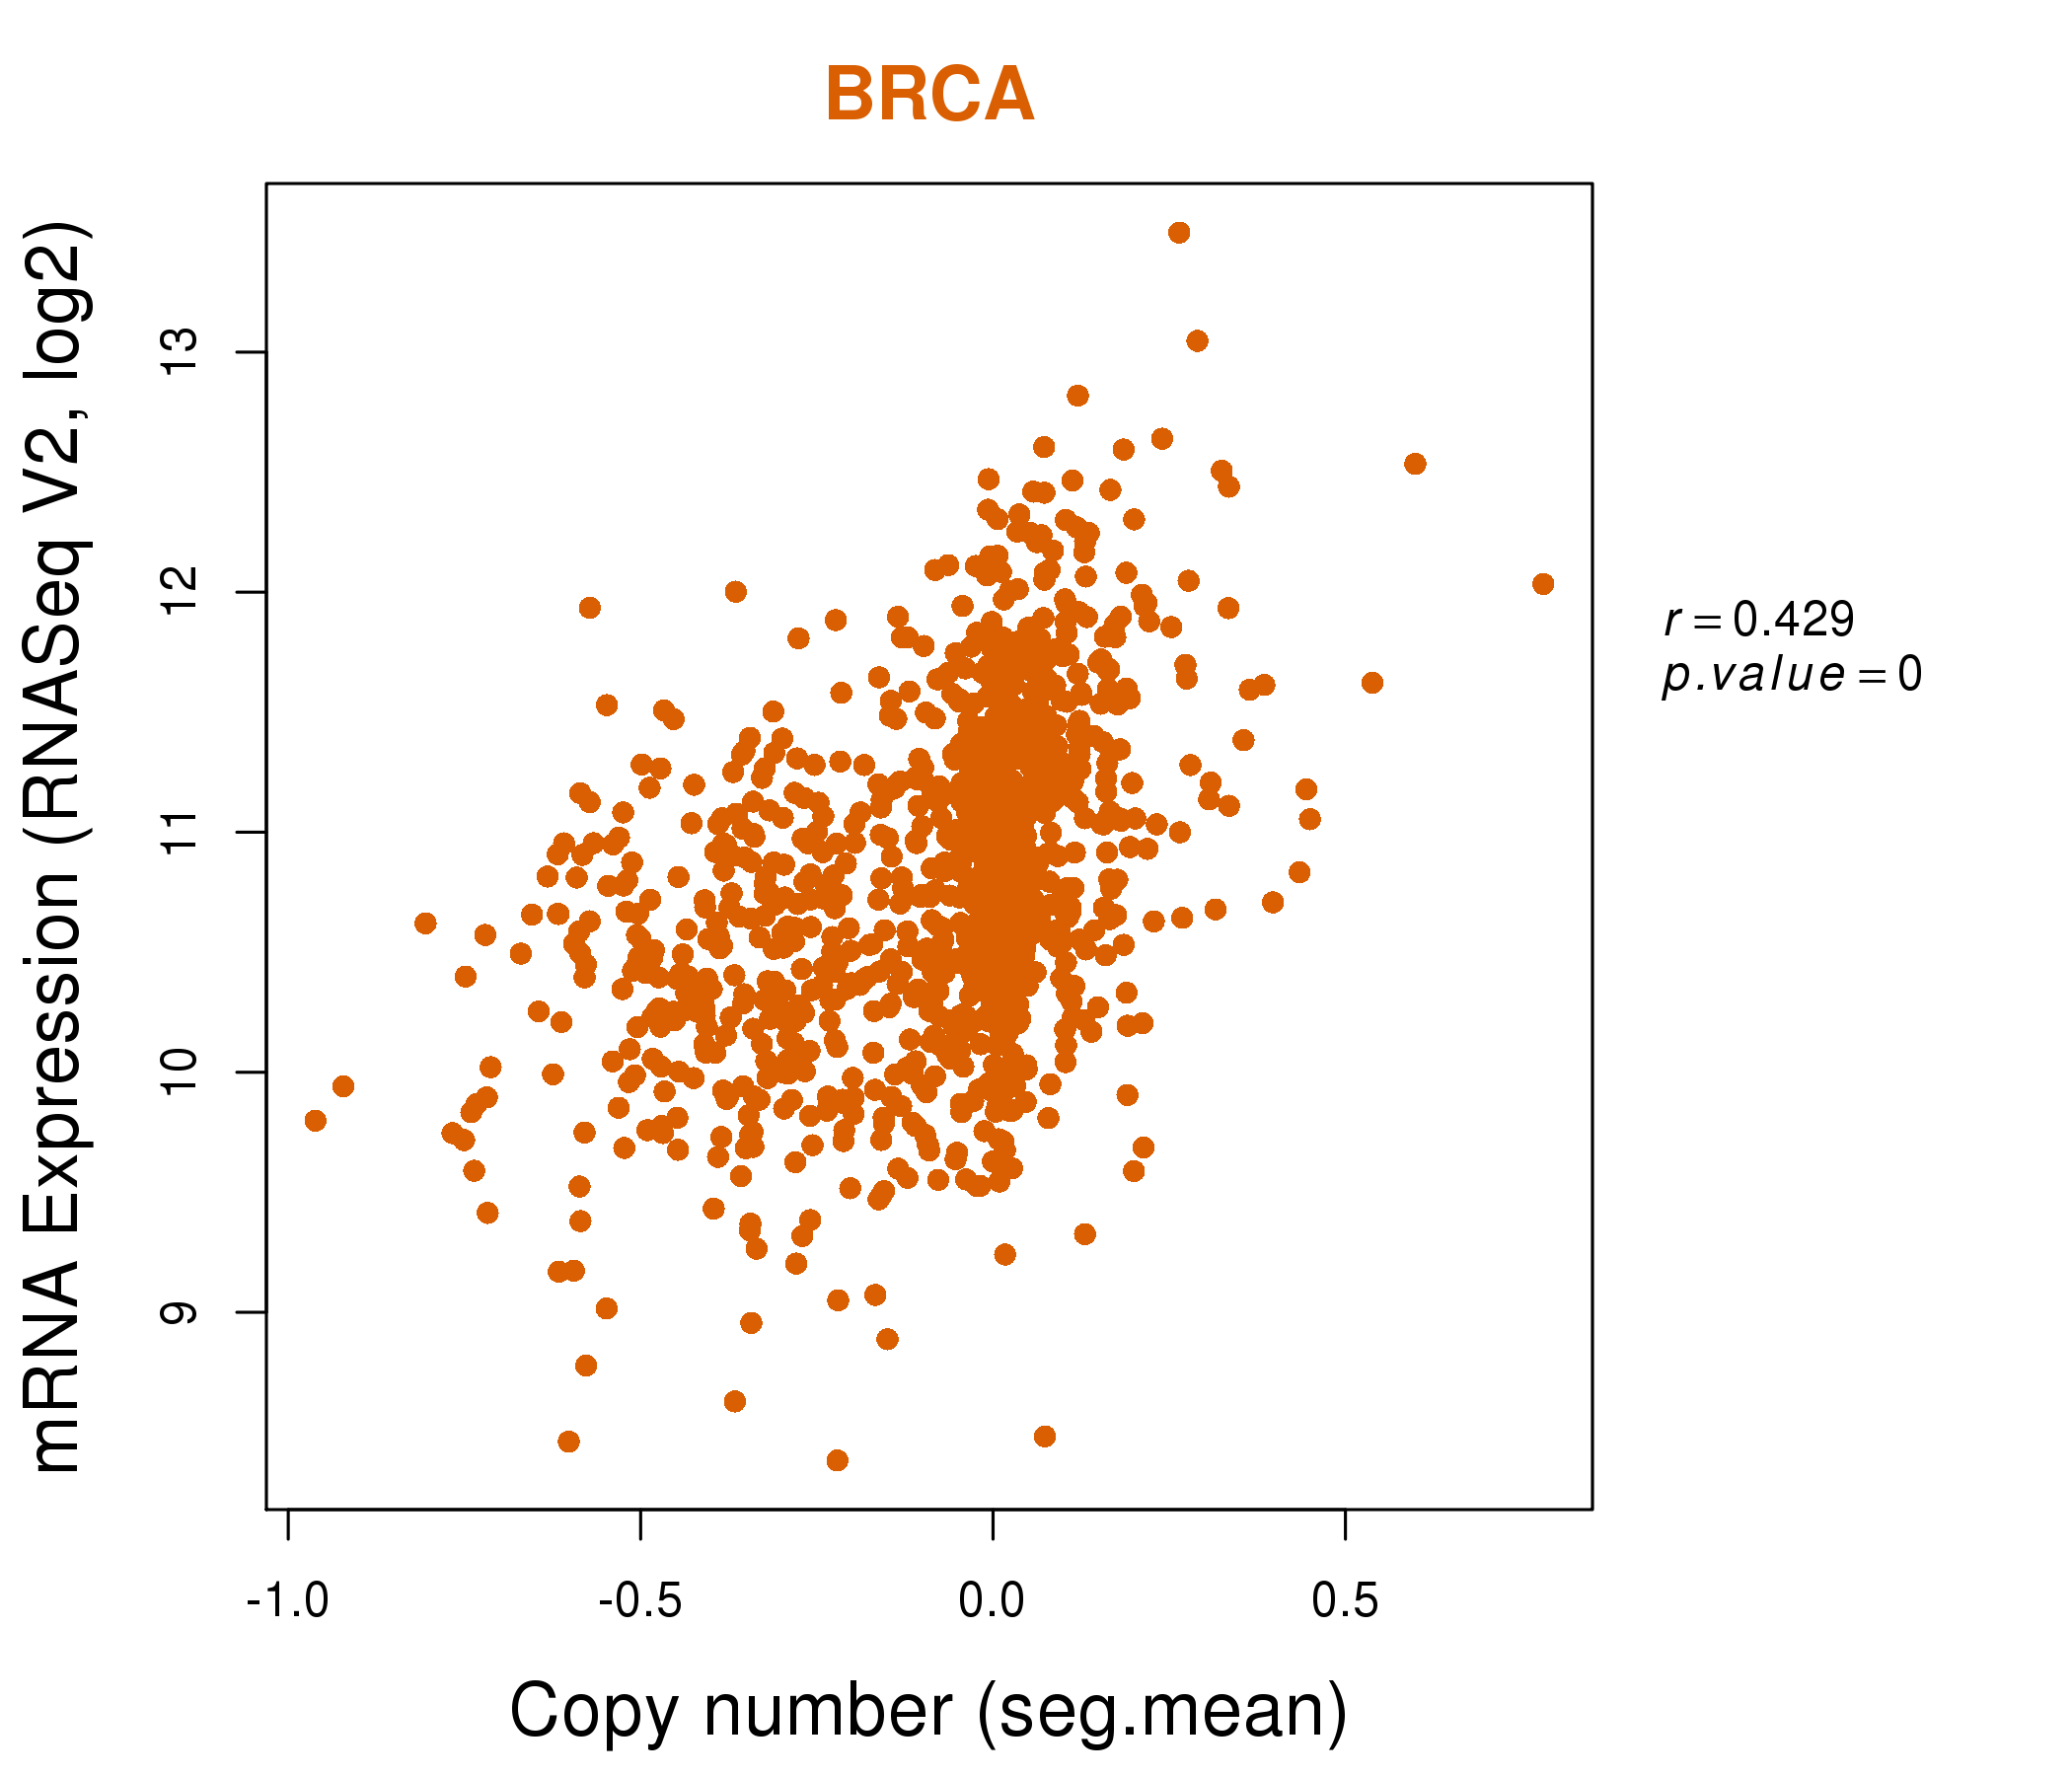
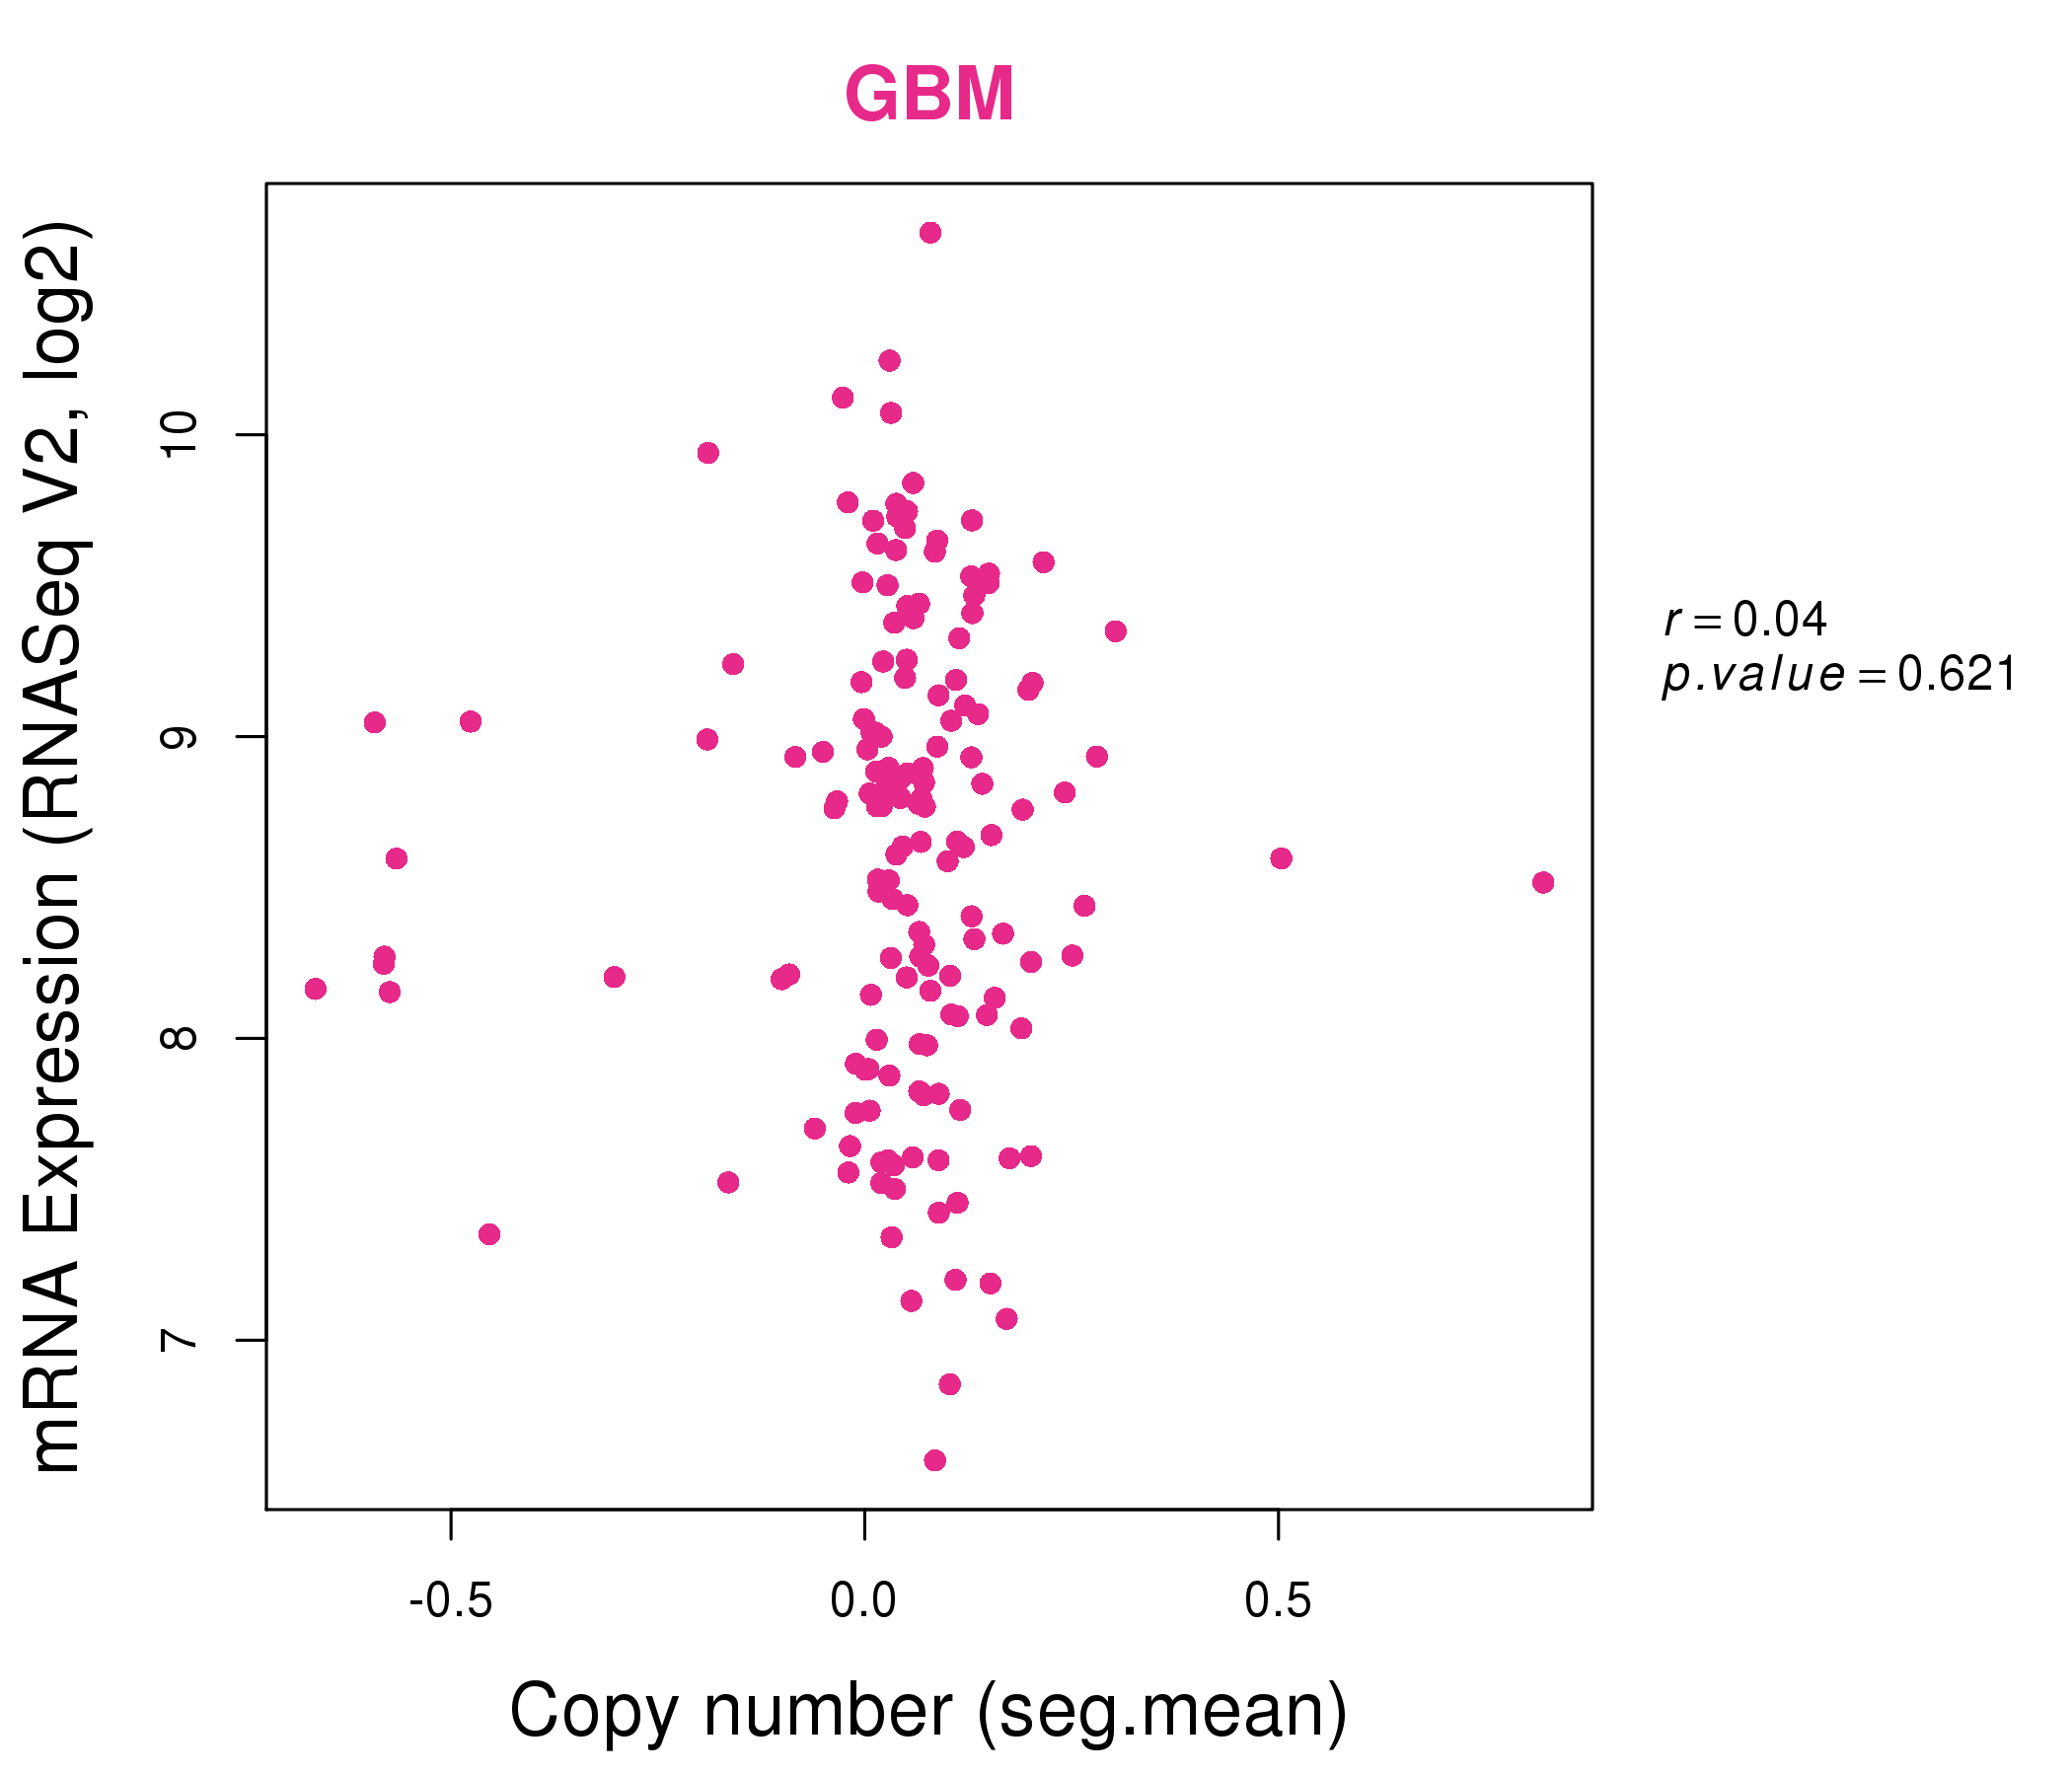
| * This plots show the correlation between CNV and gene expression. |
: Open all plots for all cancer types
 |
|
 |
|
| Top |
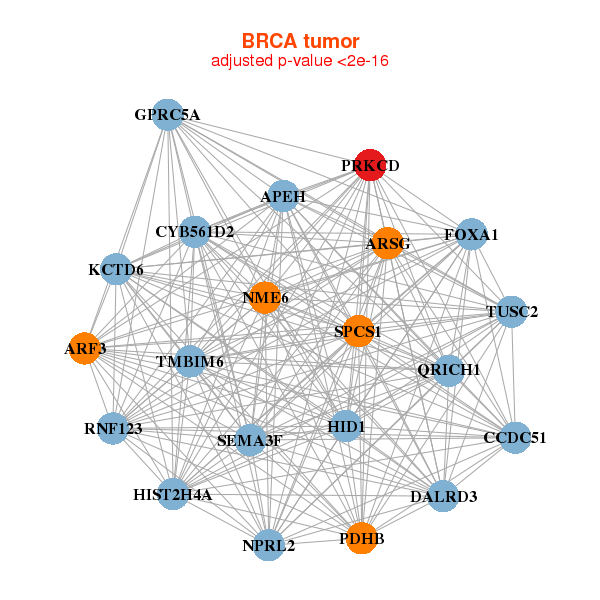
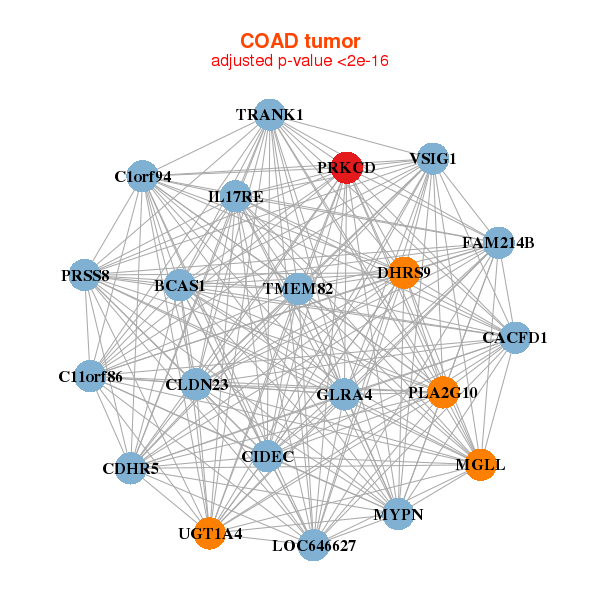
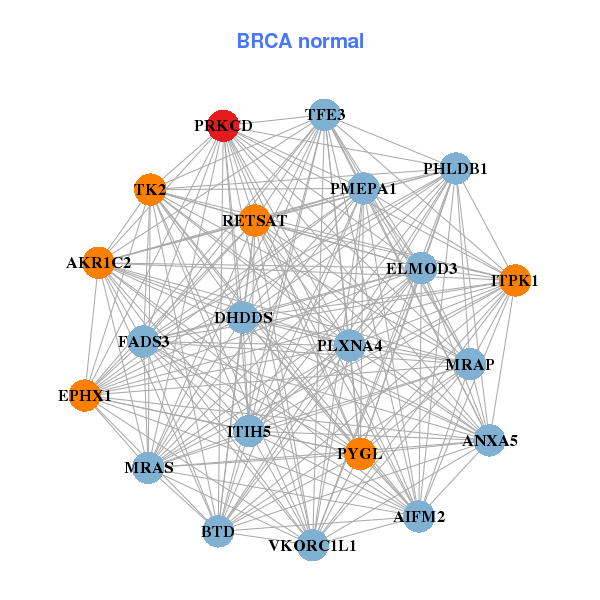
| Gene-Gene Network Information |
| * Co-Expression network figures were drawn using R package igraph. Only the top 20 genes with the highest correlations were shown. Red circle: input gene, orange circle: cell metabolism gene, sky circle: other gene |
: Open all plots for all cancer types
 |
| ||||
| APEH,ARF3,ARSG,HID1,CCDC51,CYB561D2,DALRD3, FOXA1,GPRC5A,HIST2H4A,KCTD6,NME6,NPRL2,PDHB, PRKCD,QRICH1,RNF123,SEMA3F,SPCS1,TMBIM6,TUSC2 | AIFM2,AKR1C2,ANXA5,BTD,DHDDS,ELMOD3,EPHX1, FADS3,ITIH5,ITPK1,MRAP,MRAS,PHLDB1,PLXNA4, PMEPA1,PRKCD,PYGL,RETSAT,TFE3,TK2,VKORC1L1 | ||||
 |
| ||||
| BCAS1,C11orf86,C1orf94,CACFD1,CDHR5,CIDEC,CLDN23, DHRS9,GLRA4,IL17RE,FAM214B,LOC646627,MGLL,MYPN, PLA2G10,PRKCD,PRSS8,TMEM82,TRANK1,UGT1A4,VSIG1 | APPL2,C1orf106,C2CD2L,CGN,CTSZ,DOK4,HECTD3, HHLA2,KIAA0247,LASP1,MAST2,MYO15B,PLEKHG6,PRKCD, SPINT1,TAOK3,TJP3,TRIM36,VDR,VILL,ZBTB7B |
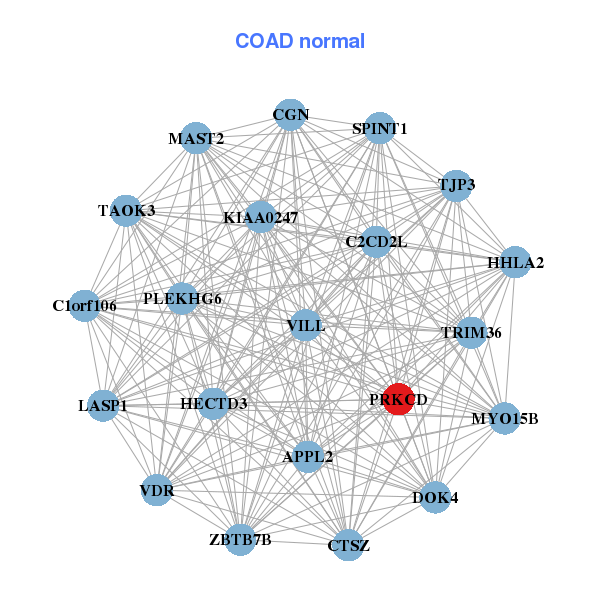
| * Co-Expression network figures were drawn using R package igraph. Only the top 20 genes with the highest correlations were shown. Red circle: input gene, orange circle: cell metabolism gene, sky circle: other gene |
: Open all plots for all cancer types
| Top |
: Open all interacting genes' information including KEGG pathway for all interacting genes from DAVID
| Top |
| Pharmacological Information for PRKCD |
| DB Category | DB Name | DB's ID and Url link |
| Chemistry | BindingDB | Q05655; -. |
| Chemistry | ChEMBL | CHEMBL2093867; -. |
| Chemistry | GuidetoPHARMACOLOGY | 1485; -. |
| Organism-specific databases | PharmGKB | PA33763; -. |
| Organism-specific databases | CTD | 5580; -. |
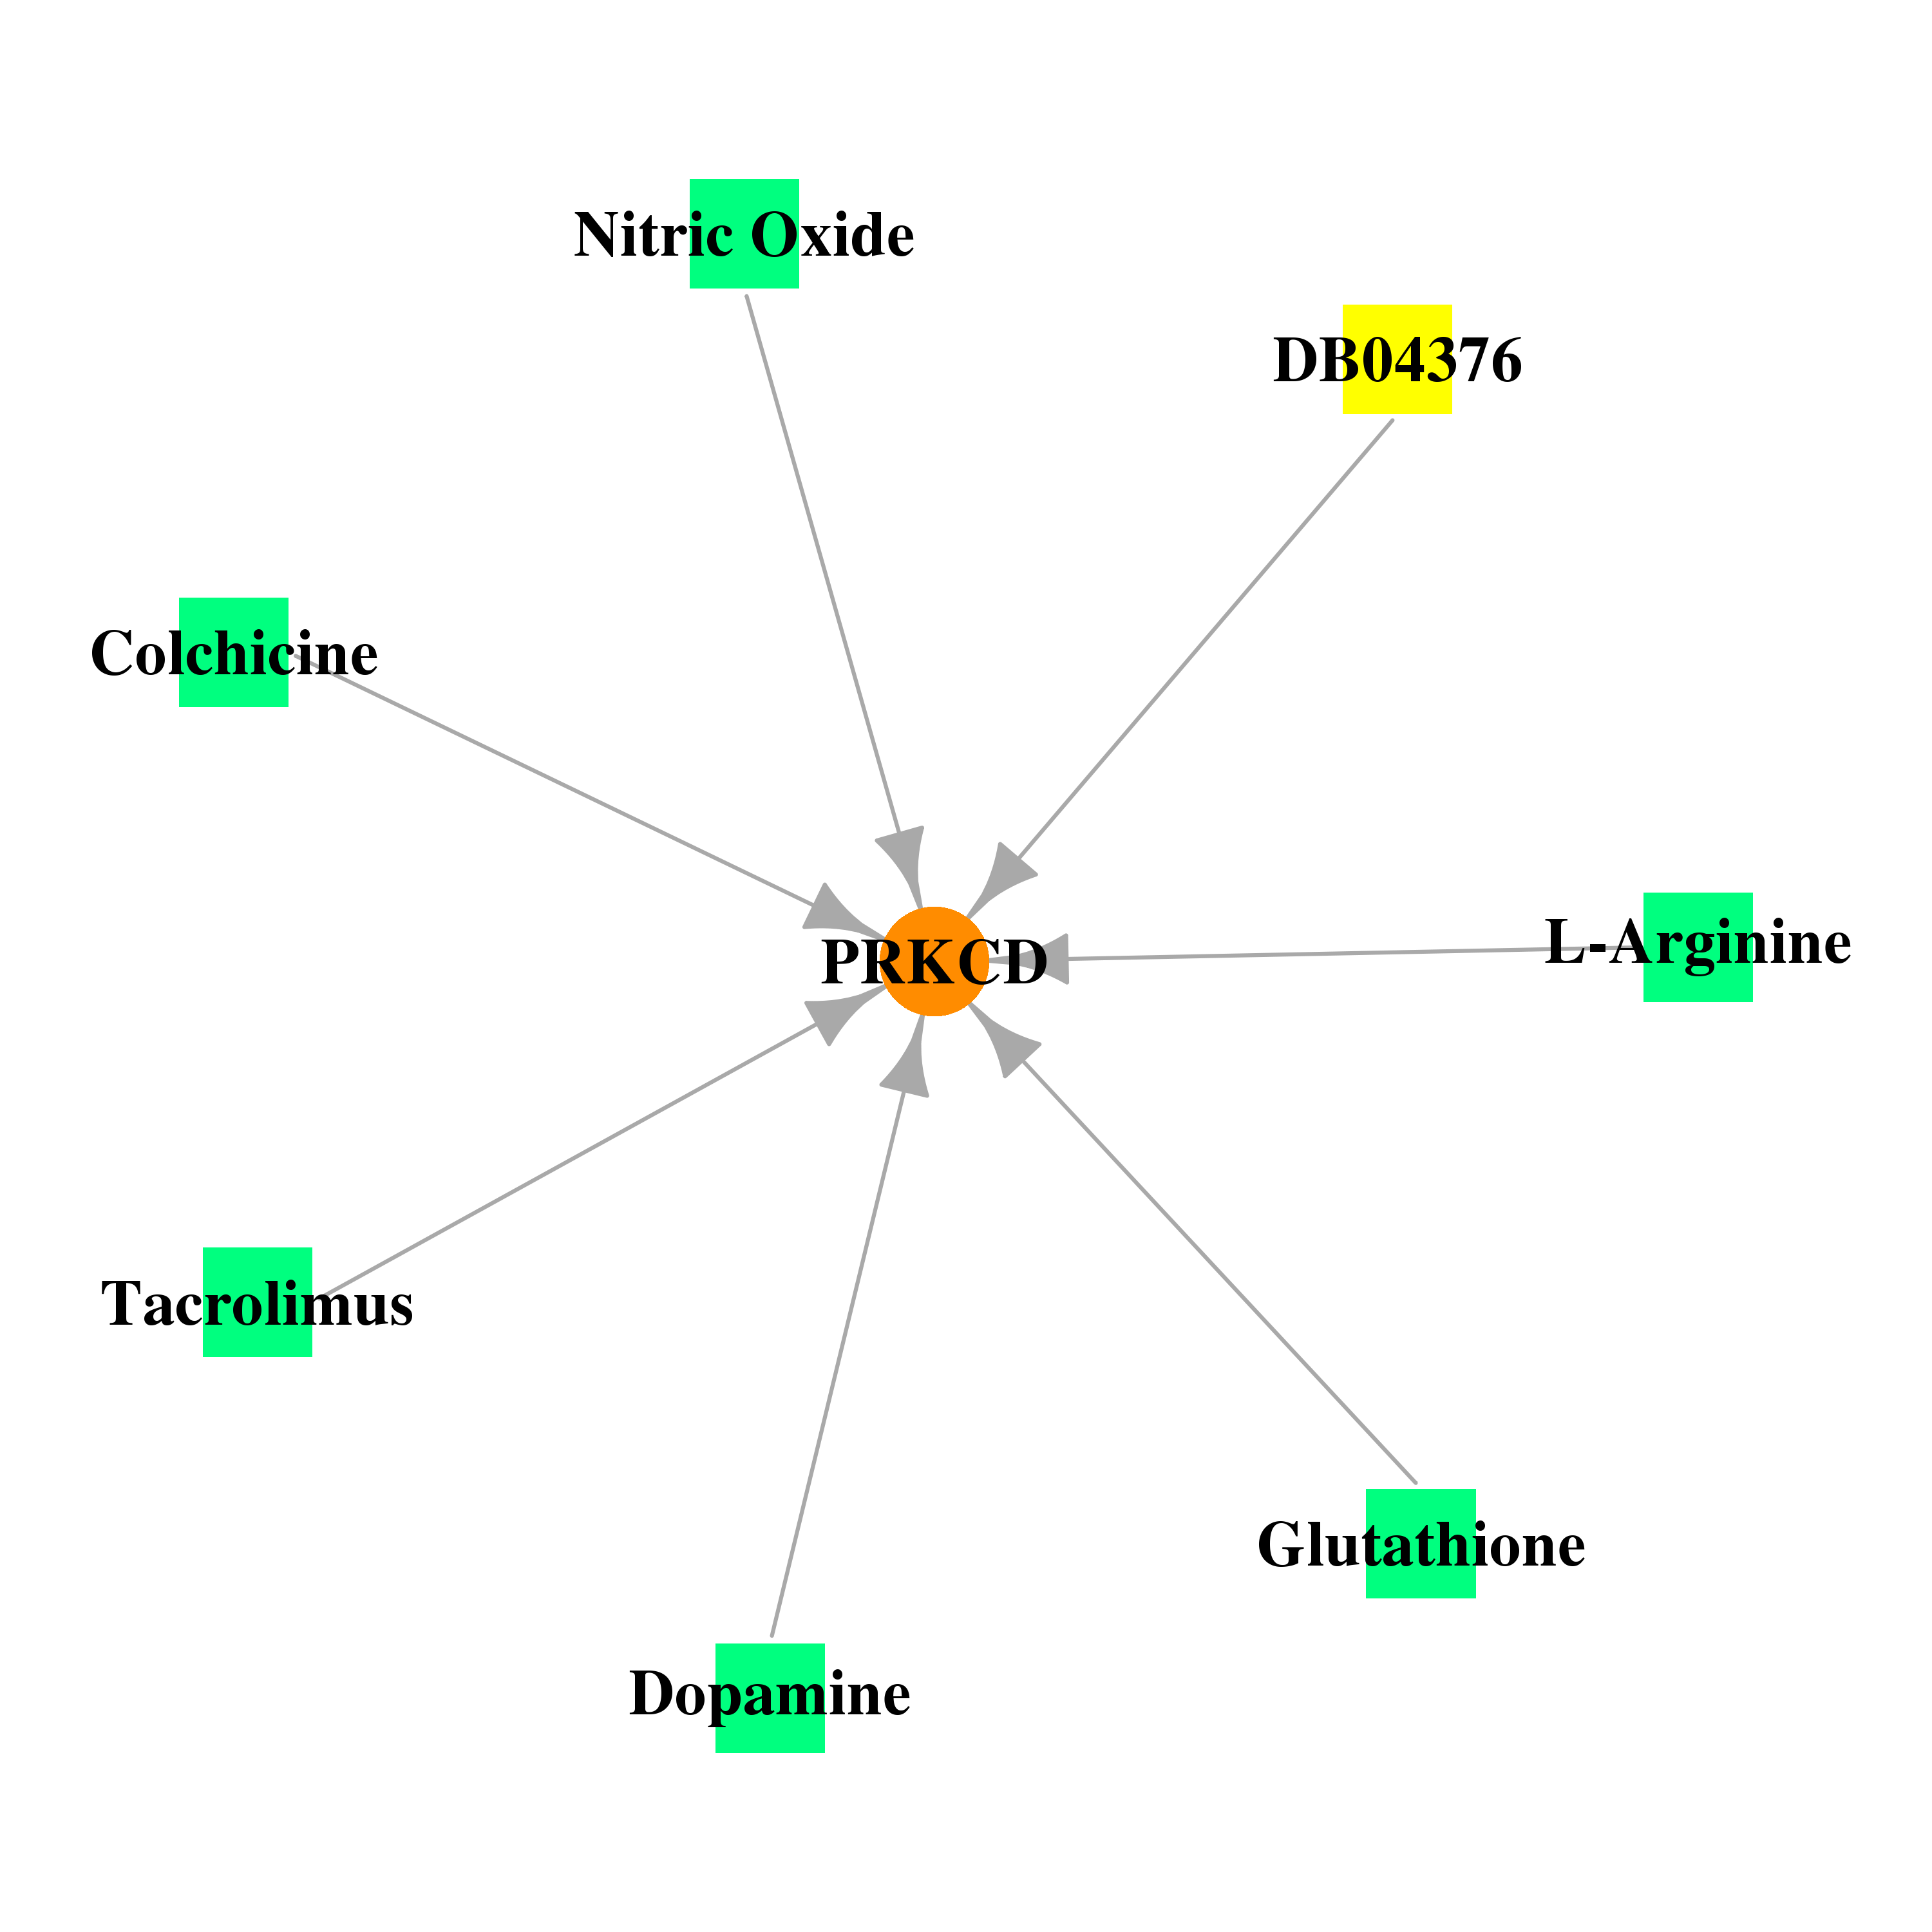
| * Gene Centered Interaction Network. |
 |
| * Drug Centered Interaction Network. |
| DrugBank ID | Target Name | Drug Groups | Generic Name | Drug Centered Network | Drug Structure |
| DB04376 | protein kinase C, delta | experimental | 13-Acetylphorbol | 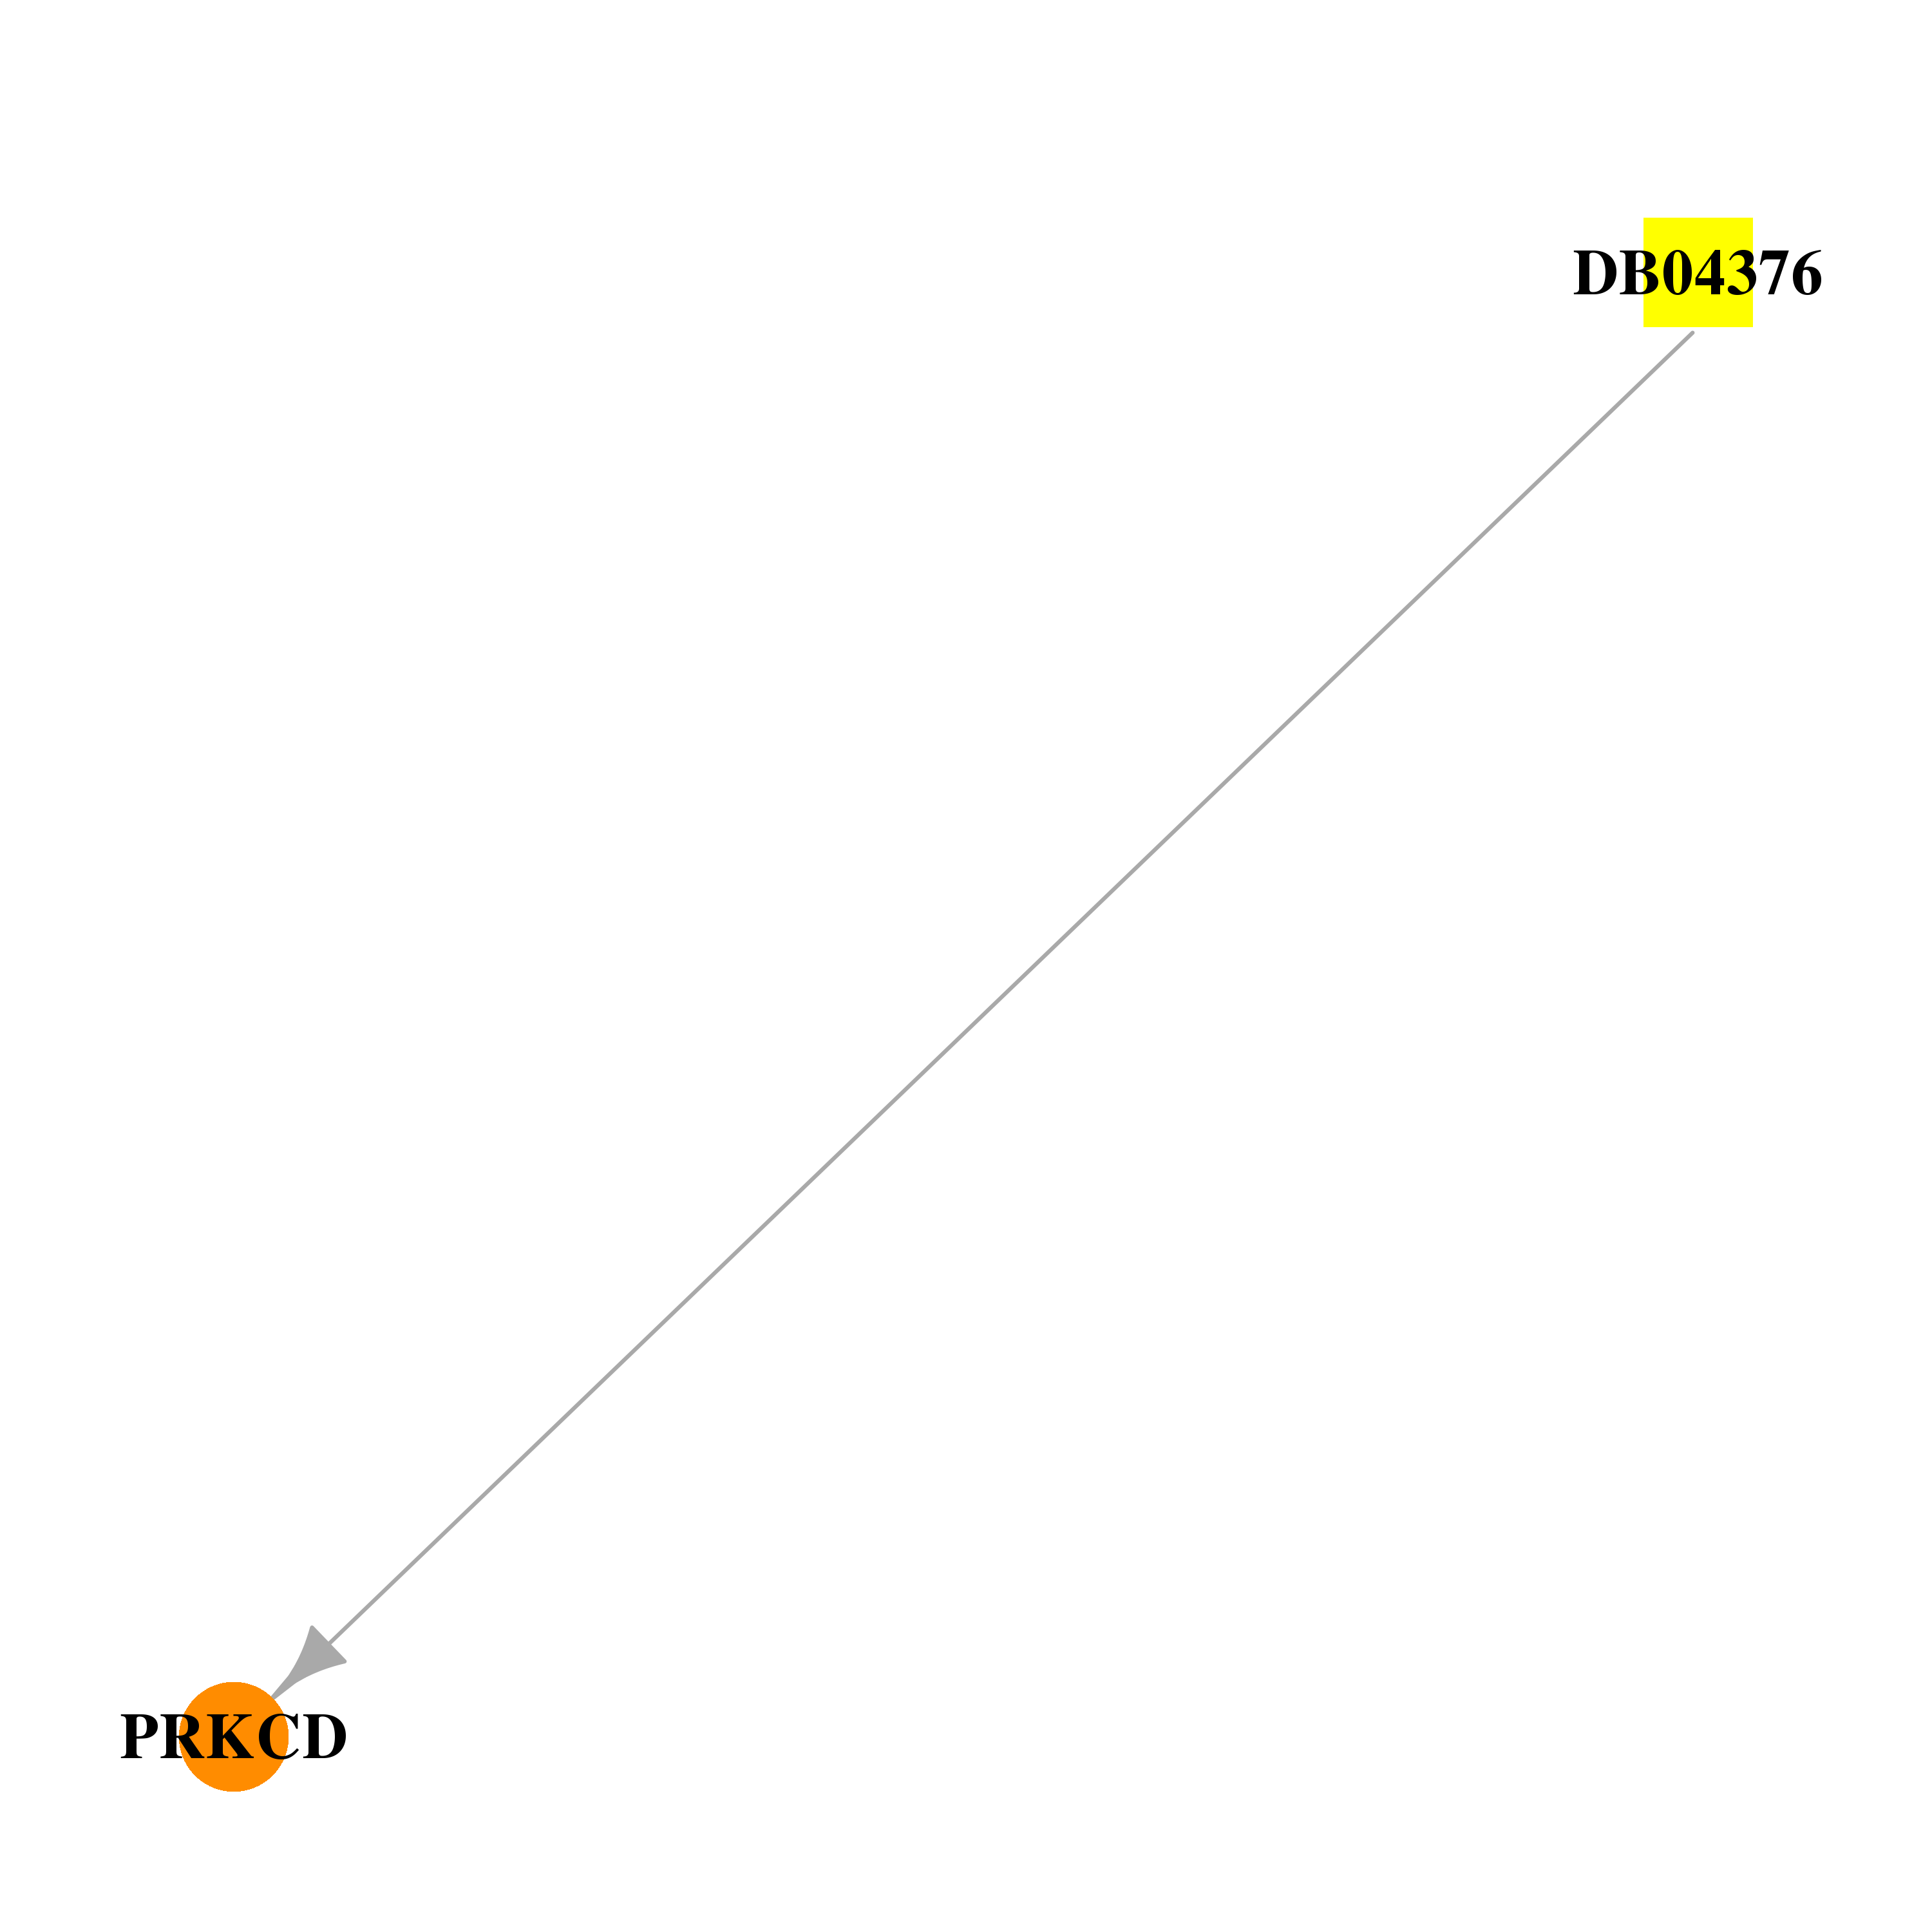 |  |
| DB01394 | protein kinase C, delta | approved | Colchicine | 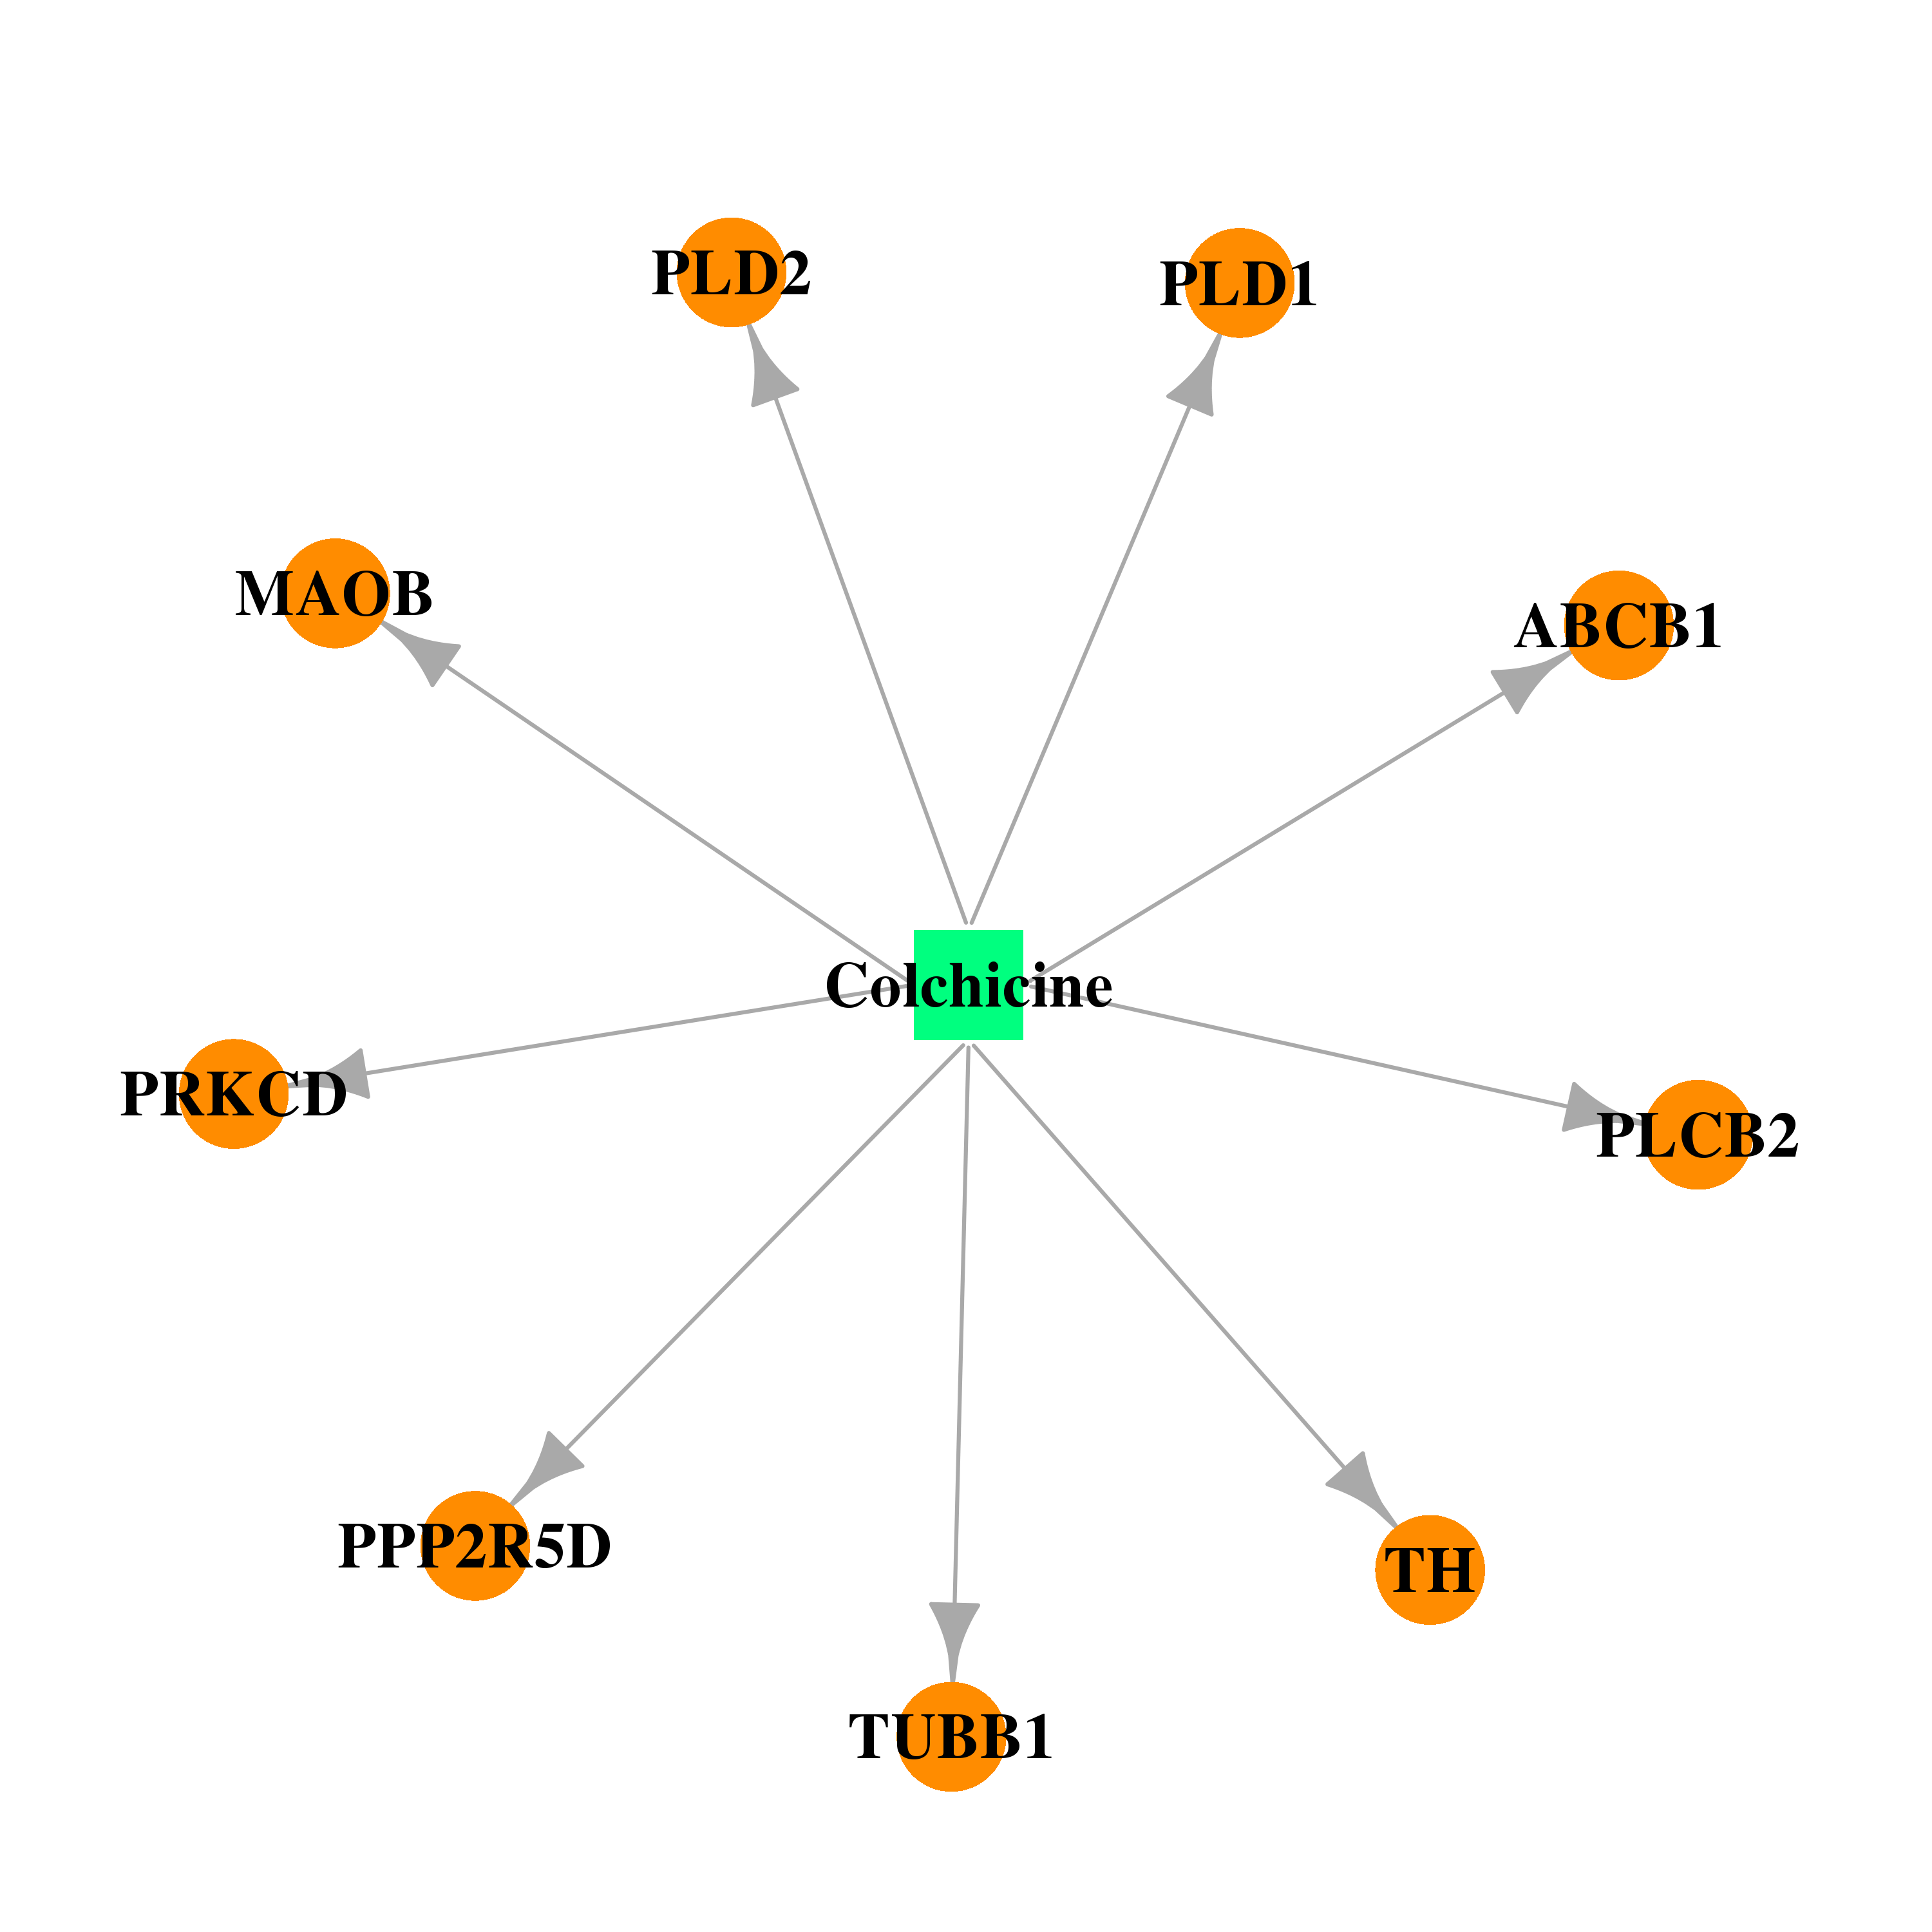 | 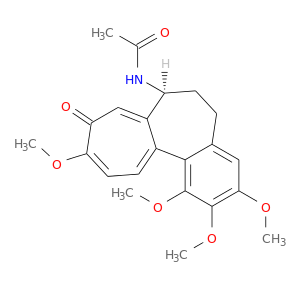 |
| DB00988 | protein kinase C, delta | approved | Dopamine | 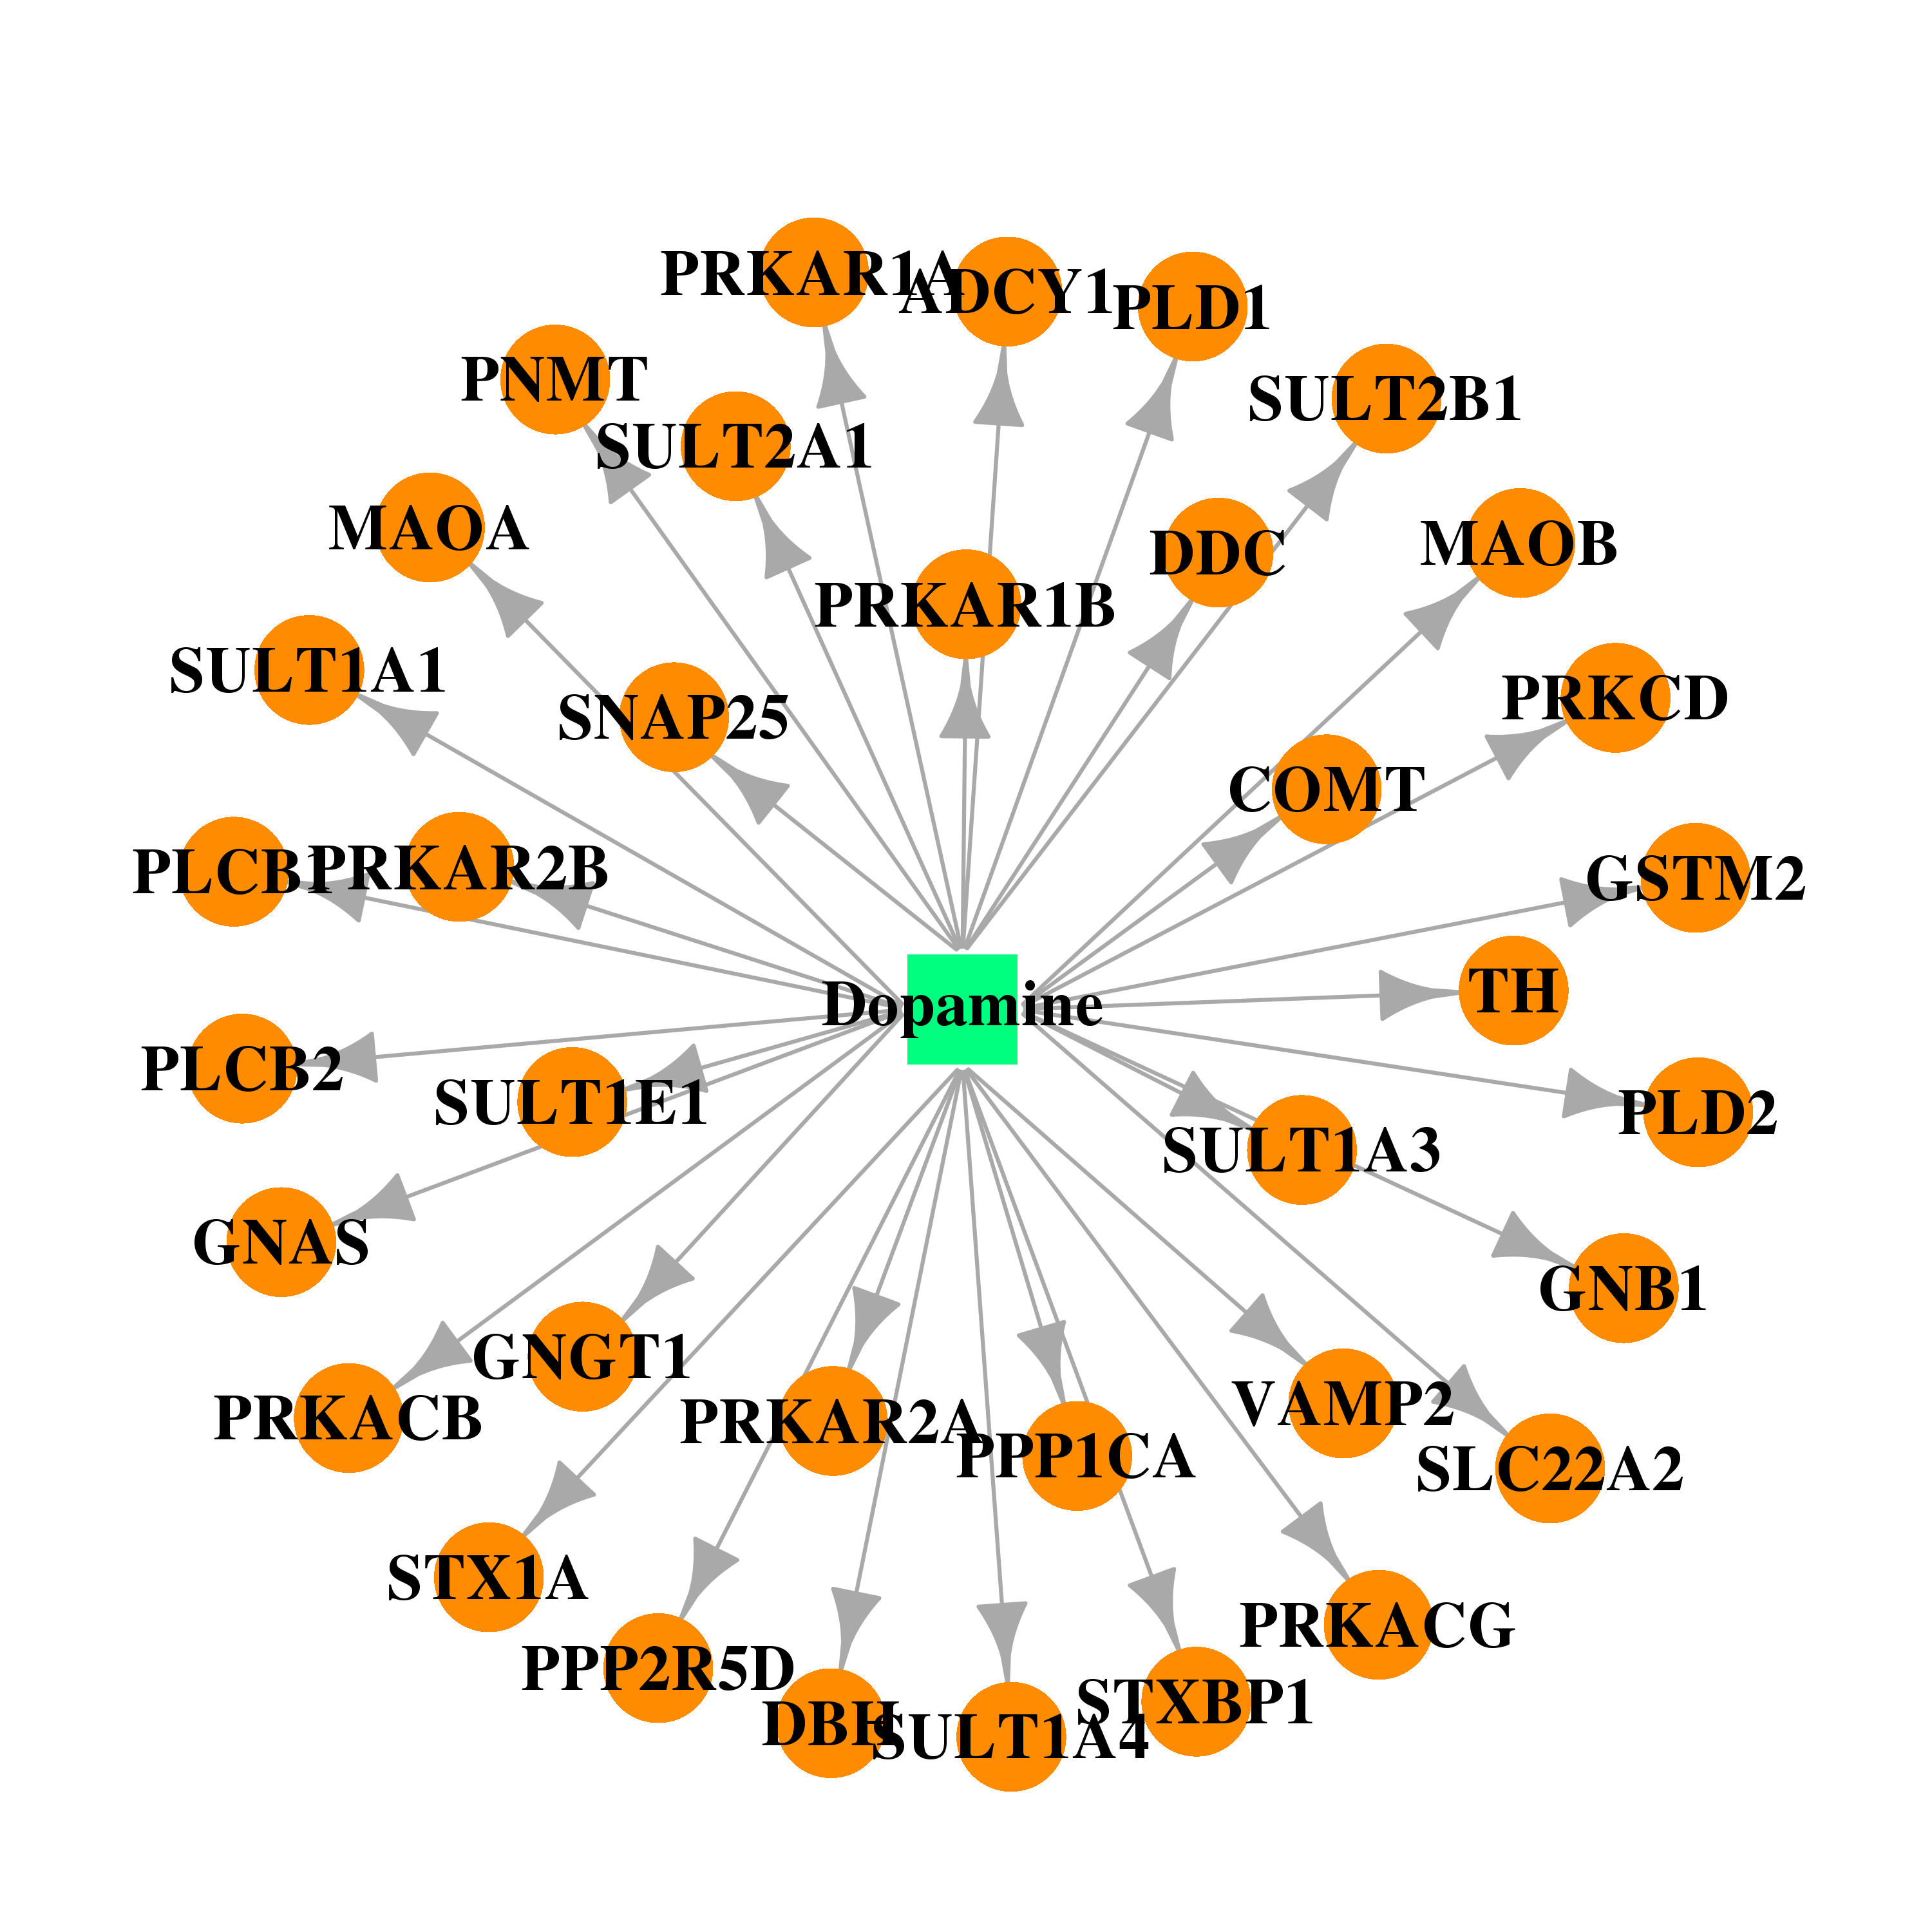 |  |
| DB00143 | protein kinase C, delta | approved; nutraceutical | Glutathione |  |  |
| DB00125 | protein kinase C, delta | approved; nutraceutical | L-Arginine |  |  |
| DB00435 | protein kinase C, delta | approved | Nitric Oxide | 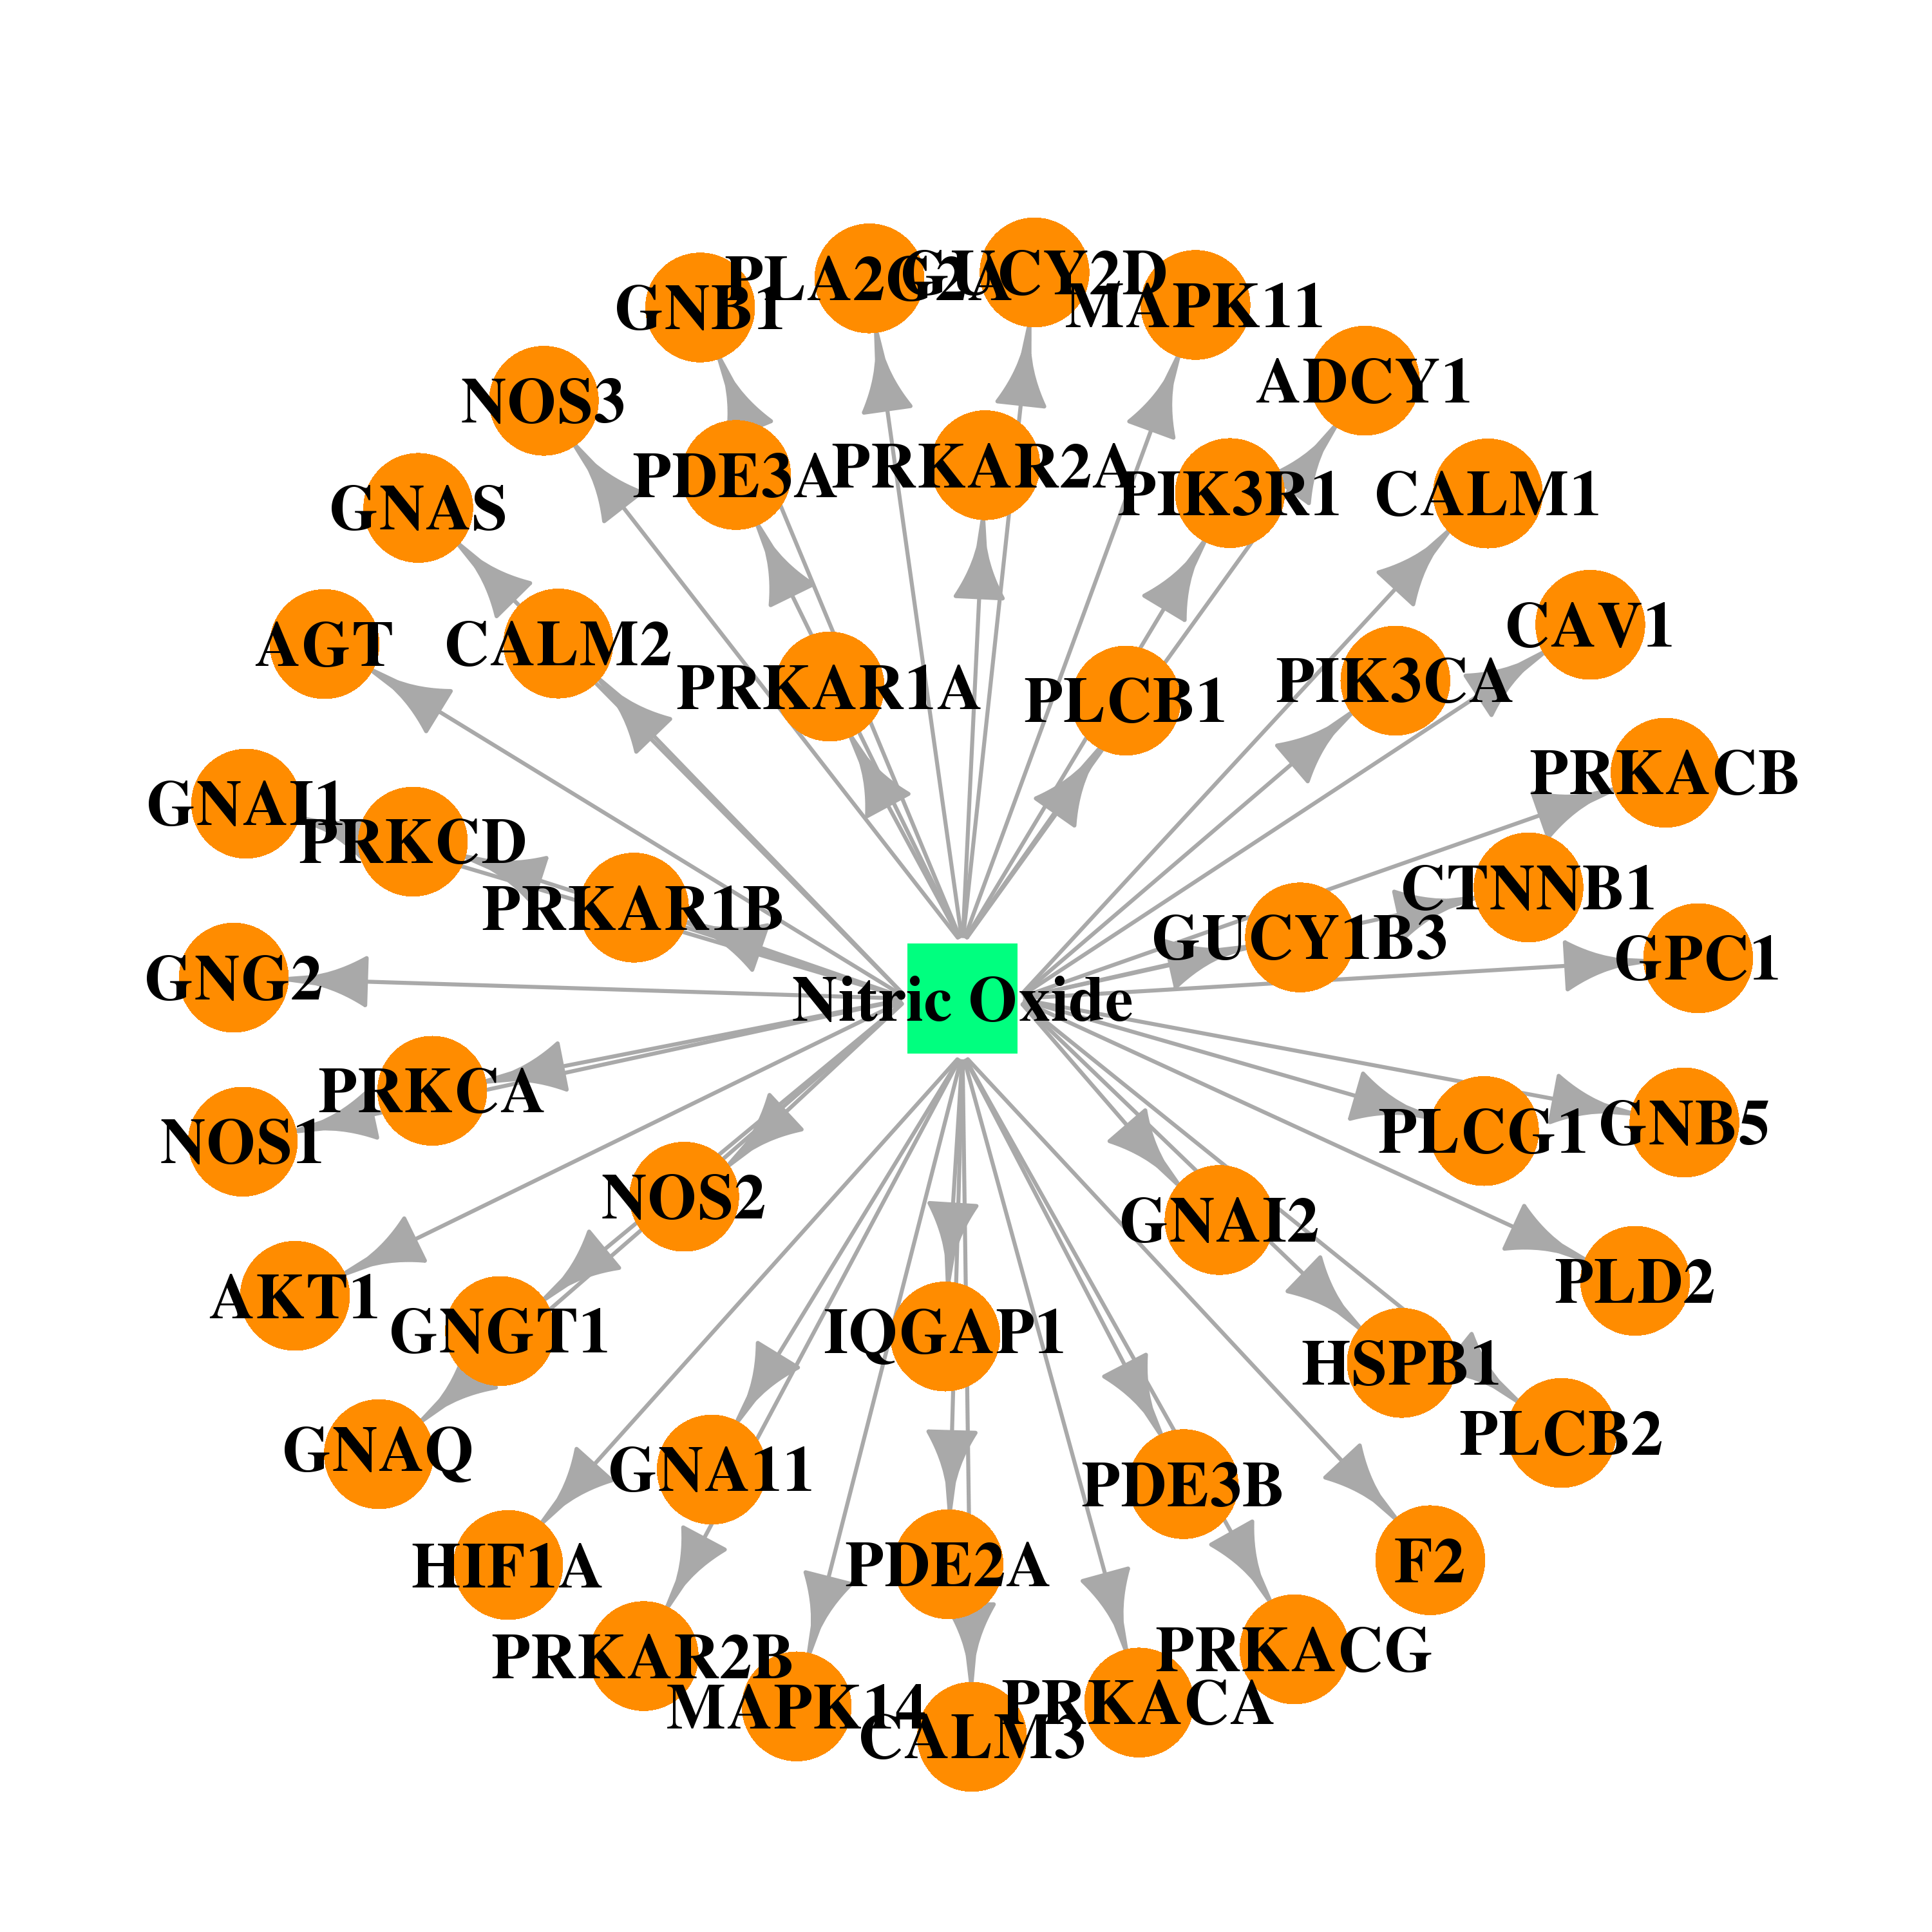 |  |
| DB00864 | protein kinase C, delta | approved; investigational | Tacrolimus |  |  |
| Top |
| Cross referenced IDs for PRKCD |
| * We obtained these cross-references from Uniprot database. It covers 150 different DBs, 18 categories. http://www.uniprot.org/help/cross_references_section |
: Open all cross reference information
|
Copyright © 2016-Present - The Univsersity of Texas Health Science Center at Houston @ |