|
||||||||||||||||||||||||||||||||||||||||||||||||||||||||||||||||||||||||||||||||||||||||||||||||||||||||||||||||||||||||||||||||||||||||||||||||||||||||||||||||||||||||||||||||||||||||||||||||||||||||||||||||||||||||||||||||||||||||||||||||||||||||||||||||||||||||||||||||||||||||||||||||||||||||||||||||||||||||||
| |
| Phenotypic Information (metabolism pathway, cancer, disease, phenome) |
| |
| |
| Gene-Gene Network Information: Co-Expression Network, Interacting Genes & KEGG |
| |
|


| Gene Summary for ADCY10 |
| Top |
| Phenotypic Information for ADCY10(metabolism pathway, cancer, disease, phenome) |
| Cancer | CGAP: ADCY10 |
| Familial Cancer Database: ADCY10 | |
| * This gene is included in those cancer gene databases. |
|
|
|
|
|
| . | ||||||||||||||||||||||||||||||||||||||||||||||||||||||||||||||||||||||||||||||||||||||||||||||||||||||||||||||||||||||||||||||||||||||||||||||||||||||||||||||||||||||||||||||||||||||||||||||||||||||||||||||||||||||||||||||||||||||||||||||||||||||||||||||||||||||||||||||||||||||||||||||||||||||||||||||||||||
Oncogene 1 | Significant driver gene in | |||||||||||||||||||||||||||||||||||||||||||||||||||||||||||||||||||||||||||||||||||||||||||||||||||||||||||||||||||||||||||||||||||||||||||||||||||||||||||||||||||||||||||||||||||||||||||||||||||||||||||||||||||||||||||||||||||||||||||||||||||||||||||||||||||||||||||||||||||||||||||||||||||||||||||||||||||||||||
| cf) number; DB name 1 Oncogene; http://nar.oxfordjournals.org/content/35/suppl_1/D721.long, 2 Tumor Suppressor gene; https://bioinfo.uth.edu/TSGene/, 3 Cancer Gene Census; http://www.nature.com/nrc/journal/v4/n3/abs/nrc1299.html, 4 CancerGenes; http://nar.oxfordjournals.org/content/35/suppl_1/D721.long, 5 Network of Cancer Gene; http://ncg.kcl.ac.uk/index.php, 1Therapeutic Vulnerabilities in Cancer; http://cbio.mskcc.org/cancergenomics/statius/ |
| KEGG_PURINE_METABOLISM | |
| OMIM | |
| Orphanet | |
| Disease | KEGG Disease: ADCY10 |
| MedGen: ADCY10 (Human Medical Genetics with Condition) | |
| ClinVar: ADCY10 | |
| Phenotype | MGI: ADCY10 (International Mouse Phenotyping Consortium) |
| PhenomicDB: ADCY10 | |
| Mutations for ADCY10 |
| * Under tables are showing count per each tissue to give us broad intuition about tissue specific mutation patterns.You can go to the detailed page for each mutation database's web site. |
| - Statistics for Tissue and Mutation type | Top |
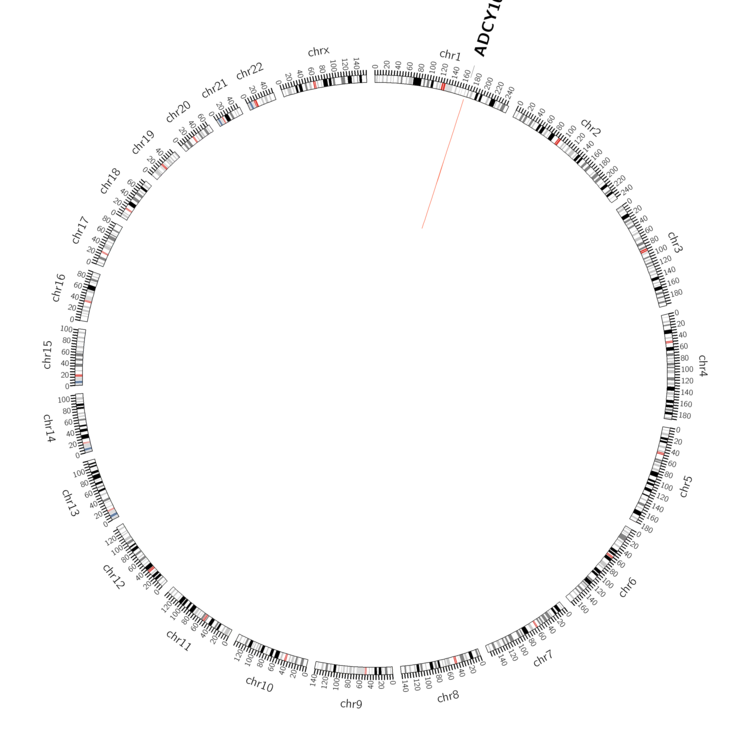 |
| - For Inter-chromosomal Variations |
| There's no inter-chromosomal structural variation. |
| - For Intra-chromosomal Variations |
| * Intra-chromosomal variantions includes 'intrachromosomal amplicon to amplicon', 'intrachromosomal amplicon to non-amplified dna', 'intrachromosomal deletion', 'intrachromosomal fold-back inversion', 'intrachromosomal inversion', 'intrachromosomal tandem duplication', 'Intrachromosomal unknown type', 'intrachromosomal with inverted orientation', 'intrachromosomal with non-inverted orientation'. |
 |
| Sample | Symbol_a | Chr_a | Start_a | End_a | Symbol_b | Chr_b | Start_b | End_b |
| ovary | ADCY10 | chr1 | 167794005 | 167794025 | chr1 | 167773617 | 167773637 | |
| ovary | ADCY10 | chr1 | 167827698 | 167827718 | ADCY10 | chr1 | 167827753 | 167827773 |
| ovary | ADCY10 | chr1 | 167837298 | 167837318 | ADCY10 | chr1 | 167838244 | 167838264 |
| cf) Tissue number; Tissue name (1;Breast, 2;Central_nervous_system, 3;Haematopoietic_and_lymphoid_tissue, 4;Large_intestine, 5;Liver, 6;Lung, 7;Ovary, 8;Pancreas, 9;Prostate, 10;Skin, 11;Soft_tissue, 12;Upper_aerodigestive_tract) |
| * From mRNA Sanger sequences, Chitars2.0 arranged chimeric transcripts. This table shows ADCY10 related fusion information. |
| ID | Head Gene | Tail Gene | Accession | Gene_a | qStart_a | qEnd_a | Chromosome_a | tStart_a | tEnd_a | Gene_a | qStart_a | qEnd_a | Chromosome_a | tStart_a | tEnd_a |
| Top |
| Mutation type/ Tissue ID | brca | cns | cerv | endome | haematopo | kidn | Lintest | liver | lung | ns | ovary | pancre | prost | skin | stoma | thyro | urina | |||
| Total # sample | 2 | 1 | 1 | 1 | 1 | 3 | ||||||||||||||
| GAIN (# sample) | 2 | 1 | 1 | 1 | 1 | 3 | ||||||||||||||
| LOSS (# sample) |
| cf) Tissue ID; Tissue type (1; Breast, 2; Central_nervous_system, 3; Cervix, 4; Endometrium, 5; Haematopoietic_and_lymphoid_tissue, 6; Kidney, 7; Large_intestine, 8; Liver, 9; Lung, 10; NS, 11; Ovary, 12; Pancreas, 13; Prostate, 14; Skin, 15; Stomach, 16; Thyroid, 17; Urinary_tract) |
| Top |
|
 |
| Top |
| Stat. for Non-Synonymous SNVs (# total SNVs=123) | (# total SNVs=46) |
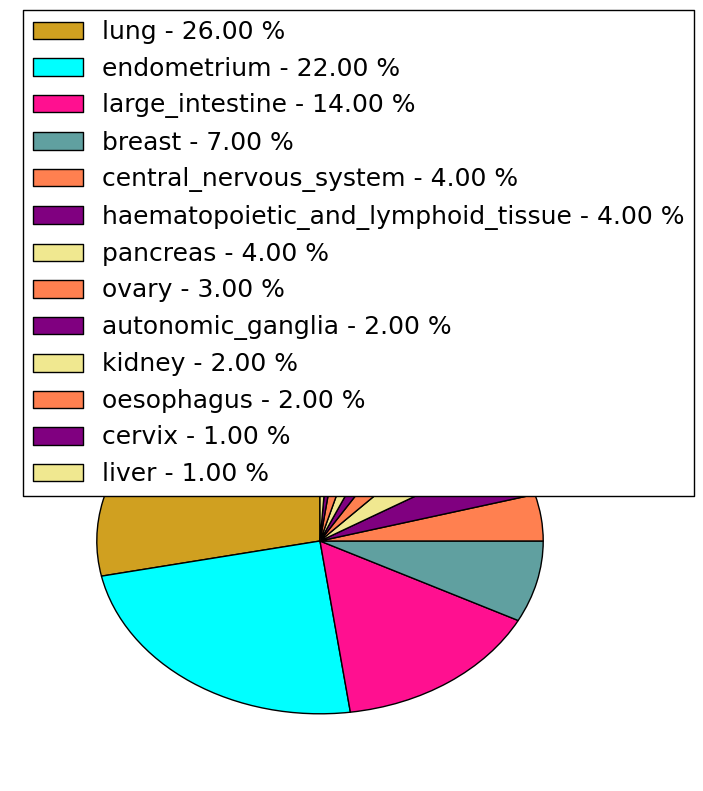 |  |
(# total SNVs=4) | (# total SNVs=3) |
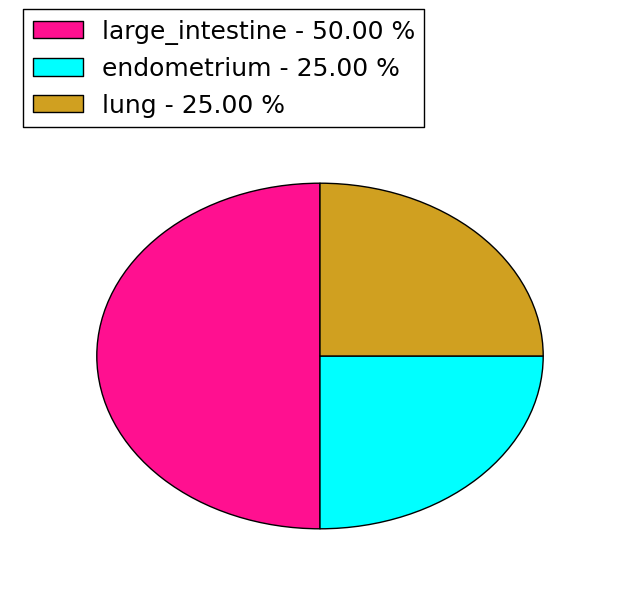 | 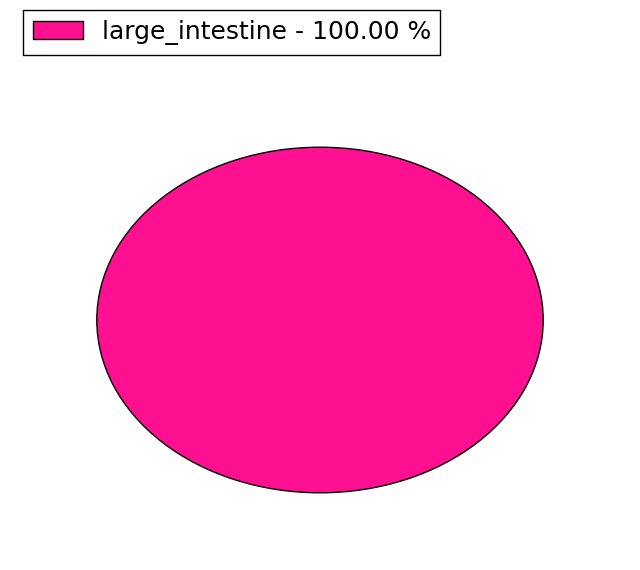 |
| Top |
| * When you move the cursor on each content, you can see more deailed mutation information on the Tooltip. Those are primary_site,primary_histology,mutation(aa),pubmedID. |
| GRCh37 position | Mutation(aa) | Unique sampleID count |
| chr1:167793962-167793962 | p.I1294I | 4 |
| chr1:167791329-167791329 | p.E1407K | 4 |
| chr1:167868652-167868652 | p.? | 3 |
| chr1:167830247-167830247 | p.I557I | 3 |
| chr1:167806486-167806486 | p.? | 2 |
| chr1:167802283-167802283 | p.E1179K | 2 |
| chr1:167814993-167814993 | p.E939K | 2 |
| chr1:167815256-167815256 | p.R895C | 2 |
| chr1:167779026-167779026 | p.T1574T | 2 |
| chr1:167823724-167823724 | p.Y725Y | 2 |
| Top |
|
 |
| Point Mutation/ Tissue ID | 1 | 2 | 3 | 4 | 5 | 6 | 7 | 8 | 9 | 10 | 11 | 12 | 13 | 14 | 15 | 16 | 17 | 18 | 19 | 20 |
| # sample | 7 | 7 | 3 | 12 | 1 | 4 | 1 | 1 | 18 | 7 | 2 | 34 | 12 | 1 | 17 | |||||
| # mutation | 8 | 7 | 3 | 17 | 1 | 4 | 1 | 1 | 18 | 7 | 2 | 43 | 12 | 1 | 34 | |||||
| nonsynonymous SNV | 6 | 4 | 2 | 8 | 1 | 3 | 1 | 1 | 17 | 6 | 2 | 25 | 9 | 1 | 27 | |||||
| synonymous SNV | 2 | 3 | 1 | 9 | 1 | 1 | 1 | 18 | 3 | 7 |
| cf) Tissue ID; Tissue type (1; BLCA[Bladder Urothelial Carcinoma], 2; BRCA[Breast invasive carcinoma], 3; CESC[Cervical squamous cell carcinoma and endocervical adenocarcinoma], 4; COAD[Colon adenocarcinoma], 5; GBM[Glioblastoma multiforme], 6; Glioma Low Grade, 7; HNSC[Head and Neck squamous cell carcinoma], 8; KICH[Kidney Chromophobe], 9; KIRC[Kidney renal clear cell carcinoma], 10; KIRP[Kidney renal papillary cell carcinoma], 11; LAML[Acute Myeloid Leukemia], 12; LUAD[Lung adenocarcinoma], 13; LUSC[Lung squamous cell carcinoma], 14; OV[Ovarian serous cystadenocarcinoma ], 15; PAAD[Pancreatic adenocarcinoma], 16; PRAD[Prostate adenocarcinoma], 17; SKCM[Skin Cutaneous Melanoma], 18:STAD[Stomach adenocarcinoma], 19:THCA[Thyroid carcinoma], 20:UCEC[Uterine Corpus Endometrial Carcinoma]) |
| Top |
| * We represented just top 10 SNVs. When you move the cursor on each content, you can see more deailed mutation information on the Tooltip. Those are primary_site, primary_histology, mutation(aa), pubmedID. |
| Genomic Position | Mutation(aa) | Unique sampleID count |
| chr1:167805745 | p.S303C,ADCY10 | 2 |
| chr1:167815465 | p.F884L,ADCY10 | 2 |
| chr1:167849384 | p.I242I,ADCY10 | 2 |
| chr1:167839635 | p.D551N,ADCY10 | 2 |
| chr1:167825464 | p.T1421T,ADCY10 | 2 |
| chr1:167814888 | p.P821S,ADCY10 | 2 |
| chr1:167787447 | p.S672F,ADCY10 | 2 |
| chr1:167852753 | p.I161I,ADCY10 | 2 |
| chr1:167829051 | p.L477L,ADCY10 | 2 |
| chr1:167852756 | p.E339D,ADCY10 | 2 |
| * Copy number data were extracted from TCGA using R package TCGA-Assembler. The URLs of all public data files on TCGA DCC data server were gathered on Jan-05-2015. Function ProcessCNAData in TCGA-Assembler package was used to obtain gene-level copy number value which is calculated as the average copy number of the genomic region of a gene. |
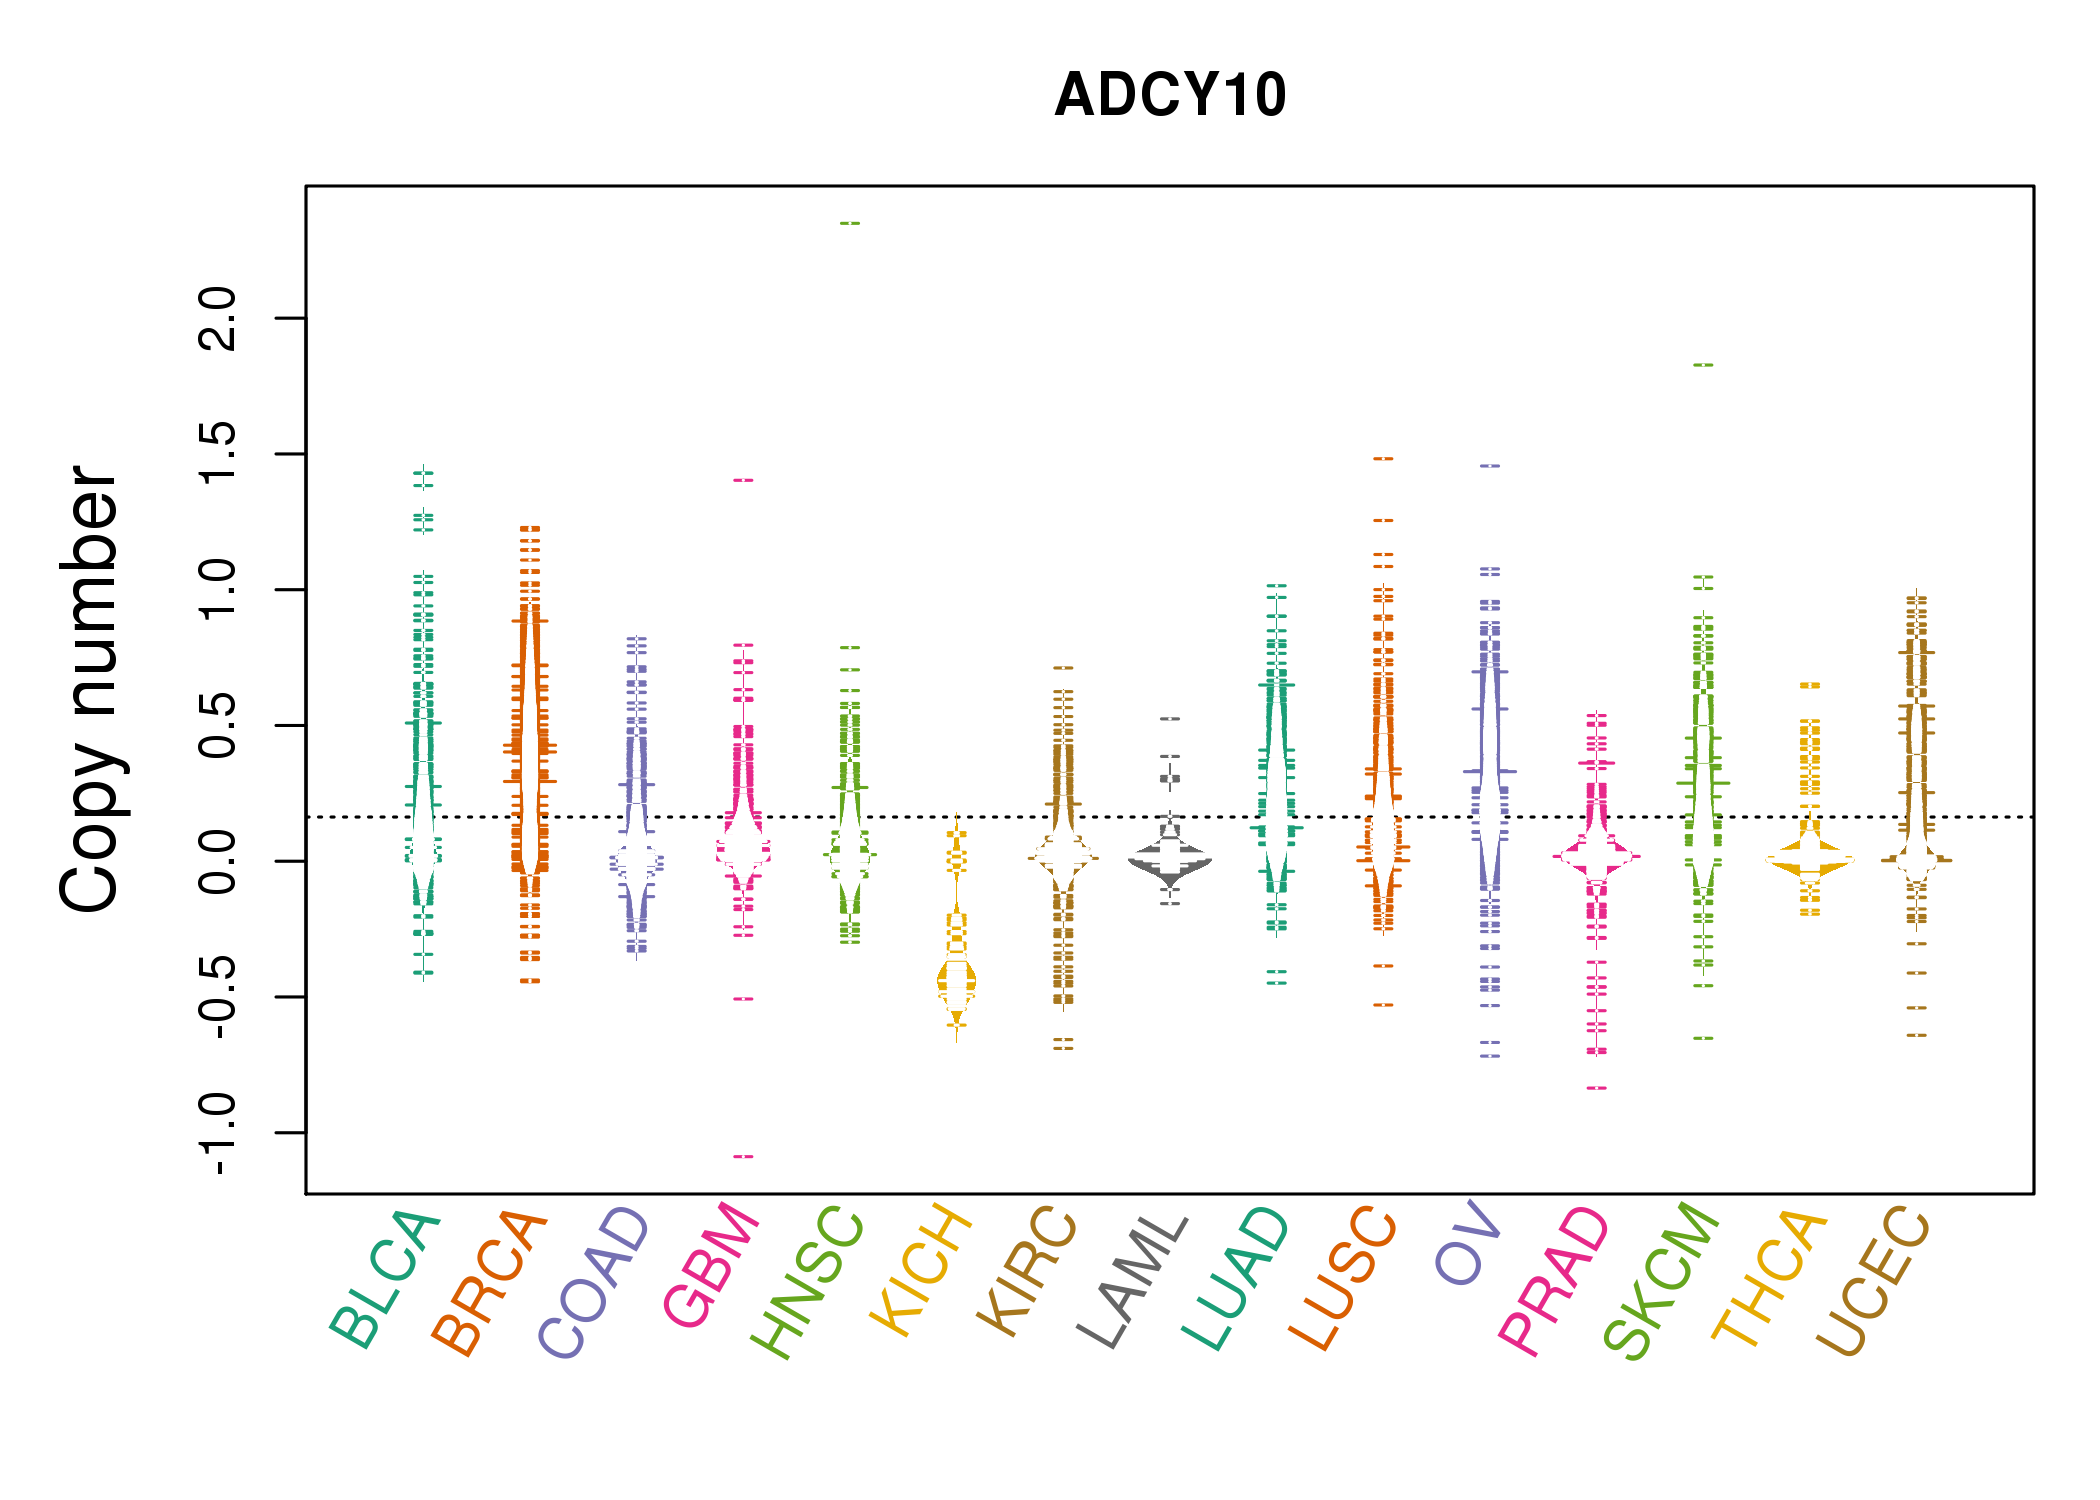 |
| cf) Tissue ID[Tissue type]: BLCA[Bladder Urothelial Carcinoma], BRCA[Breast invasive carcinoma], CESC[Cervical squamous cell carcinoma and endocervical adenocarcinoma], COAD[Colon adenocarcinoma], GBM[Glioblastoma multiforme], Glioma Low Grade, HNSC[Head and Neck squamous cell carcinoma], KICH[Kidney Chromophobe], KIRC[Kidney renal clear cell carcinoma], KIRP[Kidney renal papillary cell carcinoma], LAML[Acute Myeloid Leukemia], LUAD[Lung adenocarcinoma], LUSC[Lung squamous cell carcinoma], OV[Ovarian serous cystadenocarcinoma ], PAAD[Pancreatic adenocarcinoma], PRAD[Prostate adenocarcinoma], SKCM[Skin Cutaneous Melanoma], STAD[Stomach adenocarcinoma], THCA[Thyroid carcinoma], UCEC[Uterine Corpus Endometrial Carcinoma] |
| Top |
| Gene Expression for ADCY10 |
| * CCLE gene expression data were extracted from CCLE_Expression_Entrez_2012-10-18.res: Gene-centric RMA-normalized mRNA expression data. |
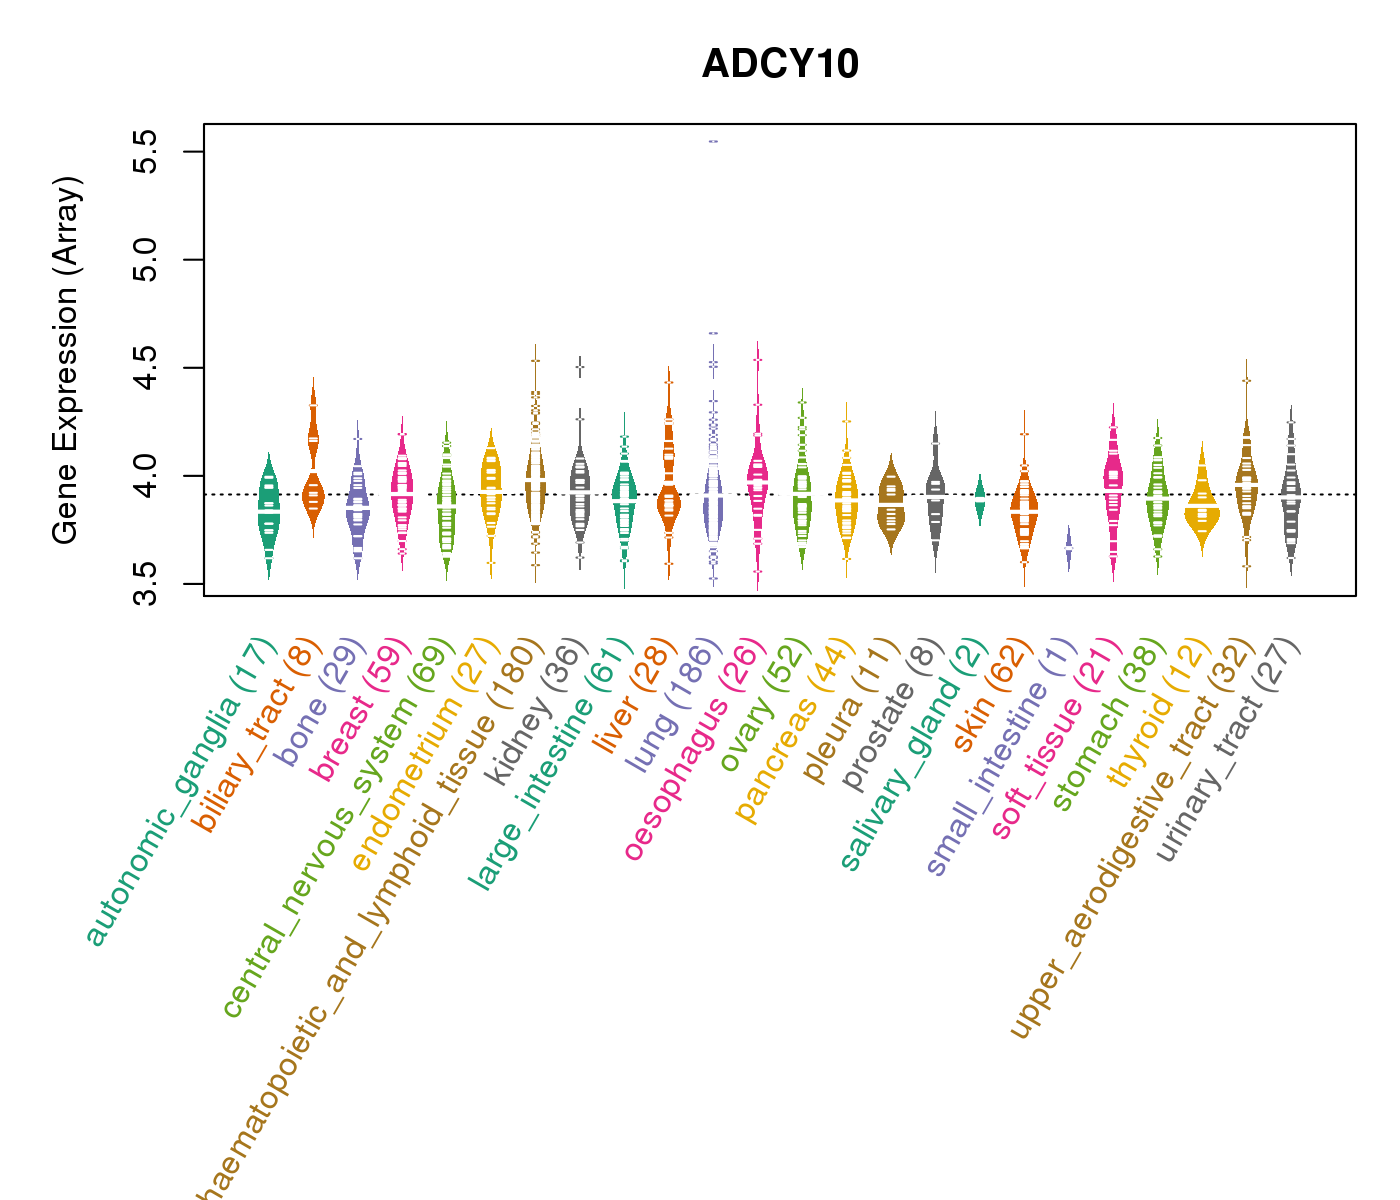 |
| * Normalized gene expression data of RNASeqV2 was extracted from TCGA using R package TCGA-Assembler. The URLs of all public data files on TCGA DCC data server were gathered at Jan-05-2015. Only eight cancer types have enough normal control samples for differential expression analysis. (t test, adjusted p<0.05 (using Benjamini-Hochberg FDR)) |
 |
| Top |
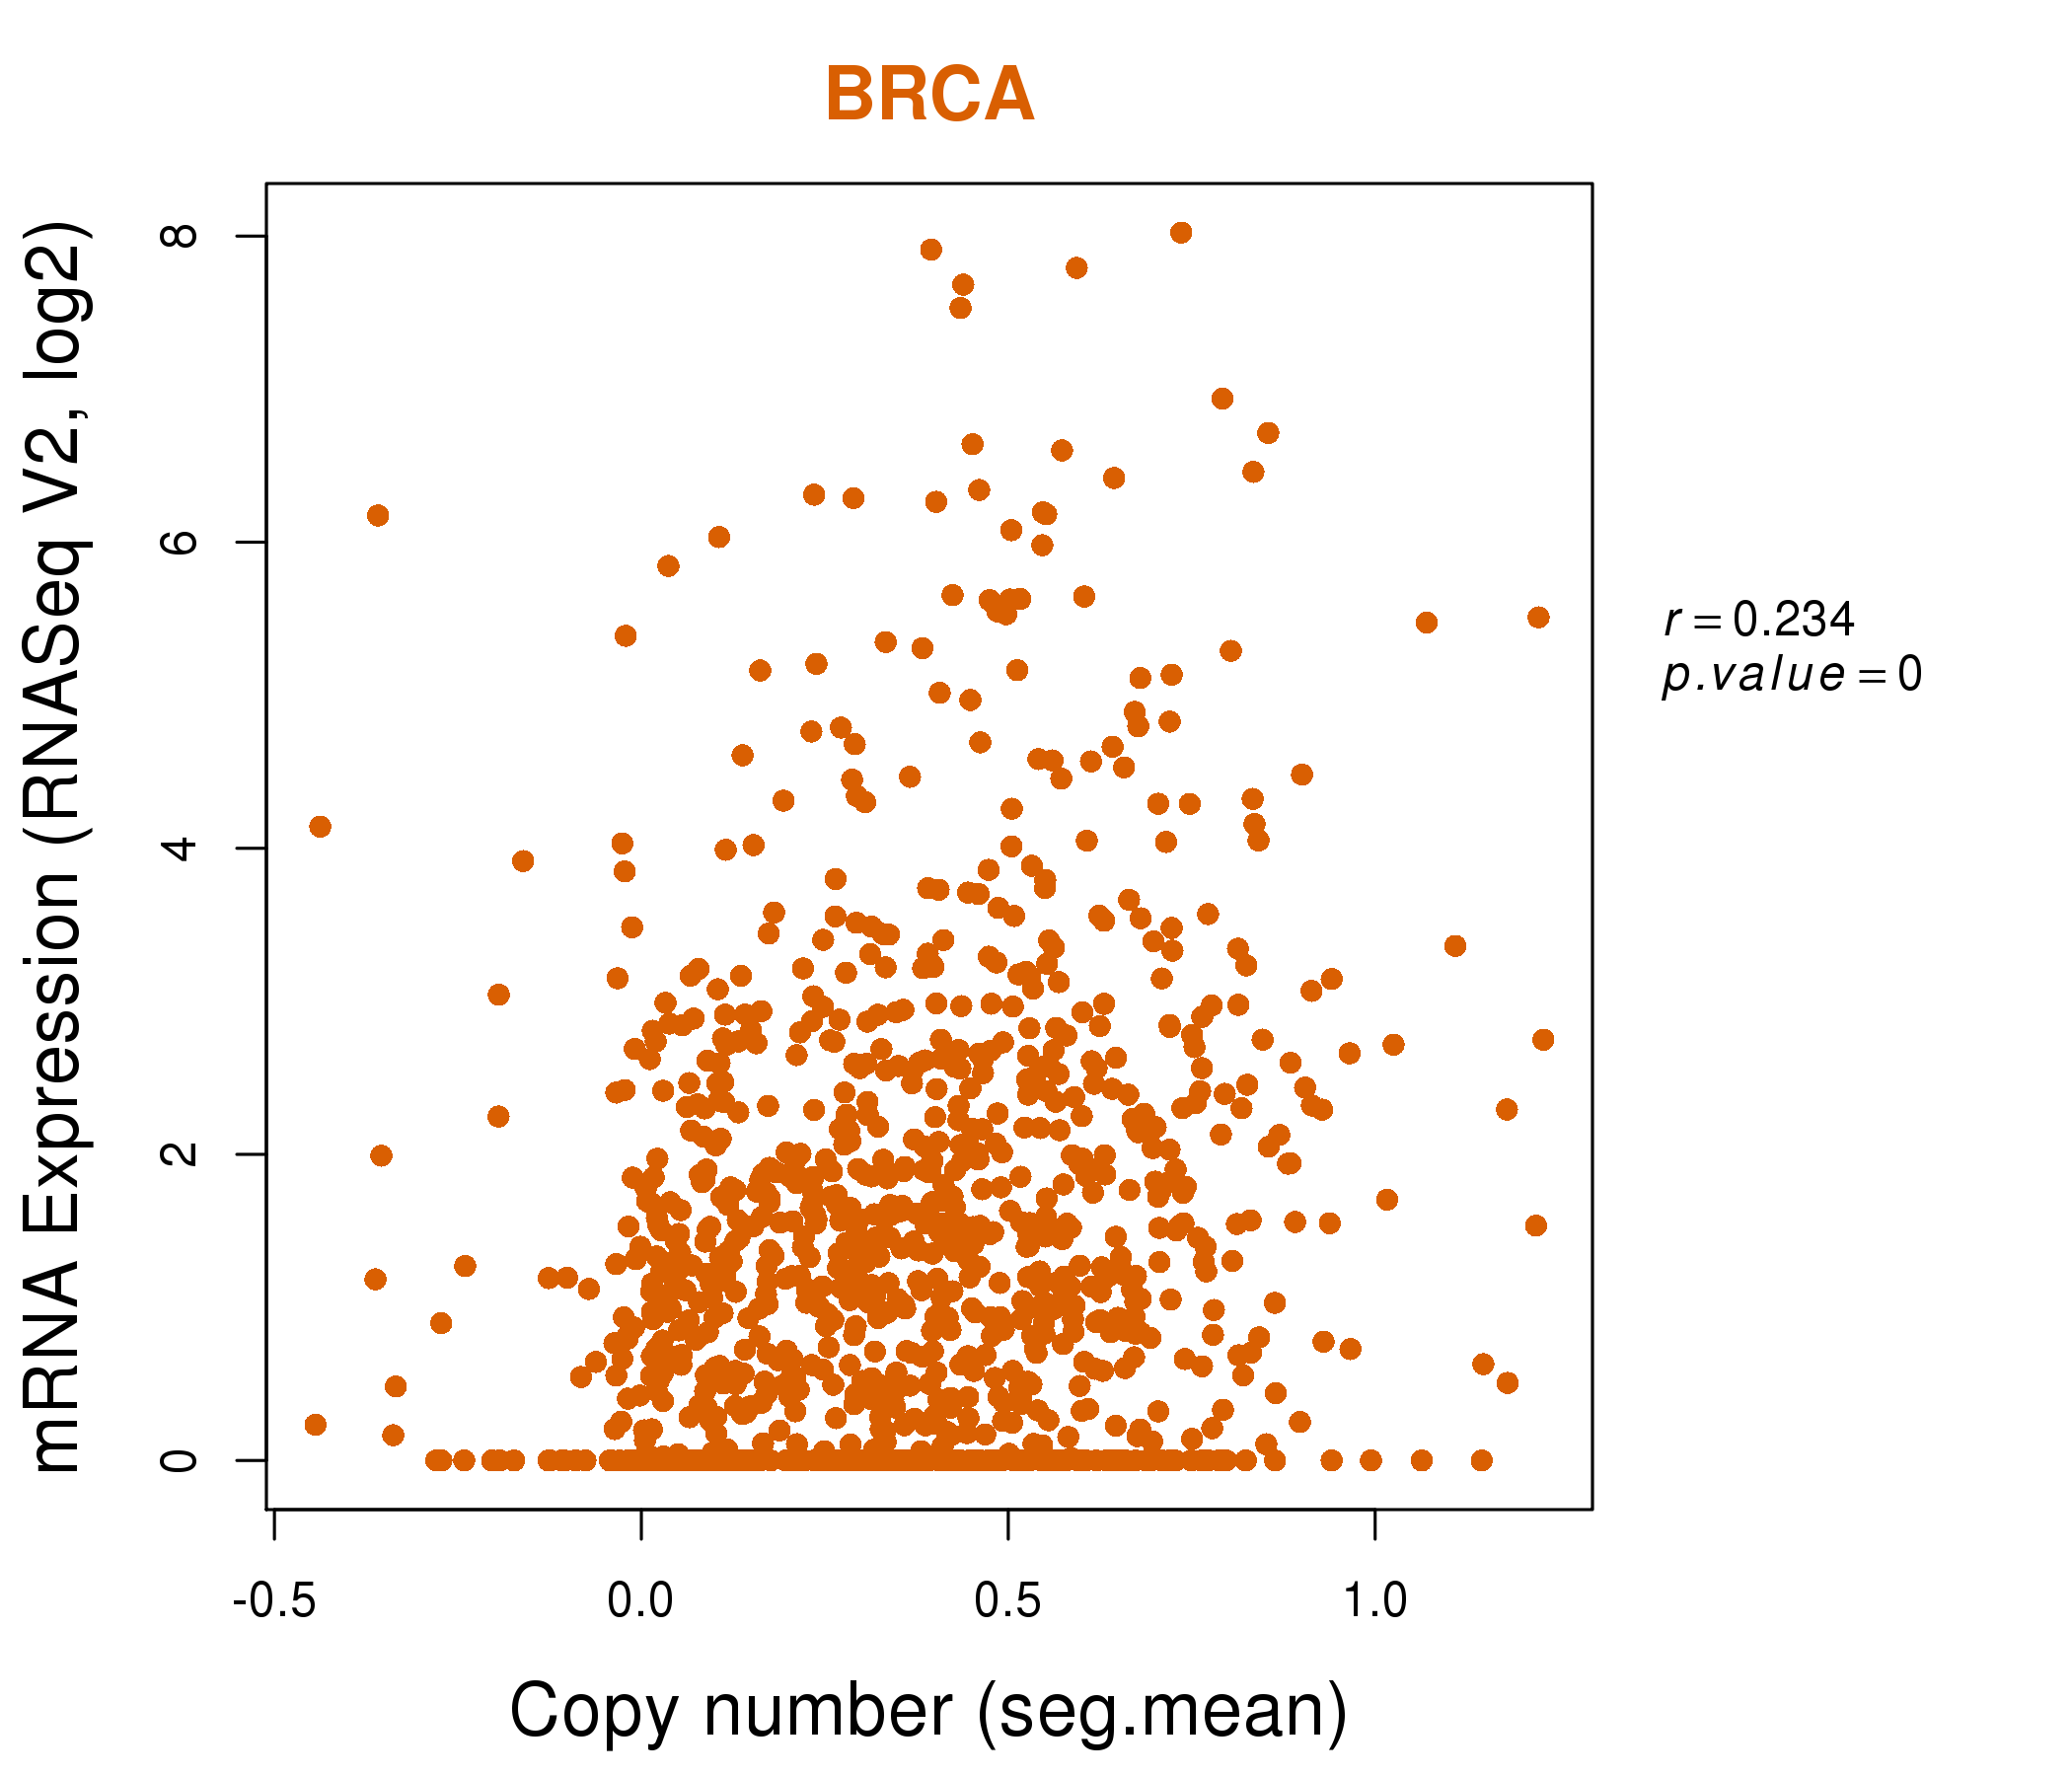
| * This plots show the correlation between CNV and gene expression. |
: Open all plots for all cancer types
 |
|
 |
|

| Top |
| Gene-Gene Network Information |
| * Co-Expression network figures were drawn using R package igraph. Only the top 20 genes with the highest correlations were shown. Red circle: input gene, orange circle: cell metabolism gene, sky circle: other gene |
: Open all plots for all cancer types
 |
|
| ADAM7,ADCY10,ALPI,ANKRD50,MPC2,DCAF6,DNAJC5B, DNAJC5G,ELFN2,FAM135B,FOXD4L2,G6PC2,GSTTP1,CFAP74, KLHL12,RAD21L1,TBX10,TEX19,TPCN2,TUBB7P,UNC5C | ABCC12,ACSM1,ADCY10,AKR1D1,C15orf43,CTNNA2,DDC, ELOVL7,EPS8L3,FMO5,HIST1H2AG,HIST1H3G,IDI1,IYD, LST-3TM12,RIMS1,SGPP2,SLC12A3,SLC26A6,TMPRSS11F,ZP2 |
 |
|
| ADCY10,ASUN,C12orf71,CASC1,DLK1,FGFR1OP2,GLIS3, GPR112,GRK1,KLHL42,KRAS,LOC100133893,LYRM5,MED21, MRPS35,NR5A1,PROL1,SLC23A3,STAR,STK38L,TM7SF3 | ADAMTSL5,ADCY10,AGAP11,BCO2,C3orf35,DEFB131,ENAM, FTCD,GRIA4,HOXC11,HOXC6,HOXC8,KCNJ3,NLRP9, NODAL,NR1I3,SOX6,SPAM1,SUSD2,TBX3,TIAM2 |


| * Co-Expression network figures were drawn using R package igraph. Only the top 20 genes with the highest correlations were shown. Red circle: input gene, orange circle: cell metabolism gene, sky circle: other gene |
: Open all plots for all cancer types
| Top |
: Open all interacting genes' information including KEGG pathway for all interacting genes from DAVID
| Top |
| Pharmacological Information for ADCY10 |
| There's no related Drug. |
| Top |
| Cross referenced IDs for ADCY10 |
| * We obtained these cross-references from Uniprot database. It covers 150 different DBs, 18 categories. http://www.uniprot.org/help/cross_references_section |
: Open all cross reference information
|
Copyright © 2016-Present - The Univsersity of Texas Health Science Center at Houston @ |