|
||||||||||||||||||||
| |
| Phenotypic Information (metabolism pathway, cancer, disease, phenome) |
| |
| |
| Gene-Gene Network Information: Co-Expression Network, Interacting Genes & KEGG |
| |
|


| Gene Summary for PRKCSH |
| Basic gene info. | Gene symbol | PRKCSH |
| Gene name | protein kinase C substrate 80K-H | |
| Synonyms | AGE-R2|G19P1|PCLD|PKCSH|PLD1 | |
| Cytomap | UCSC genome browser: 19p13.2 | |
| Genomic location | chr19 :11546268-11561782 | |
| Type of gene | protein-coding | |
| RefGenes | NM_001001329.2, NM_001289102.1,NM_001289103.1,NM_001289104.1,NM_002743.3, | |
| Ensembl id | ENSG00000130175 | |
| Description | AGE-binding receptor 2glucosidase 2 subunit betaglucosidase II subunit betahepatocystinprotein kinase C substrate 60.1 kDa protein heavy chainprotein kinase C substrate, 80 Kda protein | |
| Modification date | 20141207 | |
| dbXrefs | MIM : 177060 | |
| HGNC : HGNC | ||
| Ensembl : ENSG00000130175 | ||
| HPRD : 03518 | ||
| Vega : OTTHUMG00000182029 | ||
| Protein | UniProt: P14314 go to UniProt's Cross Reference DB Table | |
| Expression | CleanEX: HS_PRKCSH | |
| BioGPS: 5589 | ||
| Gene Expression Atlas: ENSG00000130175 | ||
| The Human Protein Atlas: ENSG00000130175 | ||
| Pathway | NCI Pathway Interaction Database: PRKCSH | |
| KEGG: PRKCSH | ||
| REACTOME: PRKCSH | ||
| ConsensusPathDB | ||
| Pathway Commons: PRKCSH | ||
| Metabolism | MetaCyc: PRKCSH | |
| HUMANCyc: PRKCSH | ||
| Regulation | Ensembl's Regulation: ENSG00000130175 | |
| miRBase: chr19 :11,546,268-11,561,782 | ||
| TargetScan: NM_001001329 | ||
| cisRED: ENSG00000130175 | ||
| Context | iHOP: PRKCSH | |
| cancer metabolism search in PubMed: PRKCSH | ||
| UCL Cancer Institute: PRKCSH | ||
| Assigned class in ccmGDB | B - This gene belongs to cancer gene. | |
| Top |
| Phenotypic Information for PRKCSH(metabolism pathway, cancer, disease, phenome) |
| Cancer | CGAP: PRKCSH |
| Familial Cancer Database: PRKCSH | |
| * This gene is included in those cancer gene databases. |
|
|
|
|
|
| . | ||||||||||||||
Oncogene 1 | Significant driver gene in | |||||||||||||||||||
| cf) number; DB name 1 Oncogene; http://nar.oxfordjournals.org/content/35/suppl_1/D721.long, 2 Tumor Suppressor gene; https://bioinfo.uth.edu/TSGene/, 3 Cancer Gene Census; http://www.nature.com/nrc/journal/v4/n3/abs/nrc1299.html, 4 CancerGenes; http://nar.oxfordjournals.org/content/35/suppl_1/D721.long, 5 Network of Cancer Gene; http://ncg.kcl.ac.uk/index.php, 1Therapeutic Vulnerabilities in Cancer; http://cbio.mskcc.org/cancergenomics/statius/ |
| REACTOME_METABOLISM_OF_PROTEINS | |
| OMIM | 174050; phenotype. 177060; gene. |
| Orphanet | 2924; Isolated polycystic liver disease. |
| Disease | KEGG Disease: PRKCSH |
| MedGen: PRKCSH (Human Medical Genetics with Condition) | |
| ClinVar: PRKCSH | |
| Phenotype | MGI: PRKCSH (International Mouse Phenotyping Consortium) |
| PhenomicDB: PRKCSH | |
| Mutations for PRKCSH |
| * Under tables are showing count per each tissue to give us broad intuition about tissue specific mutation patterns.You can go to the detailed page for each mutation database's web site. |
| There's no structural variation information in COSMIC data for this gene. |
| * From mRNA Sanger sequences, Chitars2.0 arranged chimeric transcripts. This table shows PRKCSH related fusion information. |
| ID | Head Gene | Tail Gene | Accession | Gene_a | qStart_a | qEnd_a | Chromosome_a | tStart_a | tEnd_a | Gene_a | qStart_a | qEnd_a | Chromosome_a | tStart_a | tEnd_a |
| BE938446 | PRKCSH | 4 | 144 | 19 | 11556241 | 11557903 | PRKCSH | 132 | 264 | 19 | 11557937 | 11558347 | |
| BF746637 | PRKCSH | 38 | 112 | 19 | 11560087 | 11560161 | PRKCSH | 106 | 313 | 19 | 11556248 | 11557976 | |
| AI467862 | PRKCSH | 10 | 150 | 19 | 11561643 | 11561783 | ENC1 | 146 | 494 | 5 | 73931210 | 73931558 | |
| CN412416 | NDUFA7 | 1 | 213 | 19 | 8381403 | 8386227 | PRKCSH | 210 | 566 | 19 | 11556248 | 11558406 | |
| AA282178 | PRKCSH | 6 | 135 | 19 | 11561654 | 11561783 | PURB | 131 | 332 | 7 | 44919088 | 44919289 | |
| DB266941 | LOC100507412 | 1 | 151 | ? | 112029 | 112179 | PRKCSH | 152 | 585 | 19 | 11546452 | 11548781 | |
| BI001011 | NFE2L1 | 23 | 159 | 17 | 46133392 | 46133531 | PRKCSH | 156 | 469 | 19 | 11553215 | 11557922 | |
| AA968638 | DYSF | 1 | 186 | 2 | 71913708 | 71913893 | PRKCSH | 178 | 444 | 19 | 11556212 | 11558280 | |
| AU120749 | PRKCSH | 1 | 512 | 19 | 11558391 | 11560138 | PRKCSH | 511 | 615 | 19 | 11547220 | 11547325 | |
| BF742989 | PRKCSH | 30 | 107 | 19 | 11556212 | 11556289 | MEF2A | 93 | 308 | 15 | 100250918 | 100252761 | |
| BE773523 | PRKCSH | 1 | 62 | 19 | 11557098 | 11557160 | GANAB | 55 | 159 | 11 | 62407307 | 62407411 | |
| Top |
| There's no copy number variation information in COSMIC data for this gene. |
| Top |
|
 |
| Top |
| Stat. for Non-Synonymous SNVs (# total SNVs=44) | (# total SNVs=13) |
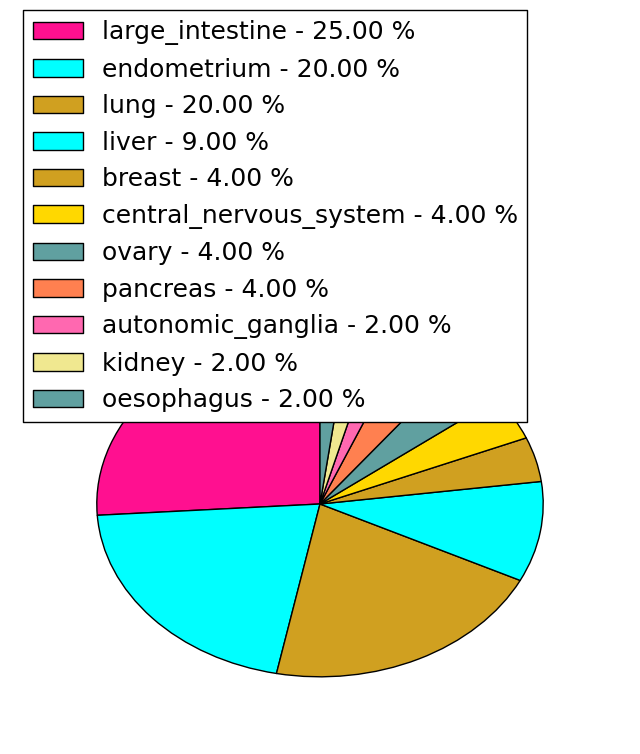 | 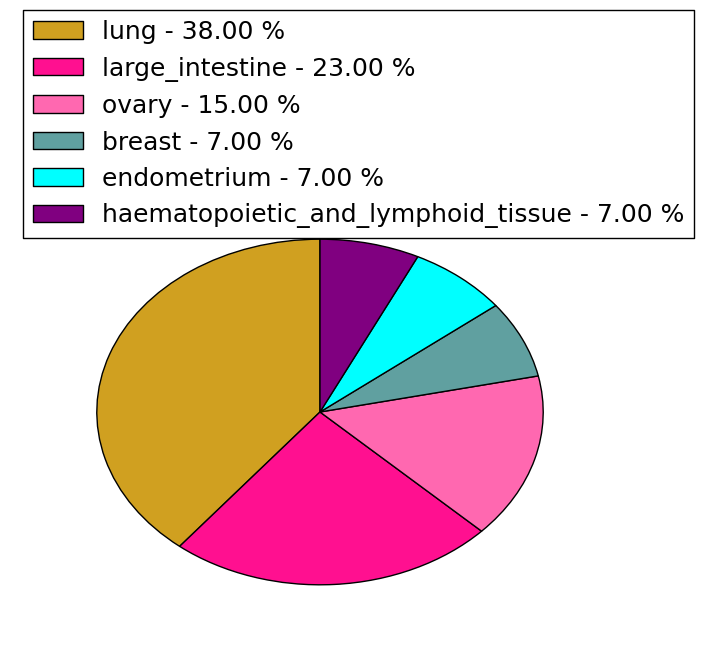 |
(# total SNVs=5) | (# total SNVs=1) |
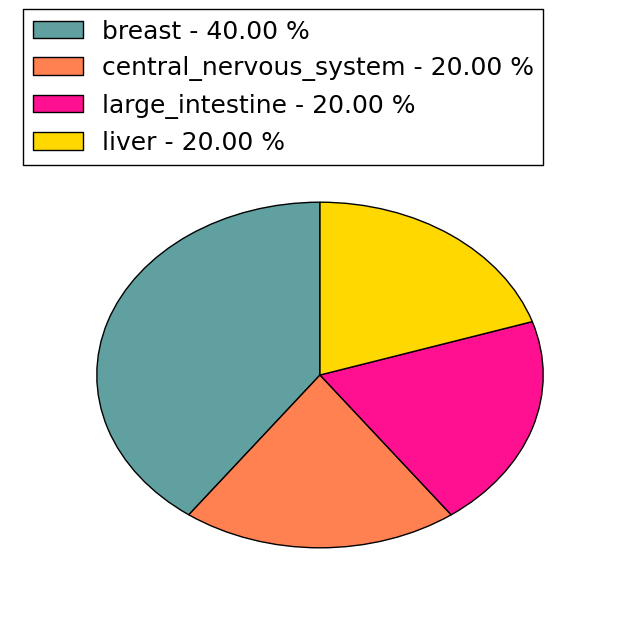 | 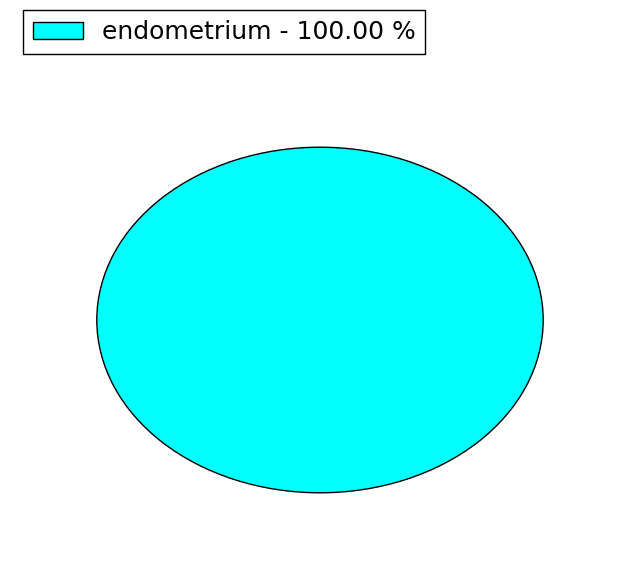 |
| Top |
| * When you move the cursor on each content, you can see more deailed mutation information on the Tooltip. Those are primary_site,primary_histology,mutation(aa),pubmedID. |
| GRCh37 position | Mutation(aa) | Unique sampleID count |
| chr19:11558370-11558370 | p.E322E | 4 |
| chr19:11558341-11558343 | p.E313delE | 3 |
| chr19:11559362-11559362 | p.E395K | 2 |
| chr19:11559794-11559794 | p.T444I | 2 |
| chr19:11558265-11558265 | p.T287T | 2 |
| chr19:11556233-11556233 | p.E210K | 2 |
| chr19:11548778-11548778 | p.N93S | 2 |
| chr19:11546960-11546960 | p.L8M | 1 |
| chr19:11557971-11557971 | p.S282F | 1 |
| chr19:11559791-11559791 | p.P443L | 1 |
| Top |
|
 |
| Point Mutation/ Tissue ID | 1 | 2 | 3 | 4 | 5 | 6 | 7 | 8 | 9 | 10 | 11 | 12 | 13 | 14 | 15 | 16 | 17 | 18 | 19 | 20 |
| # sample | 1 | 1 | 1 | 5 | 2 | 1 | 3 | 4 | 1 | 3 | 2 | 4 | 5 | |||||||
| # mutation | 1 | 1 | 1 | 5 | 2 | 1 | 3 | 4 | 1 | 3 | 2 | 4 | 8 | |||||||
| nonsynonymous SNV | 1 | 1 | 3 | 2 | 1 | 1 | 1 | 2 | 1 | 3 | 7 | |||||||||
| synonymous SNV | 1 | 2 | 2 | 3 | 1 | 1 | 1 | 1 | 1 |
| cf) Tissue ID; Tissue type (1; BLCA[Bladder Urothelial Carcinoma], 2; BRCA[Breast invasive carcinoma], 3; CESC[Cervical squamous cell carcinoma and endocervical adenocarcinoma], 4; COAD[Colon adenocarcinoma], 5; GBM[Glioblastoma multiforme], 6; Glioma Low Grade, 7; HNSC[Head and Neck squamous cell carcinoma], 8; KICH[Kidney Chromophobe], 9; KIRC[Kidney renal clear cell carcinoma], 10; KIRP[Kidney renal papillary cell carcinoma], 11; LAML[Acute Myeloid Leukemia], 12; LUAD[Lung adenocarcinoma], 13; LUSC[Lung squamous cell carcinoma], 14; OV[Ovarian serous cystadenocarcinoma ], 15; PAAD[Pancreatic adenocarcinoma], 16; PRAD[Prostate adenocarcinoma], 17; SKCM[Skin Cutaneous Melanoma], 18:STAD[Stomach adenocarcinoma], 19:THCA[Thyroid carcinoma], 20:UCEC[Uterine Corpus Endometrial Carcinoma]) |
| Top |
| * We represented just top 10 SNVs. When you move the cursor on each content, you can see more deailed mutation information on the Tooltip. Those are primary_site, primary_histology, mutation(aa), pubmedID. |
| Genomic Position | Mutation(aa) | Unique sampleID count |
| chr19:11558373 | p.E323E,PRKCSH | 2 |
| chr19:11546952 | p.R139C,PRKCSH | 1 |
| chr19:11560110 | p.S431S,PRKCSH | 1 |
| chr19:11557090 | p.K155R,PRKCSH | 1 |
| chr19:11559430 | p.S439F,PRKCSH | 1 |
| chr19:11546960 | p.V229V,PRKCSH | 1 |
| chr19:11560133 | p.W446R,PRKCSH | 1 |
| chr19:11557971 | p.S282F,PRKCSH | 1 |
| chr19:11559740 | p.A459T,PRKCSH | 1 |
| chr19:11547013 | p.T287T,PRKCSH | 1 |
| * Copy number data were extracted from TCGA using R package TCGA-Assembler. The URLs of all public data files on TCGA DCC data server were gathered on Jan-05-2015. Function ProcessCNAData in TCGA-Assembler package was used to obtain gene-level copy number value which is calculated as the average copy number of the genomic region of a gene. |
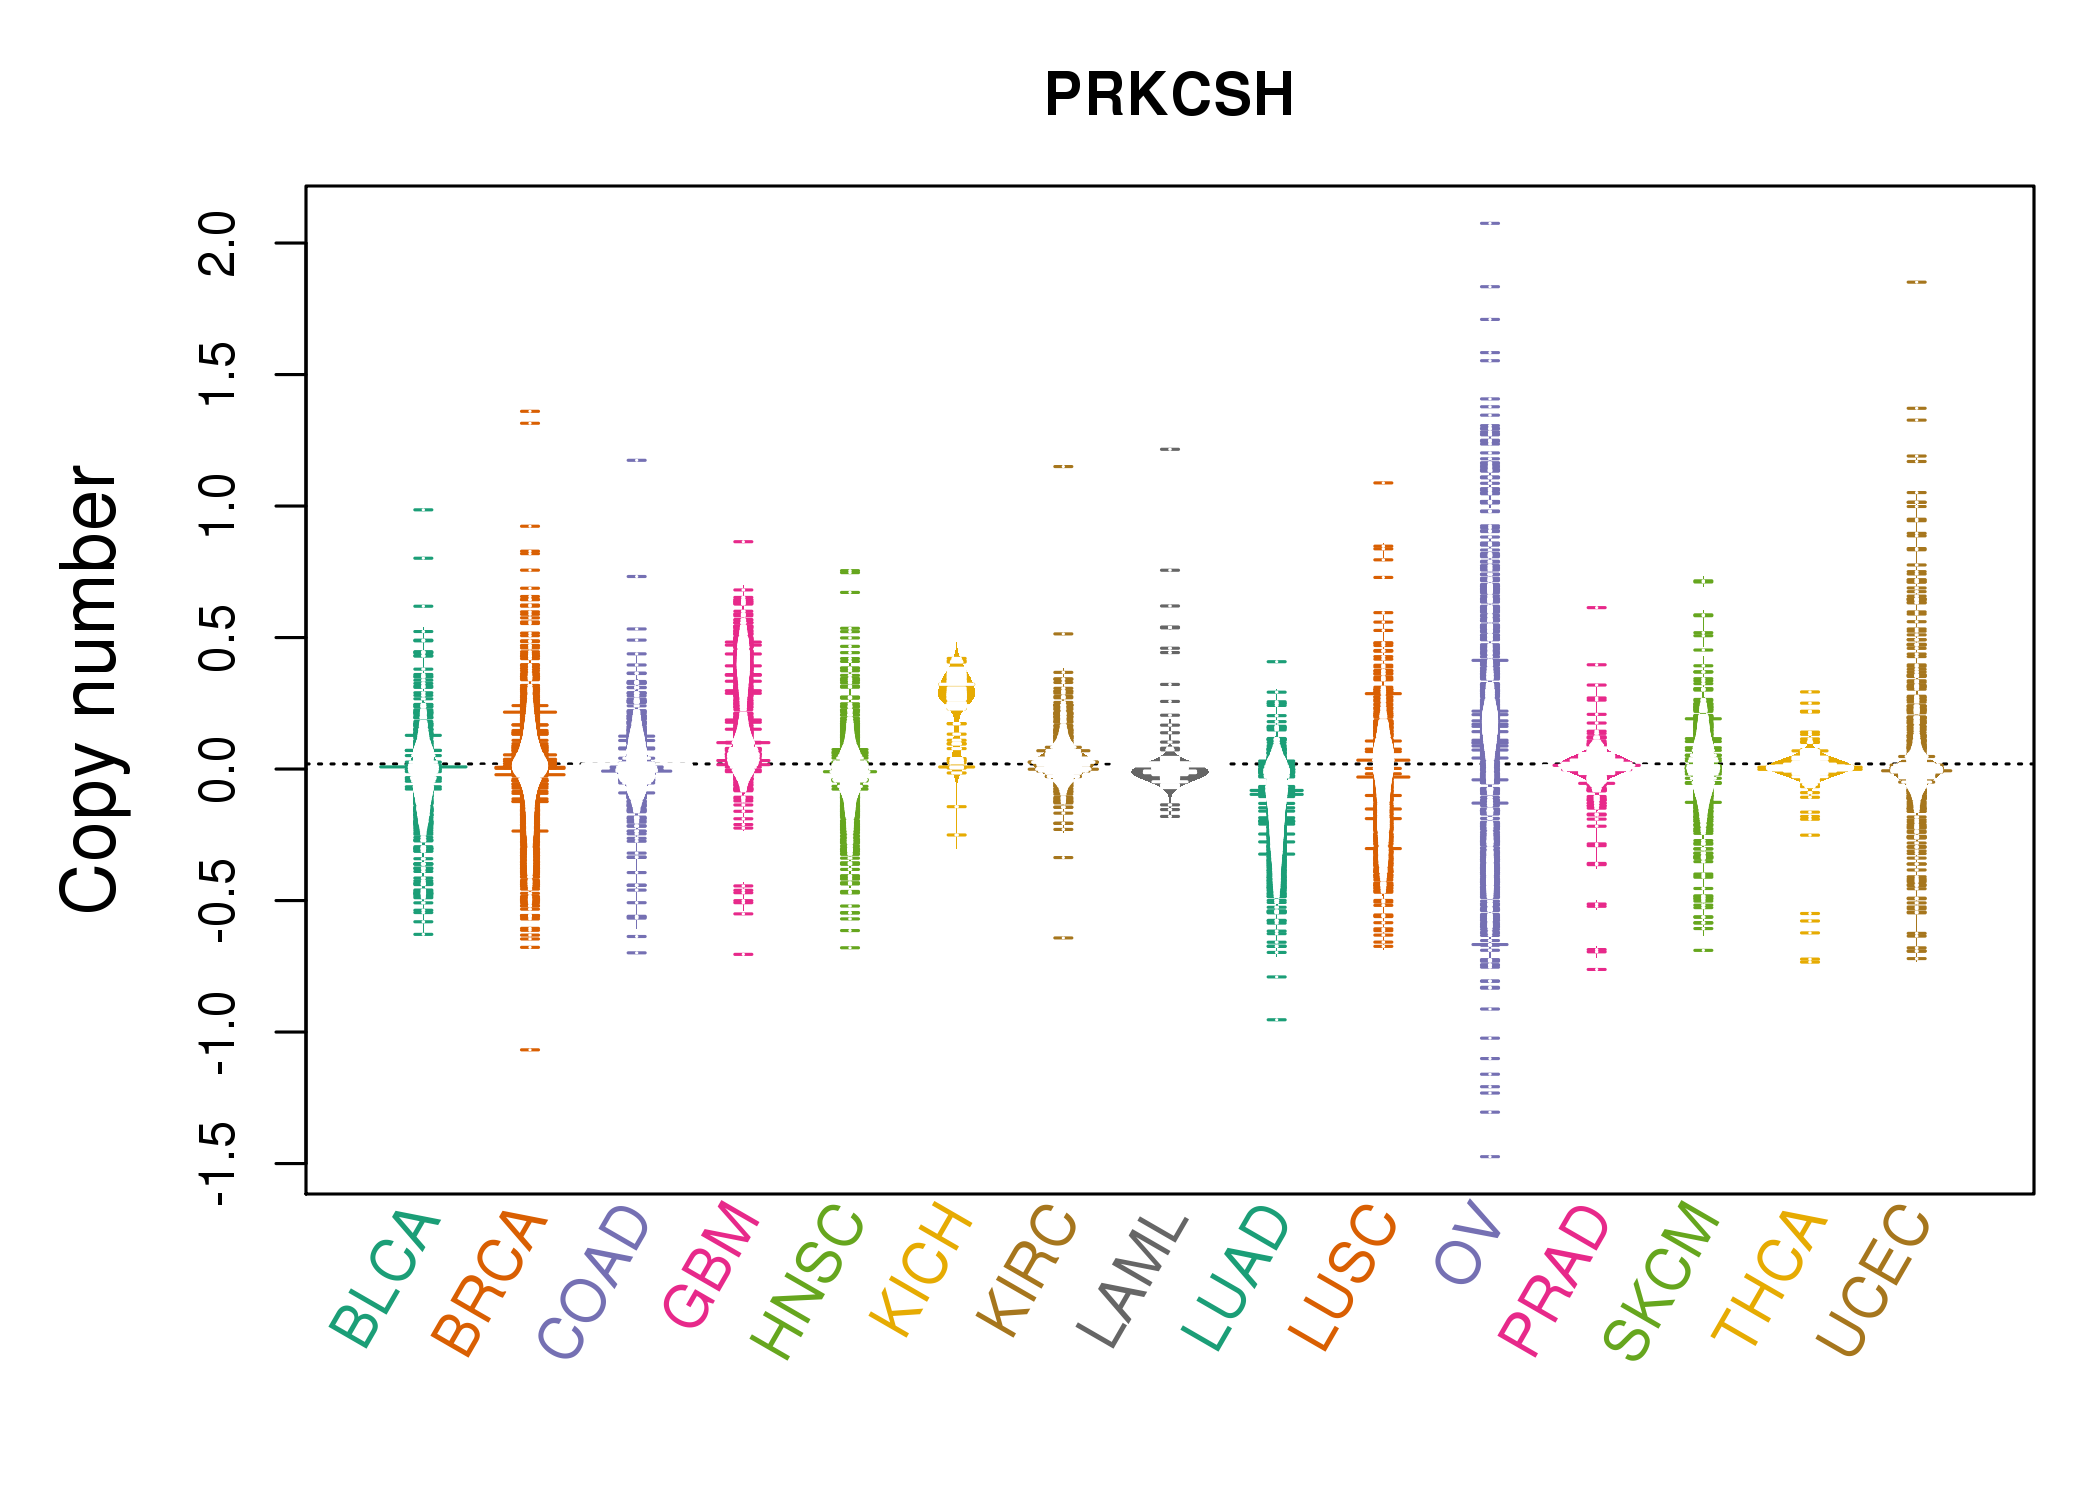 |
| cf) Tissue ID[Tissue type]: BLCA[Bladder Urothelial Carcinoma], BRCA[Breast invasive carcinoma], CESC[Cervical squamous cell carcinoma and endocervical adenocarcinoma], COAD[Colon adenocarcinoma], GBM[Glioblastoma multiforme], Glioma Low Grade, HNSC[Head and Neck squamous cell carcinoma], KICH[Kidney Chromophobe], KIRC[Kidney renal clear cell carcinoma], KIRP[Kidney renal papillary cell carcinoma], LAML[Acute Myeloid Leukemia], LUAD[Lung adenocarcinoma], LUSC[Lung squamous cell carcinoma], OV[Ovarian serous cystadenocarcinoma ], PAAD[Pancreatic adenocarcinoma], PRAD[Prostate adenocarcinoma], SKCM[Skin Cutaneous Melanoma], STAD[Stomach adenocarcinoma], THCA[Thyroid carcinoma], UCEC[Uterine Corpus Endometrial Carcinoma] |
| Top |
| Gene Expression for PRKCSH |
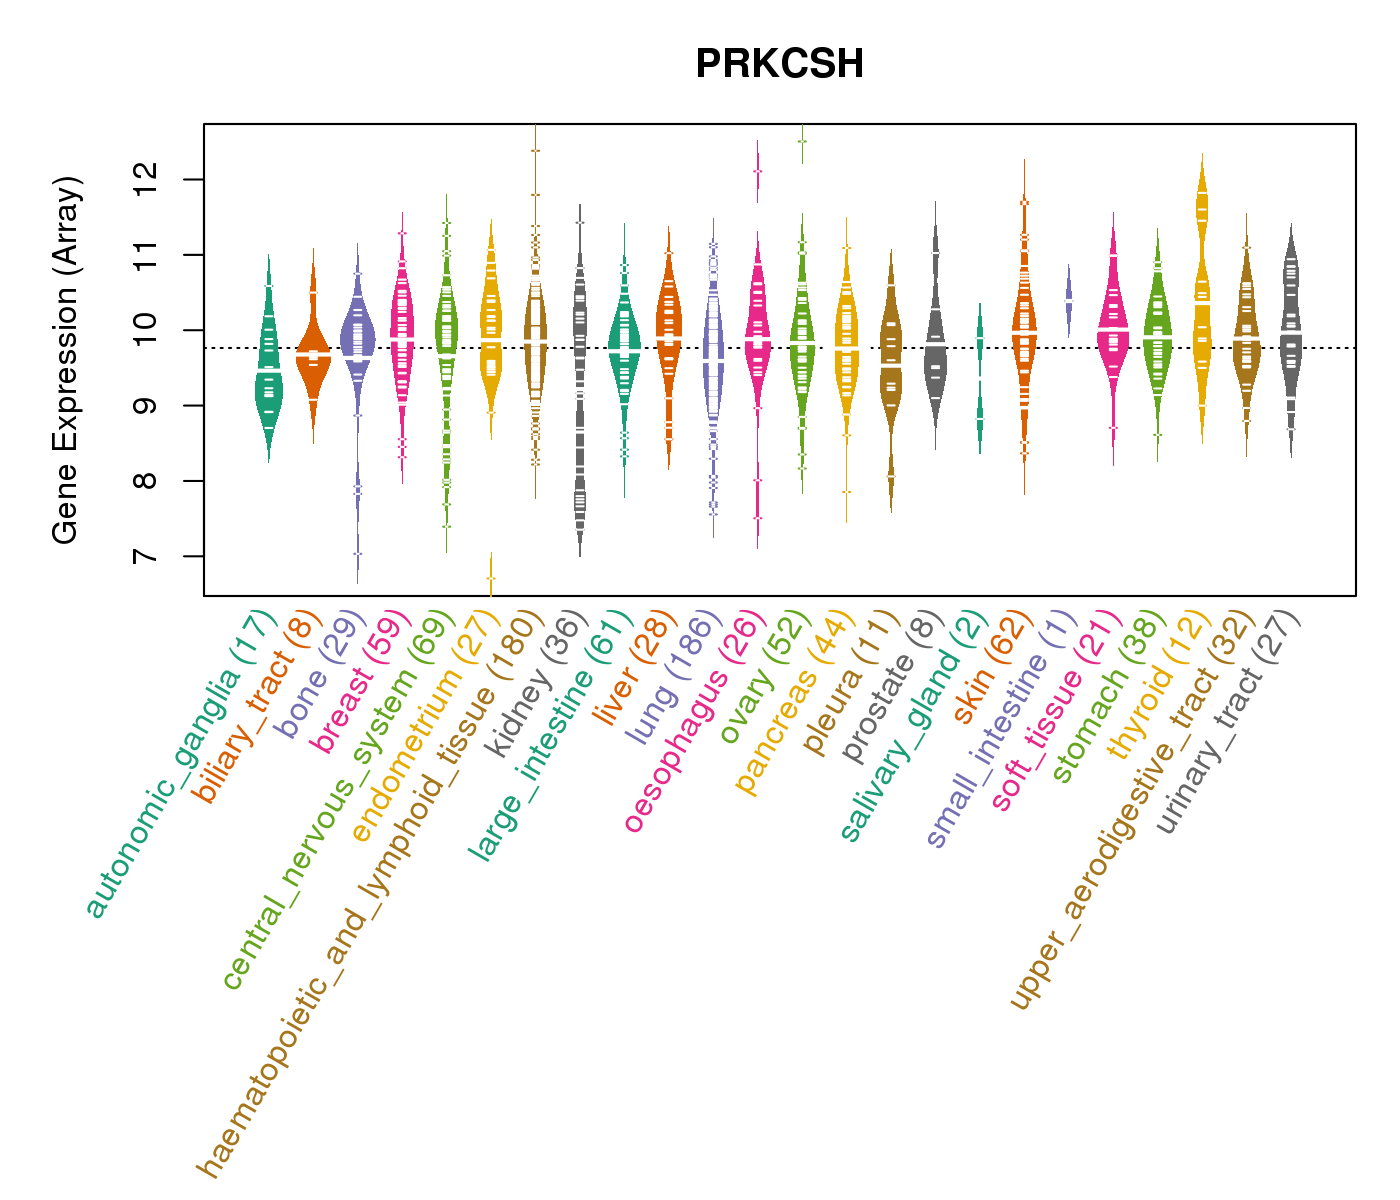
| * CCLE gene expression data were extracted from CCLE_Expression_Entrez_2012-10-18.res: Gene-centric RMA-normalized mRNA expression data. |
 |
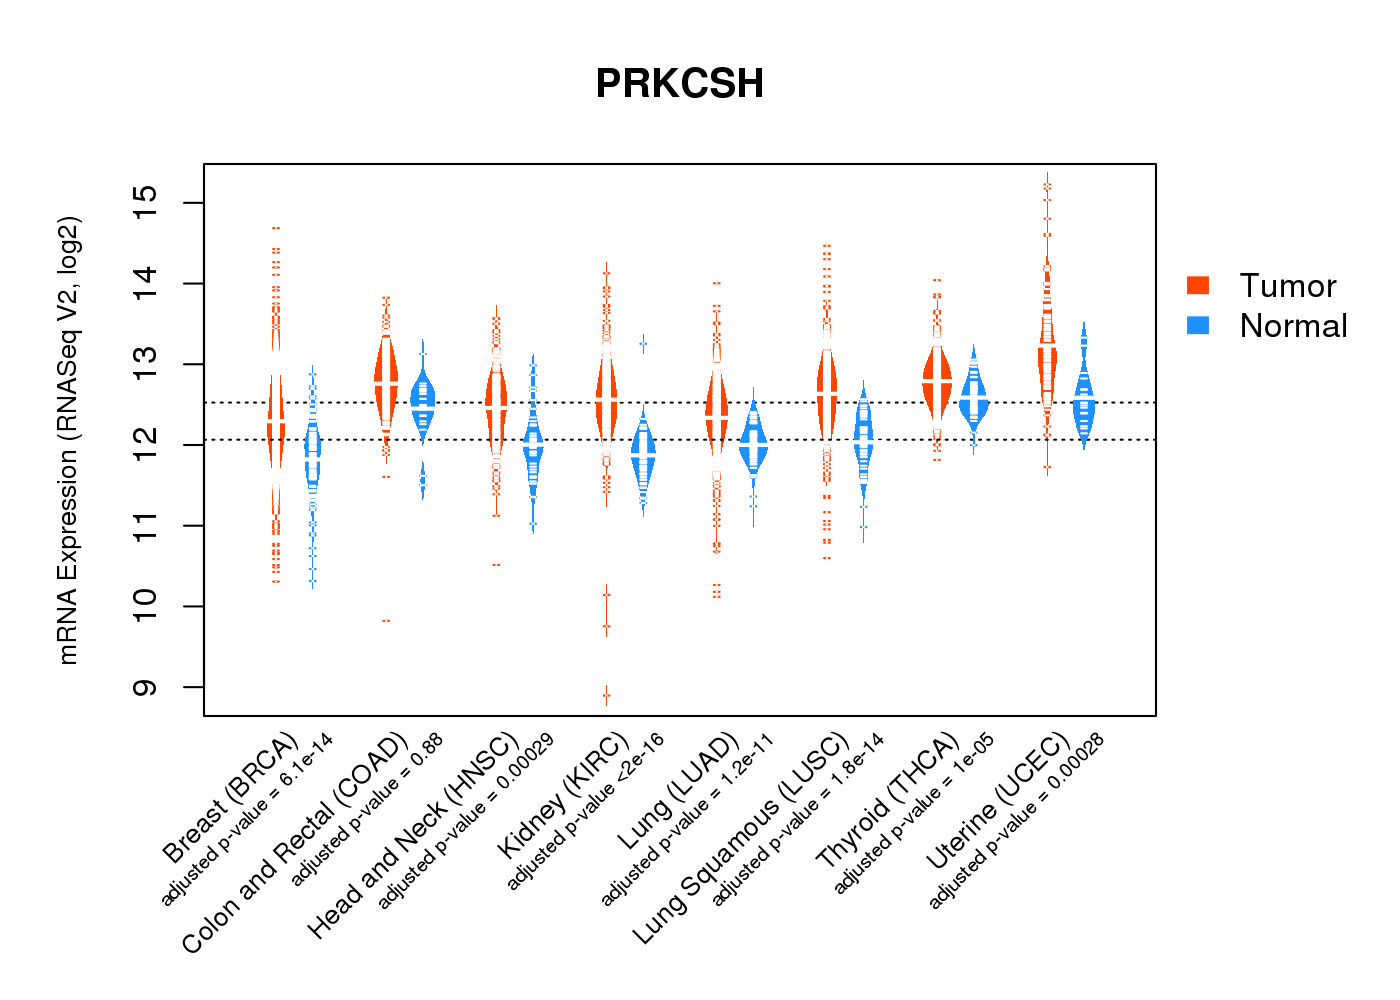
| * Normalized gene expression data of RNASeqV2 was extracted from TCGA using R package TCGA-Assembler. The URLs of all public data files on TCGA DCC data server were gathered at Jan-05-2015. Only eight cancer types have enough normal control samples for differential expression analysis. (t test, adjusted p<0.05 (using Benjamini-Hochberg FDR)) |
 |
| Top |
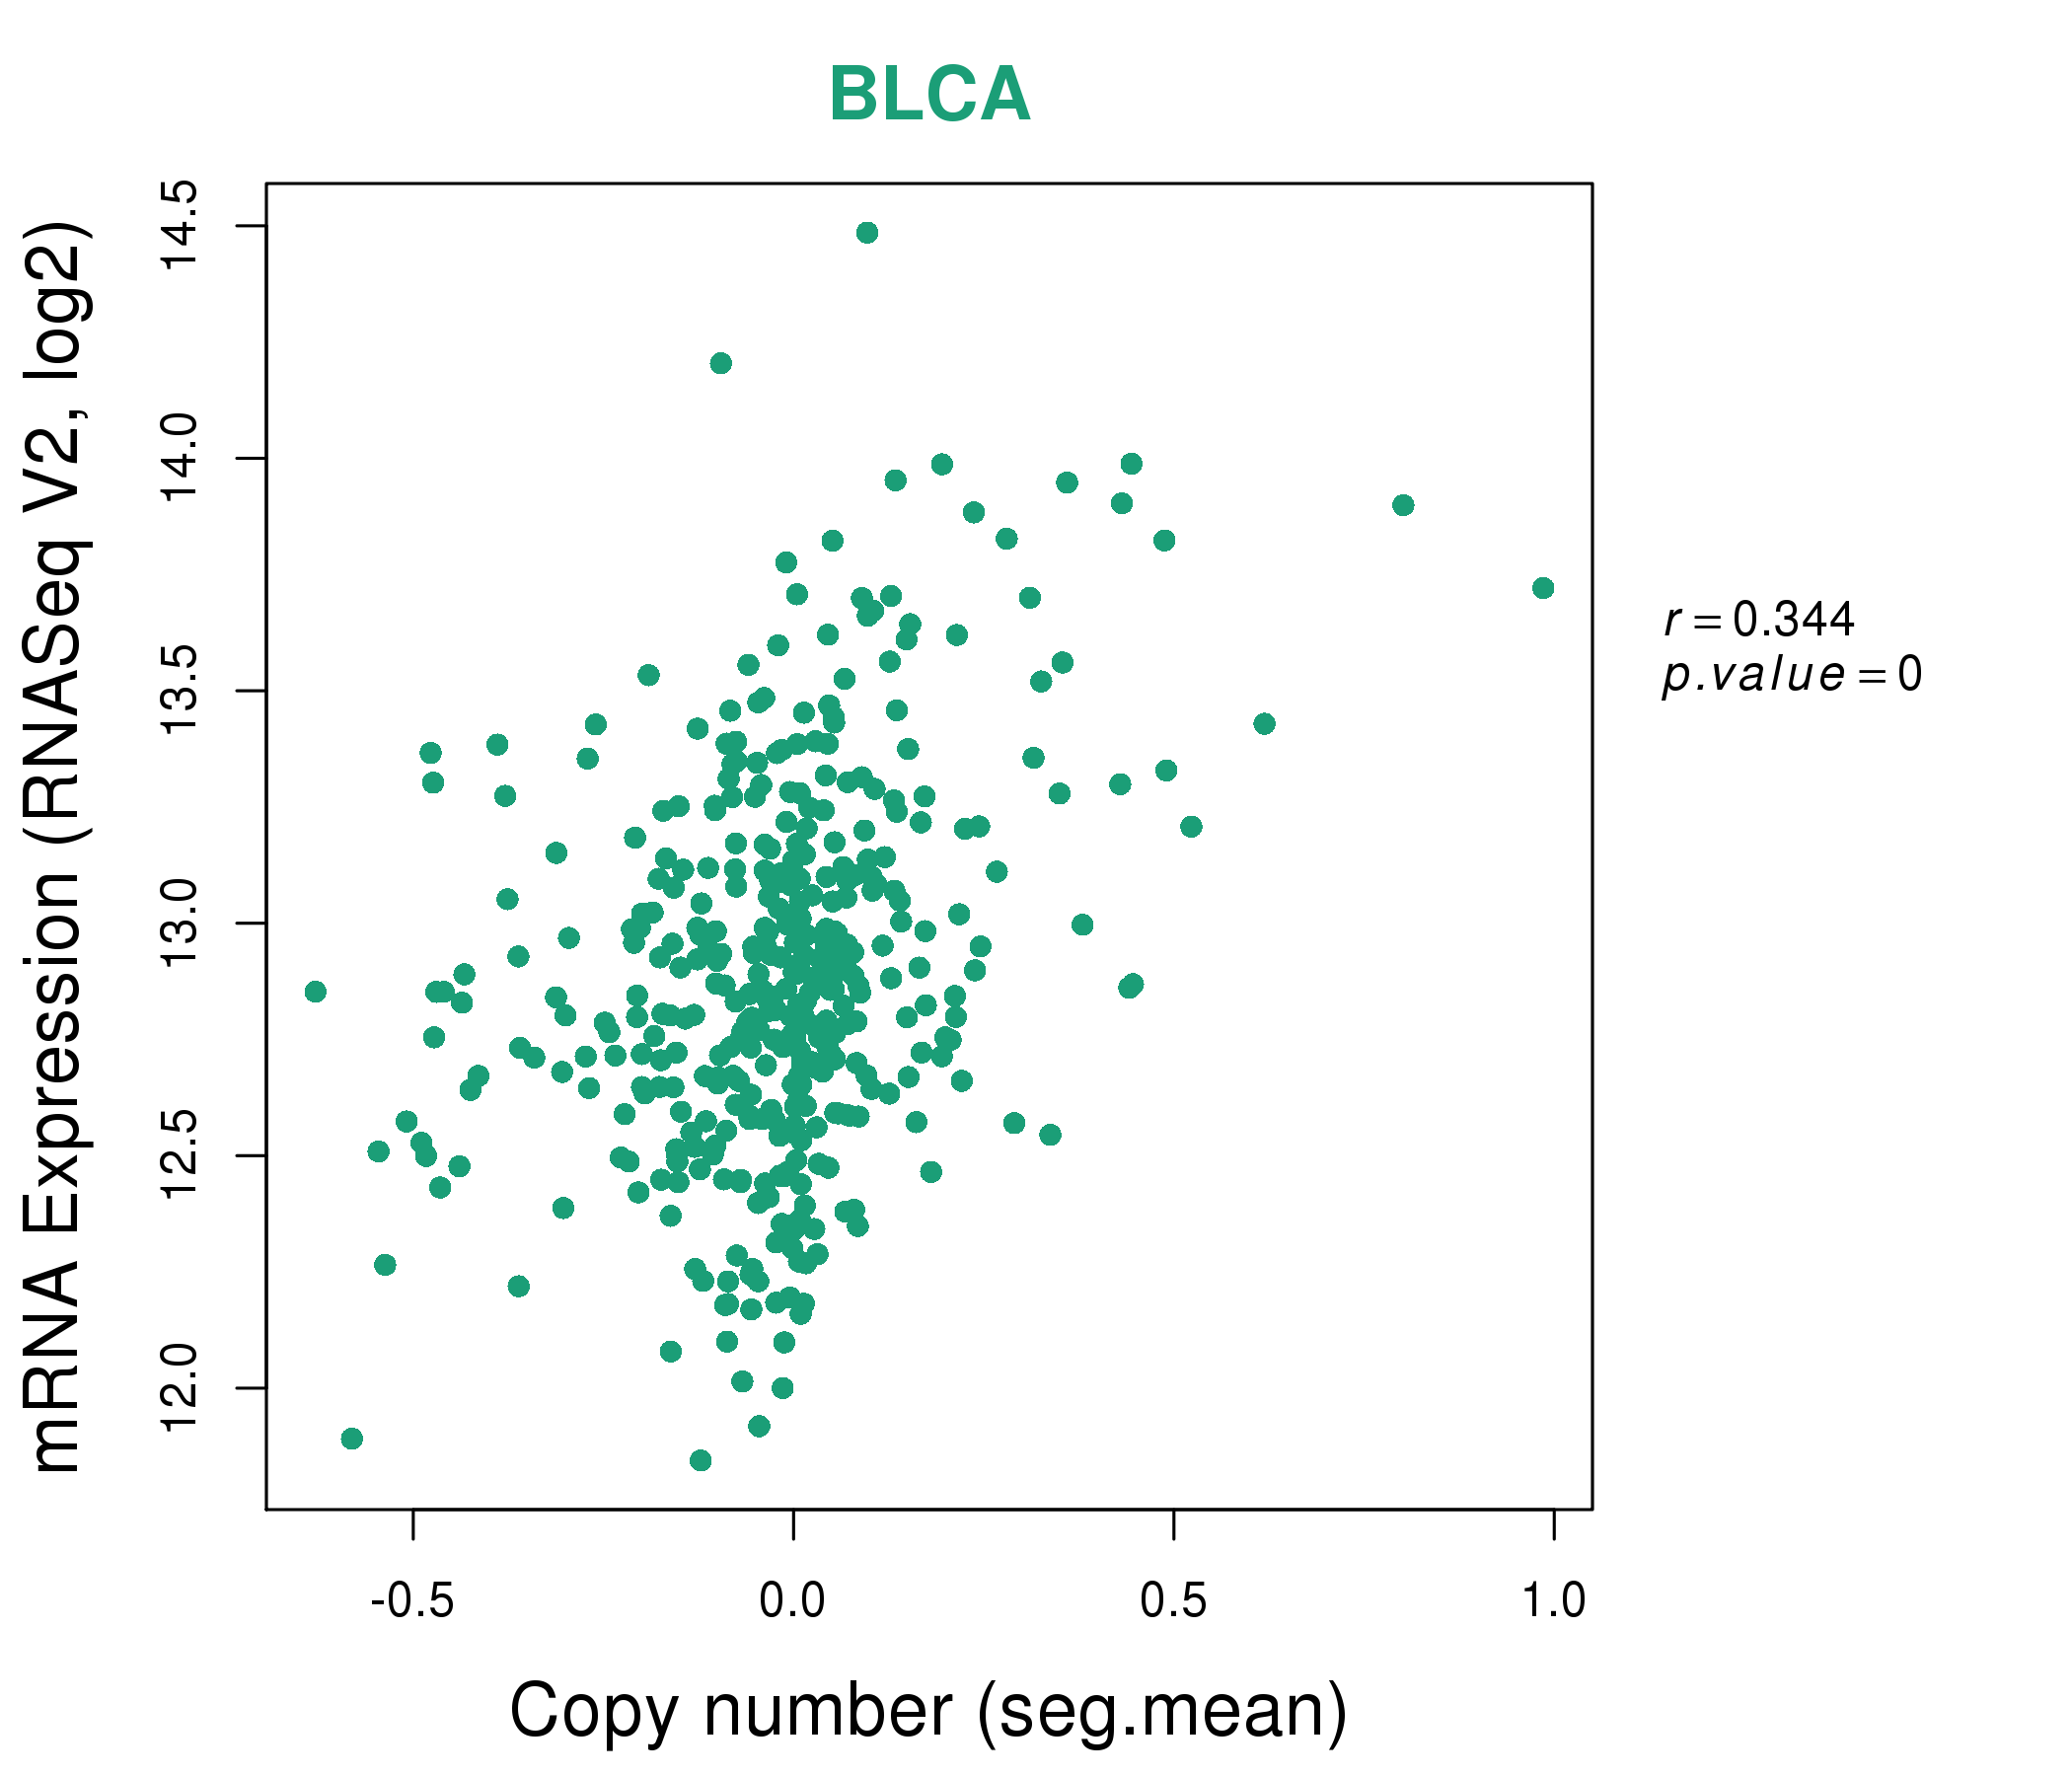
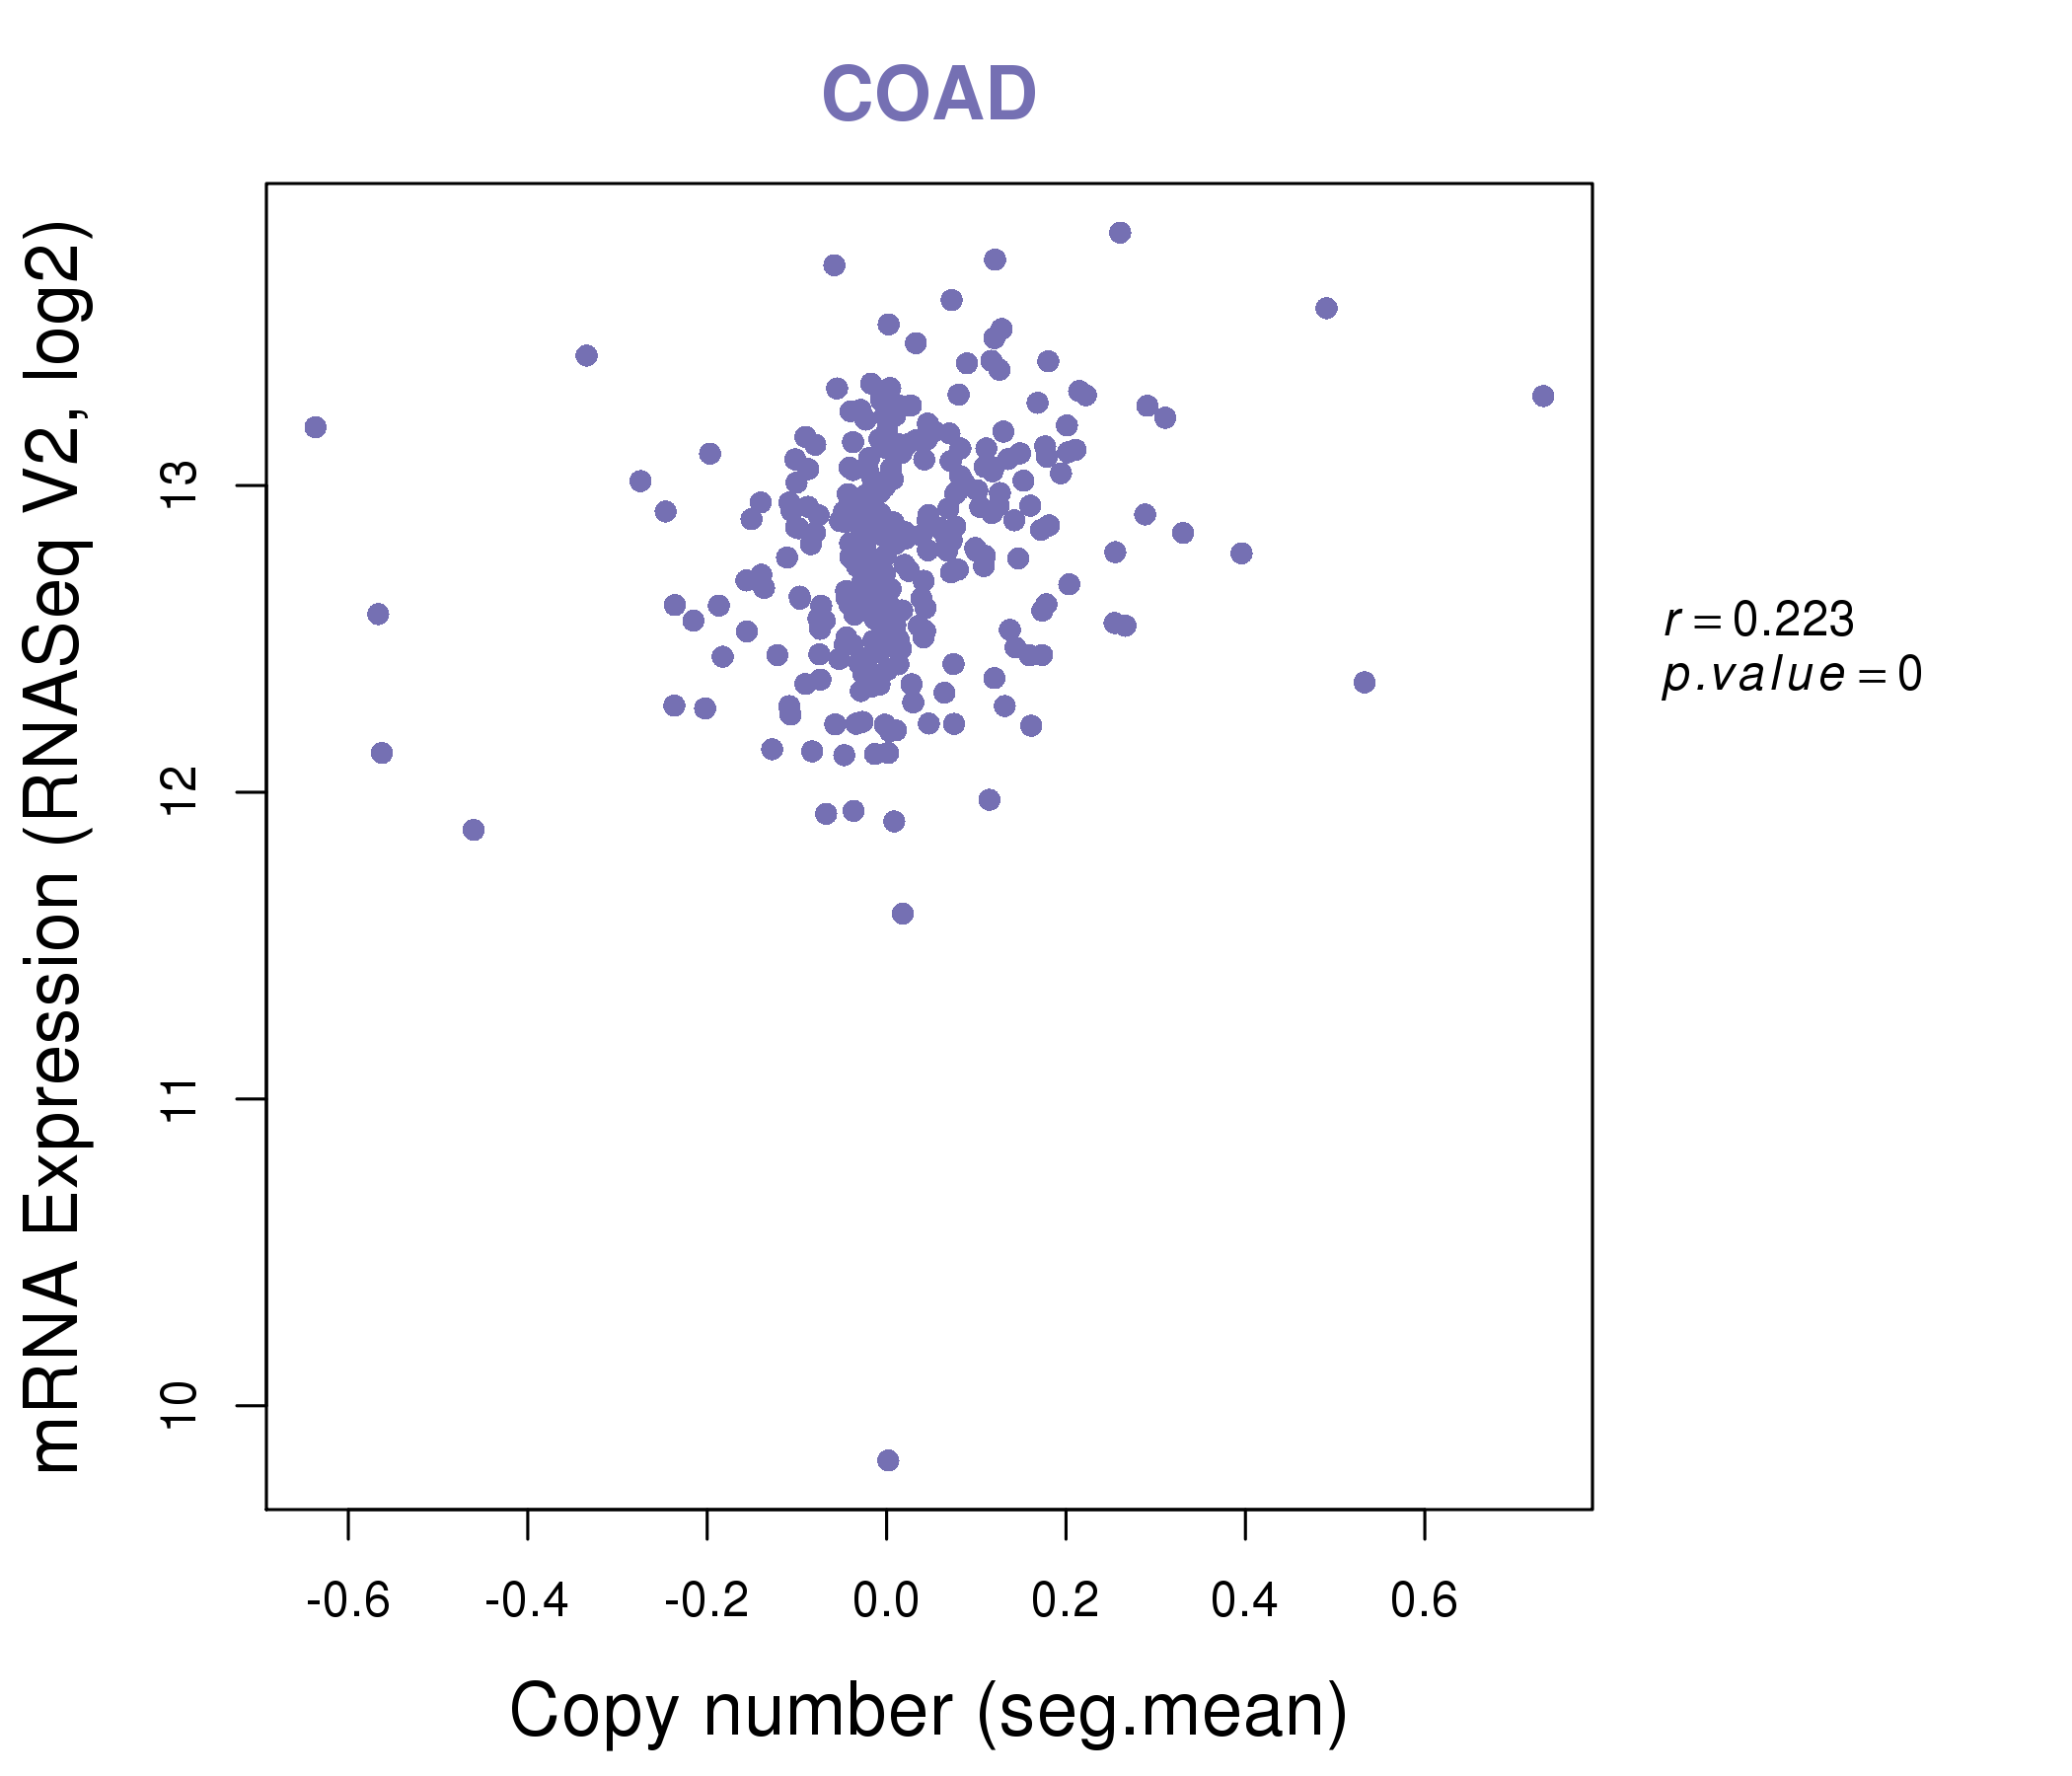
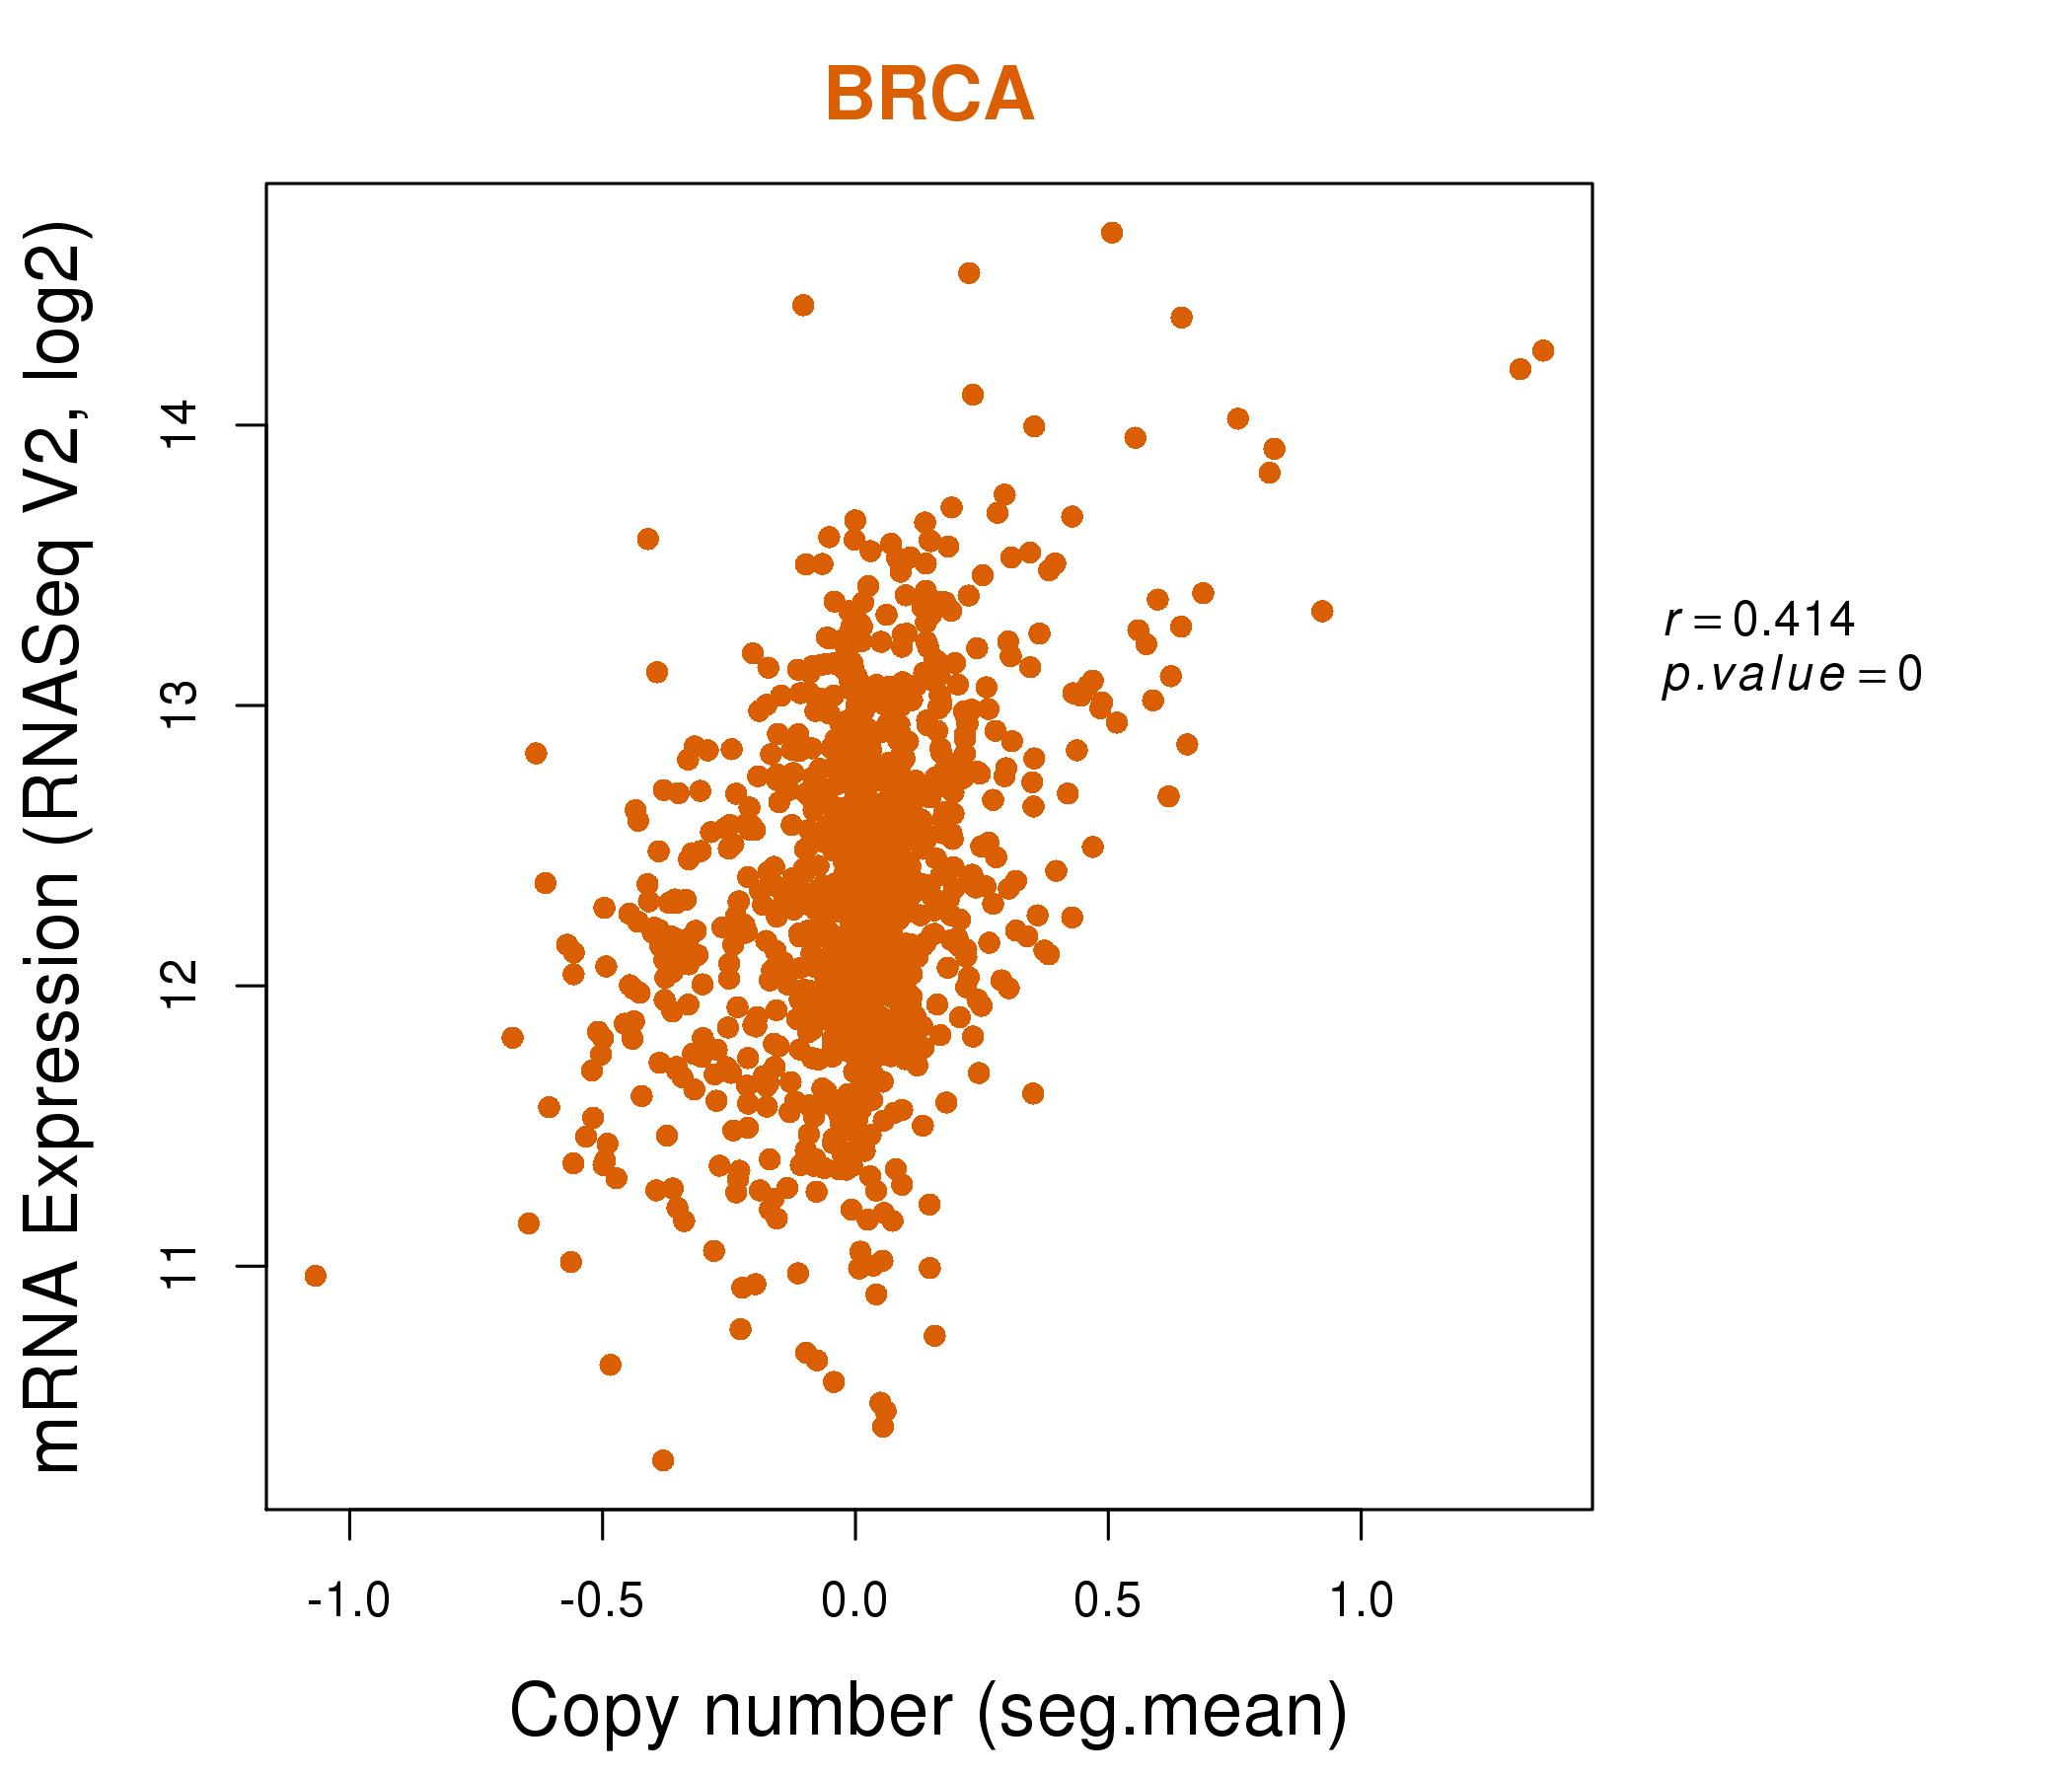
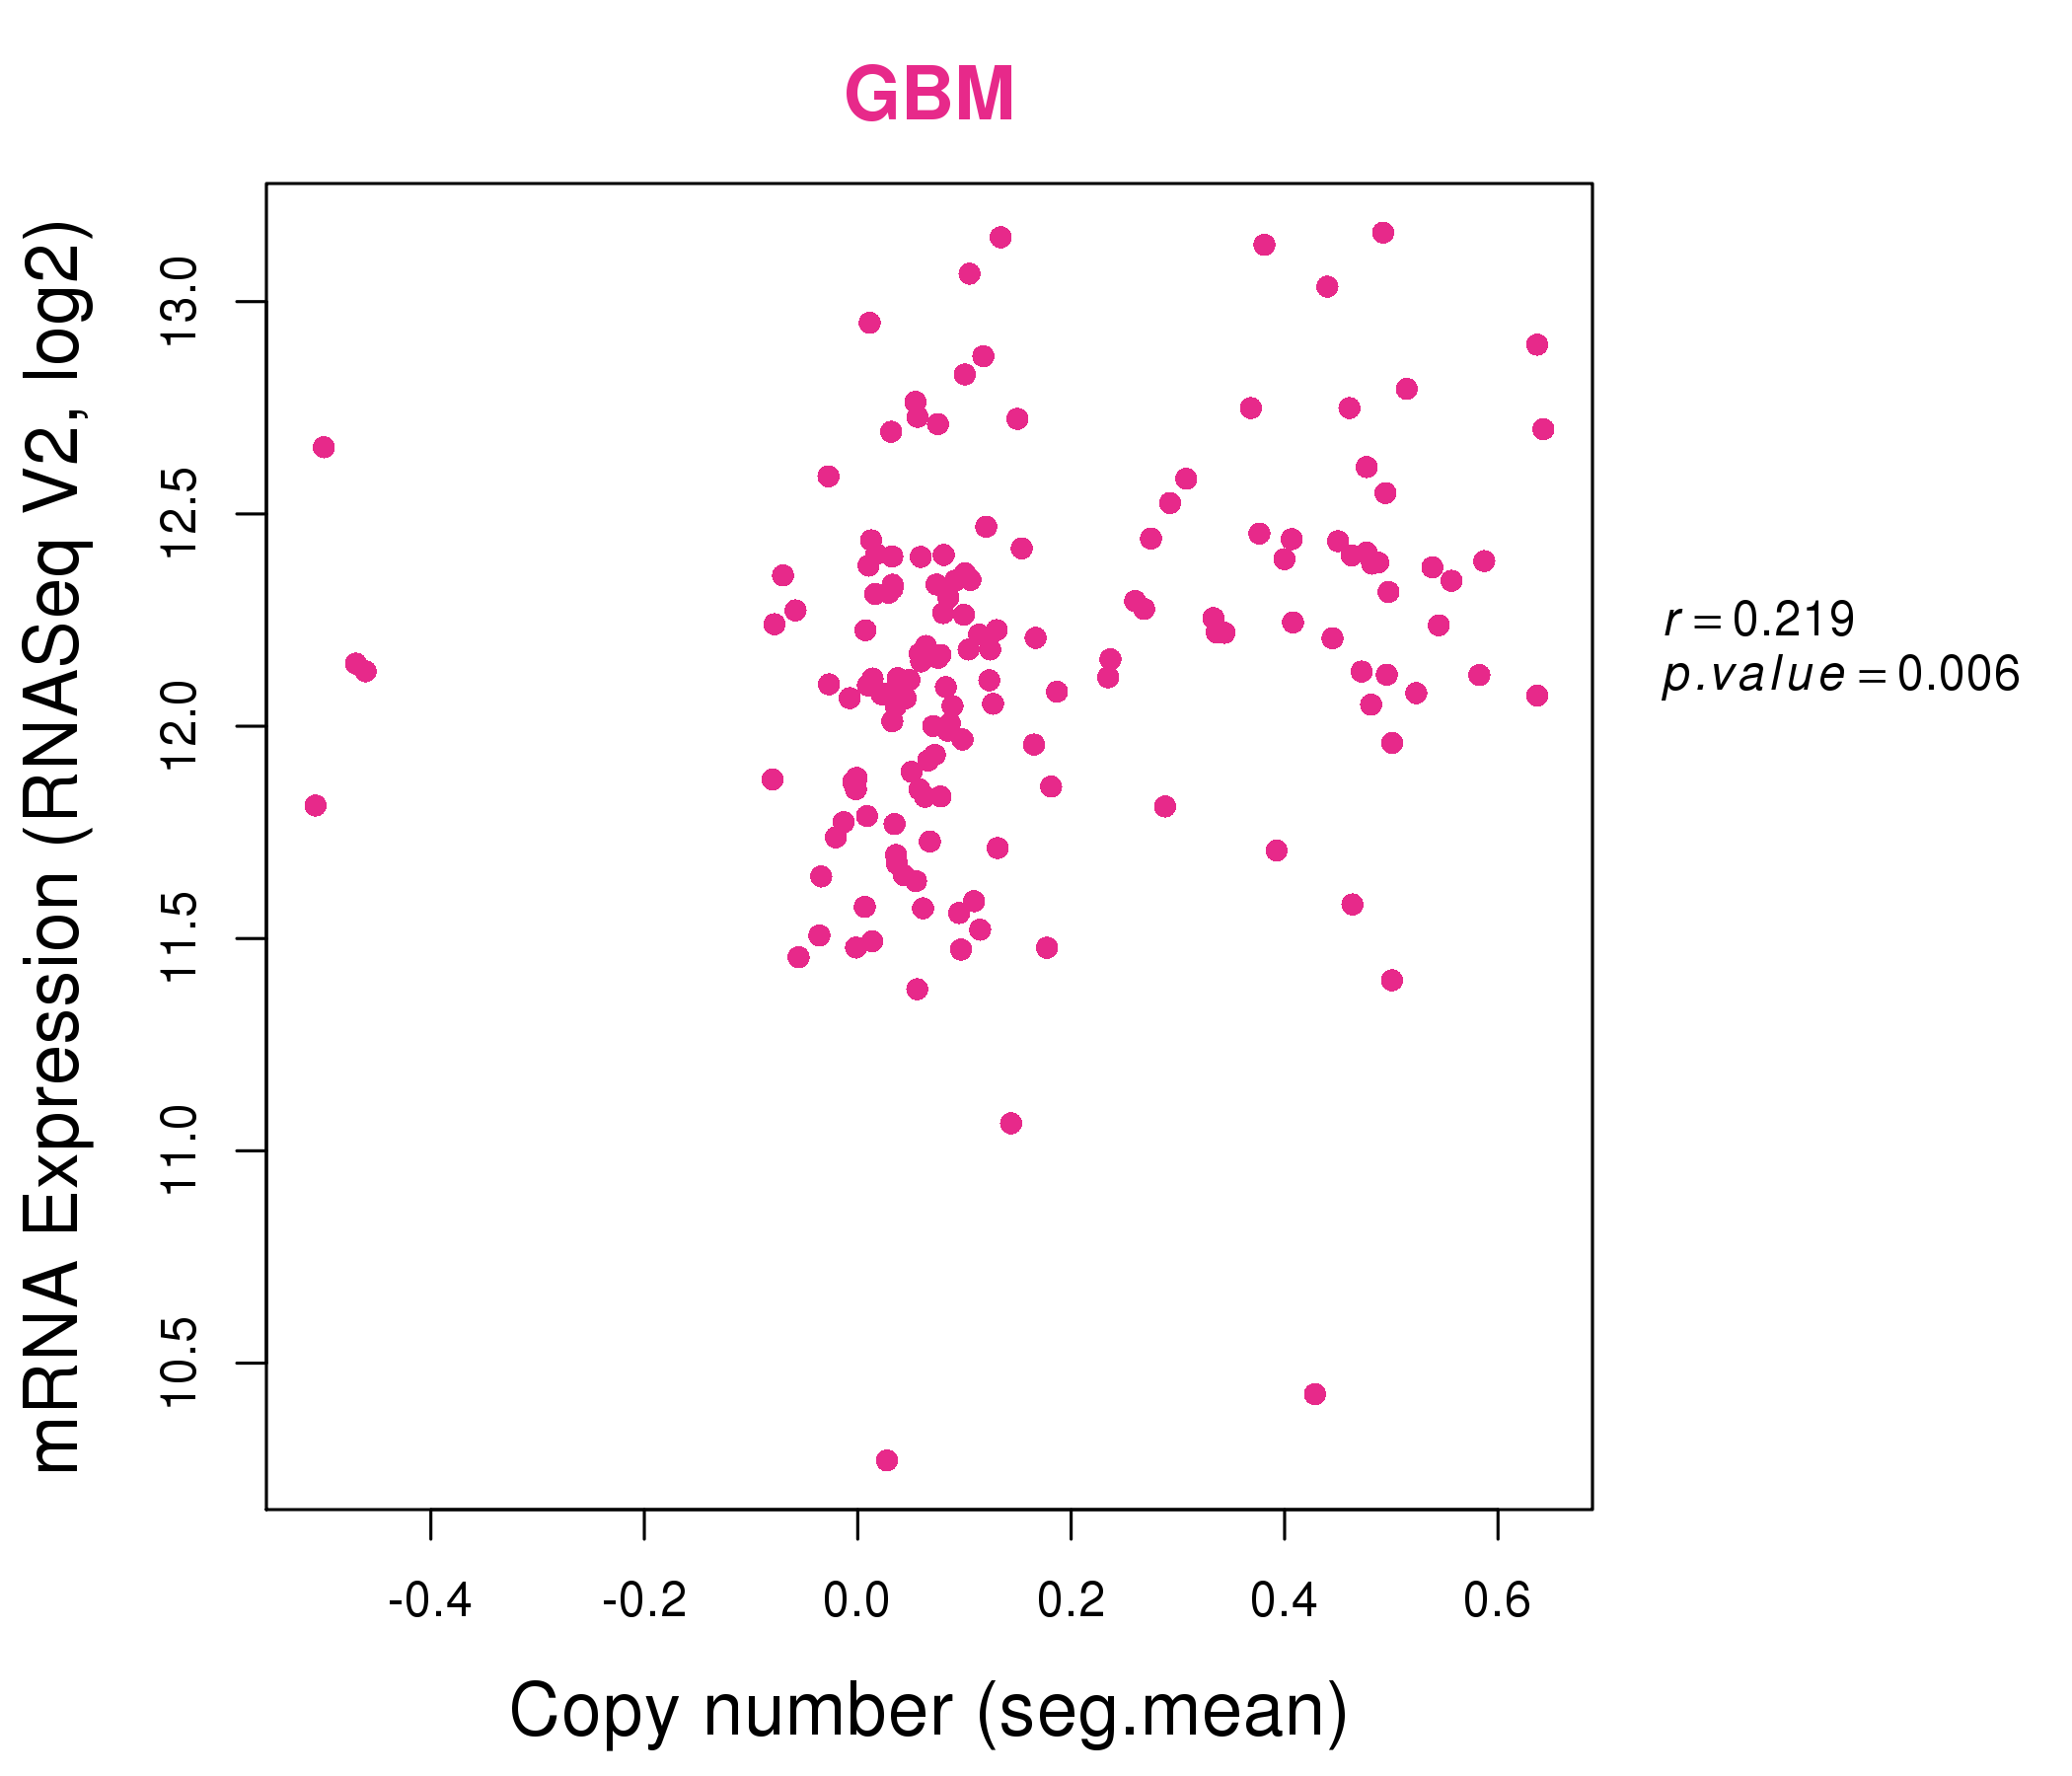
| * This plots show the correlation between CNV and gene expression. |
: Open all plots for all cancer types
 |
|
 |
|
| Top |
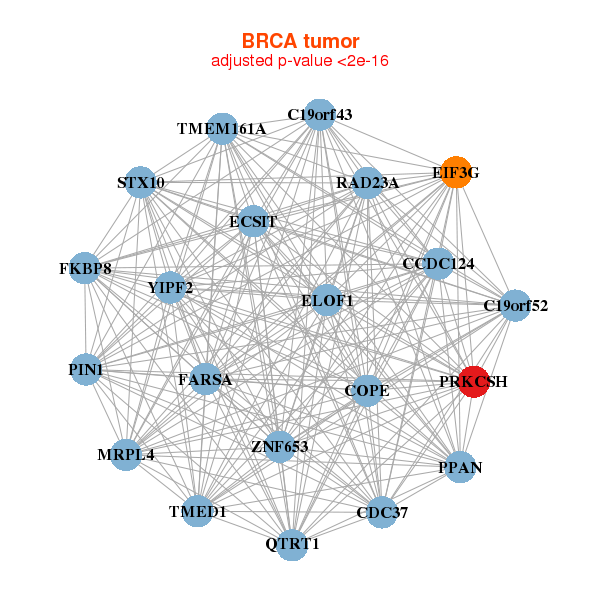
| Gene-Gene Network Information |
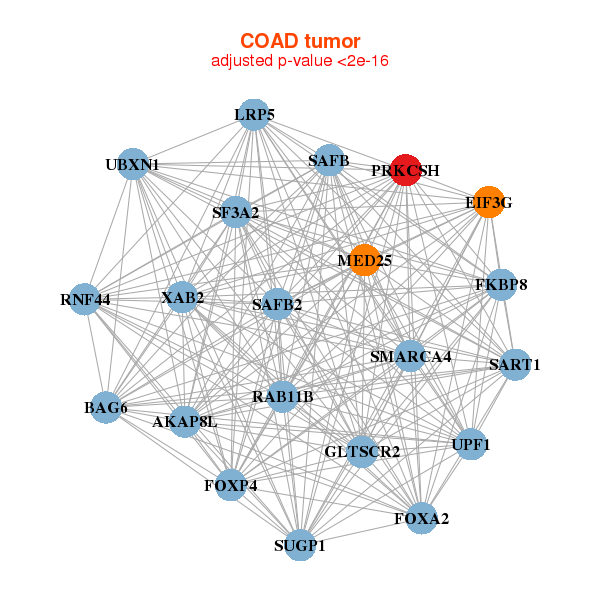
| * Co-Expression network figures were drawn using R package igraph. Only the top 20 genes with the highest correlations were shown. Red circle: input gene, orange circle: cell metabolism gene, sky circle: other gene |
: Open all plots for all cancer types
 |
|
| C19orf43,C19orf52,CCDC124,CDC37,COPE,ECSIT,EIF3G, ELOF1,FARSA,FKBP8,MRPL4,PIN1,PPAN,PRKCSH, QTRT1,RAD23A,STX10,TMED1,TMEM161A,YIPF2,ZNF653 | C9orf114,DDX49,DDX54,EHMT2,FARSA,GTF2F1,HMG20B, LRRC45,MAN1B1,PES1,PRKCSH,RBM10,RPUSD1,RRP1, RUVBL2,TCF25,TRIM28,TSC22D4,NELFA,XAB2,XRCC1 |
 |
|
| AKAP8L,BAG6,EIF3G,FKBP8,FOXA2,FOXP4,GLTSCR2, LRP5,MED25,PRKCSH,RAB11B,RNF44,SAFB2,SAFB, SART1,SF3A2,SUGP1,SMARCA4,UBXN1,UPF1,XAB2 | ABHD15,AGPAT3,ATG9A,BAG6,CLPTM1,EPN1,GIT1, INSR,KIAA0195,LRP5,MAP3K11,OS9,P4HA2,POMT1, PRKCSH,PTPRF,RFX1,SORL1,ZNF592,ZNF687,ZNF768 |
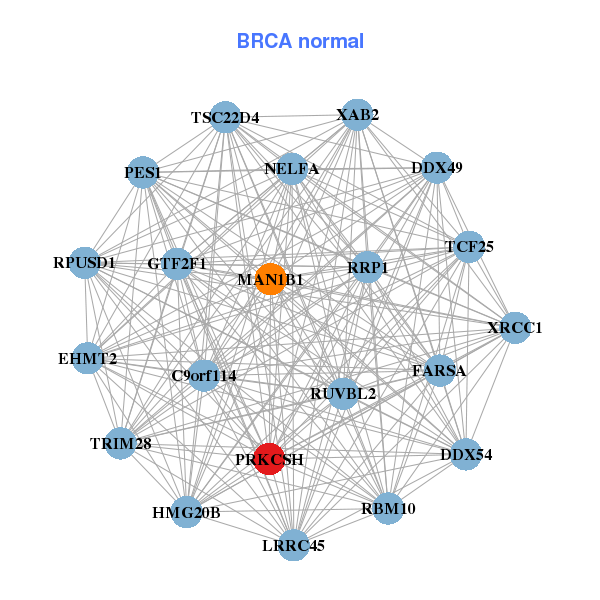
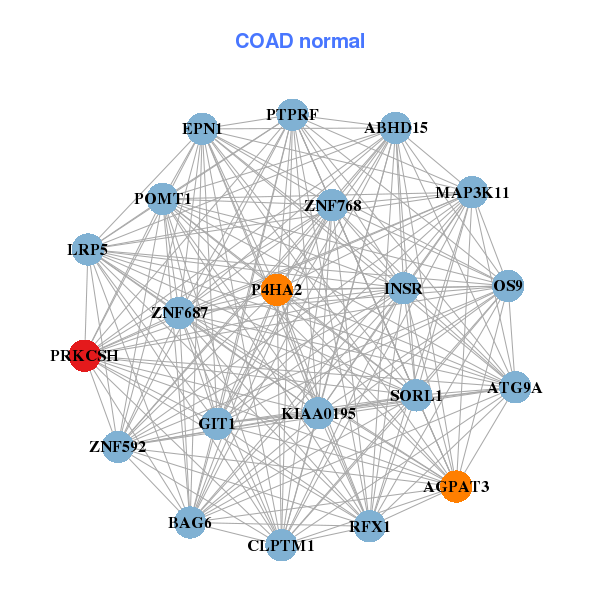
| * Co-Expression network figures were drawn using R package igraph. Only the top 20 genes with the highest correlations were shown. Red circle: input gene, orange circle: cell metabolism gene, sky circle: other gene |
: Open all plots for all cancer types
| Top |
: Open all interacting genes' information including KEGG pathway for all interacting genes from DAVID
| Top |
| Pharmacological Information for PRKCSH |
| There's no related Drug. |
| Top |
| Cross referenced IDs for PRKCSH |
| * We obtained these cross-references from Uniprot database. It covers 150 different DBs, 18 categories. http://www.uniprot.org/help/cross_references_section |
: Open all cross reference information
|
Copyright © 2016-Present - The Univsersity of Texas Health Science Center at Houston @ |