|
|||||||||||||||||||||||||||||||||||||||||||||||||||||||||||||||||||||||||||||||||||||||||||||||||||||||||||||||||||||||||||||||||||||||||||||||||||||||||||||||||||||||||||||||||||||||||||||||||||||||||||||||||||||||||||||||||||||||||||||||||||||||||||||||||||||||||||||||||||||||||||||||||||||||||||||||||||||||||||||||||||||||||||||
| |
| Phenotypic Information (metabolism pathway, cancer, disease, phenome) |
| |
| |
| Gene-Gene Network Information: Co-Expression Network, Interacting Genes & KEGG |
| |
|


| Gene Summary for CMAS |
| Basic gene info. | Gene symbol | CMAS |
| Gene name | cytidine monophosphate N-acetylneuraminic acid synthetase | |
| Synonyms | CSS | |
| Cytomap | UCSC genome browser: 12p12.1 | |
| Genomic location | chr12 :22199158-22218602 | |
| Type of gene | protein-coding | |
| RefGenes | NM_018686.4, | |
| Ensembl id | ENSG00000111726 | |
| Description | CMP-N-acetylneuraminic acid synthaseCMP-N-acetylneuraminic acid synthetaseCMP-Neu5Ac synthetaseCMP-NeuNAc synthaseCMP-NeuNAc synthetaseCMP-sialic acid synthetaseN-acylneuraminate cytidylyltransferasecytidine 5'-monophosphate N-acetylneuraminic acid | |
| Modification date | 20141207 | |
| dbXrefs | MIM : 603316 | |
| HGNC : HGNC | ||
| Ensembl : ENSG00000111726 | ||
| HPRD : 04501 | ||
| Vega : OTTHUMG00000169097 | ||
| Protein | UniProt: go to UniProt's Cross Reference DB Table | |
| Expression | CleanEX: HS_CMAS | |
| BioGPS: 55907 | ||
| Gene Expression Atlas: ENSG00000111726 | ||
| The Human Protein Atlas: ENSG00000111726 | ||
| Pathway | NCI Pathway Interaction Database: CMAS | |
| KEGG: CMAS | ||
| REACTOME: CMAS | ||
| ConsensusPathDB | ||
| Pathway Commons: CMAS | ||
| Metabolism | MetaCyc: CMAS | |
| HUMANCyc: CMAS | ||
| Regulation | Ensembl's Regulation: ENSG00000111726 | |
| miRBase: chr12 :22,199,158-22,218,602 | ||
| TargetScan: NM_018686 | ||
| cisRED: ENSG00000111726 | ||
| Context | iHOP: CMAS | |
| cancer metabolism search in PubMed: CMAS | ||
| UCL Cancer Institute: CMAS | ||
| Assigned class in ccmGDB | C | |
| Top |
| Phenotypic Information for CMAS(metabolism pathway, cancer, disease, phenome) |
| Cancer | CGAP: CMAS |
| Familial Cancer Database: CMAS | |
| * This gene is included in those cancer gene databases. |
|
|
|
|
|
| . | |||||||||||||||||||||||||||||||||||||||||||||||||||||||||||||||||||||||||||||||||||||||||||||||||||||||||||||||||||||||||||||||||||||||||||||||||||||||||||||||||||||||||||||||||||||||||||||||||||||||||||||||||||||||||||||||||||||||||||||||||||||||||||||||||||||||||||||||||||||||||||||||||||||||||||||||||||||||||||||||||||||||
Oncogene 1 | Significant driver gene in | ||||||||||||||||||||||||||||||||||||||||||||||||||||||||||||||||||||||||||||||||||||||||||||||||||||||||||||||||||||||||||||||||||||||||||||||||||||||||||||||||||||||||||||||||||||||||||||||||||||||||||||||||||||||||||||||||||||||||||||||||||||||||||||||||||||||||||||||||||||||||||||||||||||||||||||||||||||||||||||||||||||||||||||
| cf) number; DB name 1 Oncogene; http://nar.oxfordjournals.org/content/35/suppl_1/D721.long, 2 Tumor Suppressor gene; https://bioinfo.uth.edu/TSGene/, 3 Cancer Gene Census; http://www.nature.com/nrc/journal/v4/n3/abs/nrc1299.html, 4 CancerGenes; http://nar.oxfordjournals.org/content/35/suppl_1/D721.long, 5 Network of Cancer Gene; http://ncg.kcl.ac.uk/index.php, 1Therapeutic Vulnerabilities in Cancer; http://cbio.mskcc.org/cancergenomics/statius/ |
| KEGG_AMINO_SUGAR_AND_NUCLEOTIDE_SUGAR_METABOLISM | |
| OMIM | |
| Orphanet | |
| Disease | KEGG Disease: CMAS |
| MedGen: CMAS (Human Medical Genetics with Condition) | |
| ClinVar: CMAS | |
| Phenotype | MGI: CMAS (International Mouse Phenotyping Consortium) |
| PhenomicDB: CMAS | |
| Mutations for CMAS |
| * Under tables are showing count per each tissue to give us broad intuition about tissue specific mutation patterns.You can go to the detailed page for each mutation database's web site. |
| - Statistics for Tissue and Mutation type | Top |
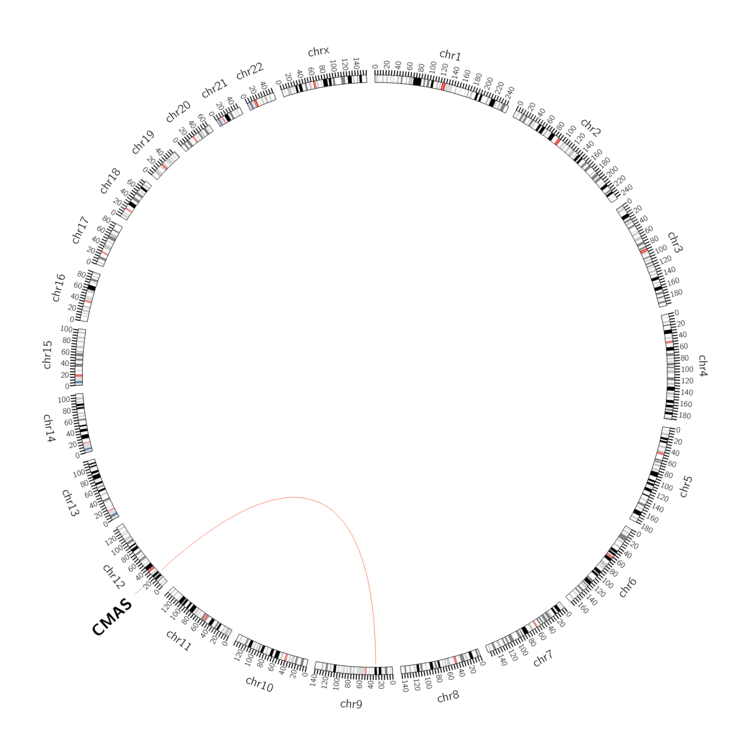 |
| - For Inter-chromosomal Variations |
| There's no inter-chromosomal structural variation. |
| - For Intra-chromosomal Variations |
| There's no intra-chromosomal structural variation. |
| Sample | Symbol_a | Chr_a | Start_a | End_a | Symbol_b | Chr_b | Start_b | End_b |
| cf) Tissue number; Tissue name (1;Breast, 2;Central_nervous_system, 3;Haematopoietic_and_lymphoid_tissue, 4;Large_intestine, 5;Liver, 6;Lung, 7;Ovary, 8;Pancreas, 9;Prostate, 10;Skin, 11;Soft_tissue, 12;Upper_aerodigestive_tract) |
| * From mRNA Sanger sequences, Chitars2.0 arranged chimeric transcripts. This table shows CMAS related fusion information. |
| ID | Head Gene | Tail Gene | Accession | Gene_a | qStart_a | qEnd_a | Chromosome_a | tStart_a | tEnd_a | Gene_a | qStart_a | qEnd_a | Chromosome_a | tStart_a | tEnd_a |
| DA571172 | SH3RF1 | 1 | 196 | 4 | 170043326 | 170051300 | CMAS | 193 | 875 | 12 | 22199463 | 22214325 | |
| AF119840 | CMAS | 1 | 647 | 12 | 22215302 | 22215952 | ALB | 641 | 2699 | 4 | 74270004 | 74286973 | |
| DB053027 | TCF12 | 1 | 384 | 15 | 57283168 | 57283551 | CMAS | 385 | 566 | 12 | 22199173 | 22199354 | |
| BX106129 | CMAS | 17 | 465 | 12 | 22216717 | 22223561 | CMAS | 460 | 733 | 12 | 22218055 | 22218328 | |
| Top |
| Mutation type/ Tissue ID | brca | cns | cerv | endome | haematopo | kidn | Lintest | liver | lung | ns | ovary | pancre | prost | skin | stoma | thyro | urina | |||
| Total # sample | 1 | 1 | ||||||||||||||||||
| GAIN (# sample) | 1 | |||||||||||||||||||
| LOSS (# sample) | 1 |
| cf) Tissue ID; Tissue type (1; Breast, 2; Central_nervous_system, 3; Cervix, 4; Endometrium, 5; Haematopoietic_and_lymphoid_tissue, 6; Kidney, 7; Large_intestine, 8; Liver, 9; Lung, 10; NS, 11; Ovary, 12; Pancreas, 13; Prostate, 14; Skin, 15; Stomach, 16; Thyroid, 17; Urinary_tract) |
| Top |
|
 |
| Top |
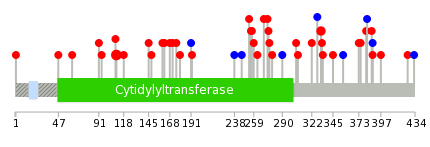
| Stat. for Non-Synonymous SNVs (# total SNVs=41) | (# total SNVs=6) |
 |  |
(# total SNVs=2) | (# total SNVs=0) |
 |
| Top |
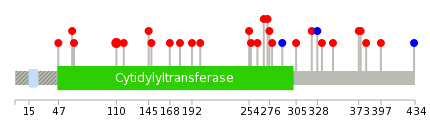
| * When you move the cursor on each content, you can see more deailed mutation information on the Tooltip. Those are primary_site,primary_histology,mutation(aa),pubmedID. |
| GRCh37 position | Mutation(aa) | Unique sampleID count |
| chr12:22208151-22208151 | p.R110Q | 4 |
| chr12:22208520-22208520 | p.R179* | 2 |
| chr12:22214246-22214246 | p.E274K | 2 |
| chr12:22215250-22215250 | p.Q332H | 2 |
| chr12:22208488-22208488 | p.S168C | 1 |
| chr12:22215322-22215322 | p.E356E | 1 |
| chr12:22213832-22213832 | p.W254R | 1 |
| chr12:22218216-22218216 | p.E426K | 1 |
| chr12:22208094-22208094 | p.S91L | 1 |
| chr12:22214321-22214321 | p.E299* | 1 |
| Top |
|
 |
| Point Mutation/ Tissue ID | 1 | 2 | 3 | 4 | 5 | 6 | 7 | 8 | 9 | 10 | 11 | 12 | 13 | 14 | 15 | 16 | 17 | 18 | 19 | 20 |
| # sample | 1 | 1 | 6 | 1 | 1 | 3 | 1 | 2 | 5 | 6 | ||||||||||
| # mutation | 1 | 1 | 8 | 1 | 1 | 3 | 1 | 2 | 5 | 6 | ||||||||||
| nonsynonymous SNV | 1 | 1 | 7 | 1 | 1 | 3 | 1 | 1 | 5 | 5 | ||||||||||
| synonymous SNV | 1 | 1 | 1 |
| cf) Tissue ID; Tissue type (1; BLCA[Bladder Urothelial Carcinoma], 2; BRCA[Breast invasive carcinoma], 3; CESC[Cervical squamous cell carcinoma and endocervical adenocarcinoma], 4; COAD[Colon adenocarcinoma], 5; GBM[Glioblastoma multiforme], 6; Glioma Low Grade, 7; HNSC[Head and Neck squamous cell carcinoma], 8; KICH[Kidney Chromophobe], 9; KIRC[Kidney renal clear cell carcinoma], 10; KIRP[Kidney renal papillary cell carcinoma], 11; LAML[Acute Myeloid Leukemia], 12; LUAD[Lung adenocarcinoma], 13; LUSC[Lung squamous cell carcinoma], 14; OV[Ovarian serous cystadenocarcinoma ], 15; PAAD[Pancreatic adenocarcinoma], 16; PRAD[Prostate adenocarcinoma], 17; SKCM[Skin Cutaneous Melanoma], 18:STAD[Stomach adenocarcinoma], 19:THCA[Thyroid carcinoma], 20:UCEC[Uterine Corpus Endometrial Carcinoma]) |
| Top |
| * We represented just top 10 SNVs. When you move the cursor on each content, you can see more deailed mutation information on the Tooltip. Those are primary_site, primary_histology, mutation(aa), pubmedID. |
| Genomic Position | Mutation(aa) | Unique sampleID count |
| chr12:22208151 | p.R110Q | 3 |
| chr12:22214234 | p.D118V | 1 |
| chr12:22218064 | p.R322M | 1 |
| chr12:22208175 | p.T145A | 1 |
| chr12:22214246 | p.A328A | 1 |
| chr12:22218082 | p.C148Y | 1 |
| chr12:22208418 | p.T333M | 1 |
| chr12:22214254 | p.S168C | 1 |
| chr12:22218129 | p.V345I | 1 |
| chr12:22208428 | p.R179Q | 1 |
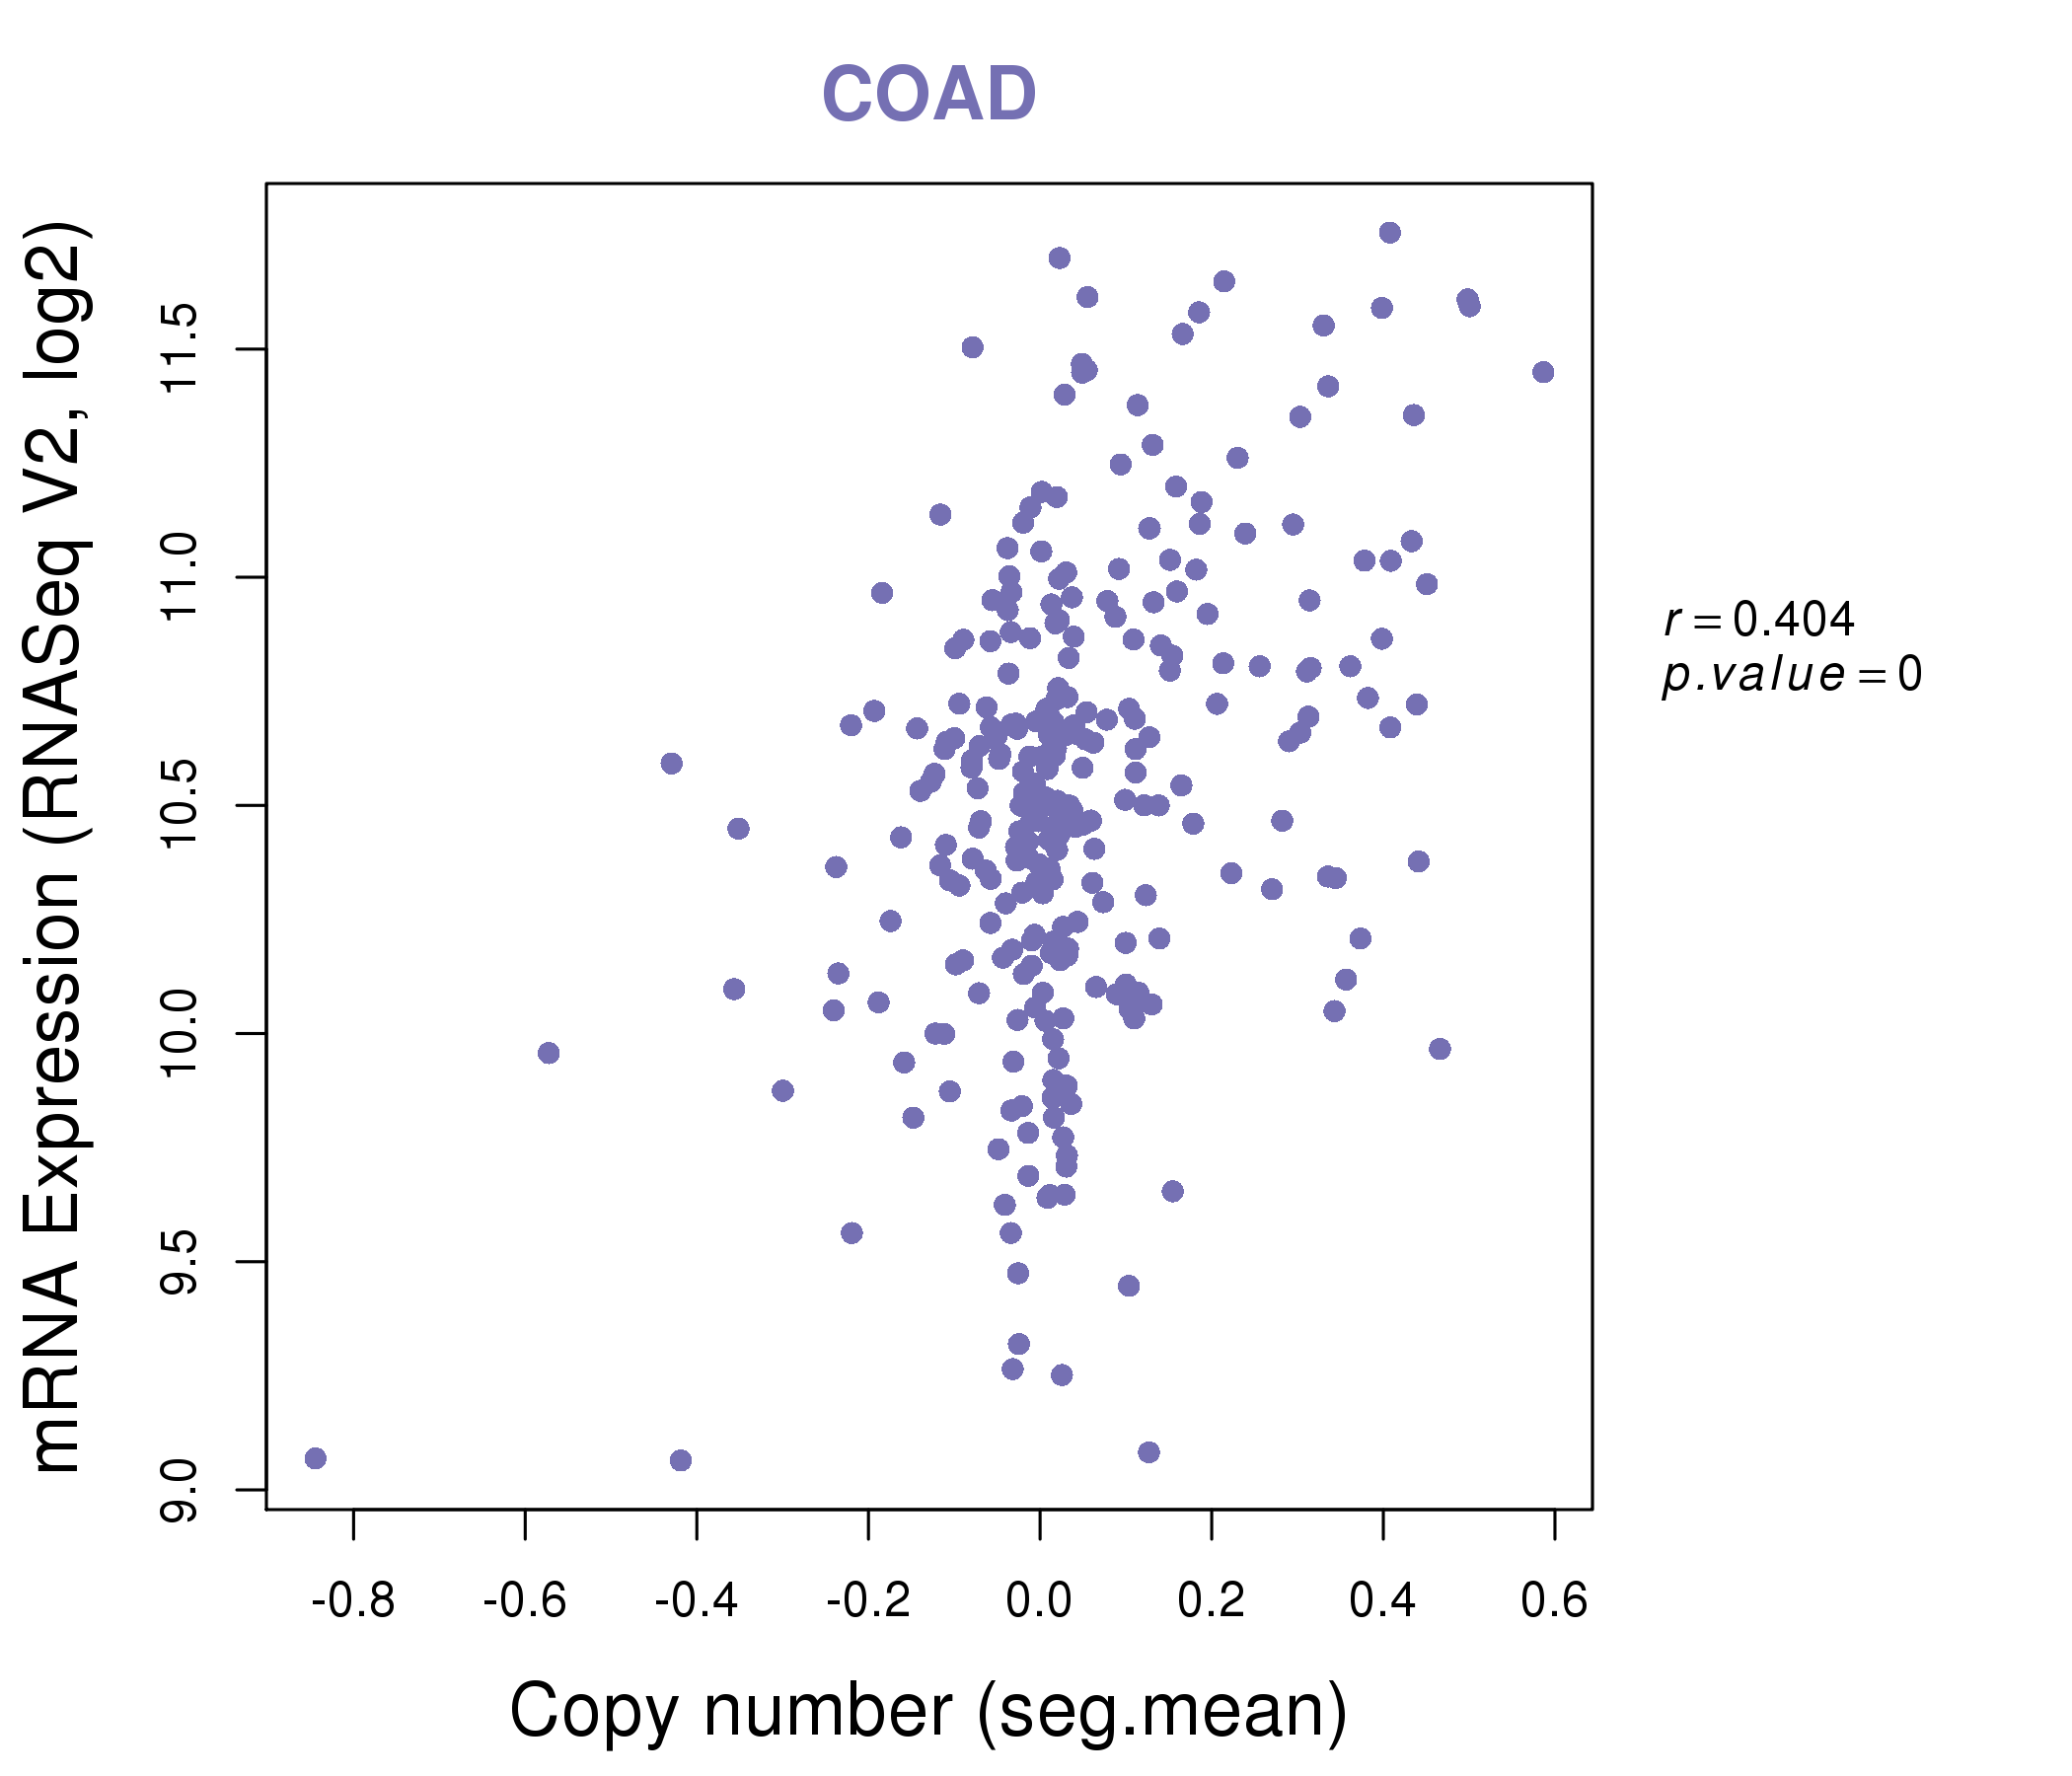
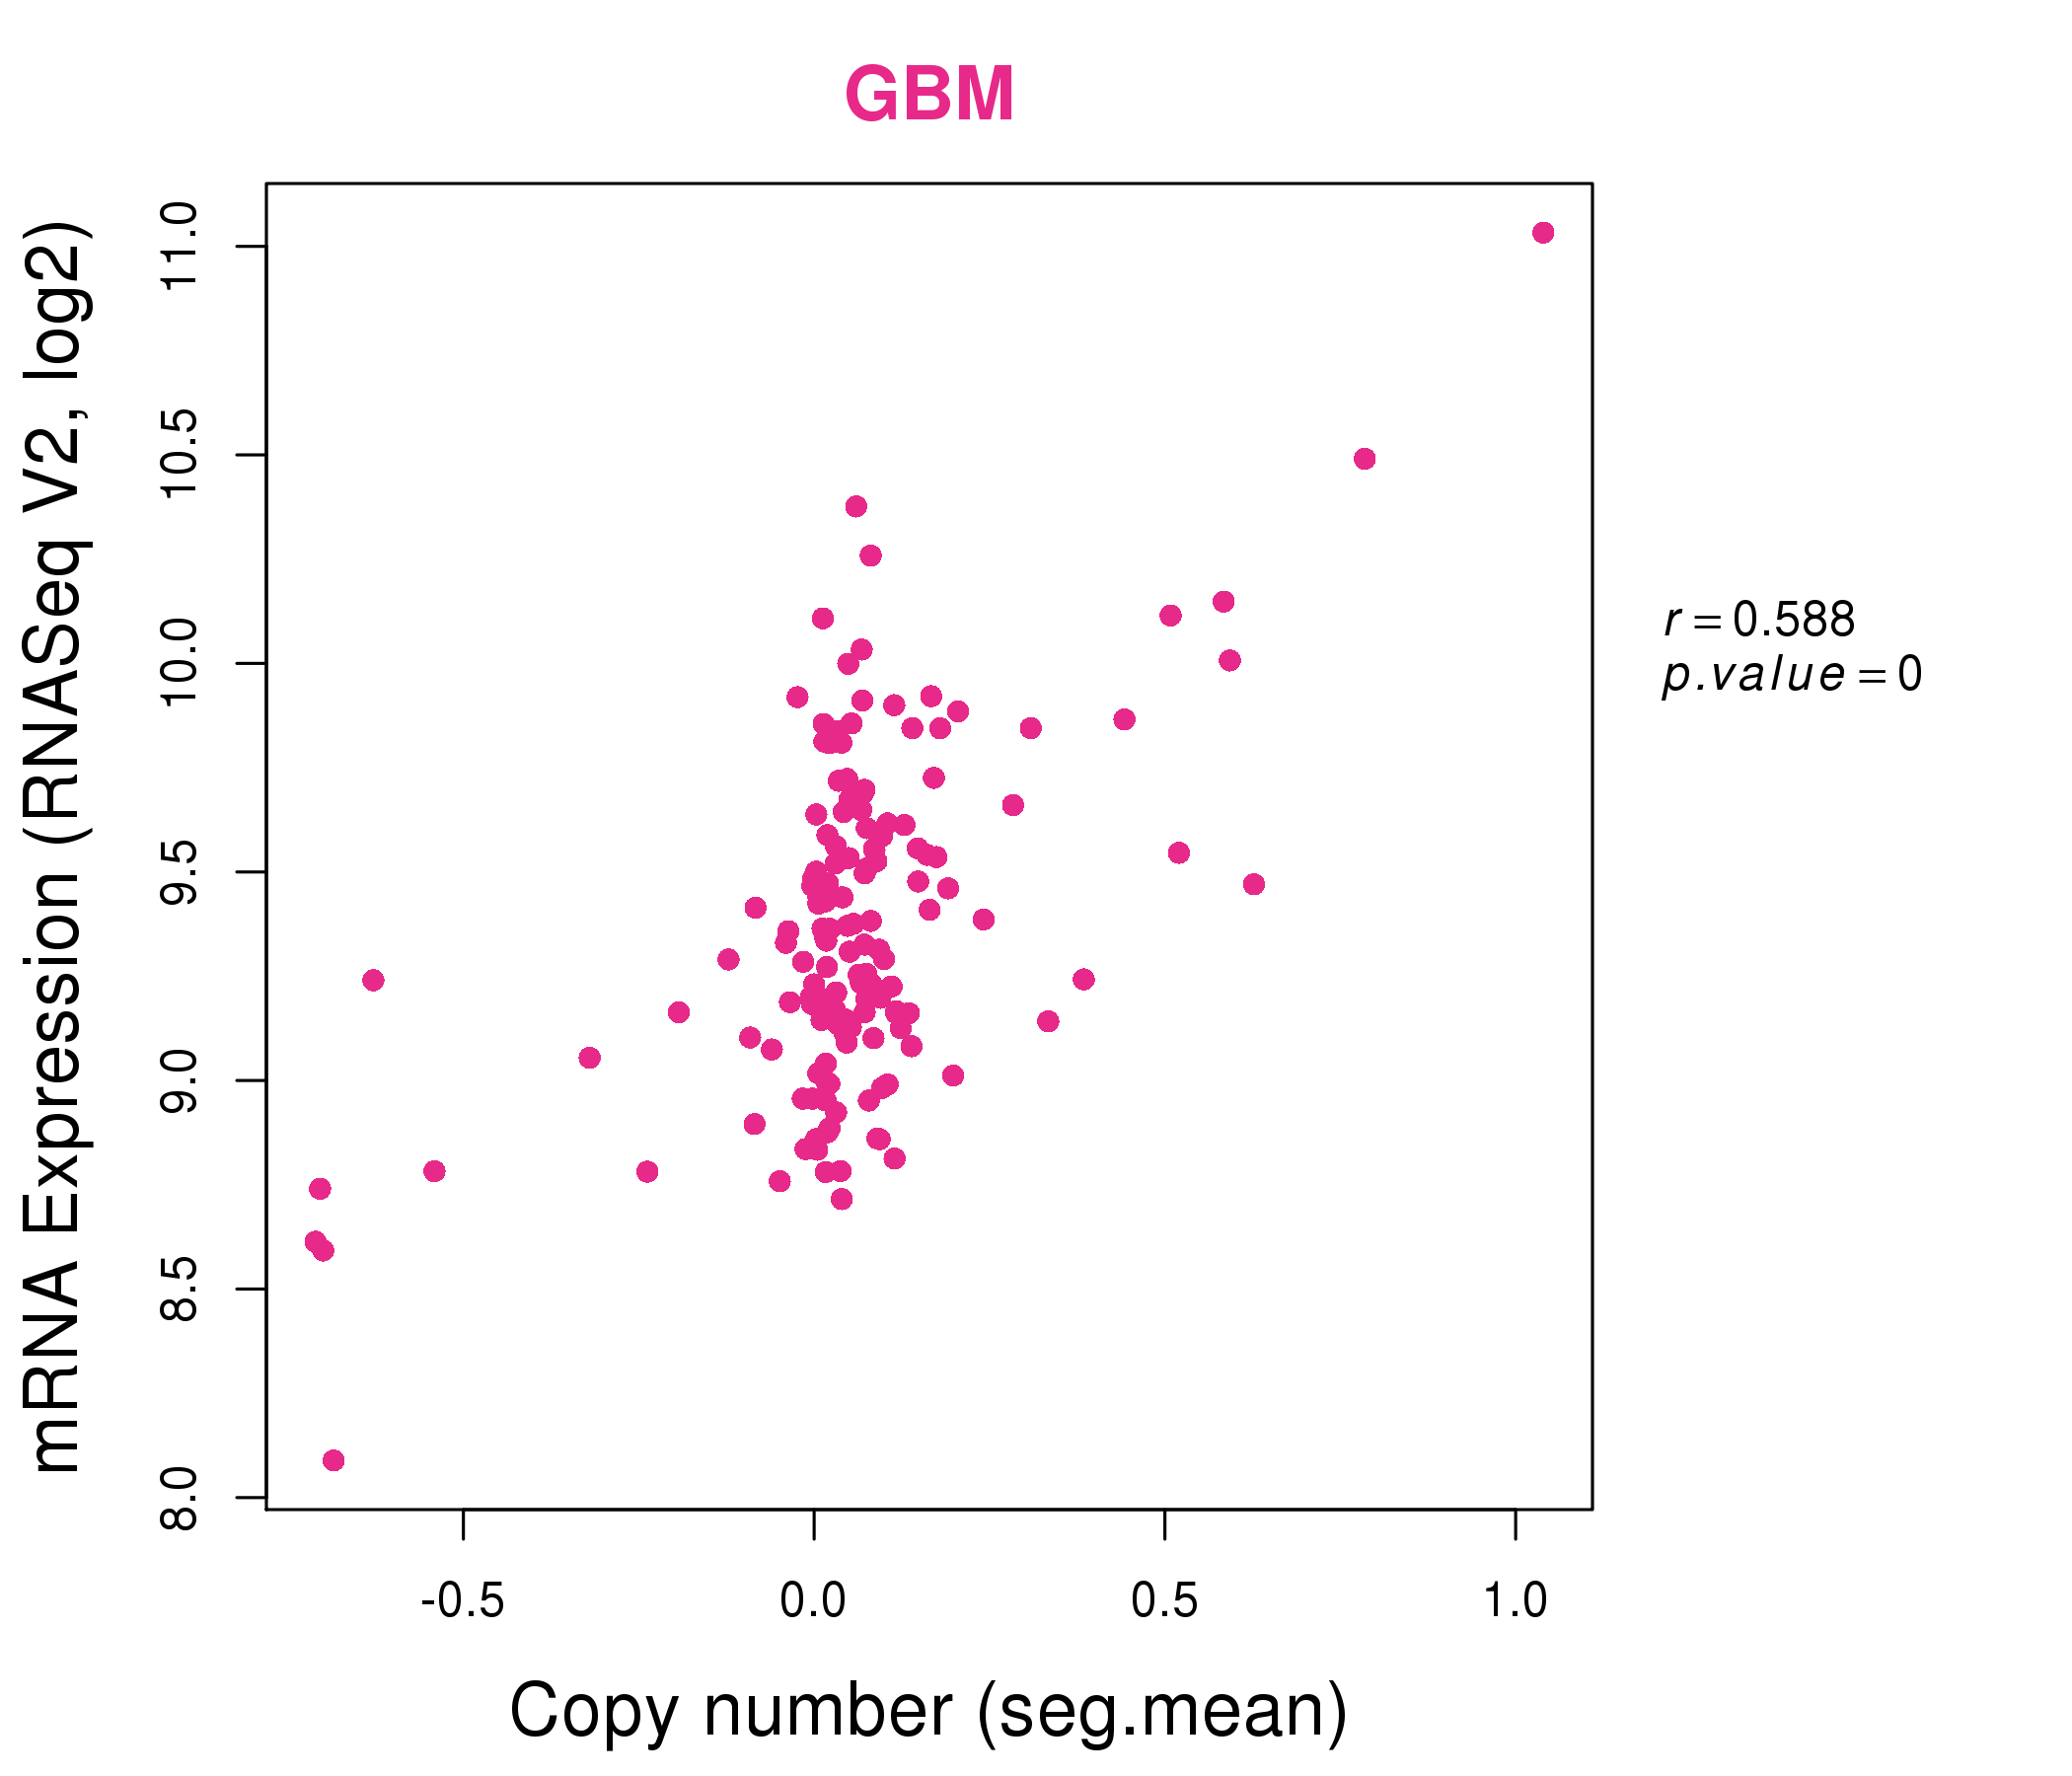
| * Copy number data were extracted from TCGA using R package TCGA-Assembler. The URLs of all public data files on TCGA DCC data server were gathered on Jan-05-2015. Function ProcessCNAData in TCGA-Assembler package was used to obtain gene-level copy number value which is calculated as the average copy number of the genomic region of a gene. |
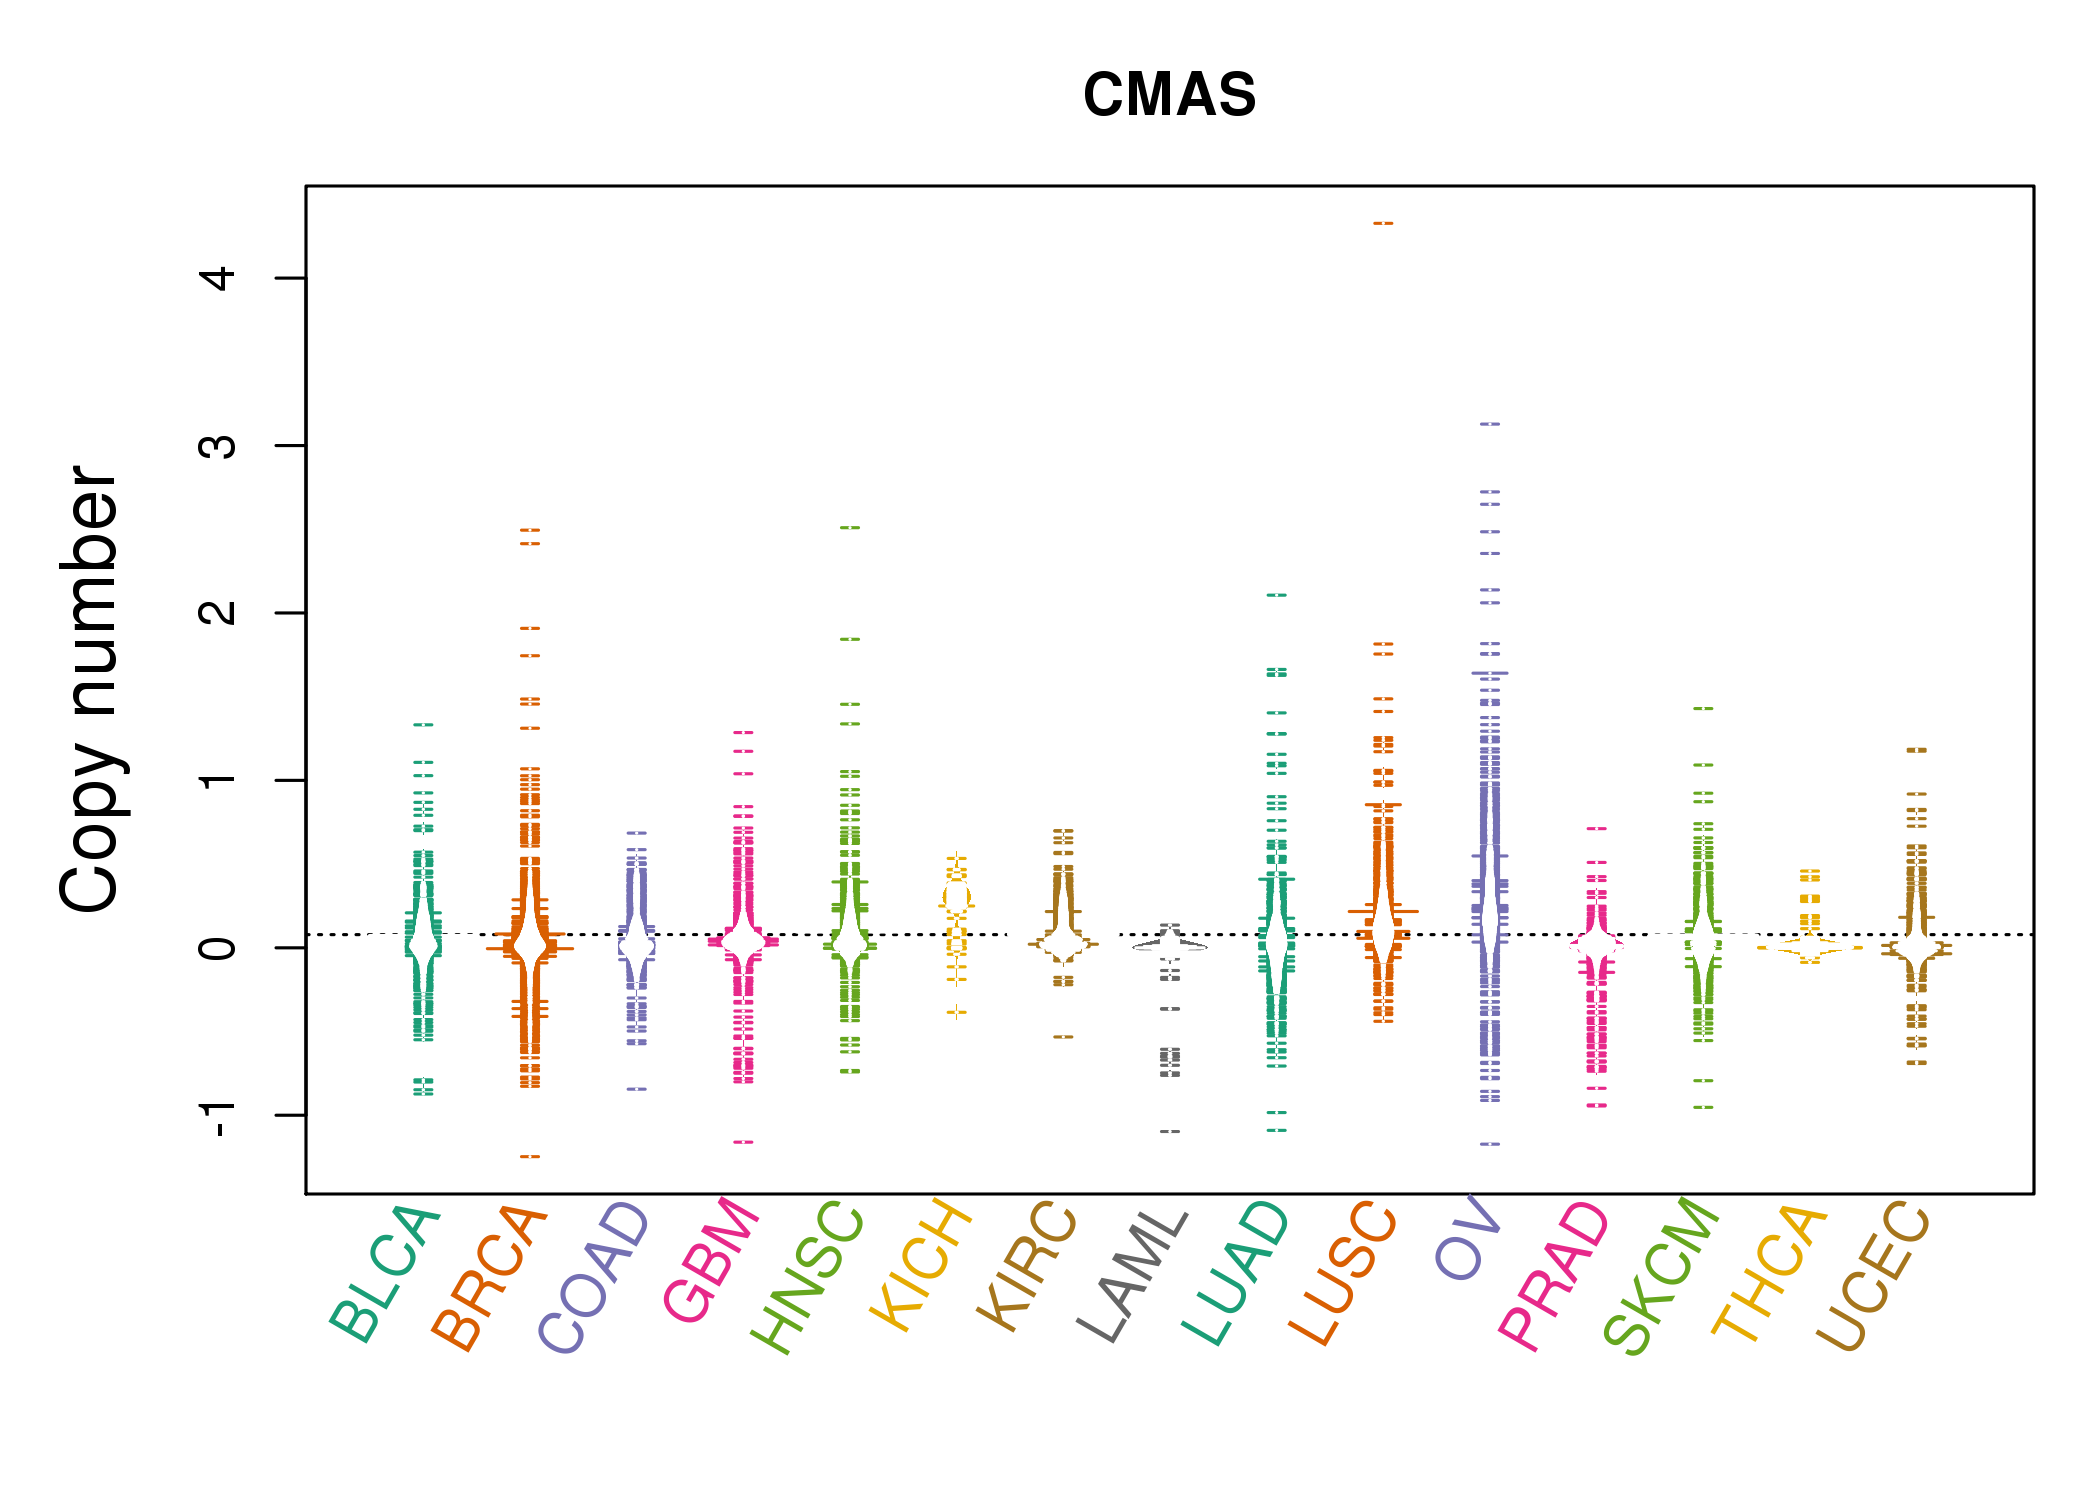 |
| cf) Tissue ID[Tissue type]: BLCA[Bladder Urothelial Carcinoma], BRCA[Breast invasive carcinoma], CESC[Cervical squamous cell carcinoma and endocervical adenocarcinoma], COAD[Colon adenocarcinoma], GBM[Glioblastoma multiforme], Glioma Low Grade, HNSC[Head and Neck squamous cell carcinoma], KICH[Kidney Chromophobe], KIRC[Kidney renal clear cell carcinoma], KIRP[Kidney renal papillary cell carcinoma], LAML[Acute Myeloid Leukemia], LUAD[Lung adenocarcinoma], LUSC[Lung squamous cell carcinoma], OV[Ovarian serous cystadenocarcinoma ], PAAD[Pancreatic adenocarcinoma], PRAD[Prostate adenocarcinoma], SKCM[Skin Cutaneous Melanoma], STAD[Stomach adenocarcinoma], THCA[Thyroid carcinoma], UCEC[Uterine Corpus Endometrial Carcinoma] |
| Top |
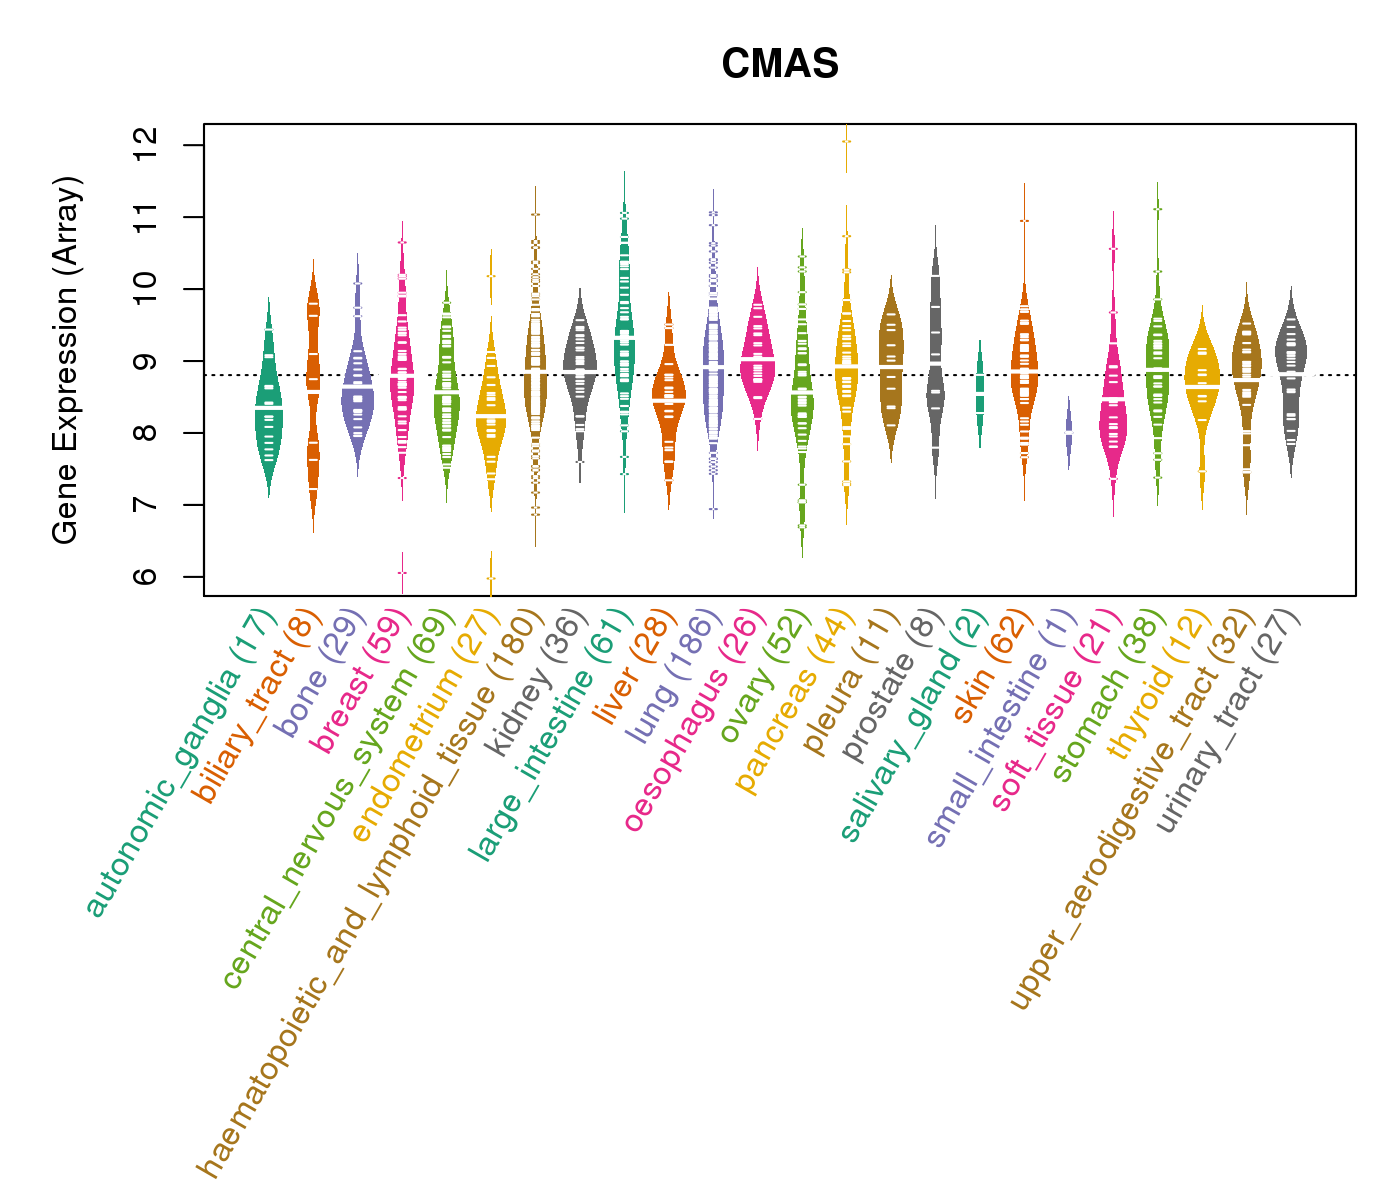
| Gene Expression for CMAS |
| * CCLE gene expression data were extracted from CCLE_Expression_Entrez_2012-10-18.res: Gene-centric RMA-normalized mRNA expression data. |
 |
| * Normalized gene expression data of RNASeqV2 was extracted from TCGA using R package TCGA-Assembler. The URLs of all public data files on TCGA DCC data server were gathered at Jan-05-2015. Only eight cancer types have enough normal control samples for differential expression analysis. (t test, adjusted p<0.05 (using Benjamini-Hochberg FDR)) |
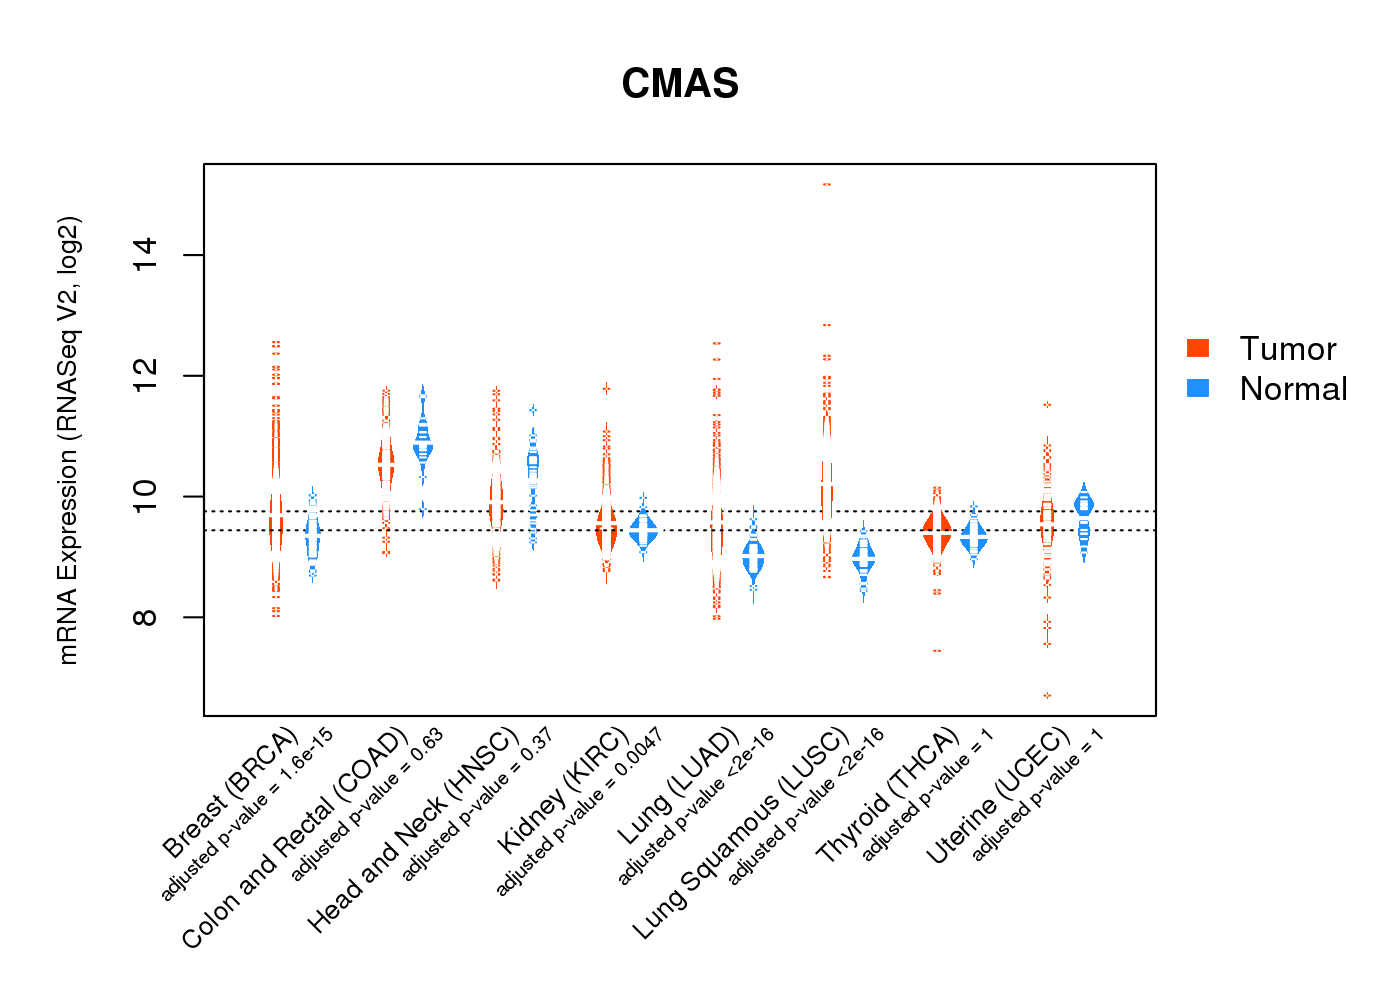 |
| Top |
| * This plots show the correlation between CNV and gene expression. |
: Open all plots for all cancer types
 |
|
 |
|

| Top |
| Gene-Gene Network Information |
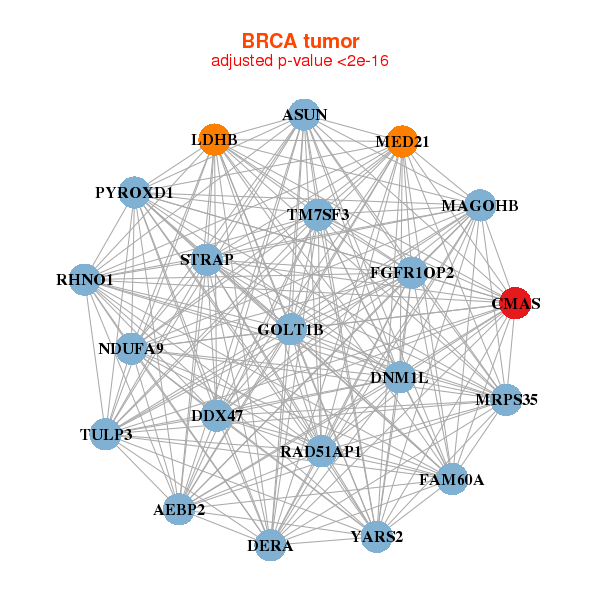
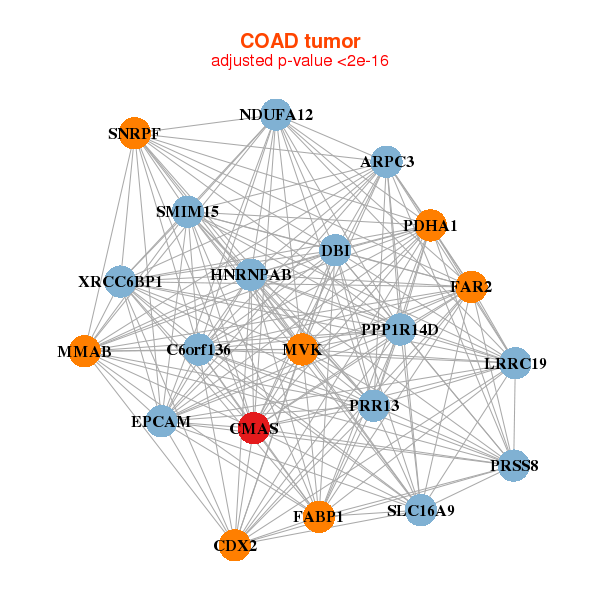
| * Co-Expression network figures were drawn using R package igraph. Only the top 20 genes with the highest correlations were shown. Red circle: input gene, orange circle: cell metabolism gene, sky circle: other gene |
: Open all plots for all cancer types
 |
| ||||
| AEBP2,ASUN,RHNO1,CMAS,DDX47,DERA,DNM1L, FAM60A,FGFR1OP2,GOLT1B,LDHB,MAGOHB,MED21,MRPS35, NDUFA9,PYROXD1,RAD51AP1,STRAP,TM7SF3,TULP3,YARS2 | ACP1,CCNB1IP1,CDK7,CMAS,DENR,ELF5,FANCL, GTF2F2,HDAC2,KLF5,LRRC8D,METAP1,NIFK,NUFIP1, PDSS1,SET,STX19,TEX10,TMSB15A,TPD52L1,YTHDF2 | ||||
 |
| ||||
| ARPC3,SMIM15,C6orf136,CDX2,CMAS,DBI,EPCAM, FABP1,FAR2,HNRNPAB,LRRC19,MMAB,MVK,NDUFA12, PDHA1,PPP1R14D,PRR13,PRSS8,SLC16A9,SNRPF,XRCC6BP1 | CNOT11,MCU,CDH17,CMAS,EPCAM,ABHD17C,FUCA2, GPD2,LIMA1,LRRFIP2,MBD2,NIPA2,PGGT1B,PIP5K1B, PPM1B,PPP2R1B,PRSS12,RAB14,RBM47,RNF6,PTBP3 |
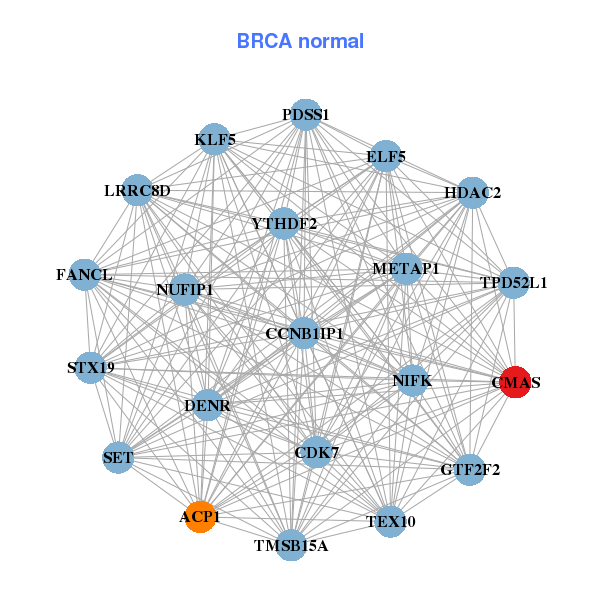

| * Co-Expression network figures were drawn using R package igraph. Only the top 20 genes with the highest correlations were shown. Red circle: input gene, orange circle: cell metabolism gene, sky circle: other gene |
: Open all plots for all cancer types
| Top |
: Open all interacting genes' information including KEGG pathway for all interacting genes from DAVID
| Top |
| Pharmacological Information for CMAS |
| DB Category | DB Name | DB's ID and Url link |
| * Gene Centered Interaction Network. |
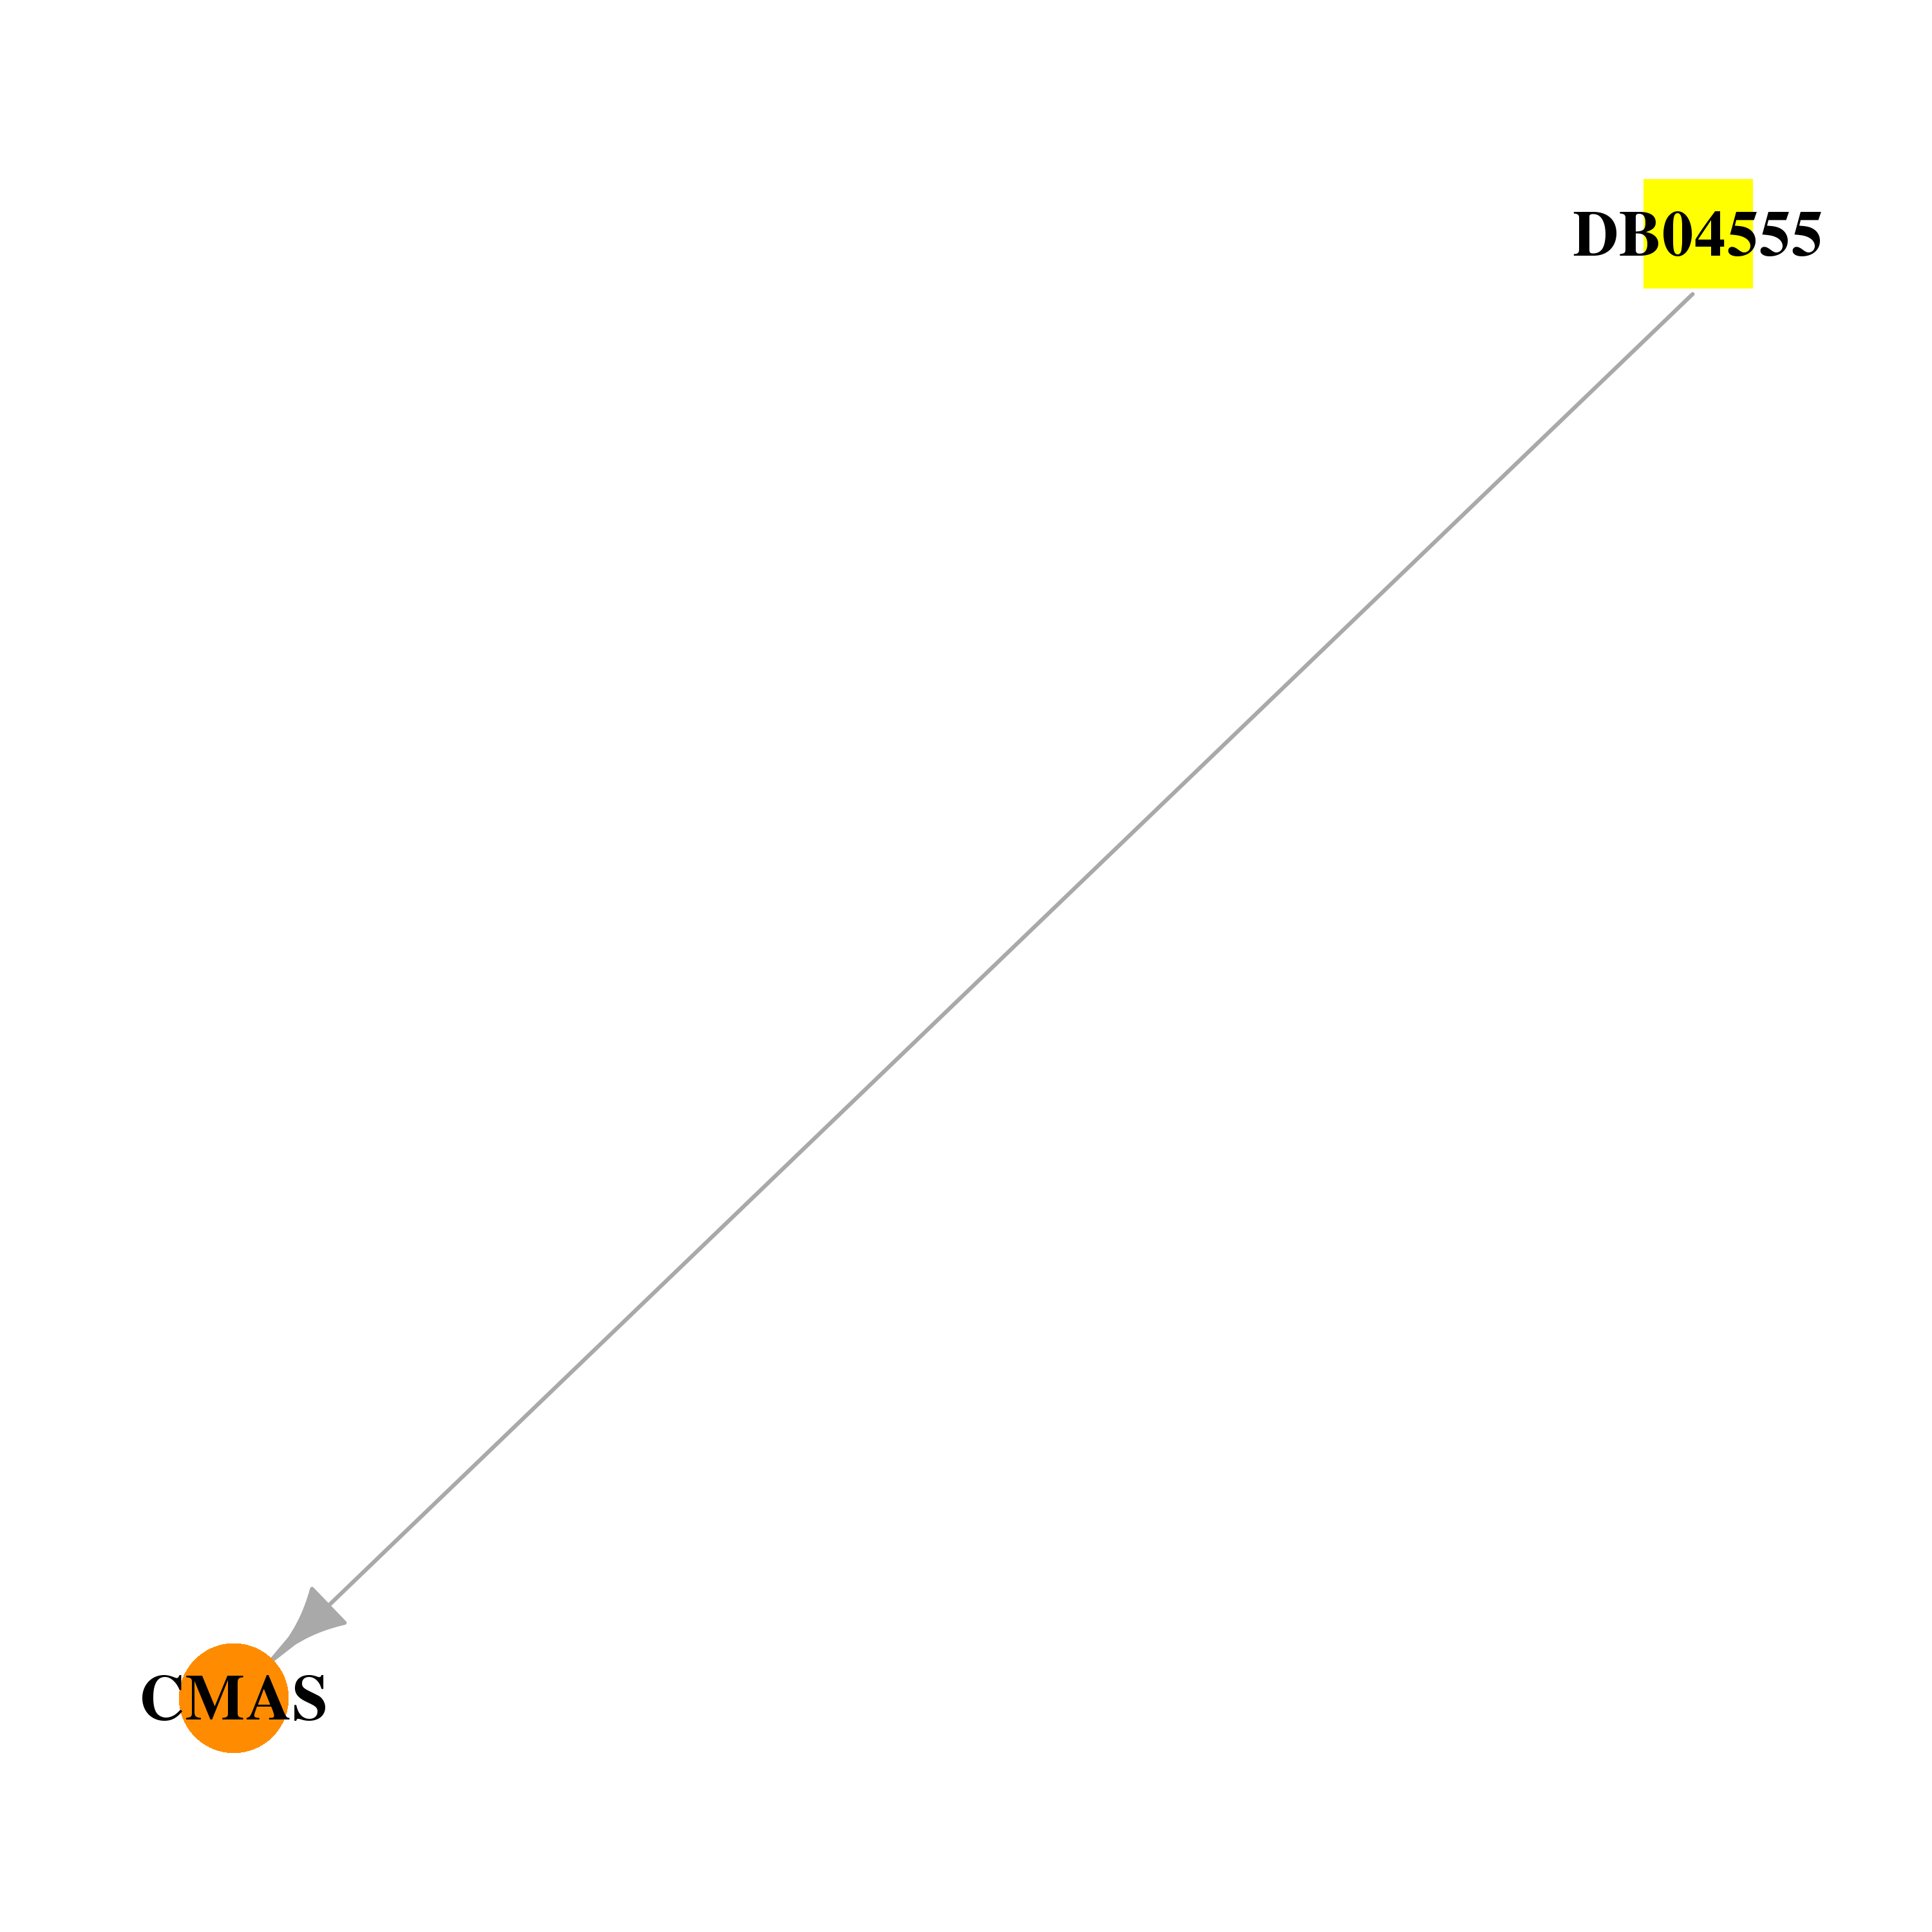 |
| * Drug Centered Interaction Network. |
| DrugBank ID | Target Name | Drug Groups | Generic Name | Drug Centered Network | Drug Structure |
| DB04555 | cytidine monophosphate N-acetylneuraminic acid synthetase | experimental | Cytidine-5'-Diphosphate |  |  |
| Top |
| Cross referenced IDs for CMAS |
| * We obtained these cross-references from Uniprot database. It covers 150 different DBs, 18 categories. http://www.uniprot.org/help/cross_references_section |
: Open all cross reference information
|
Copyright © 2016-Present - The Univsersity of Texas Health Science Center at Houston @ |