|
||||||||||||||||||||||||||||||||||||||||||||||||||||||||||||||||||||||||||||||||||||||||||||||||||||||||||||||||||||||||||||||||||||||||||||||||||||||||||||||||||||||||||||||||||||||||||||||||||||||||||||||||||||||||||||||||||||||||||||||||||||||||||||||||||||||||||||||||||||||||||||||||||||||||||||||||||||||||||
| |
| Phenotypic Information (metabolism pathway, cancer, disease, phenome) |
| |
| |
| Gene-Gene Network Information: Co-Expression Network, Interacting Genes & KEGG |
| |
|


| Gene Summary for GPCPD1 |
| Basic gene info. | Gene symbol | GPCPD1 |
| Gene name | glycerophosphocholine phosphodiesterase GDE1 homolog (S. cerevisiae) | |
| Synonyms | GDE5|GDPD6|PREI4 | |
| Cytomap | UCSC genome browser: 20p12.3 | |
| Genomic location | chr20 :5525079-5591672 | |
| Type of gene | protein-coding | |
| RefGenes | NM_019593.3, | |
| Ensembl id | ENSG00000125772 | |
| Description | glycerophosphocholine phosphodiesterase GPCPD1glycerophosphodiester phosphodiesterase 5preimplantation protein 4putative glycerophosphocholine phosphodiesterase GPCPD1putative glycerophosphodiester phosphodiesterase 5 | |
| Modification date | 20141207 | |
| dbXrefs | MIM : 614124 | |
| HGNC : HGNC | ||
| Ensembl : ENSG00000125772 | ||
| HPRD : 10025 | ||
| Vega : OTTHUMG00000031806 | ||
| Protein | UniProt: go to UniProt's Cross Reference DB Table | |
| Expression | CleanEX: HS_GPCPD1 | |
| BioGPS: 56261 | ||
| Gene Expression Atlas: ENSG00000125772 | ||
| The Human Protein Atlas: ENSG00000125772 | ||
| Pathway | NCI Pathway Interaction Database: GPCPD1 | |
| KEGG: GPCPD1 | ||
| REACTOME: GPCPD1 | ||
| ConsensusPathDB | ||
| Pathway Commons: GPCPD1 | ||
| Metabolism | MetaCyc: GPCPD1 | |
| HUMANCyc: GPCPD1 | ||
| Regulation | Ensembl's Regulation: ENSG00000125772 | |
| miRBase: chr20 :5,525,079-5,591,672 | ||
| TargetScan: NM_019593 | ||
| cisRED: ENSG00000125772 | ||
| Context | iHOP: GPCPD1 | |
| cancer metabolism search in PubMed: GPCPD1 | ||
| UCL Cancer Institute: GPCPD1 | ||
| Assigned class in ccmGDB | C | |
| Top |
| Phenotypic Information for GPCPD1(metabolism pathway, cancer, disease, phenome) |
| Cancer | CGAP: GPCPD1 |
| Familial Cancer Database: GPCPD1 | |
| * This gene is included in those cancer gene databases. |
|
|
|
|
|
| . | ||||||||||||||||||||||||||||||||||||||||||||||||||||||||||||||||||||||||||||||||||||||||||||||||||||||||||||||||||||||||||||||||||||||||||||||||||||||||||||||||||||||||||||||||||||||||||||||||||||||||||||||||||||||||||||||||||||||||||||||||||||||||||||||||||||||||||||||||||||||||||||||||||||||||||||||||||||
Oncogene 1 | Significant driver gene in | |||||||||||||||||||||||||||||||||||||||||||||||||||||||||||||||||||||||||||||||||||||||||||||||||||||||||||||||||||||||||||||||||||||||||||||||||||||||||||||||||||||||||||||||||||||||||||||||||||||||||||||||||||||||||||||||||||||||||||||||||||||||||||||||||||||||||||||||||||||||||||||||||||||||||||||||||||||||||
| cf) number; DB name 1 Oncogene; http://nar.oxfordjournals.org/content/35/suppl_1/D721.long, 2 Tumor Suppressor gene; https://bioinfo.uth.edu/TSGene/, 3 Cancer Gene Census; http://www.nature.com/nrc/journal/v4/n3/abs/nrc1299.html, 4 CancerGenes; http://nar.oxfordjournals.org/content/35/suppl_1/D721.long, 5 Network of Cancer Gene; http://ncg.kcl.ac.uk/index.php, 1Therapeutic Vulnerabilities in Cancer; http://cbio.mskcc.org/cancergenomics/statius/ |
| REACTOME_PHOSPHOLIPID_METABOLISM REACTOME_METABOLISM_OF_LIPIDS_AND_LIPOPROTEINS | |
| OMIM | |
| Orphanet | |
| Disease | KEGG Disease: GPCPD1 |
| MedGen: GPCPD1 (Human Medical Genetics with Condition) | |
| ClinVar: GPCPD1 | |
| Phenotype | MGI: GPCPD1 (International Mouse Phenotyping Consortium) |
| PhenomicDB: GPCPD1 | |
| Mutations for GPCPD1 |
| * Under tables are showing count per each tissue to give us broad intuition about tissue specific mutation patterns.You can go to the detailed page for each mutation database's web site. |
| - Statistics for Tissue and Mutation type | Top |
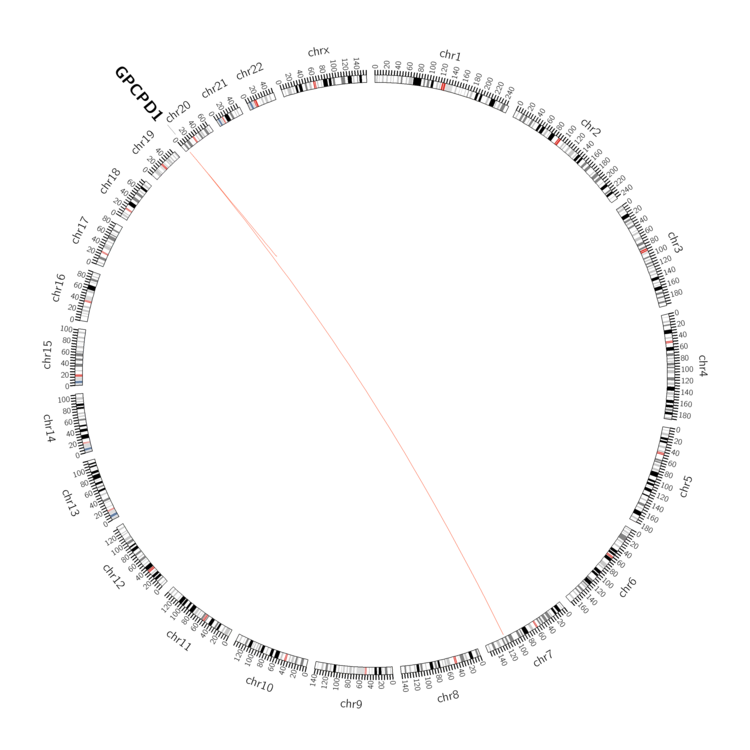 |
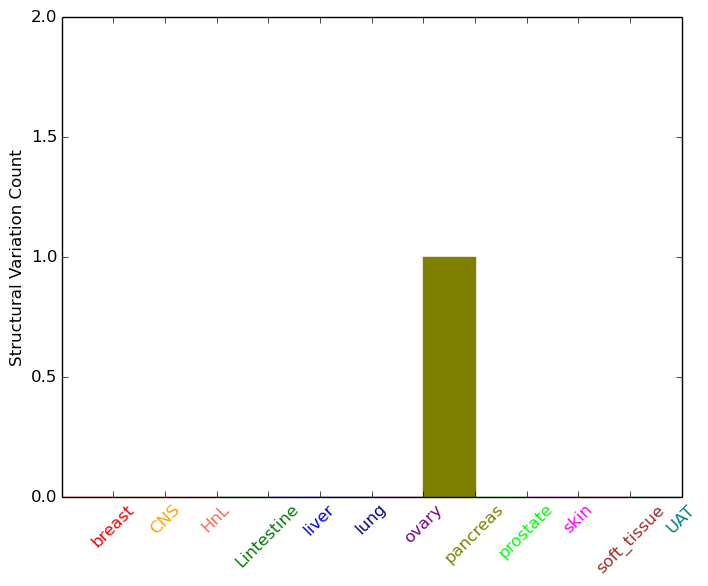
| - For Inter-chromosomal Variations |
| * Inter-chromosomal variantions includes 'interchromosomal amplicon to amplicon', 'interchromosomal amplicon to non-amplified dna', 'interchromosomal insertion', 'Interchromosomal unknown type'. |
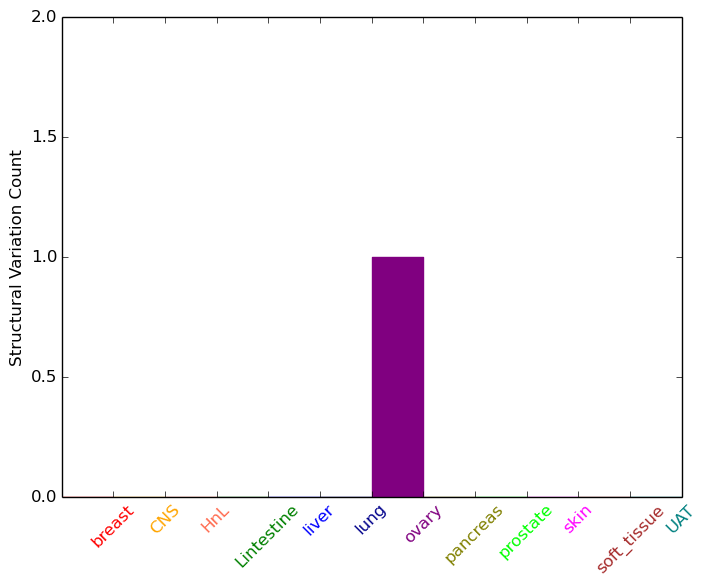 |
| - For Intra-chromosomal Variations |
| * Intra-chromosomal variantions includes 'intrachromosomal amplicon to amplicon', 'intrachromosomal amplicon to non-amplified dna', 'intrachromosomal deletion', 'intrachromosomal fold-back inversion', 'intrachromosomal inversion', 'intrachromosomal tandem duplication', 'Intrachromosomal unknown type', 'intrachromosomal with inverted orientation', 'intrachromosomal with non-inverted orientation'. |
 |
| Sample | Symbol_a | Chr_a | Start_a | End_a | Symbol_b | Chr_b | Start_b | End_b |
| pancreas | GPCPD1 | chr20 | 5528206 | 5528226 | GPCPD1 | chr20 | 5540186 | 5540206 |
| cf) Tissue number; Tissue name (1;Breast, 2;Central_nervous_system, 3;Haematopoietic_and_lymphoid_tissue, 4;Large_intestine, 5;Liver, 6;Lung, 7;Ovary, 8;Pancreas, 9;Prostate, 10;Skin, 11;Soft_tissue, 12;Upper_aerodigestive_tract) |
| * From mRNA Sanger sequences, Chitars2.0 arranged chimeric transcripts. This table shows GPCPD1 related fusion information. |
| ID | Head Gene | Tail Gene | Accession | Gene_a | qStart_a | qEnd_a | Chromosome_a | tStart_a | tEnd_a | Gene_a | qStart_a | qEnd_a | Chromosome_a | tStart_a | tEnd_a |
| BE763222 | FSTL1 | 1 | 150 | 3 | 120113901 | 120114050 | GPCPD1 | 138 | 189 | 20 | 5542846 | 5542897 | |
| AW813838 | SYTL4 | 106 | 497 | X | 99971689 | 99972080 | GPCPD1 | 489 | 674 | 20 | 5568688 | 5568875 | |
| AW889516 | GPCPD1 | 13 | 224 | 20 | 5542846 | 5543057 | FSTL1 | 212 | 394 | 3 | 120113901 | 120114083 | |
| Top |
| Mutation type/ Tissue ID | brca | cns | cerv | endome | haematopo | kidn | Lintest | liver | lung | ns | ovary | pancre | prost | skin | stoma | thyro | urina | |||
| Total # sample | 1 | 1 | 1 | |||||||||||||||||
| GAIN (# sample) | 1 | 1 | 1 | |||||||||||||||||
| LOSS (# sample) |
| cf) Tissue ID; Tissue type (1; Breast, 2; Central_nervous_system, 3; Cervix, 4; Endometrium, 5; Haematopoietic_and_lymphoid_tissue, 6; Kidney, 7; Large_intestine, 8; Liver, 9; Lung, 10; NS, 11; Ovary, 12; Pancreas, 13; Prostate, 14; Skin, 15; Stomach, 16; Thyroid, 17; Urinary_tract) |
| Top |
|
 |
| Top |
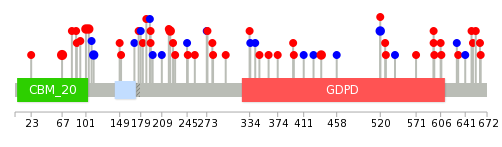
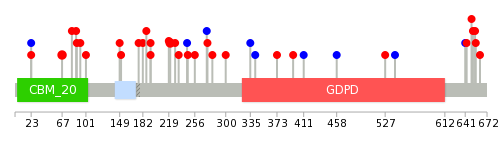
| Stat. for Non-Synonymous SNVs (# total SNVs=41) | (# total SNVs=15) |
 |  |
(# total SNVs=0) | (# total SNVs=0) |
| Top |
| * When you move the cursor on each content, you can see more deailed mutation information on the Tooltip. Those are primary_site,primary_histology,mutation(aa),pubmedID. |
| GRCh37 position | Mutation(aa) | Unique sampleID count |
| chr20:5574004-5574004 | p.R67H | 3 |
| chr20:5559069-5559069 | p.T221M | 2 |
| chr20:5556455-5556455 | p.? | 2 |
| chr20:5564940-5564940 | p.Q112Q | 2 |
| chr20:5539438-5539438 | p.P520P | 2 |
| chr20:5559154-5559154 | p.D193Y | 2 |
| chr20:5564963-5564963 | p.E105K | 2 |
| chr20:5566845-5566845 | p.P101L | 2 |
| chr20:5545686-5545686 | p.Q436E | 2 |
| chr20:5566888-5566888 | p.V87F | 1 |
| Top |
|
 |
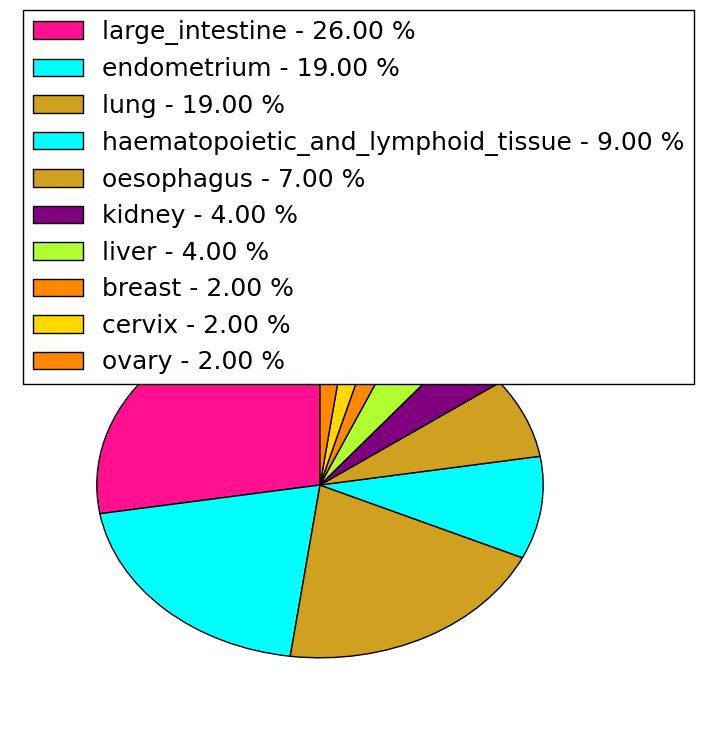
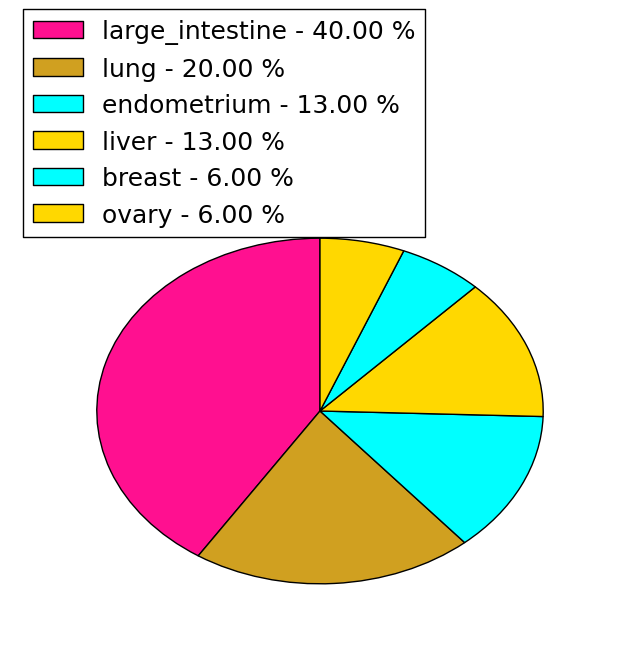
| Point Mutation/ Tissue ID | 1 | 2 | 3 | 4 | 5 | 6 | 7 | 8 | 9 | 10 | 11 | 12 | 13 | 14 | 15 | 16 | 17 | 18 | 19 | 20 |
| # sample | 1 | 1 | 1 | 7 | 1 | 2 | 8 | 1 | 1 | 5 | 6 | 8 | ||||||||
| # mutation | 1 | 1 | 1 | 7 | 1 | 2 | 8 | 1 | 1 | 5 | 6 | 9 | ||||||||
| nonsynonymous SNV | 1 | 1 | 5 | 1 | 2 | 7 | 1 | 5 | 4 | 7 | ||||||||||
| synonymous SNV | 1 | 2 | 1 | 1 | 2 | 2 |
| cf) Tissue ID; Tissue type (1; BLCA[Bladder Urothelial Carcinoma], 2; BRCA[Breast invasive carcinoma], 3; CESC[Cervical squamous cell carcinoma and endocervical adenocarcinoma], 4; COAD[Colon adenocarcinoma], 5; GBM[Glioblastoma multiforme], 6; Glioma Low Grade, 7; HNSC[Head and Neck squamous cell carcinoma], 8; KICH[Kidney Chromophobe], 9; KIRC[Kidney renal clear cell carcinoma], 10; KIRP[Kidney renal papillary cell carcinoma], 11; LAML[Acute Myeloid Leukemia], 12; LUAD[Lung adenocarcinoma], 13; LUSC[Lung squamous cell carcinoma], 14; OV[Ovarian serous cystadenocarcinoma ], 15; PAAD[Pancreatic adenocarcinoma], 16; PRAD[Prostate adenocarcinoma], 17; SKCM[Skin Cutaneous Melanoma], 18:STAD[Stomach adenocarcinoma], 19:THCA[Thyroid carcinoma], 20:UCEC[Uterine Corpus Endometrial Carcinoma]) |
| Top |
| * We represented just top 10 SNVs. When you move the cursor on each content, you can see more deailed mutation information on the Tooltip. Those are primary_site, primary_histology, mutation(aa), pubmedID. |
| Genomic Position | Mutation(aa) | Unique sampleID count |
| chr20:5559069 | p.R67H | 2 |
| chr20:5559154 | p.T221M | 2 |
| chr20:5574004 | p.D193Y | 2 |
| chr20:5528362 | p.G655V | 1 |
| chr20:5566885 | p.T273T | 1 |
| chr20:5554591 | p.H88Y | 1 |
| chr20:5528371 | p.S652F | 1 |
| chr20:5566888 | p.C256Y | 1 |
| chr20:5554612 | p.V87F | 1 |
| chr20:5559074 | p.P650T | 1 |
| * Copy number data were extracted from TCGA using R package TCGA-Assembler. The URLs of all public data files on TCGA DCC data server were gathered on Jan-05-2015. Function ProcessCNAData in TCGA-Assembler package was used to obtain gene-level copy number value which is calculated as the average copy number of the genomic region of a gene. |
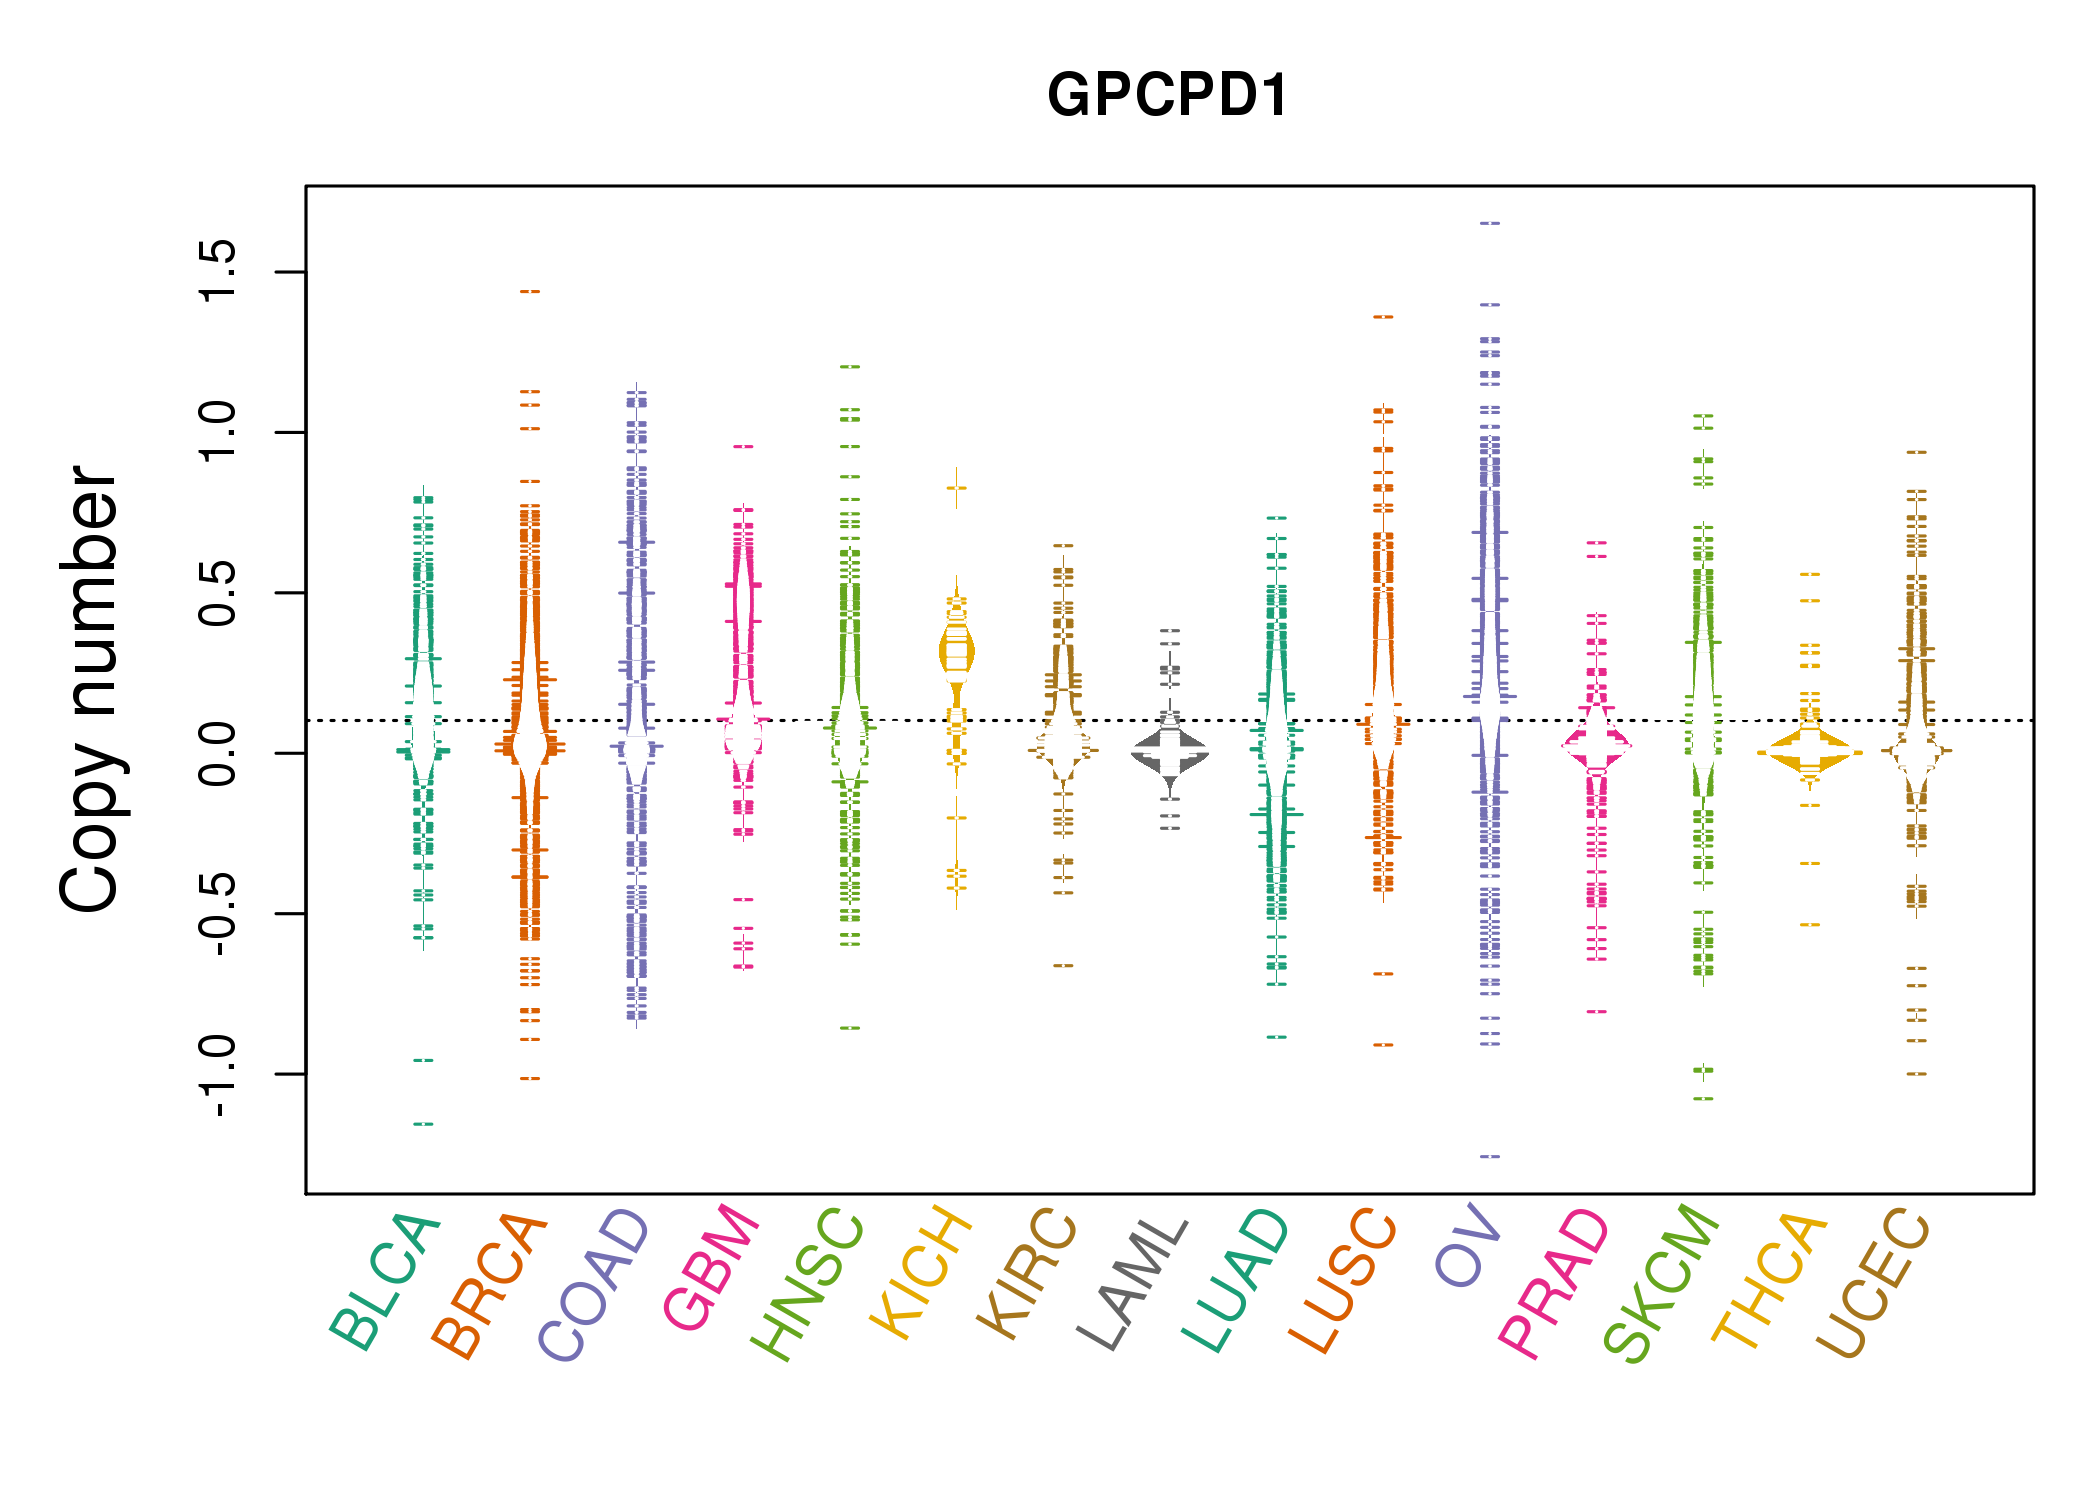 |
| cf) Tissue ID[Tissue type]: BLCA[Bladder Urothelial Carcinoma], BRCA[Breast invasive carcinoma], CESC[Cervical squamous cell carcinoma and endocervical adenocarcinoma], COAD[Colon adenocarcinoma], GBM[Glioblastoma multiforme], Glioma Low Grade, HNSC[Head and Neck squamous cell carcinoma], KICH[Kidney Chromophobe], KIRC[Kidney renal clear cell carcinoma], KIRP[Kidney renal papillary cell carcinoma], LAML[Acute Myeloid Leukemia], LUAD[Lung adenocarcinoma], LUSC[Lung squamous cell carcinoma], OV[Ovarian serous cystadenocarcinoma ], PAAD[Pancreatic adenocarcinoma], PRAD[Prostate adenocarcinoma], SKCM[Skin Cutaneous Melanoma], STAD[Stomach adenocarcinoma], THCA[Thyroid carcinoma], UCEC[Uterine Corpus Endometrial Carcinoma] |
| Top |
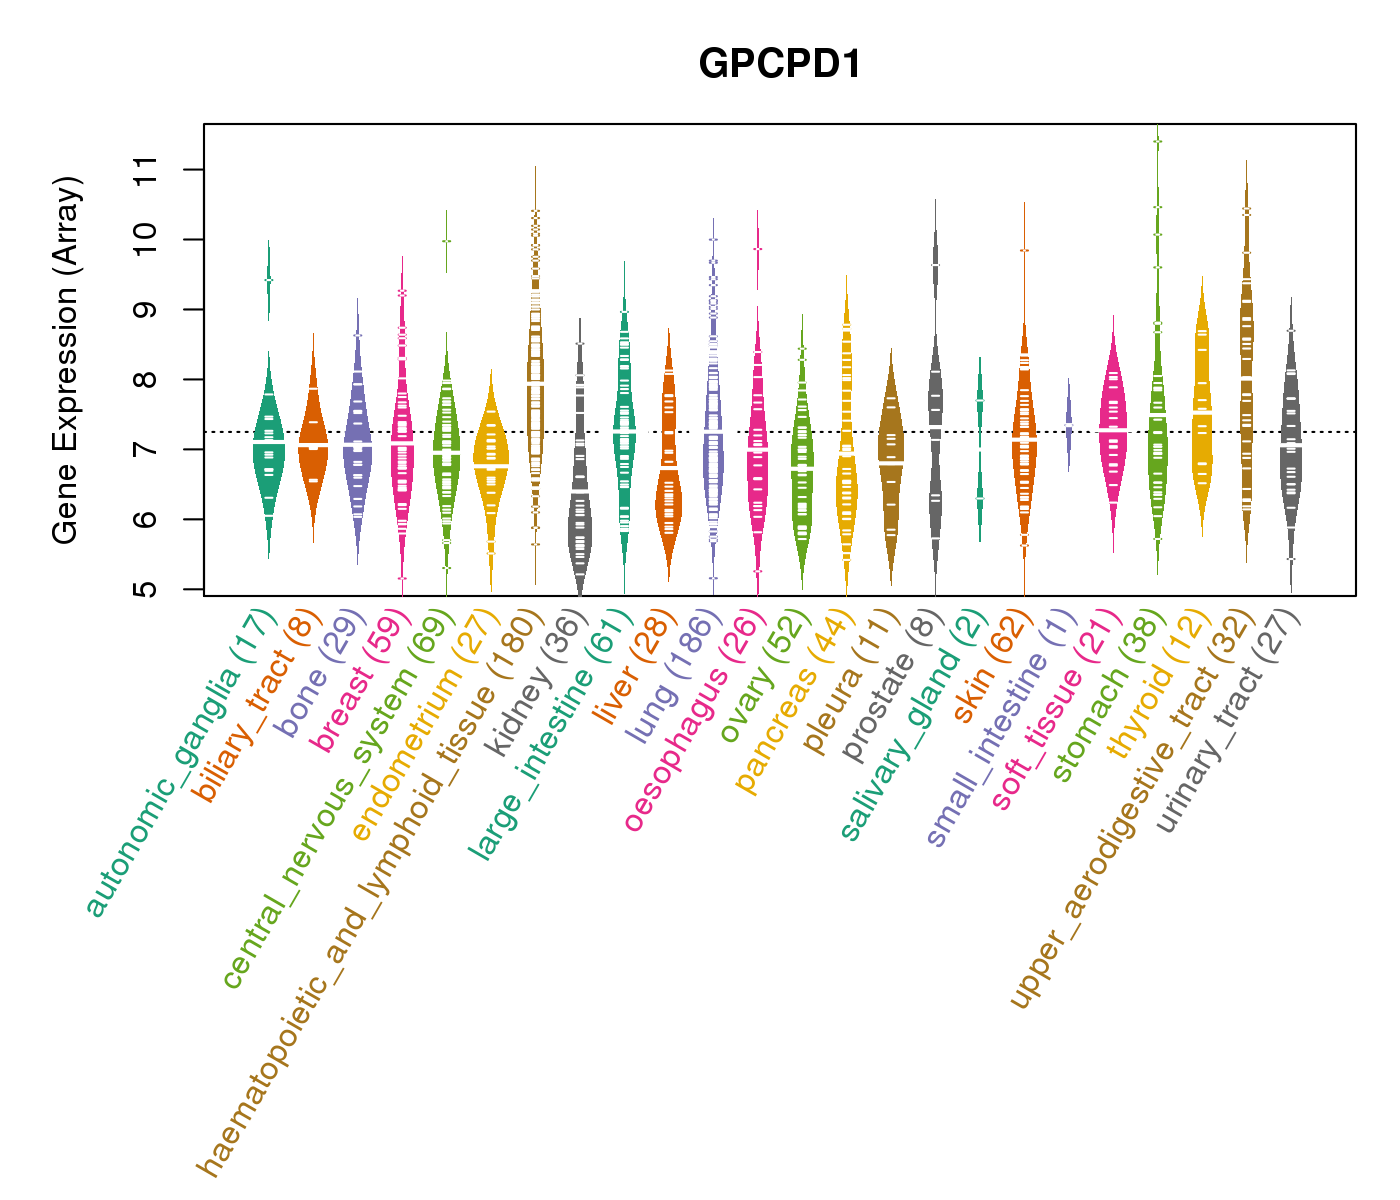
| Gene Expression for GPCPD1 |
| * CCLE gene expression data were extracted from CCLE_Expression_Entrez_2012-10-18.res: Gene-centric RMA-normalized mRNA expression data. |
 |
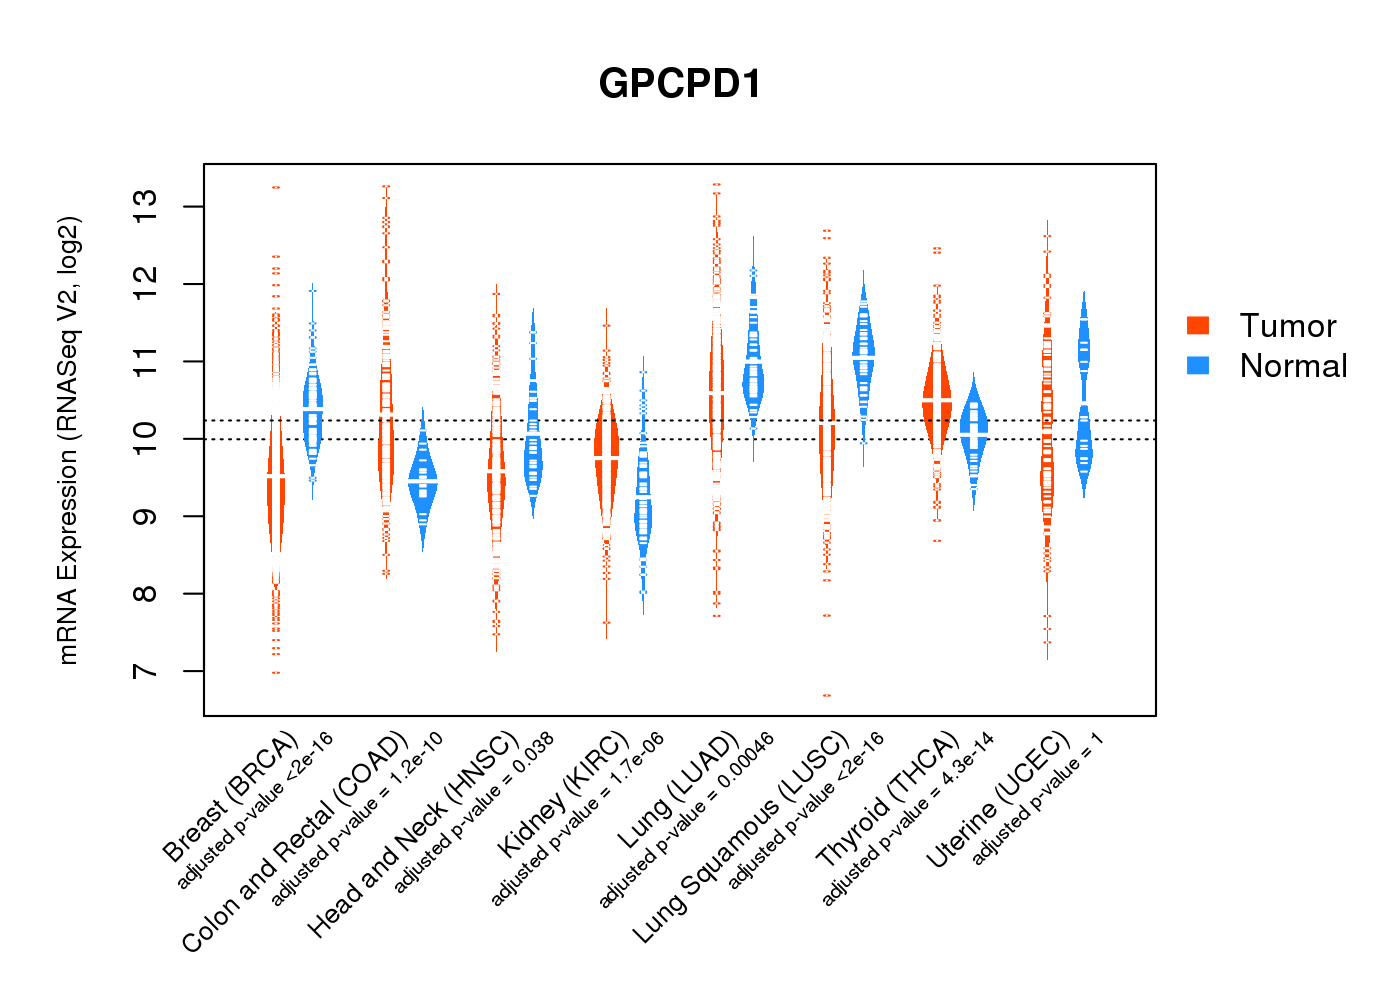
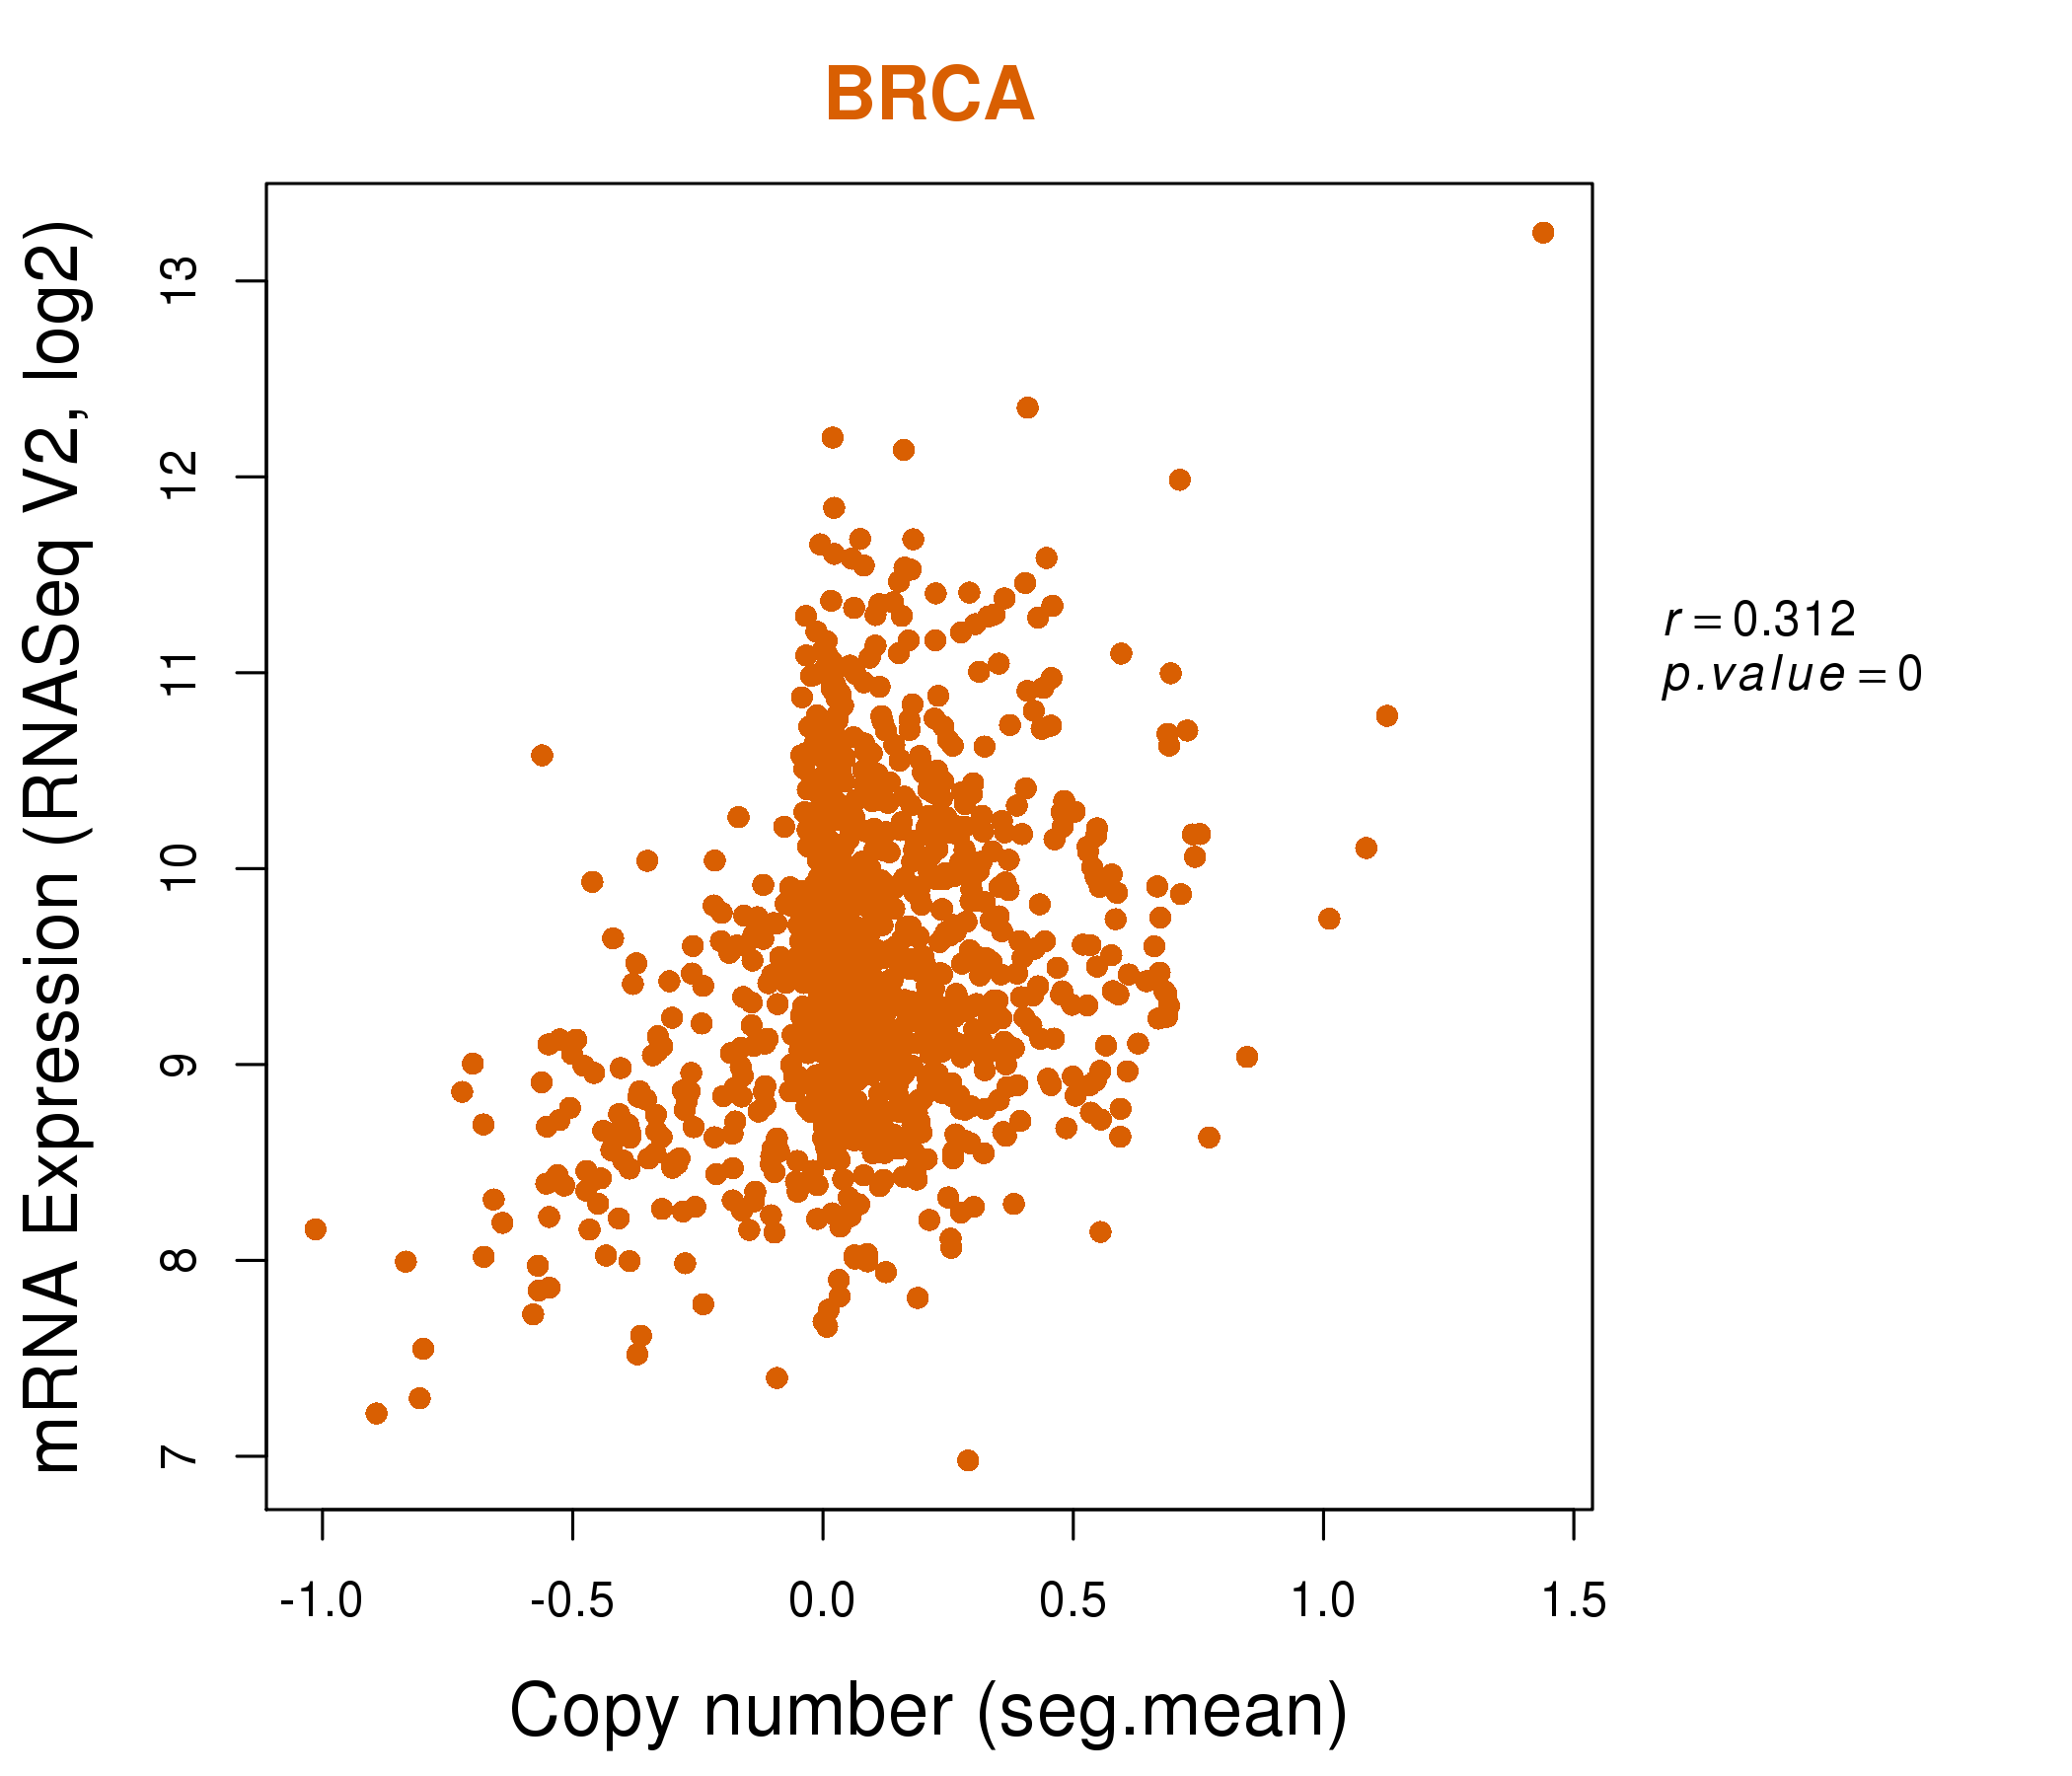
| * Normalized gene expression data of RNASeqV2 was extracted from TCGA using R package TCGA-Assembler. The URLs of all public data files on TCGA DCC data server were gathered at Jan-05-2015. Only eight cancer types have enough normal control samples for differential expression analysis. (t test, adjusted p<0.05 (using Benjamini-Hochberg FDR)) |
 |
| Top |
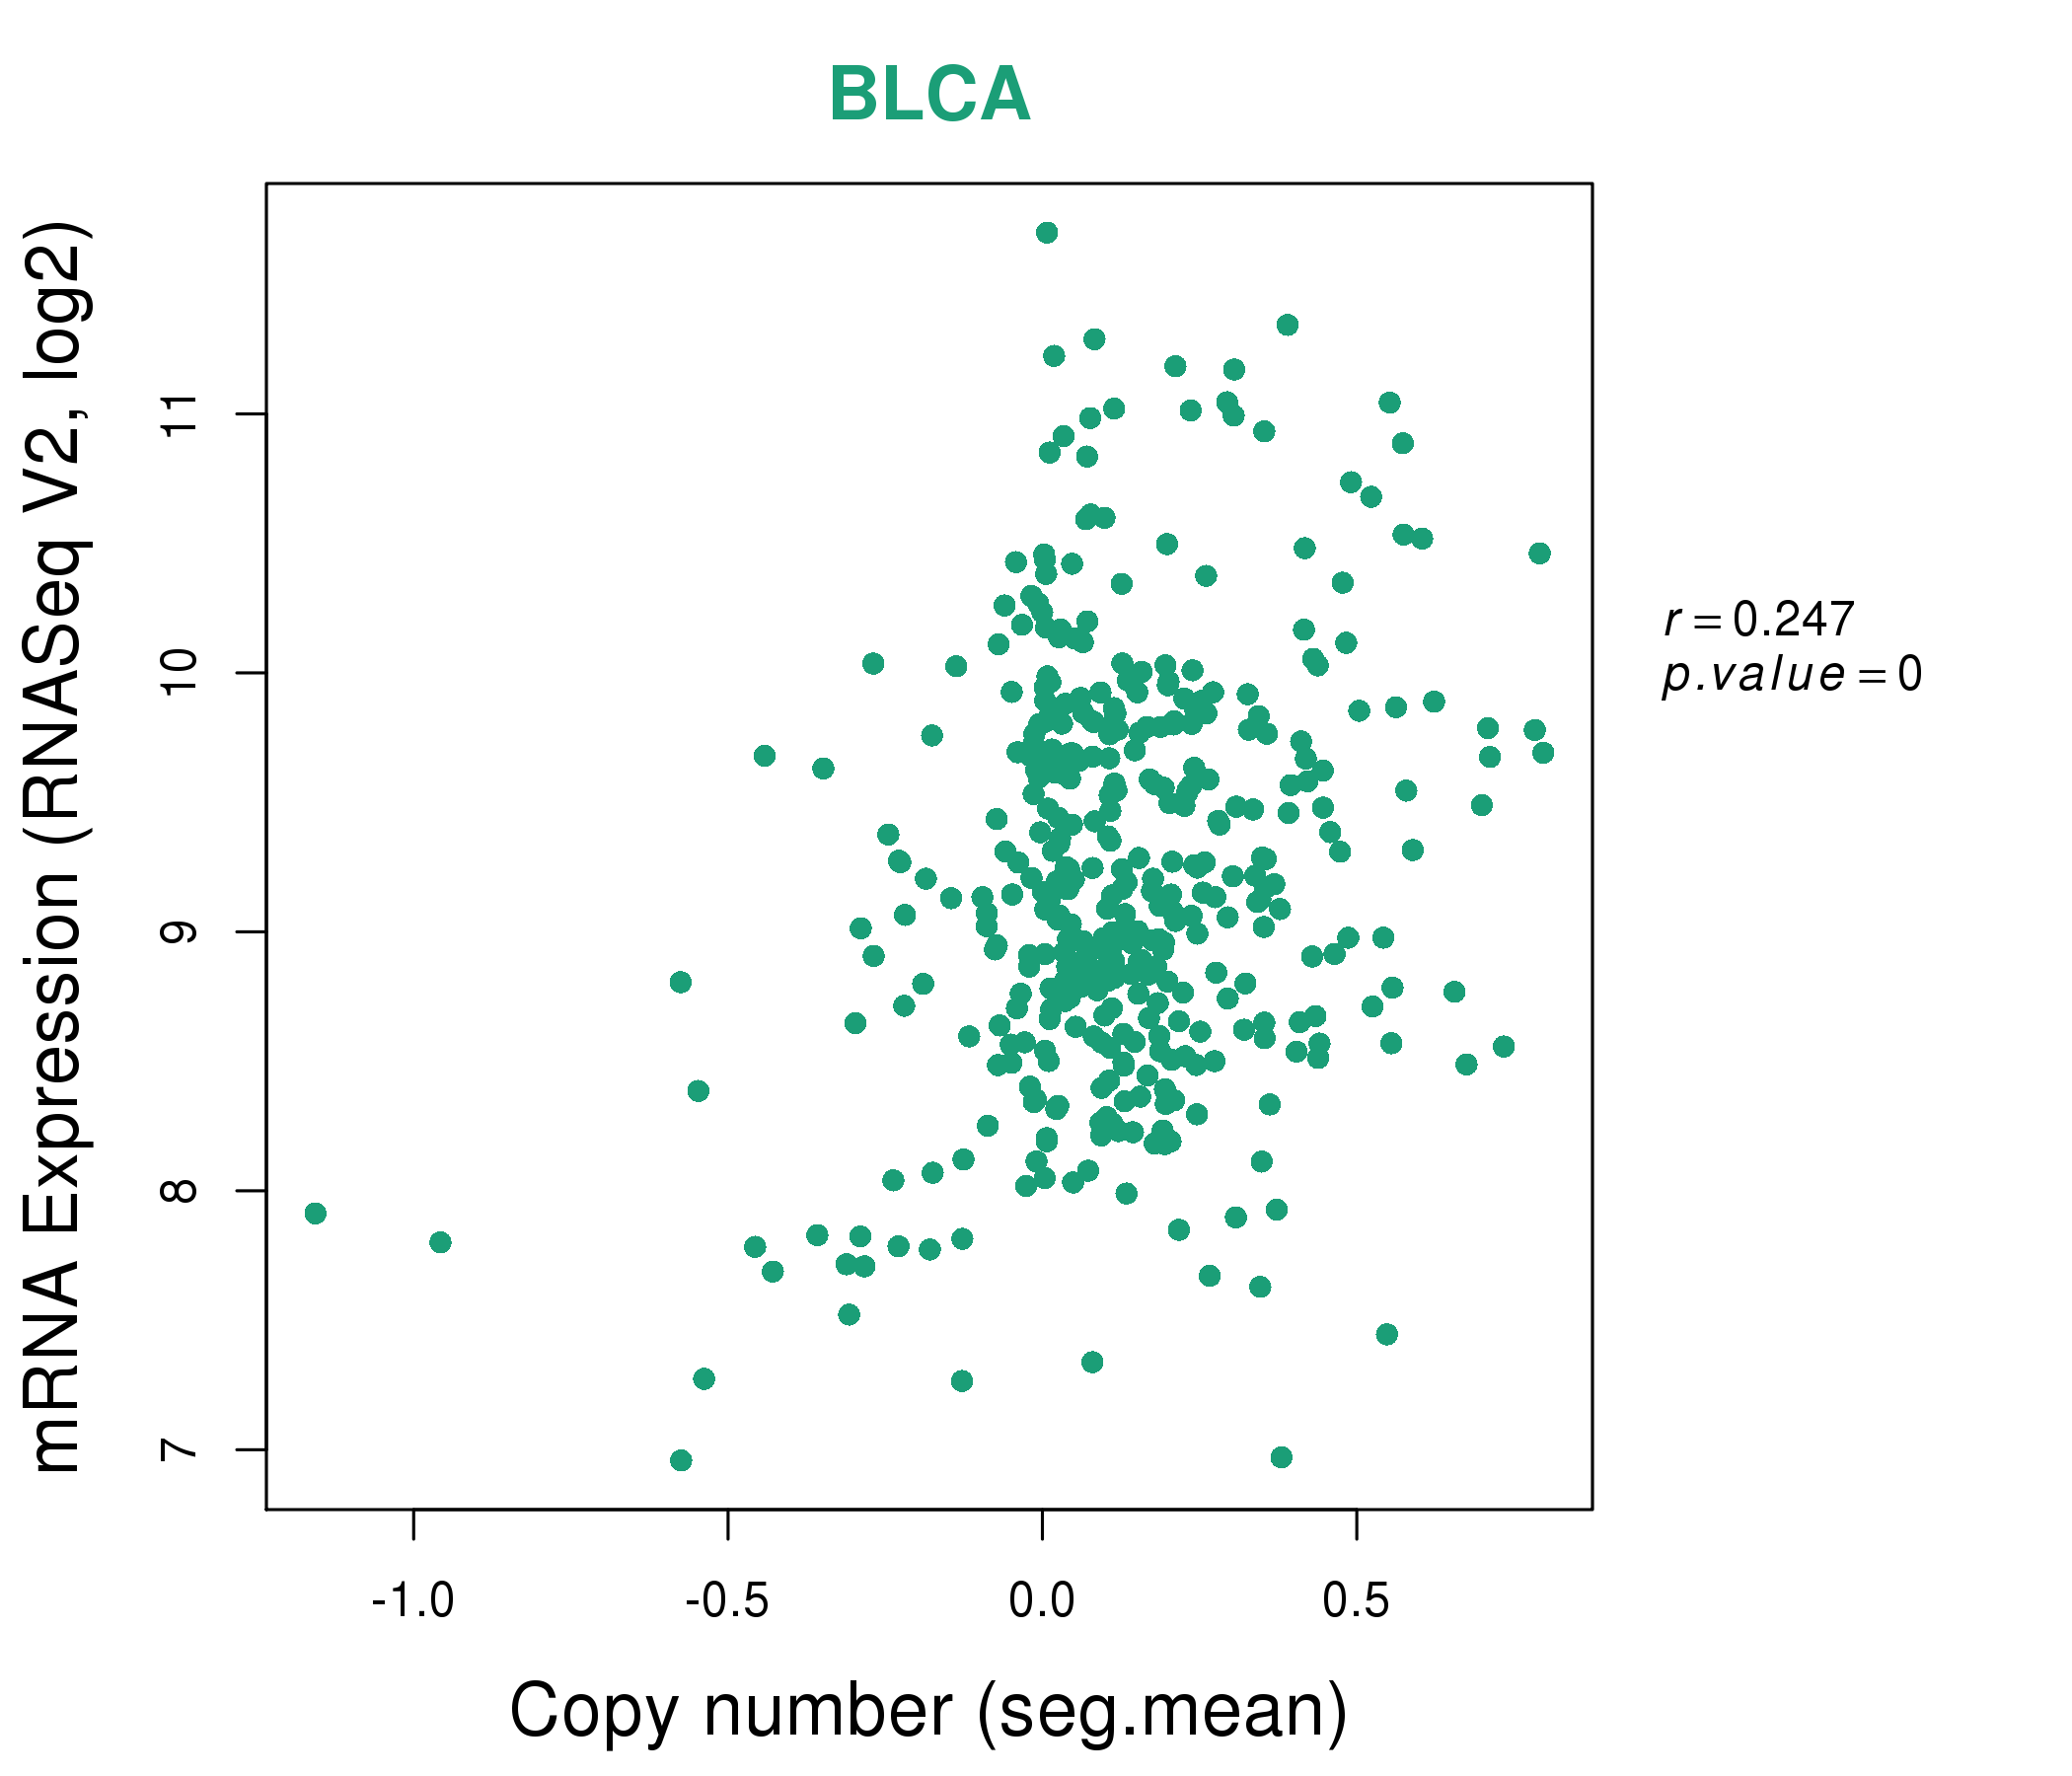
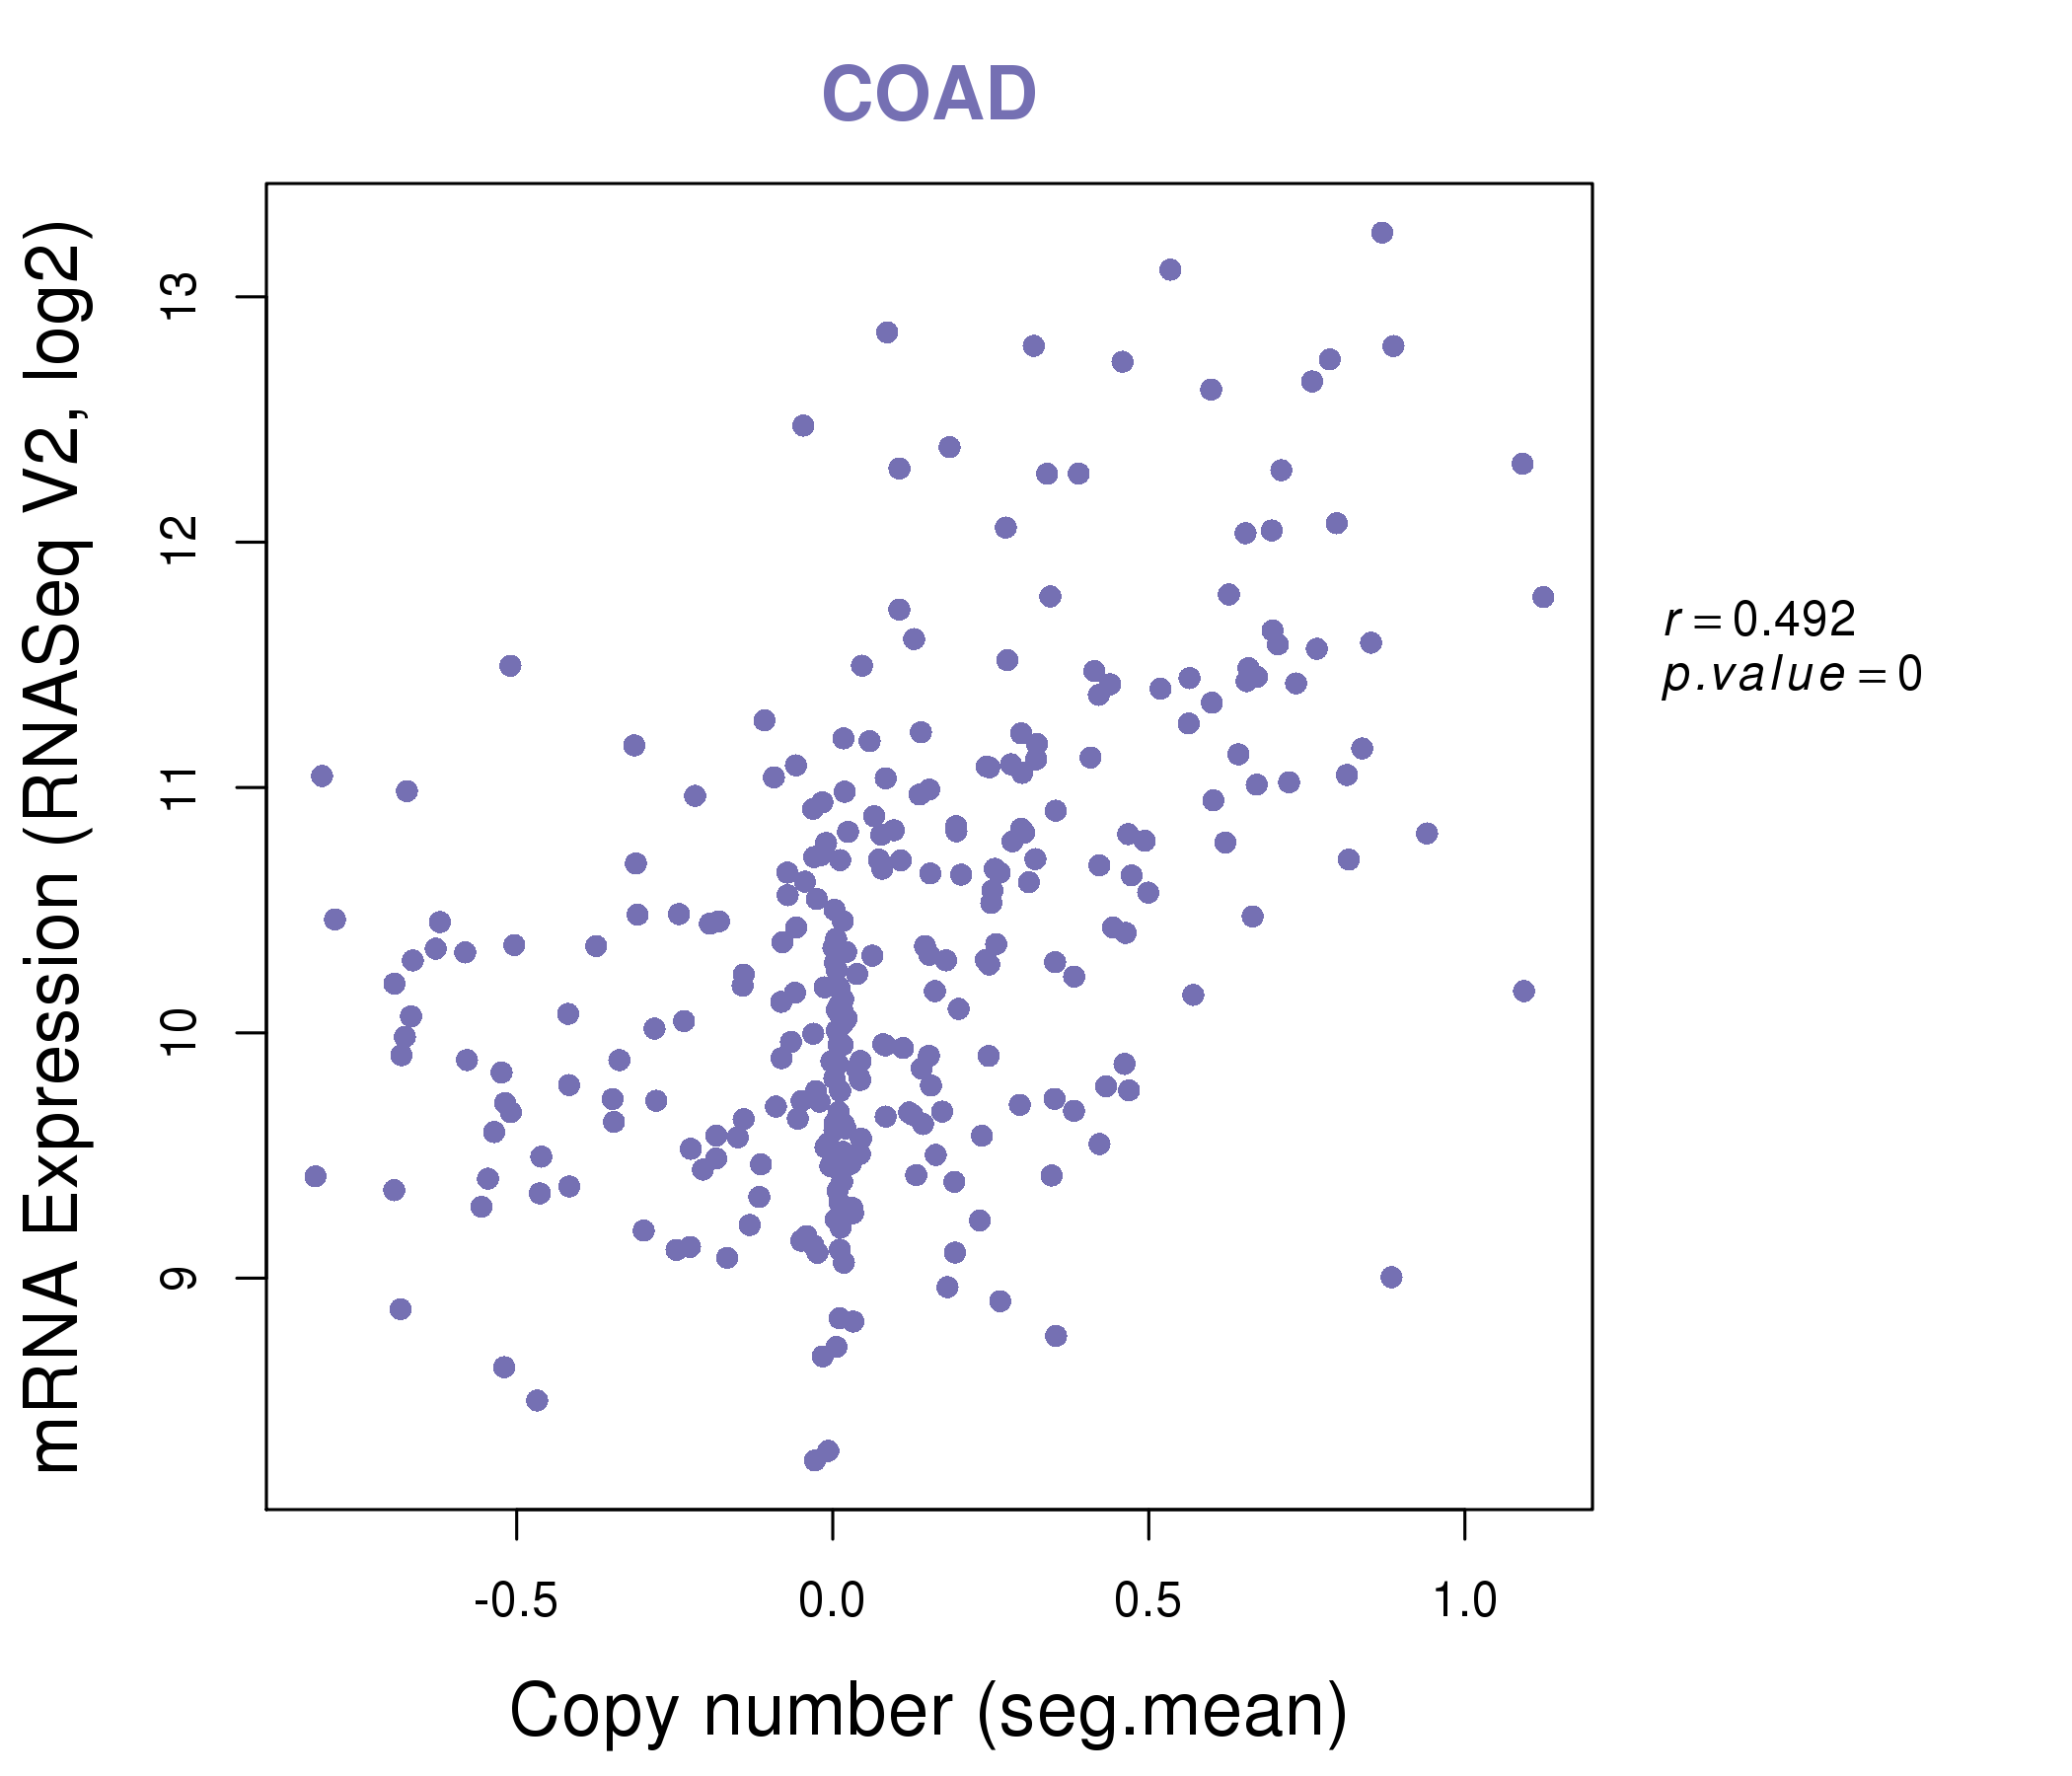
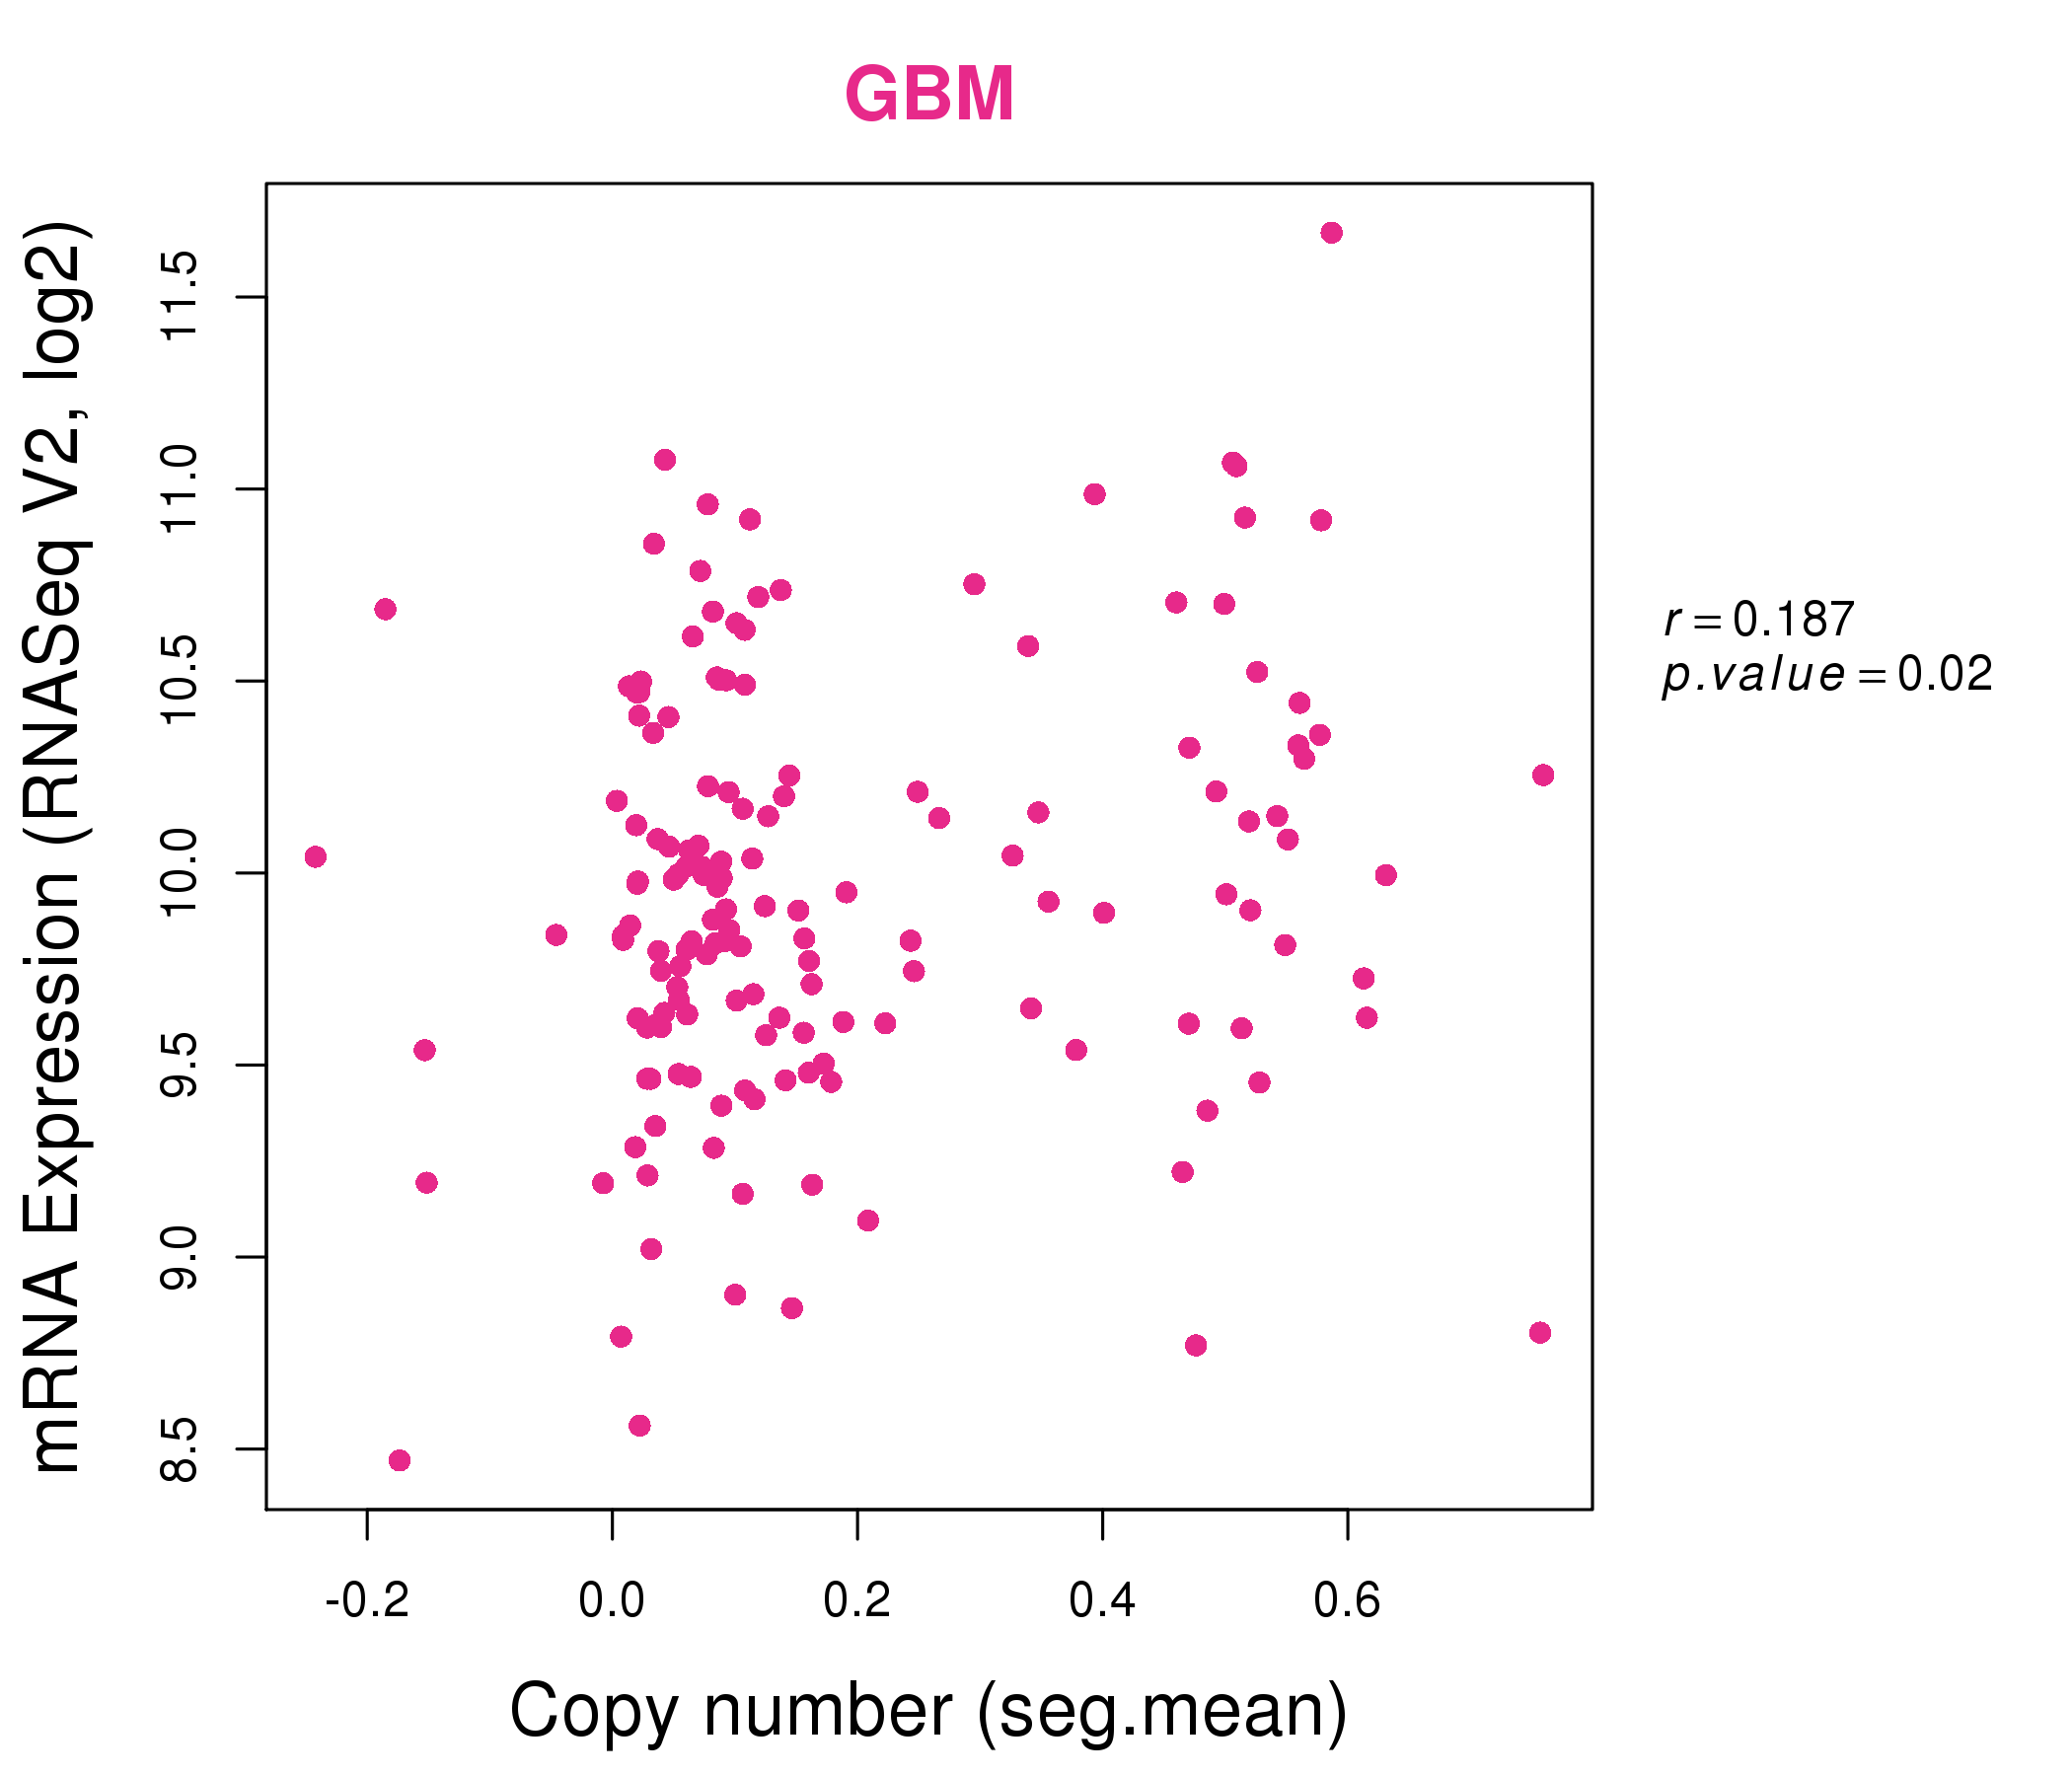
| * This plots show the correlation between CNV and gene expression. |
: Open all plots for all cancer types
 |
|
 |
|
| Top |
| Gene-Gene Network Information |
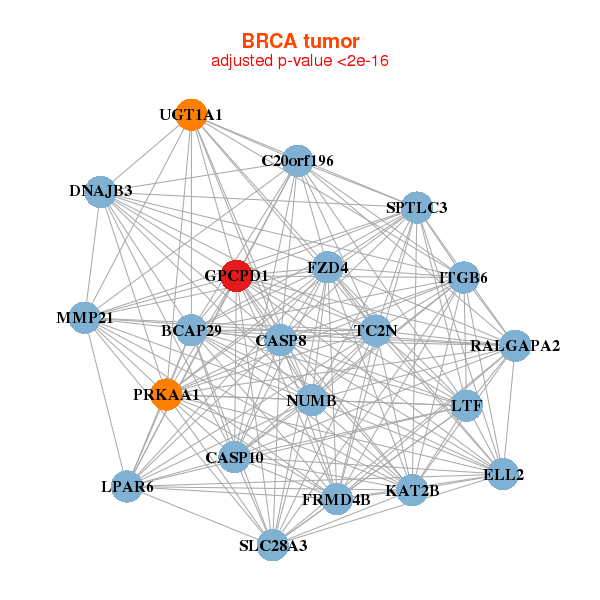
| * Co-Expression network figures were drawn using R package igraph. Only the top 20 genes with the highest correlations were shown. Red circle: input gene, orange circle: cell metabolism gene, sky circle: other gene |
: Open all plots for all cancer types
 |
|
| BCAP29,C20orf196,CASP10,CASP8,DNAJB3,ELL2,FRMD4B, FZD4,GPCPD1,ITGB6,KAT2B,LPAR6,LTF,MMP21, NUMB,PRKAA1,RALGAPA2,SLC28A3,SPTLC3,TC2N,UGT1A1 | ATL2,CCDC14,CDK6,CHST9,DSC2,EML4,EPHA7, GPCPD1,ITPR2,LOC284578,LOC286467,MBTD1,PMS1,SLCO1A2, SNHG4,STX16,TAF4B,TET2,ZNF121,ZNF518A,ZNF562 |
 |
|
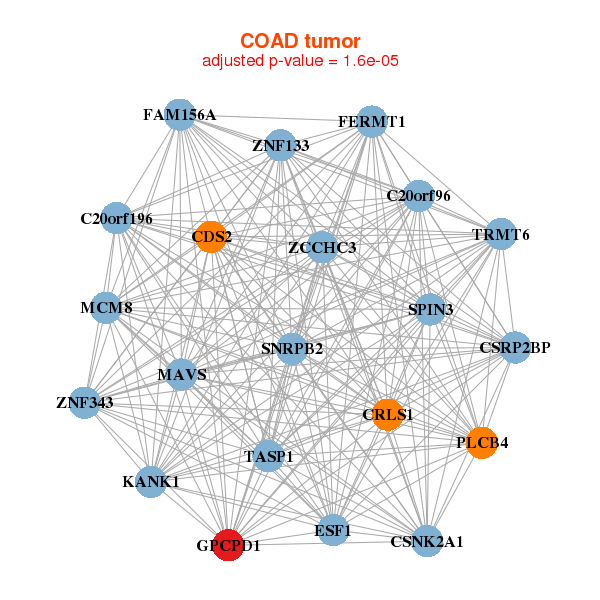
| C20orf196,C20orf96,CDS2,CRLS1,CSNK2A1,CSRP2BP,ESF1, FAM156A,FERMT1,GPCPD1,KANK1,MAVS,MCM8,PLCB4, SNRPB2,SPIN3,TASP1,TRMT6,ZCCHC3,ZNF133,ZNF343 | ALOXE3,B4GALT6,VCPKMT,CACNB2,CDK17,E2F6,GJA1, GPCPD1,HNRNPDL,MAP3K14,NAA16,PHF20L1,PRR3,REV1, RPS6KB1,RUFY2,SENP2,U2SURP,UPF3A,ZMYM5,ZBTB18 |
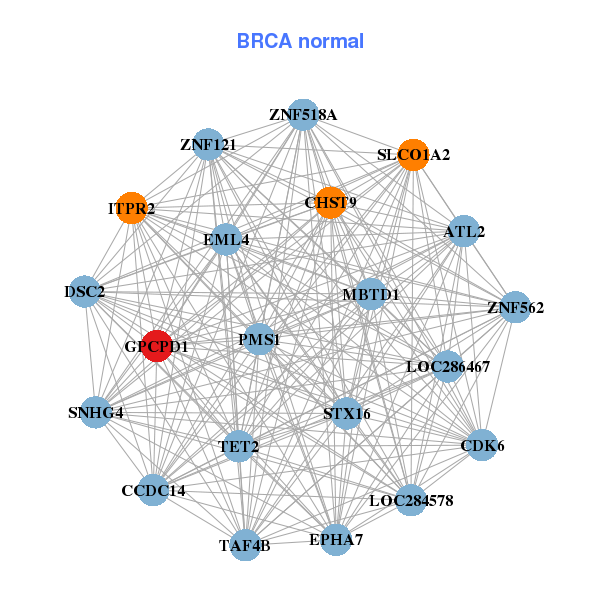
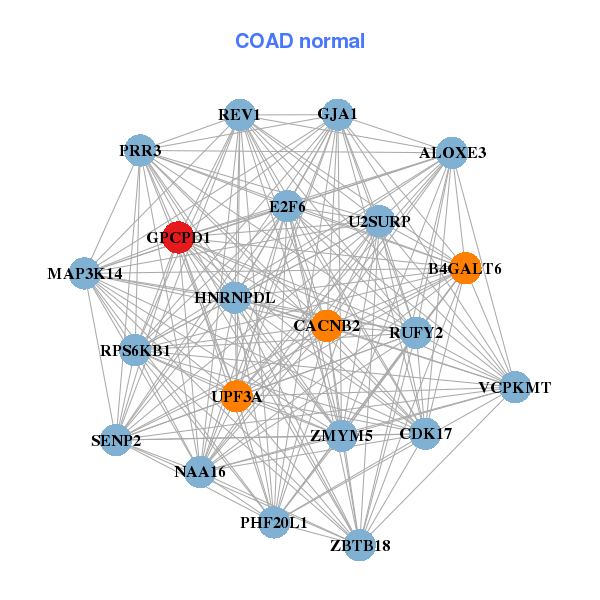
| * Co-Expression network figures were drawn using R package igraph. Only the top 20 genes with the highest correlations were shown. Red circle: input gene, orange circle: cell metabolism gene, sky circle: other gene |
: Open all plots for all cancer types
| Top |
: Open all interacting genes' information including KEGG pathway for all interacting genes from DAVID
| Top |
| Pharmacological Information for GPCPD1 |
| There's no related Drug. |
| Top |
| Cross referenced IDs for GPCPD1 |
| * We obtained these cross-references from Uniprot database. It covers 150 different DBs, 18 categories. http://www.uniprot.org/help/cross_references_section |
: Open all cross reference information
|
Copyright © 2016-Present - The Univsersity of Texas Health Science Center at Houston @ |