|
||||||||||||||||||||
| |
| Phenotypic Information (metabolism pathway, cancer, disease, phenome) |
| |
| |
| Gene-Gene Network Information: Co-Expression Network, Interacting Genes & KEGG |
| |
|


| Gene Summary for CCBL2 |
| Basic gene info. | Gene symbol | CCBL2 |
| Gene name | cysteine conjugate-beta lyase 2 | |
| Synonyms | KAT3|KATIII | |
| Cytomap | UCSC genome browser: 1p22.2 | |
| Genomic location | chr1 :89401455-89458643 | |
| Type of gene | protein-coding | |
| RefGenes | NM_001008661.2, NM_001008662.2, | |
| Ensembl id | ENSG00000137944 | |
| Description | RP11-82K18.3cysteine-S-conjugate beta-lyase 2kynurenine aminotransferase IIIkynurenine--glyoxylate transaminasekynurenine--oxoglutarate transaminase 3kynurenine--oxoglutarate transaminase IIIkynurenine-oxoglutarate transaminase 3 | |
| Modification date | 20141207 | |
| dbXrefs | MIM : 610656 | |
| HGNC : HGNC | ||
| Ensembl : ENSG00000137944 | ||
| HPRD : 13752 | ||
| Vega : OTTHUMG00000010617 | ||
| Protein | UniProt: go to UniProt's Cross Reference DB Table | |
| Expression | CleanEX: HS_CCBL2 | |
| BioGPS: 56267 | ||
| Gene Expression Atlas: ENSG00000137944 | ||
| The Human Protein Atlas: ENSG00000137944 | ||
| Pathway | NCI Pathway Interaction Database: CCBL2 | |
| KEGG: CCBL2 | ||
| REACTOME: CCBL2 | ||
| ConsensusPathDB | ||
| Pathway Commons: CCBL2 | ||
| Metabolism | MetaCyc: CCBL2 | |
| HUMANCyc: CCBL2 | ||
| Regulation | Ensembl's Regulation: ENSG00000137944 | |
| miRBase: chr1 :89,401,455-89,458,643 | ||
| TargetScan: NM_001008661 | ||
| cisRED: ENSG00000137944 | ||
| Context | iHOP: CCBL2 | |
| cancer metabolism search in PubMed: CCBL2 | ||
| UCL Cancer Institute: CCBL2 | ||
| Assigned class in ccmGDB | C | |
| Top |
| Phenotypic Information for CCBL2(metabolism pathway, cancer, disease, phenome) |
| Cancer | CGAP: CCBL2 |
| Familial Cancer Database: CCBL2 | |
| * This gene is included in those cancer gene databases. |
|
|
|
|
|
|
| ||||||||||||||
Oncogene 1 | Significant driver gene in | |||||||||||||||||||
| cf) number; DB name 1 Oncogene; http://nar.oxfordjournals.org/content/35/suppl_1/D721.long, 2 Tumor Suppressor gene; https://bioinfo.uth.edu/TSGene/, 3 Cancer Gene Census; http://www.nature.com/nrc/journal/v4/n3/abs/nrc1299.html, 4 CancerGenes; http://nar.oxfordjournals.org/content/35/suppl_1/D721.long, 5 Network of Cancer Gene; http://ncg.kcl.ac.uk/index.php, 1Therapeutic Vulnerabilities in Cancer; http://cbio.mskcc.org/cancergenomics/statius/ |
| REACTOME_METABOLISM_OF_AMINO_ACIDS_AND_DERIVATIVES | |
| OMIM | |
| Orphanet | |
| Disease | KEGG Disease: CCBL2 |
| MedGen: CCBL2 (Human Medical Genetics with Condition) | |
| ClinVar: CCBL2 | |
| Phenotype | MGI: CCBL2 (International Mouse Phenotyping Consortium) |
| PhenomicDB: CCBL2 | |
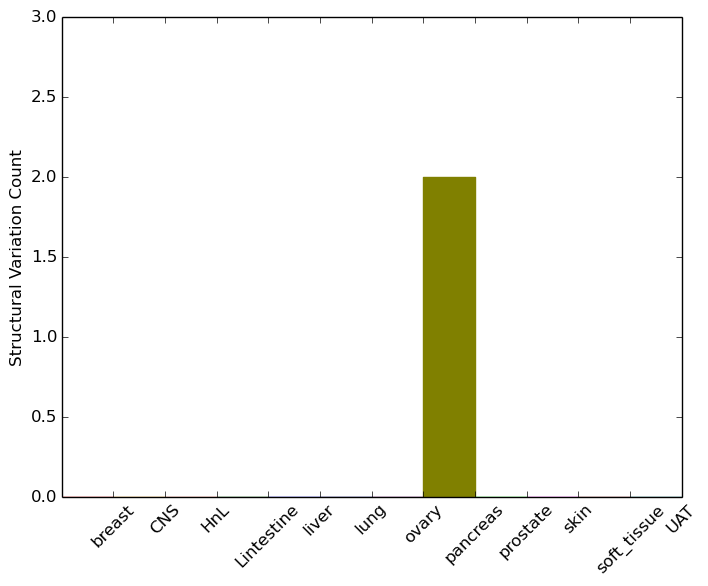
| Mutations for CCBL2 |
| * Under tables are showing count per each tissue to give us broad intuition about tissue specific mutation patterns.You can go to the detailed page for each mutation database's web site. |
| - Statistics for Tissue and Mutation type | Top |
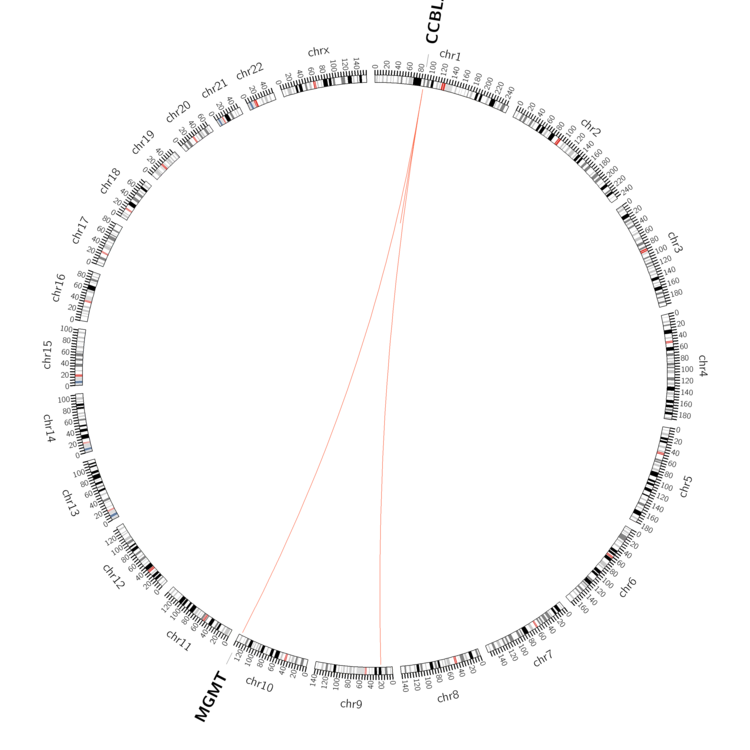 |
| - For Inter-chromosomal Variations |
| * Inter-chromosomal variantions includes 'interchromosomal amplicon to amplicon', 'interchromosomal amplicon to non-amplified dna', 'interchromosomal insertion', 'Interchromosomal unknown type'. |
 |
| - For Intra-chromosomal Variations |
| * Intra-chromosomal variantions includes 'intrachromosomal amplicon to amplicon', 'intrachromosomal amplicon to non-amplified dna', 'intrachromosomal deletion', 'intrachromosomal fold-back inversion', 'intrachromosomal inversion', 'intrachromosomal tandem duplication', 'Intrachromosomal unknown type', 'intrachromosomal with inverted orientation', 'intrachromosomal with non-inverted orientation'. |
 |
| Sample | Symbol_a | Chr_a | Start_a | End_a | Symbol_b | Chr_b | Start_b | End_b |
| ovary | CCBL2 | chr1 | 89453466 | 89453486 | CCBL2 | chr1 | 89447140 | 89447160 |
| pancreas | CCBL2 | chr1 | 89403457 | 89403477 | MGMT | chr10 | 131348988 | 131349008 |
| cf) Tissue number; Tissue name (1;Breast, 2;Central_nervous_system, 3;Haematopoietic_and_lymphoid_tissue, 4;Large_intestine, 5;Liver, 6;Lung, 7;Ovary, 8;Pancreas, 9;Prostate, 10;Skin, 11;Soft_tissue, 12;Upper_aerodigestive_tract) |
| * From mRNA Sanger sequences, Chitars2.0 arranged chimeric transcripts. This table shows CCBL2 related fusion information. |
| ID | Head Gene | Tail Gene | Accession | Gene_a | qStart_a | qEnd_a | Chromosome_a | tStart_a | tEnd_a | Gene_a | qStart_a | qEnd_a | Chromosome_a | tStart_a | tEnd_a |
| Top |
| There's no copy number variation information in COSMIC data for this gene. |
| Top |
|
 |
| Top |
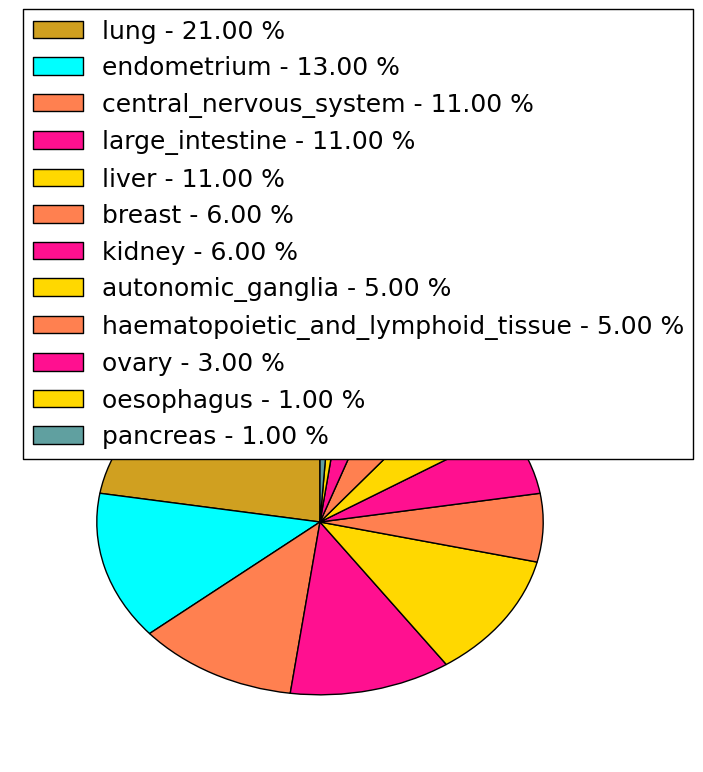
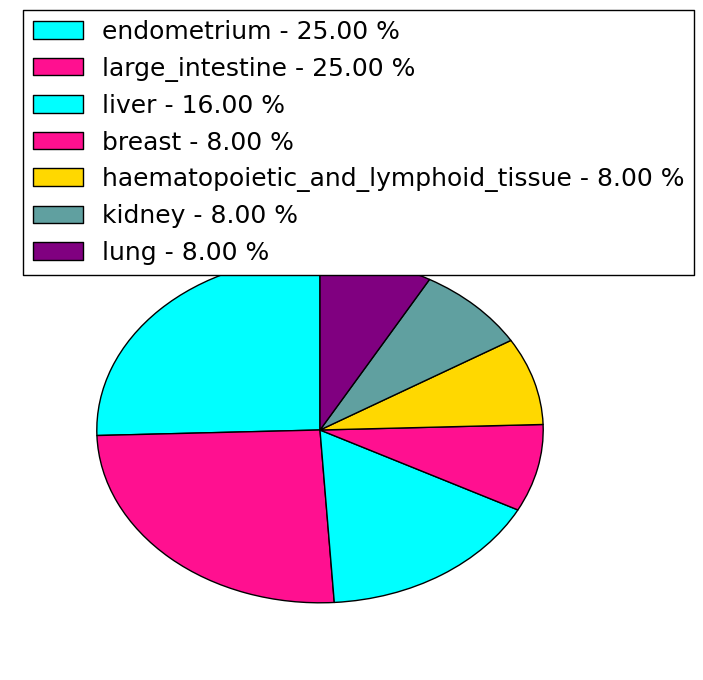
| Stat. for Non-Synonymous SNVs (# total SNVs=60) | (# total SNVs=12) |
 |  |
(# total SNVs=0) | (# total SNVs=0) |
| Top |
| * When you move the cursor on each content, you can see more deailed mutation information on the Tooltip. Those are primary_site,primary_histology,mutation(aa),pubmedID. |
| GRCh37 position | Mutation(aa) | Unique sampleID count |
| chr1:89449434-89449434 | p.T26A | 5 |
| chr1:89449298-89449298 | p.G71A | 4 |
| chr1:89449390-89449390 | p.I40M | 4 |
| chr1:89449278-89449278 | p.A78S | 3 |
| chr1:89449483-89449483 | p.K9N | 3 |
| chr1:89448812-89448812 | p.D233A | 3 |
| chr1:89448560-89448560 | p.R317H | 2 |
| chr1:89449117-89449117 | p.D131D | 2 |
| chr1:89448597-89448597 | p.G305C | 2 |
| chr1:89449135-89449135 | p.R125R | 2 |
| Top |
|
 |
| Point Mutation/ Tissue ID | 1 | 2 | 3 | 4 | 5 | 6 | 7 | 8 | 9 | 10 | 11 | 12 | 13 | 14 | 15 | 16 | 17 | 18 | 19 | 20 |
| # sample | 2 | 2 | 1 | 9 | 4 | 3 | 4 | 2 | 5 | 7 | ||||||||||
| # mutation | 2 | 2 | 1 | 9 | 4 | 3 | 4 | 2 | 5 | 8 | ||||||||||
| nonsynonymous SNV | 2 | 2 | 1 | 8 | 3 | 3 | 2 | 2 | 3 | 8 | ||||||||||
| synonymous SNV | 1 | 1 | 2 | 2 |
| cf) Tissue ID; Tissue type (1; BLCA[Bladder Urothelial Carcinoma], 2; BRCA[Breast invasive carcinoma], 3; CESC[Cervical squamous cell carcinoma and endocervical adenocarcinoma], 4; COAD[Colon adenocarcinoma], 5; GBM[Glioblastoma multiforme], 6; Glioma Low Grade, 7; HNSC[Head and Neck squamous cell carcinoma], 8; KICH[Kidney Chromophobe], 9; KIRC[Kidney renal clear cell carcinoma], 10; KIRP[Kidney renal papillary cell carcinoma], 11; LAML[Acute Myeloid Leukemia], 12; LUAD[Lung adenocarcinoma], 13; LUSC[Lung squamous cell carcinoma], 14; OV[Ovarian serous cystadenocarcinoma ], 15; PAAD[Pancreatic adenocarcinoma], 16; PRAD[Prostate adenocarcinoma], 17; SKCM[Skin Cutaneous Melanoma], 18:STAD[Stomach adenocarcinoma], 19:THCA[Thyroid carcinoma], 20:UCEC[Uterine Corpus Endometrial Carcinoma]) |
| Top |
| * We represented just top 10 SNVs. When you move the cursor on each content, you can see more deailed mutation information on the Tooltip. Those are primary_site, primary_histology, mutation(aa), pubmedID. |
| Genomic Position | Mutation(aa) | Unique sampleID count |
| chr1:89408756 | p.V378I,CCBL2 | 3 |
| chr1:89414893 | p.S307Y,CCBL2 | 2 |
| chr1:89418830 | p.E324K,CCBL2 | 1 |
| chr1:89430535 | p.K147Q,CCBL2 | 1 |
| chr1:89414823 | p.R321C,CCBL2 | 1 |
| chr1:89420882 | p.A137V,CCBL2 | 1 |
| chr1:89430565 | p.R318W,CCBL2 | 1 |
| chr1:89414843 | p.I119T,CCBL2 | 1 |
| chr1:89426867 | p.R316S,CCBL2 | 1 |
| chr1:89430571 | p.E114D,CCBL2 | 1 |
| * Copy number data were extracted from TCGA using R package TCGA-Assembler. The URLs of all public data files on TCGA DCC data server were gathered on Jan-05-2015. Function ProcessCNAData in TCGA-Assembler package was used to obtain gene-level copy number value which is calculated as the average copy number of the genomic region of a gene. |
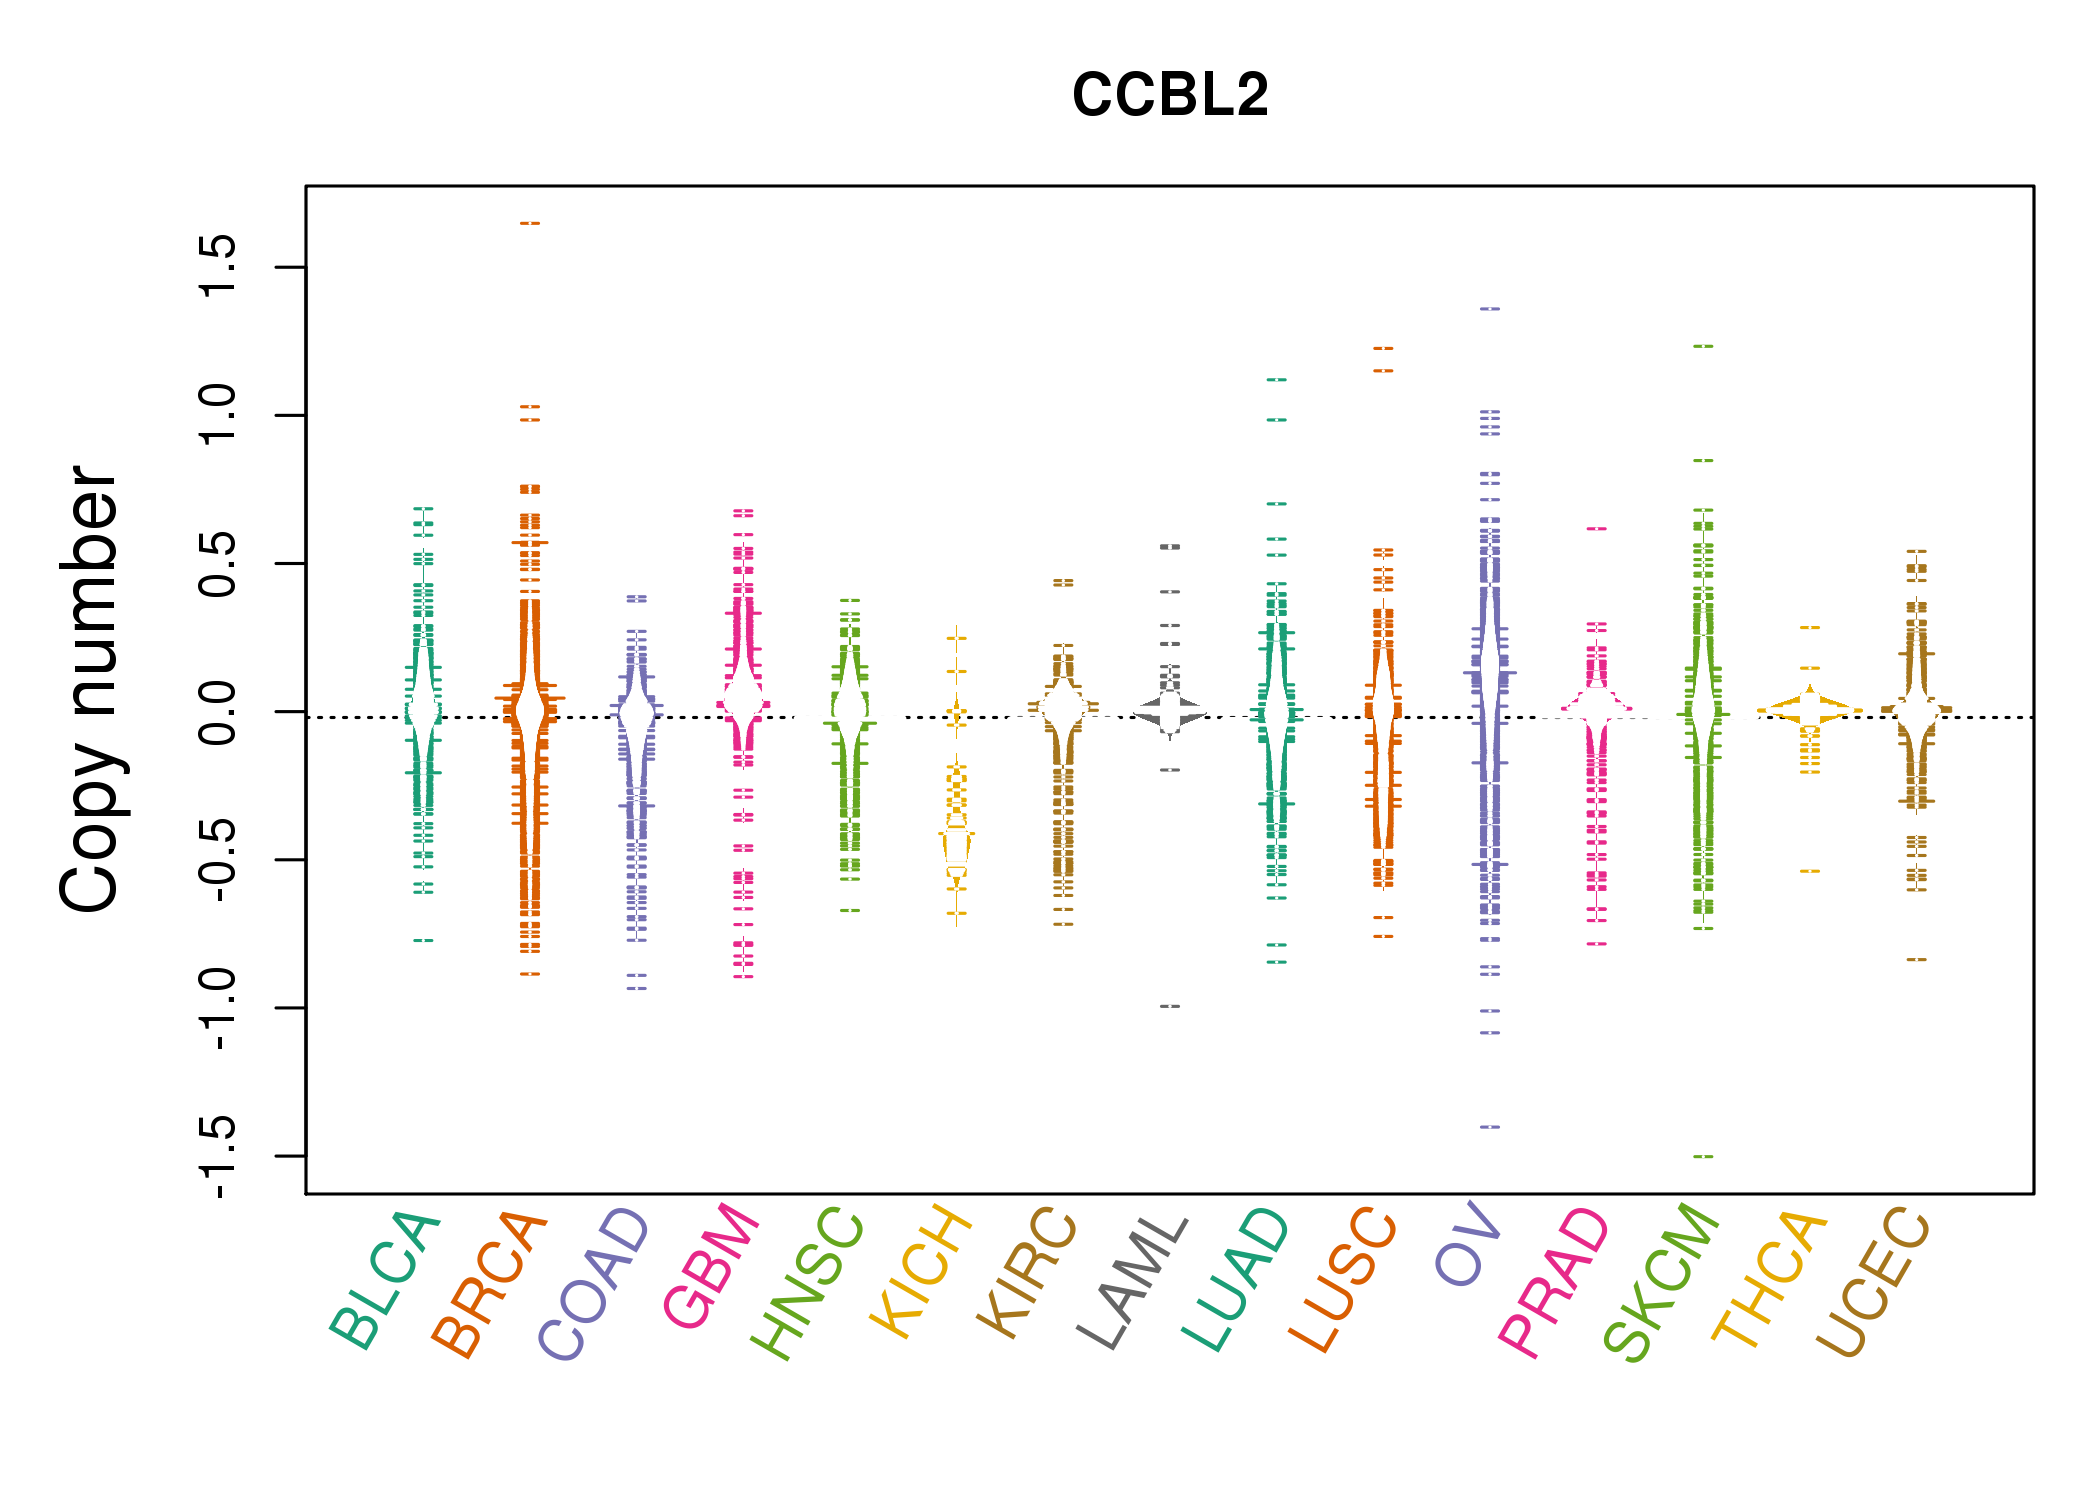 |
| cf) Tissue ID[Tissue type]: BLCA[Bladder Urothelial Carcinoma], BRCA[Breast invasive carcinoma], CESC[Cervical squamous cell carcinoma and endocervical adenocarcinoma], COAD[Colon adenocarcinoma], GBM[Glioblastoma multiforme], Glioma Low Grade, HNSC[Head and Neck squamous cell carcinoma], KICH[Kidney Chromophobe], KIRC[Kidney renal clear cell carcinoma], KIRP[Kidney renal papillary cell carcinoma], LAML[Acute Myeloid Leukemia], LUAD[Lung adenocarcinoma], LUSC[Lung squamous cell carcinoma], OV[Ovarian serous cystadenocarcinoma ], PAAD[Pancreatic adenocarcinoma], PRAD[Prostate adenocarcinoma], SKCM[Skin Cutaneous Melanoma], STAD[Stomach adenocarcinoma], THCA[Thyroid carcinoma], UCEC[Uterine Corpus Endometrial Carcinoma] |
| Top |
| Gene Expression for CCBL2 |
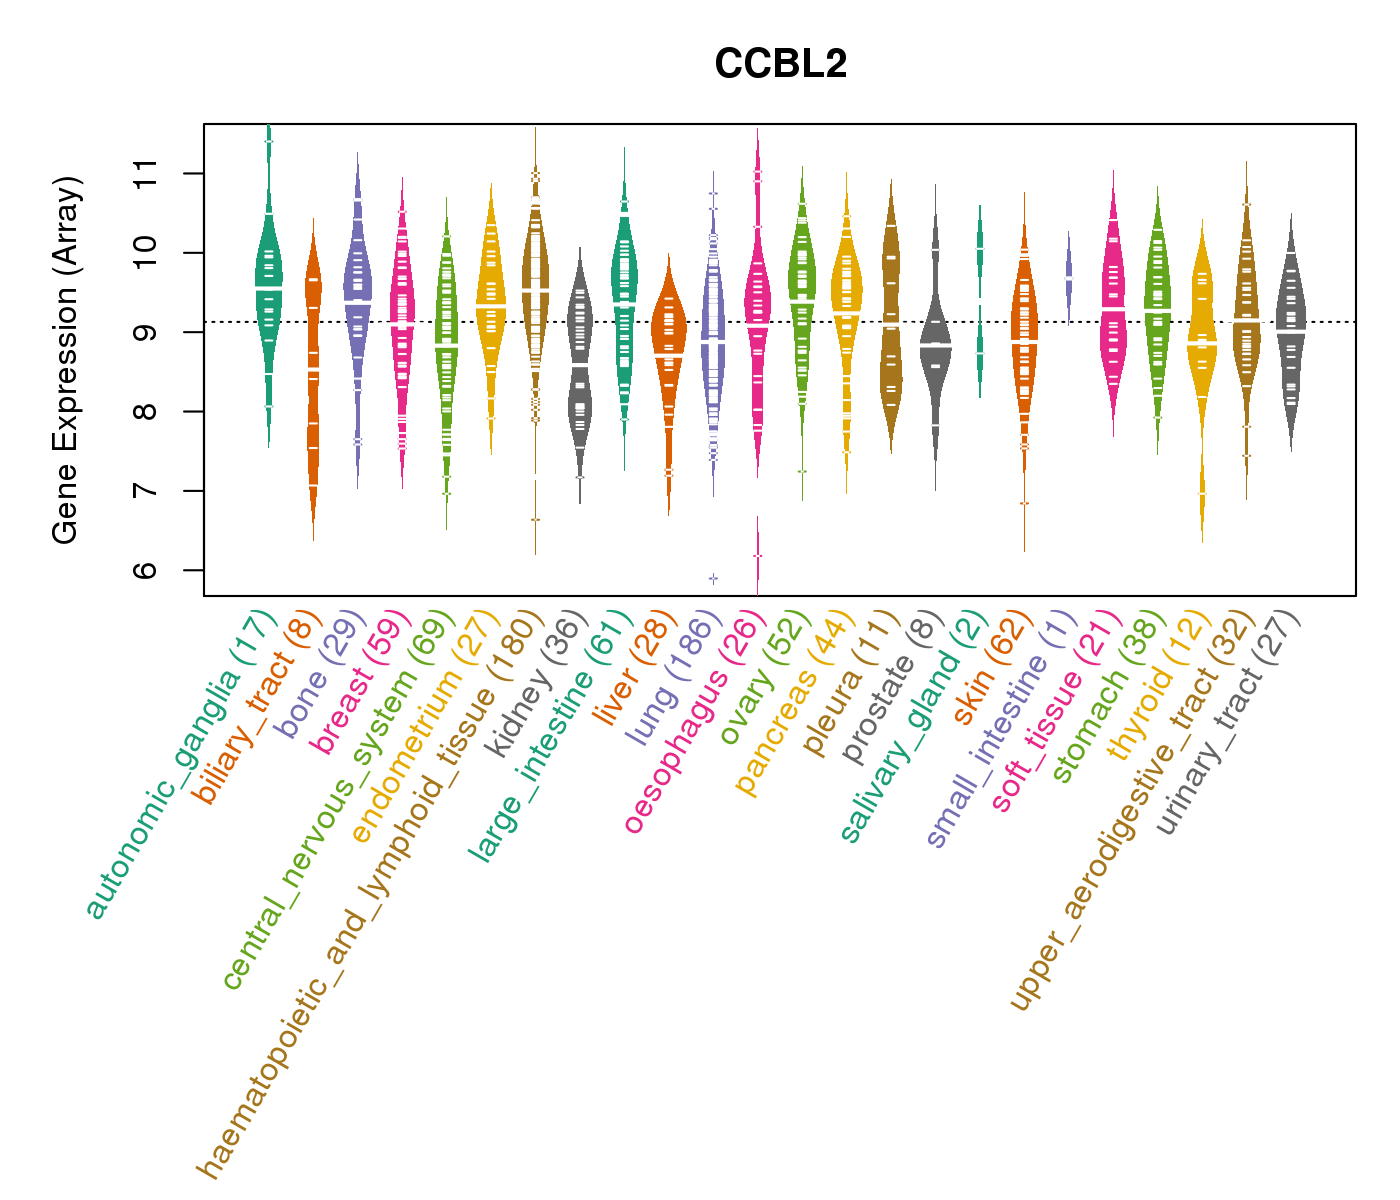
| * CCLE gene expression data were extracted from CCLE_Expression_Entrez_2012-10-18.res: Gene-centric RMA-normalized mRNA expression data. |
 |
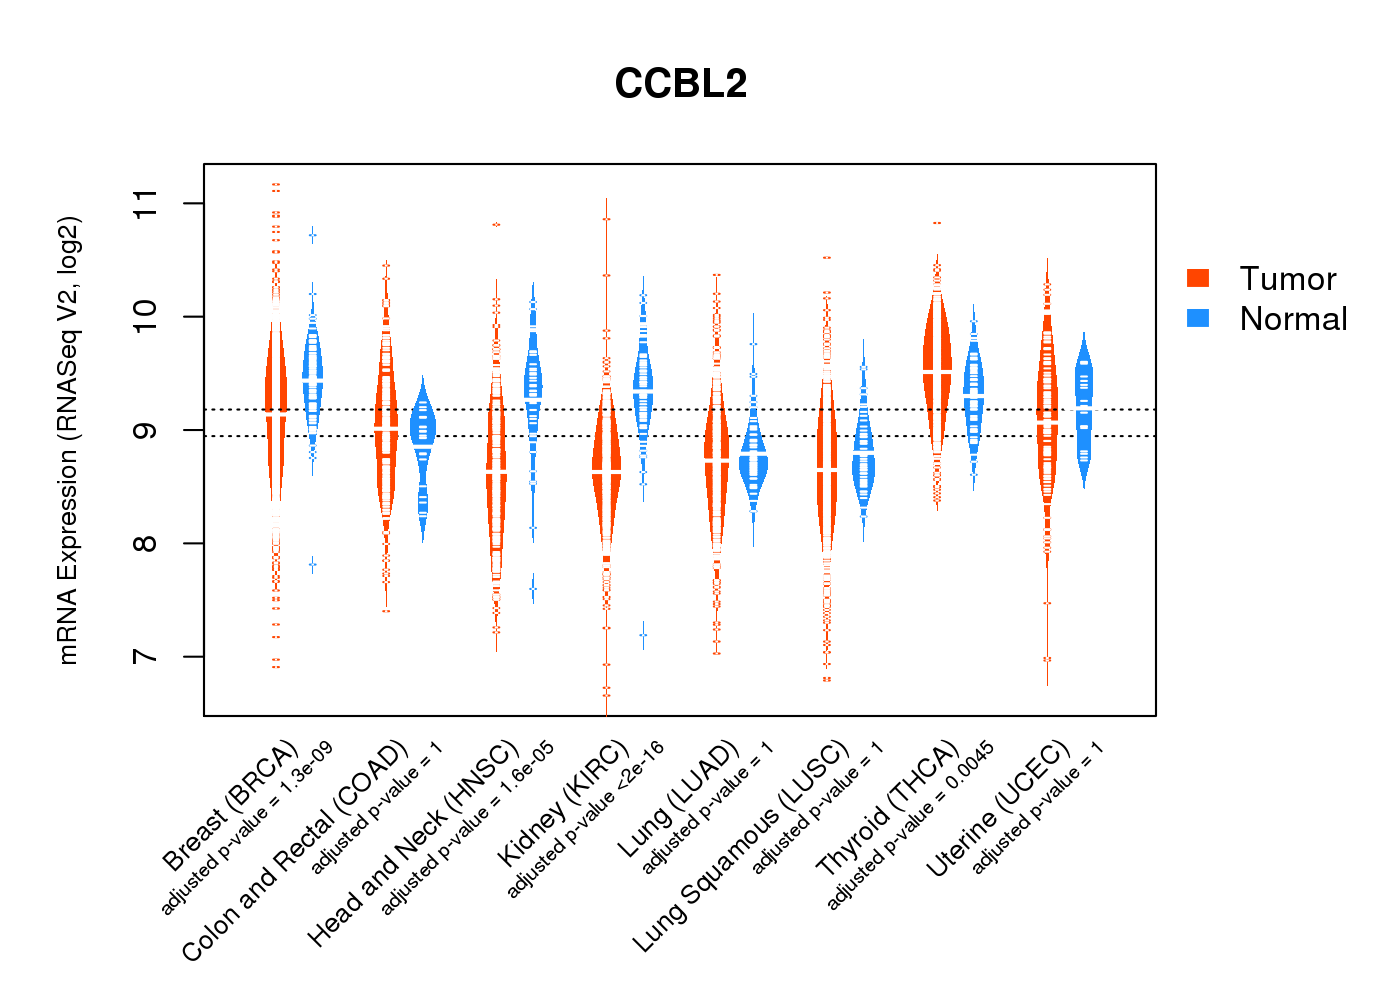
| * Normalized gene expression data of RNASeqV2 was extracted from TCGA using R package TCGA-Assembler. The URLs of all public data files on TCGA DCC data server were gathered at Jan-05-2015. Only eight cancer types have enough normal control samples for differential expression analysis. (t test, adjusted p<0.05 (using Benjamini-Hochberg FDR)) |
 |
| Top |
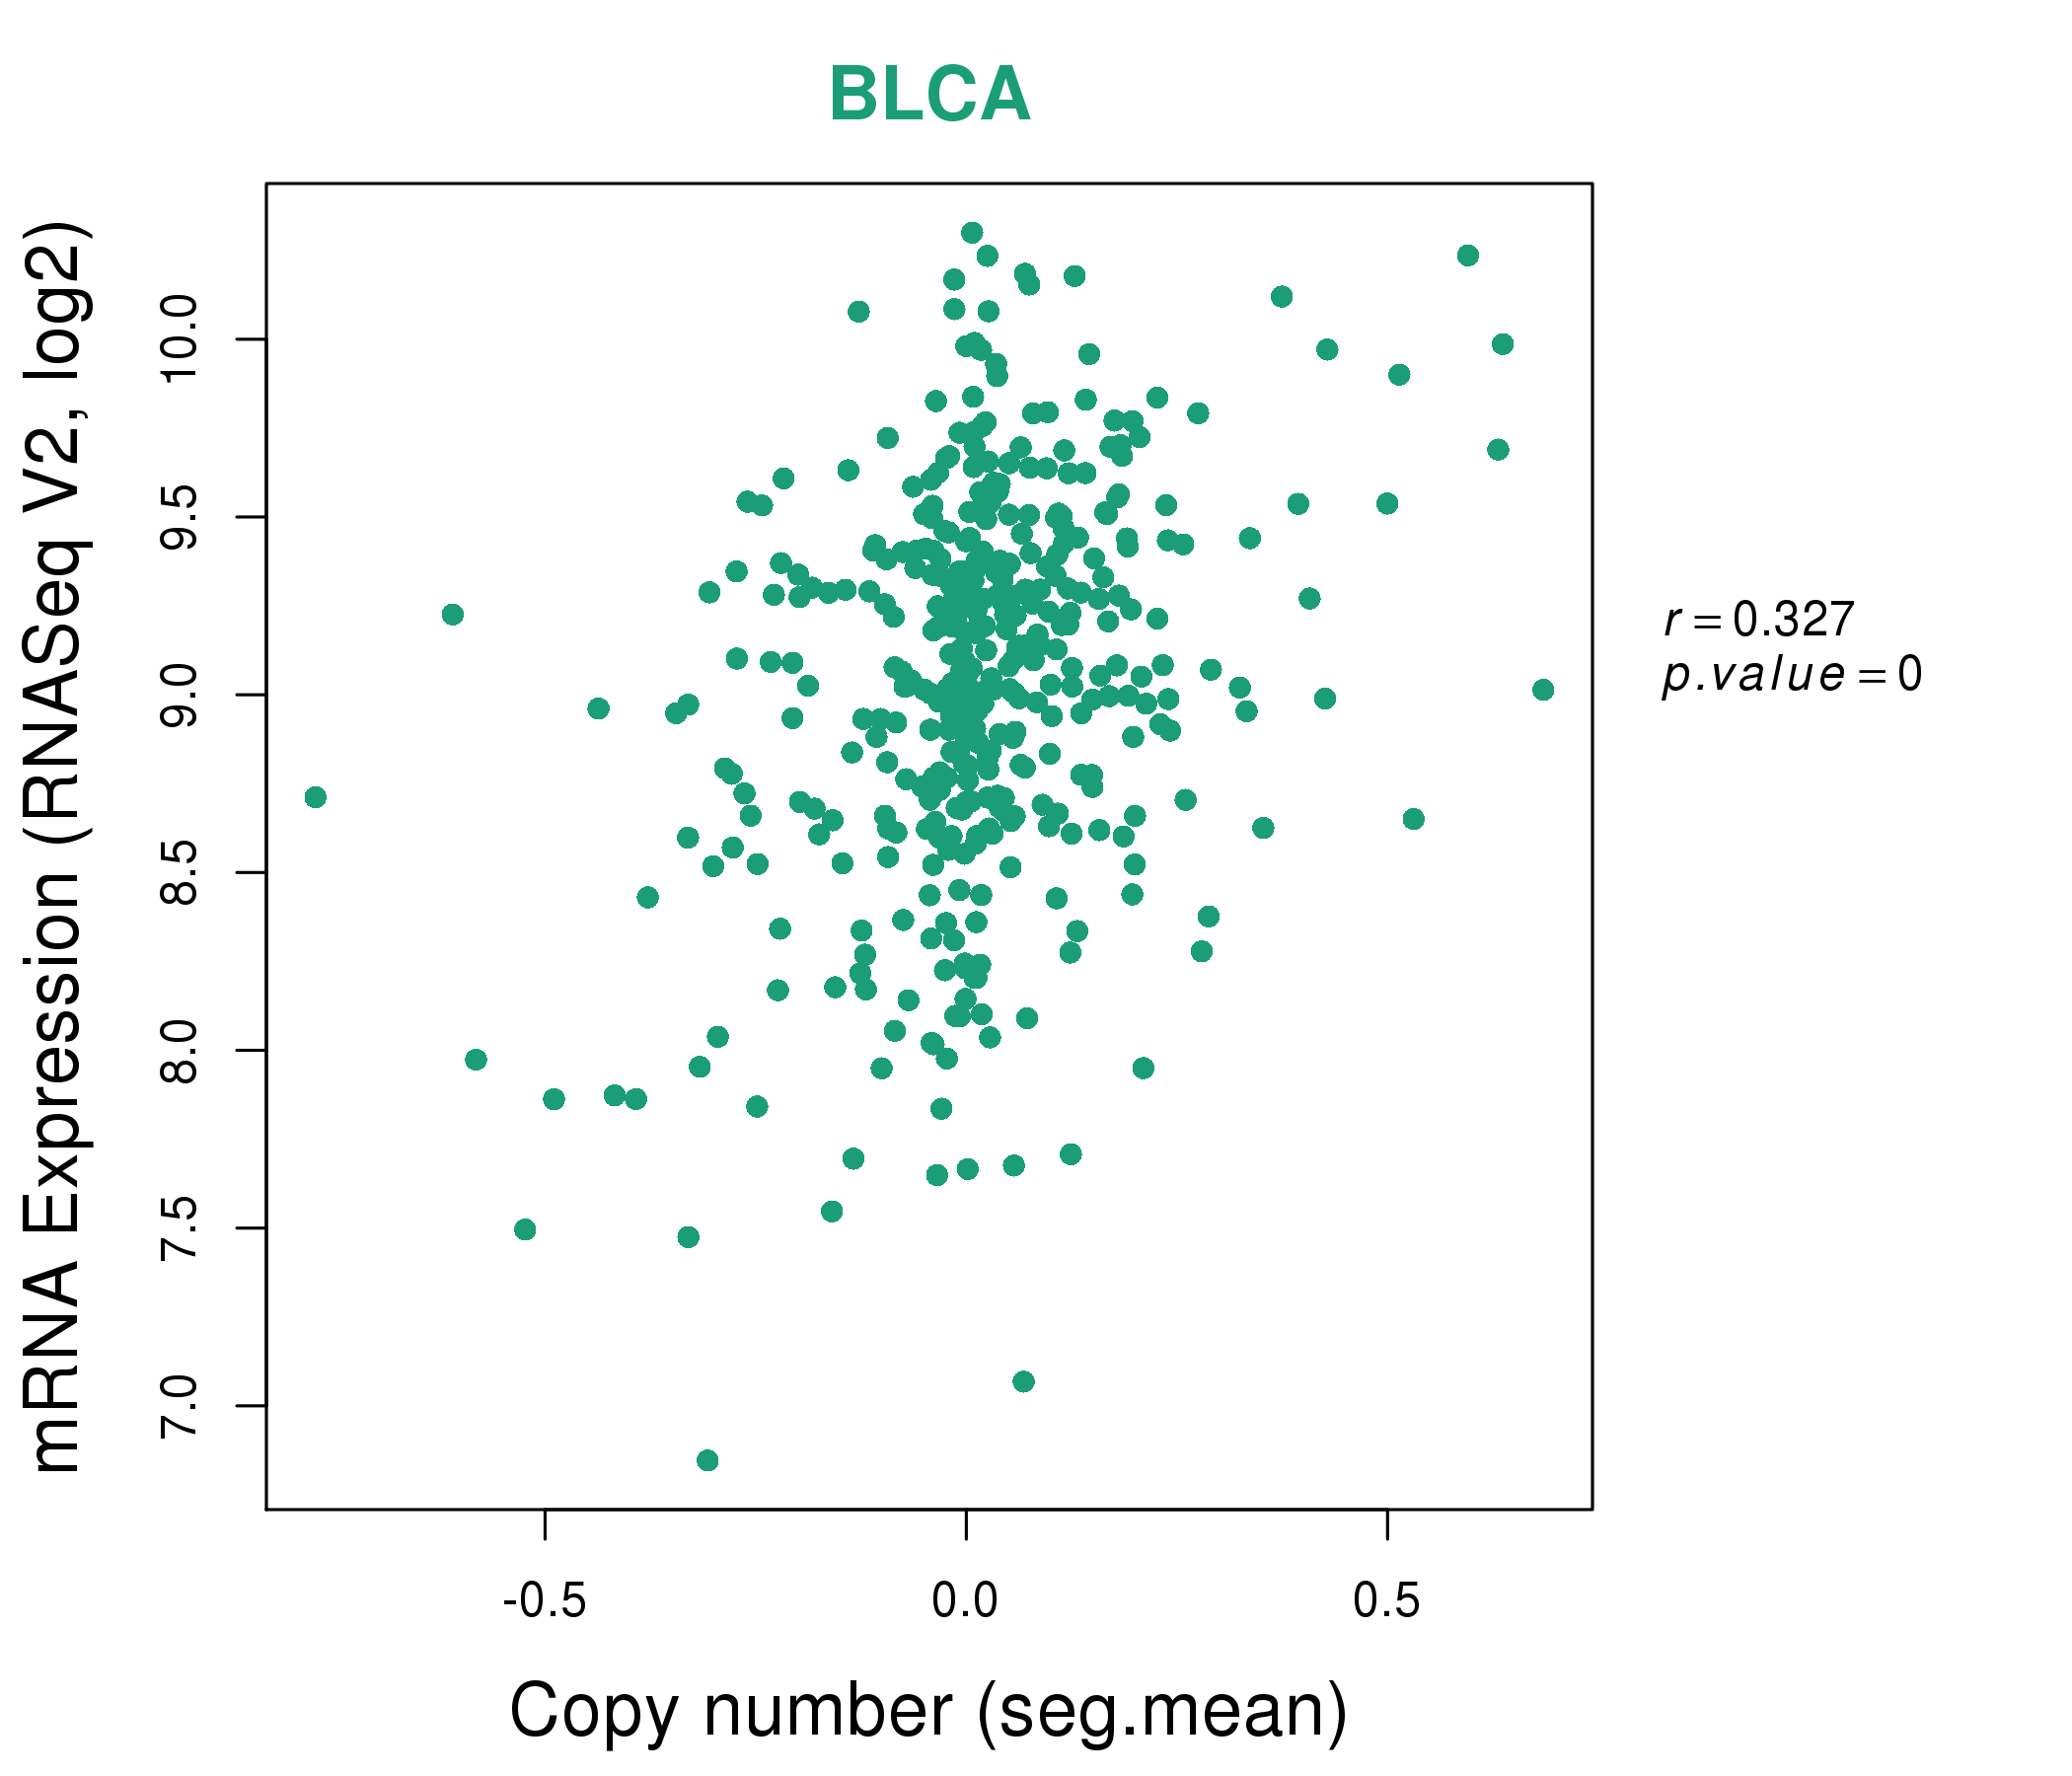
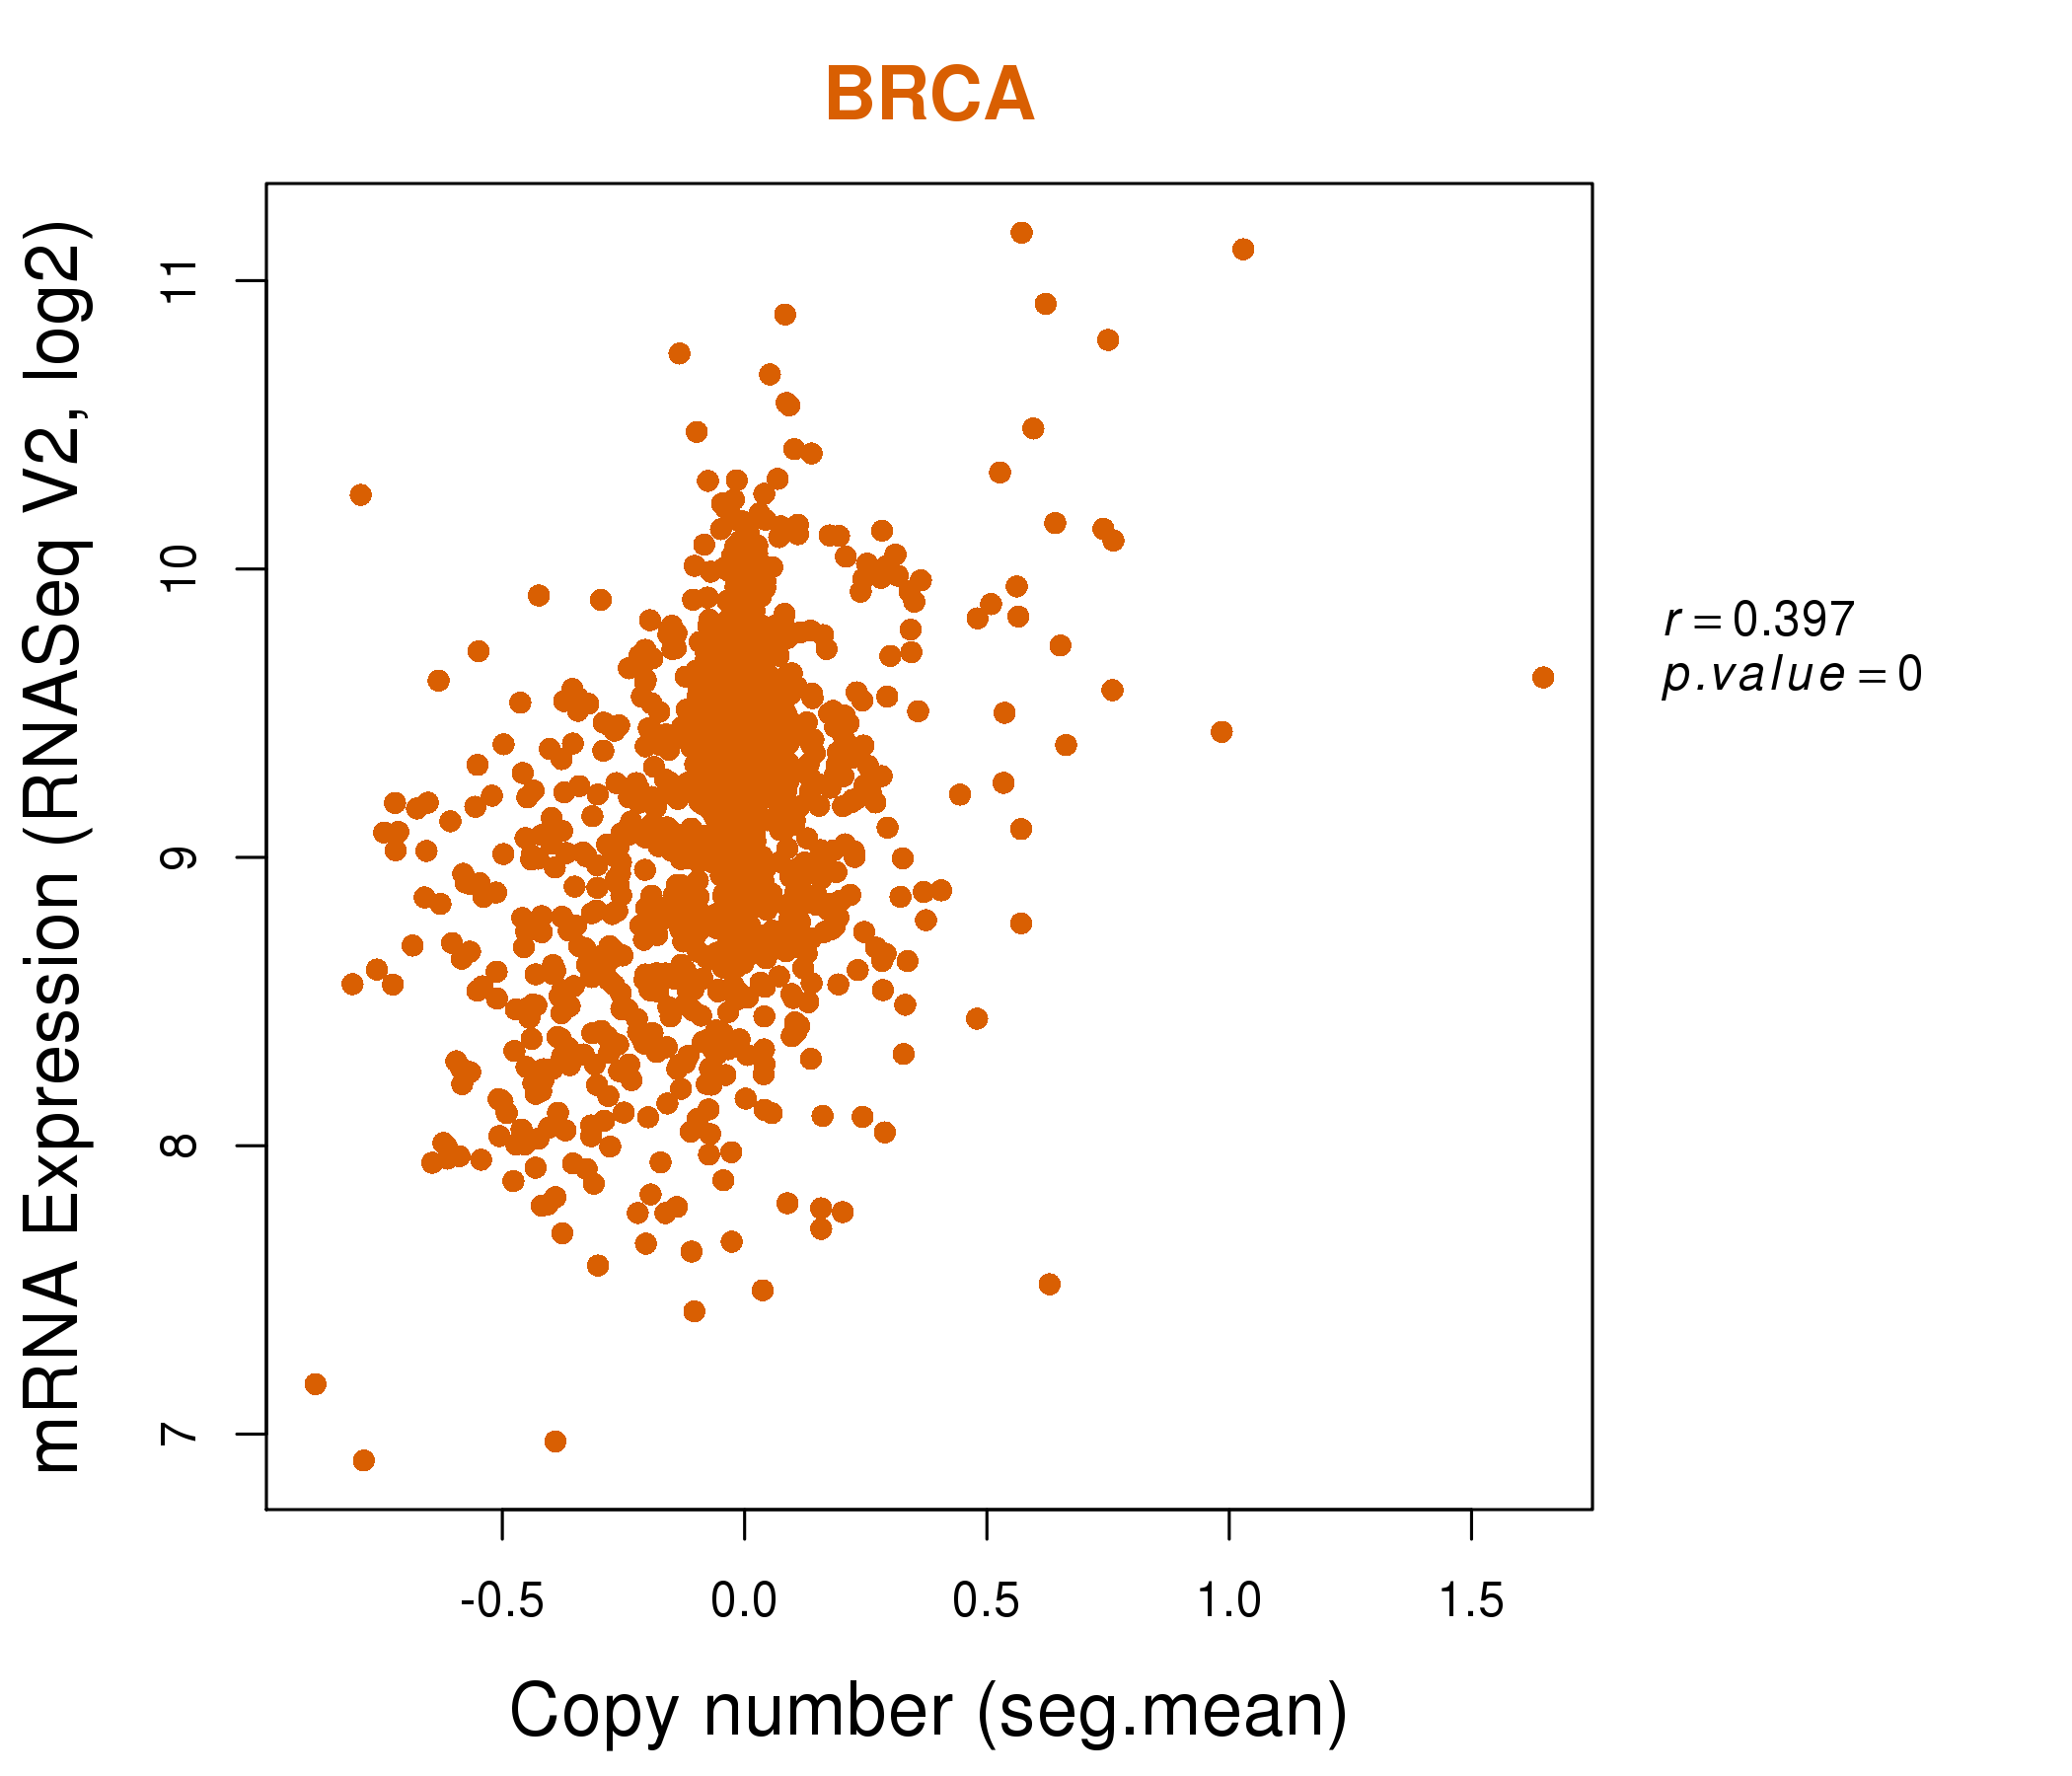
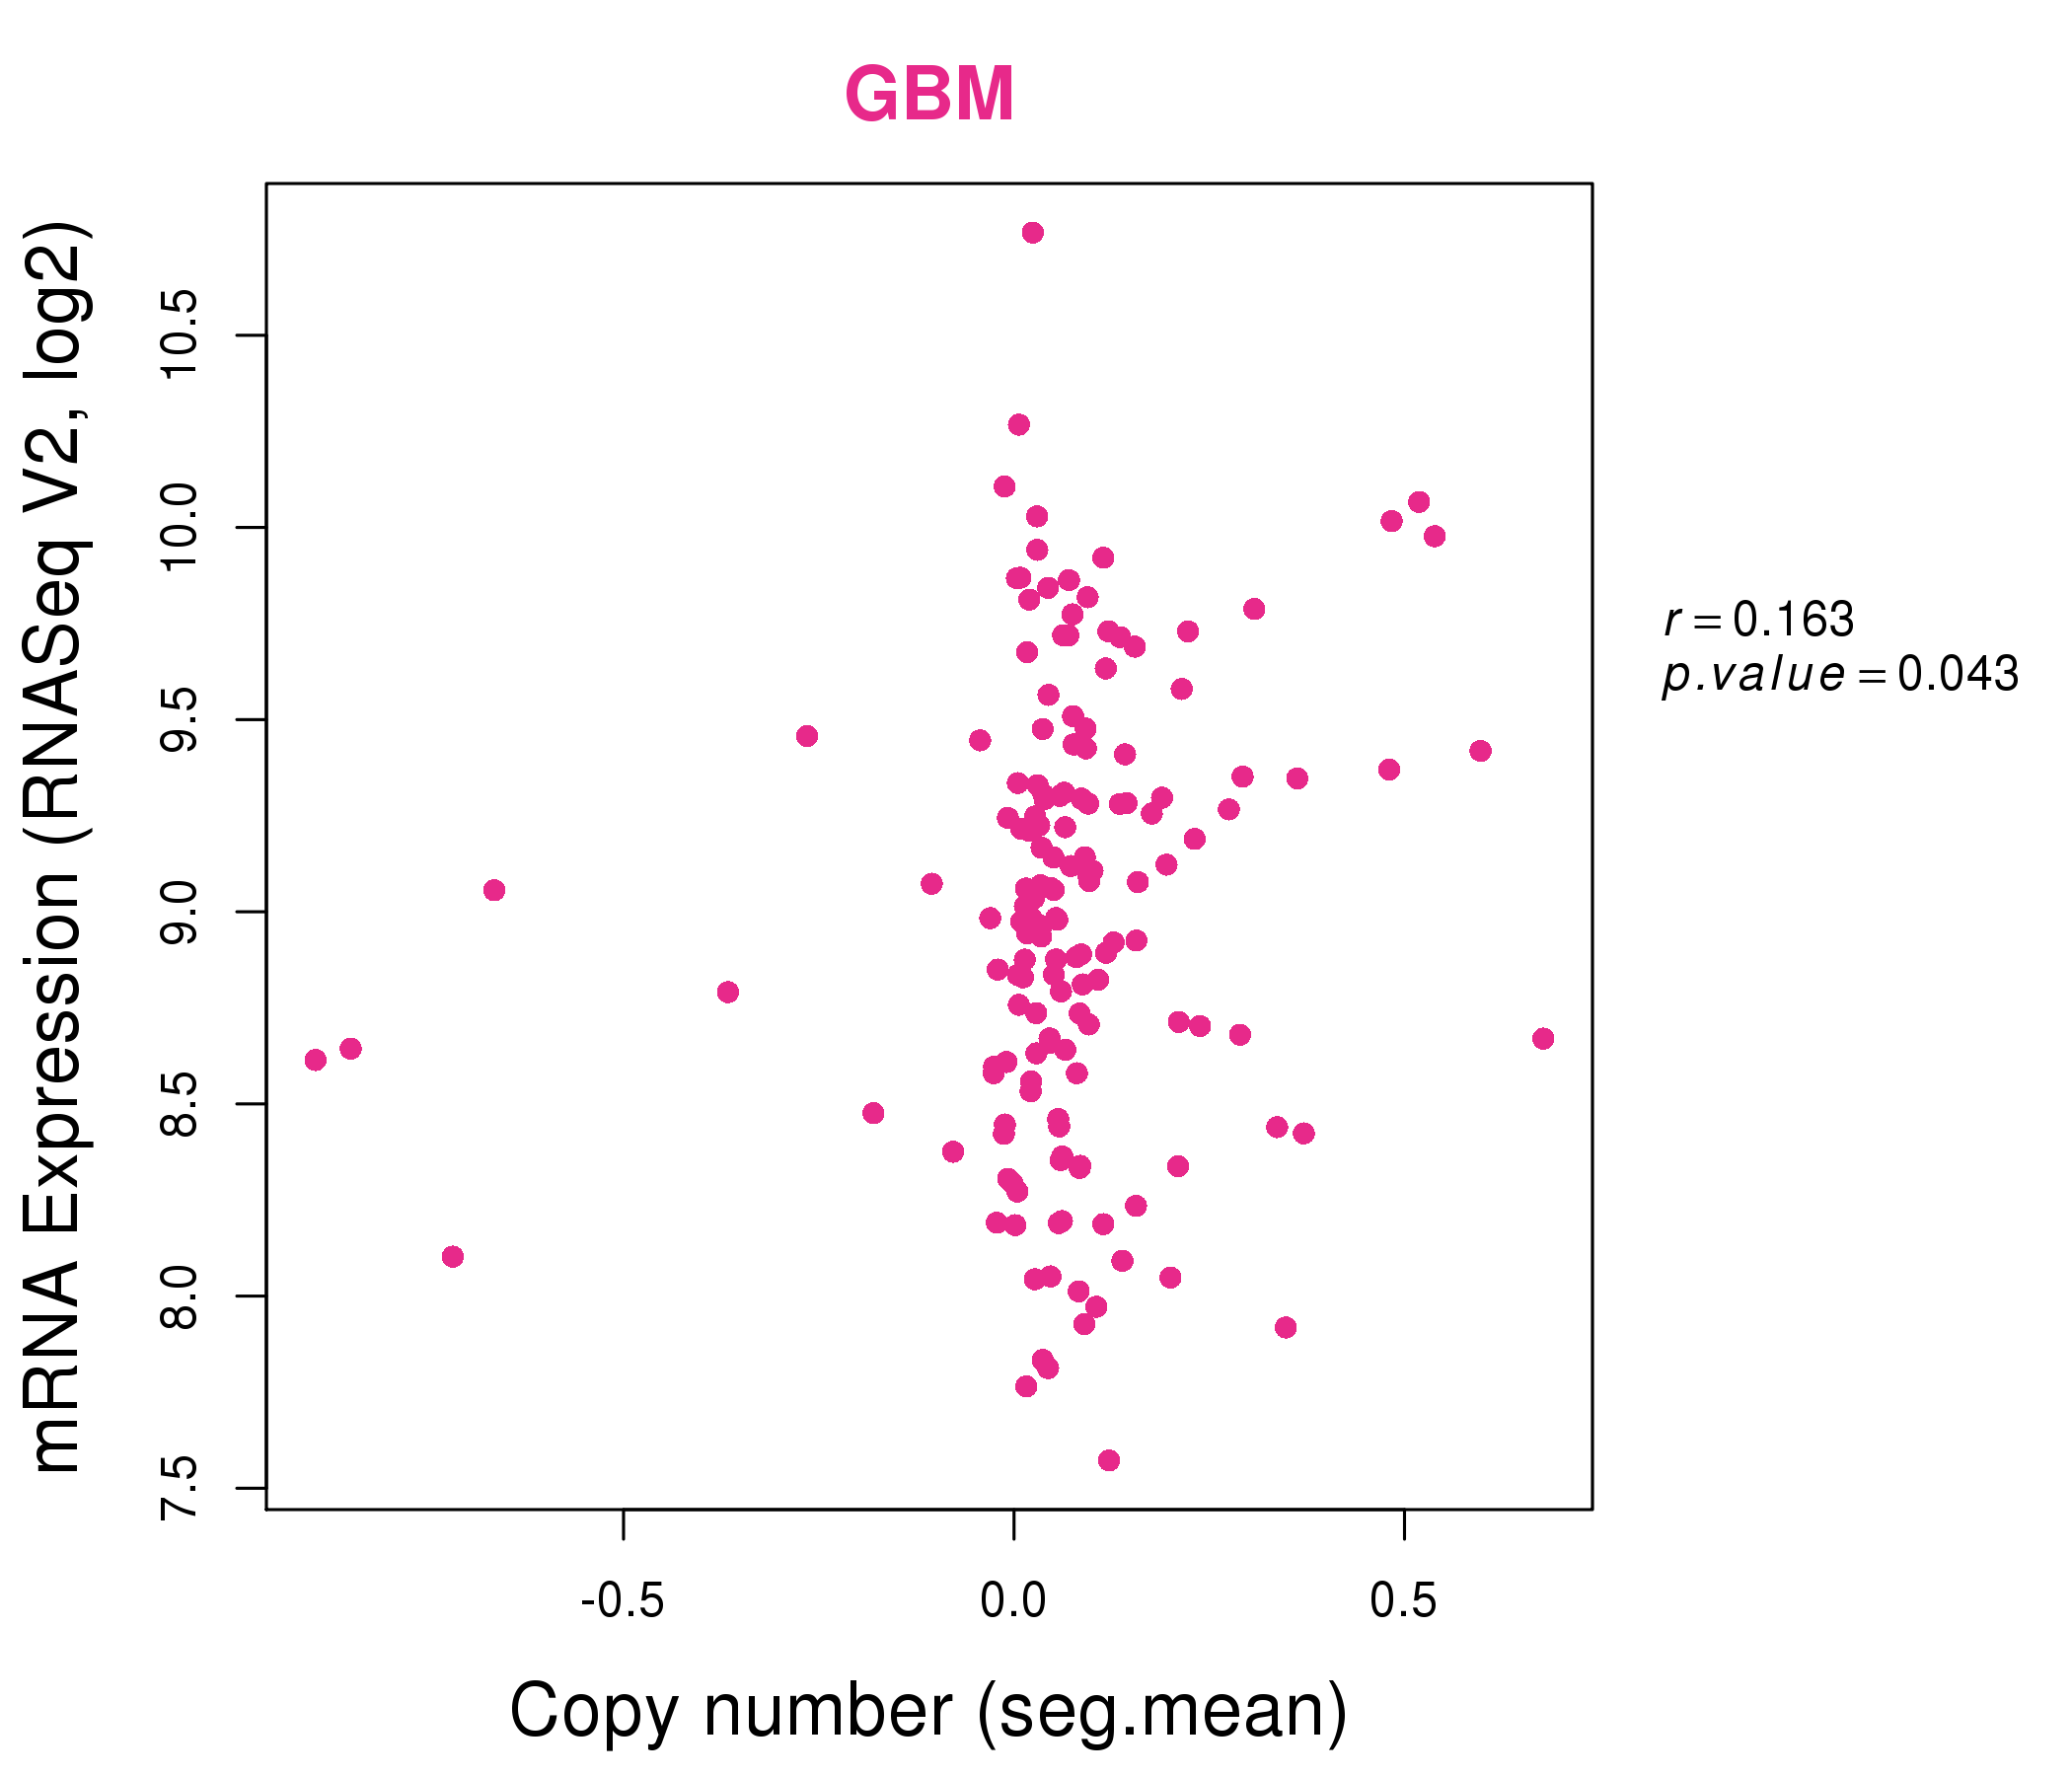
| * This plots show the correlation between CNV and gene expression. |
: Open all plots for all cancer types
 |
|
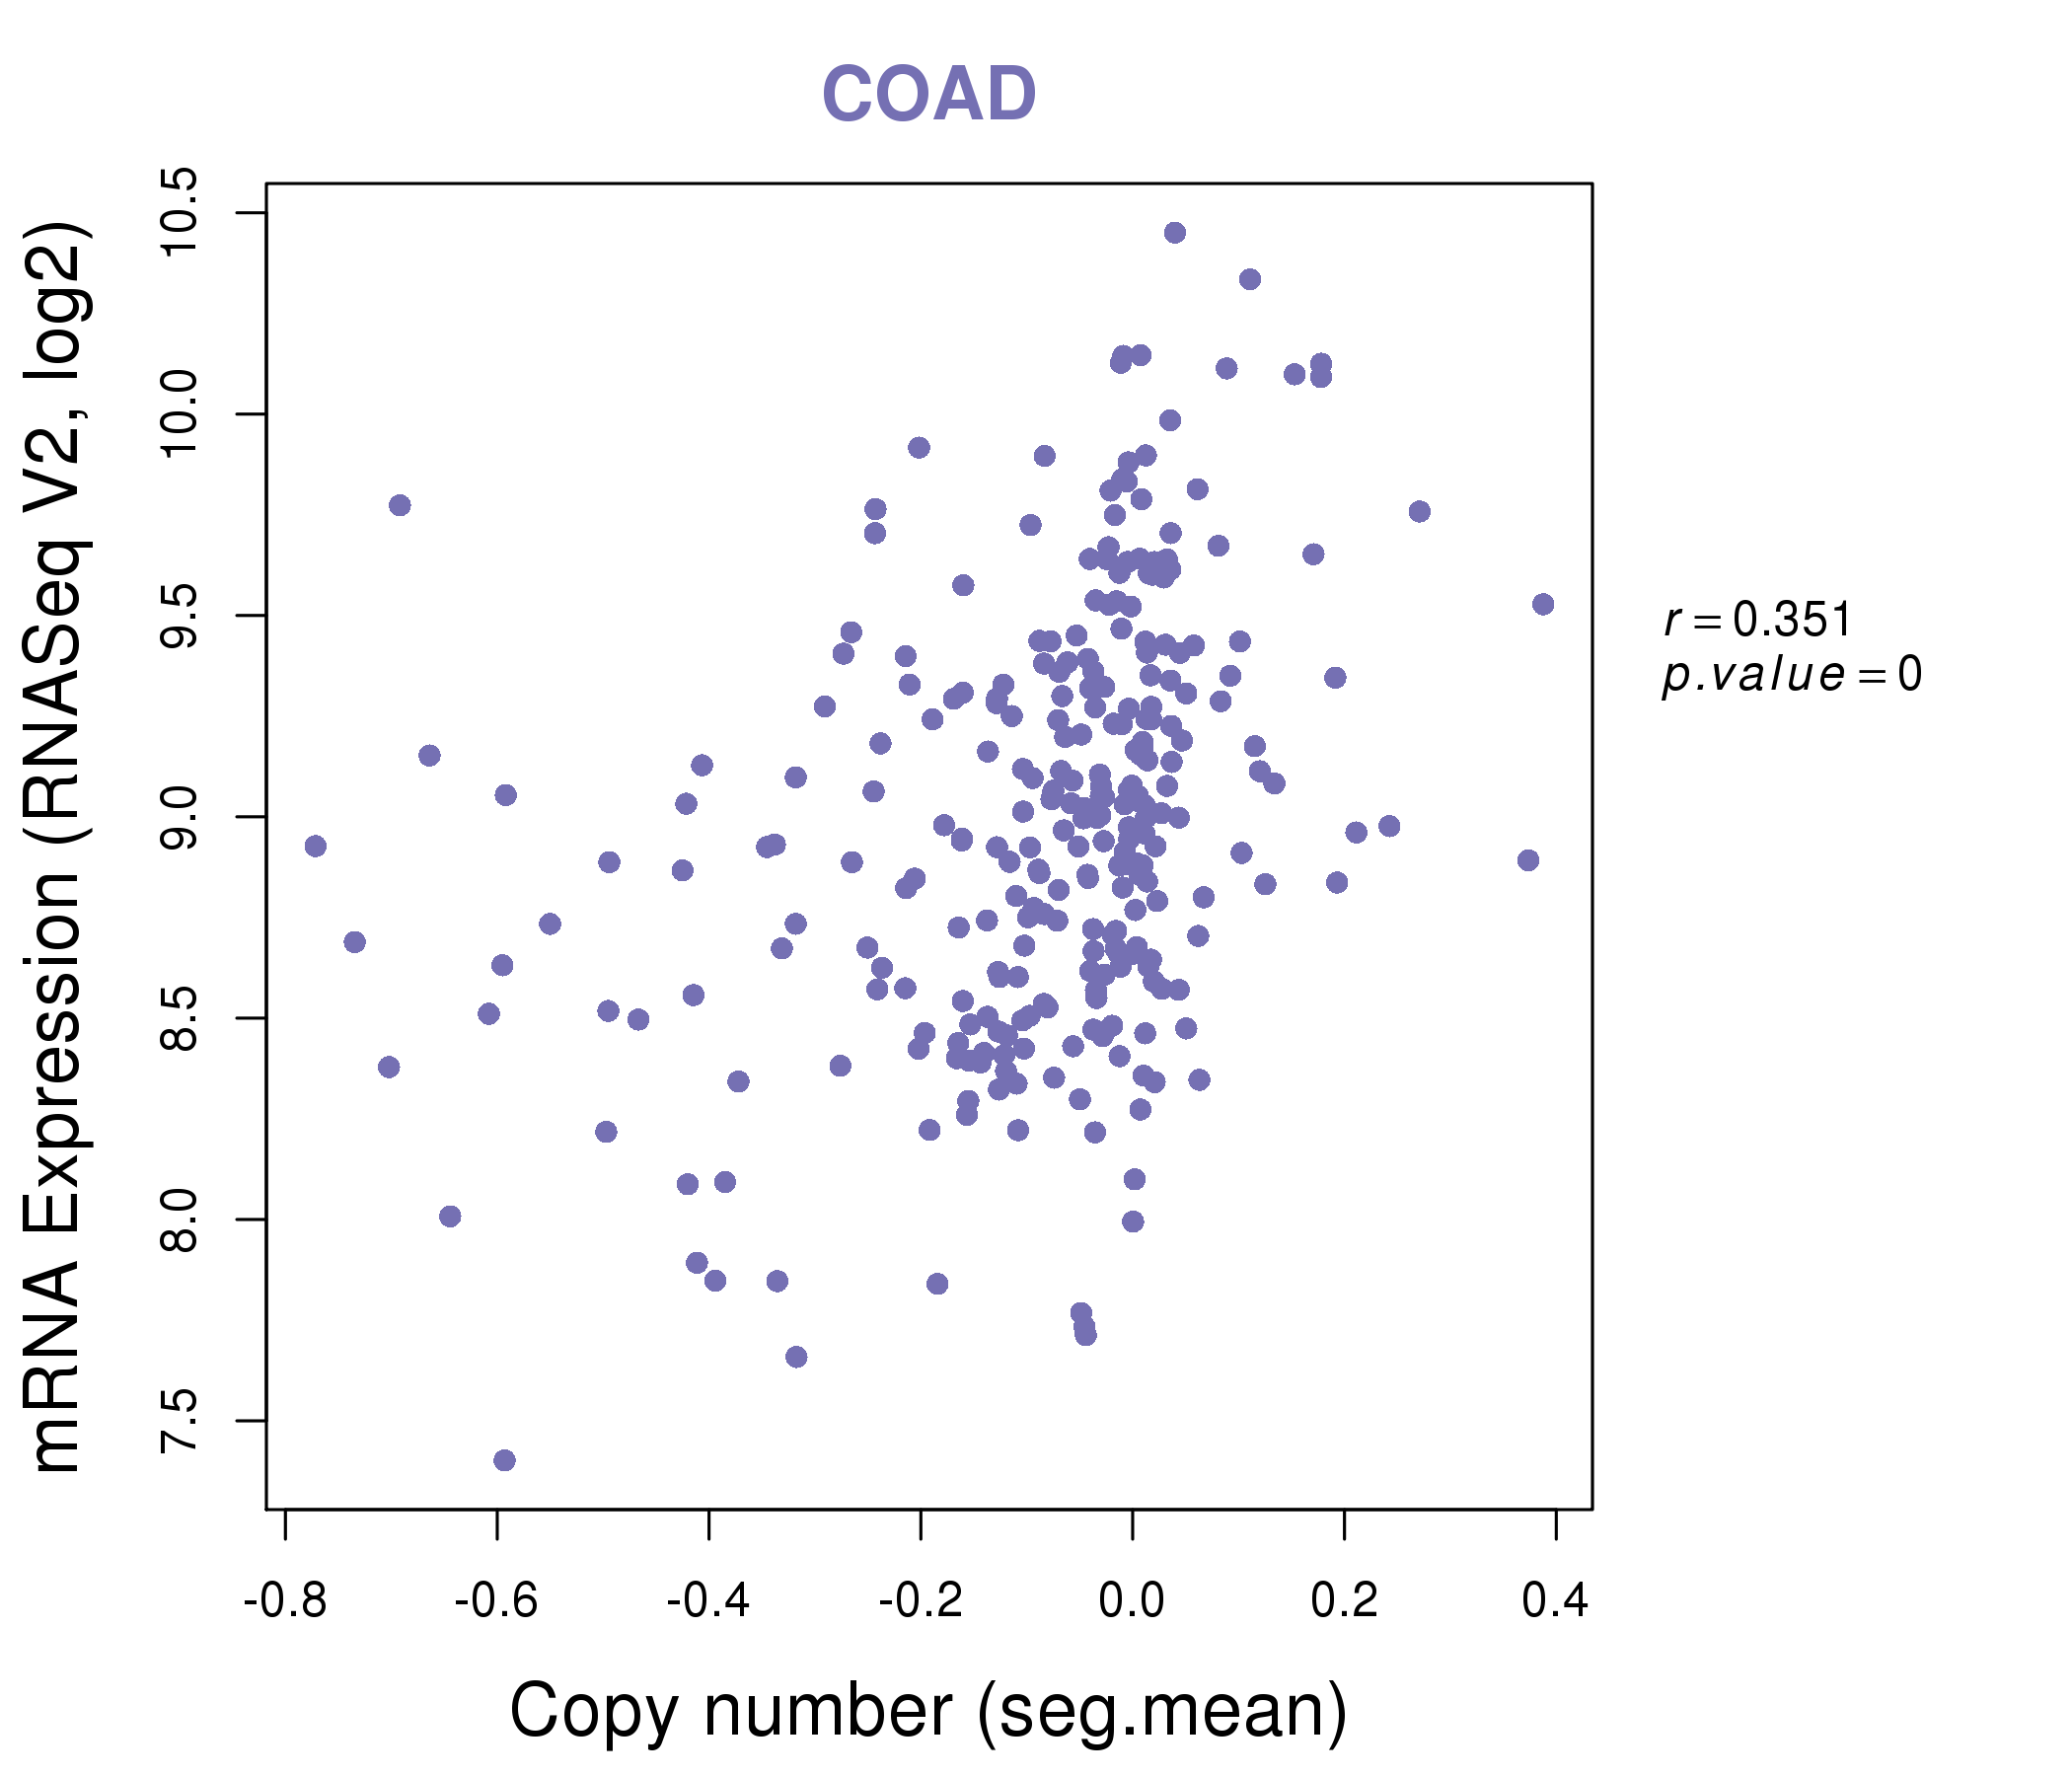 |
|
| Top |
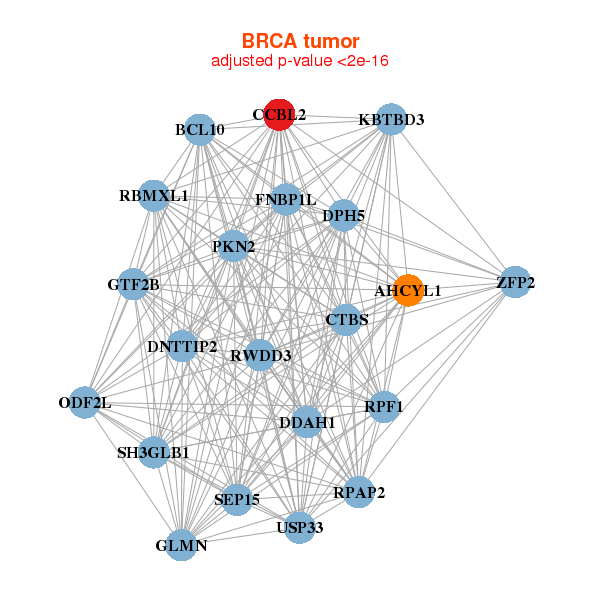
| Gene-Gene Network Information |
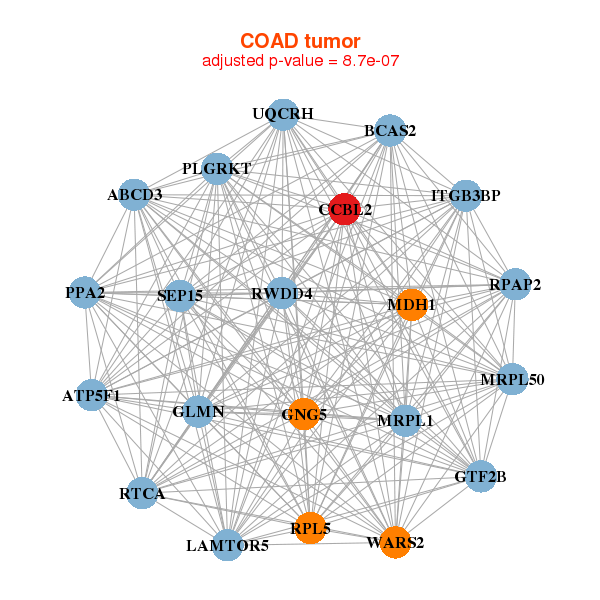
| * Co-Expression network figures were drawn using R package igraph. Only the top 20 genes with the highest correlations were shown. Red circle: input gene, orange circle: cell metabolism gene, sky circle: other gene |
: Open all plots for all cancer types
 |
| ||||
| AHCYL1,BCL10,CCBL2,CTBS,DDAH1,DNTTIP2,DPH5, FNBP1L,GLMN,GTF2B,KBTBD3,ODF2L,PKN2,RBMXL1, RPAP2,RPF1,RWDD3,SEP15,SH3GLB1,USP33,ZFP2 | ACTR6,ARV1,C11orf1,METTL25,TMA16,FAM206A,CCBL2, DUS4L,DYNC2LI1,EAPP,EEF1E1,GABPB1,KHDRBS1,MBIP, NUP54,ORC5,PPP1R8,RSL24D1,TMEM128,ZCCHC7,ZNF22 | ||||
 |
| ||||
| ABCD3,ATP5F1,BCAS2,PLGRKT,CCBL2,GLMN,GNG5, GTF2B,LAMTOR5,ITGB3BP,MDH1,MRPL1,MRPL50,PPA2, RPAP2,RPL5,RTCA,RWDD4,SEP15,UQCRH,WARS2 | ALG6,APOO,ATP5A1,ATP5B,ATP5G3,CAMKMT,C2orf43, CCBL2,CCT8,CPSF3,EIF3M,FARSB,FH,MYCBP, NDUFA9,PPIA,PPP2R2A,PPP6C,PRPF38A,SUGT1,UQCRHL |
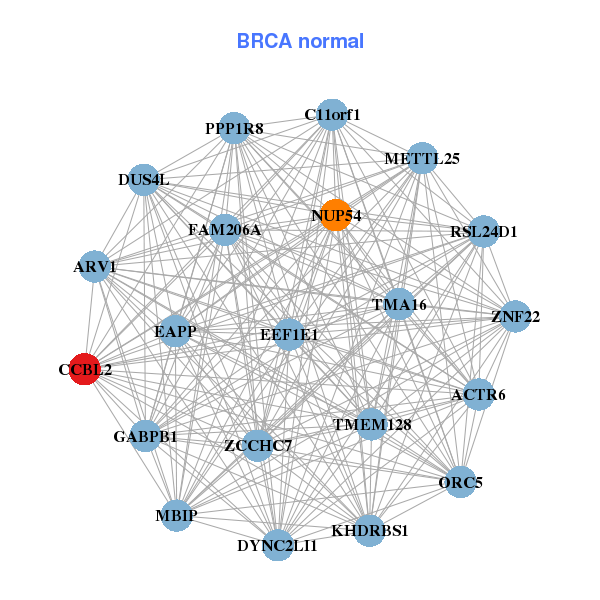
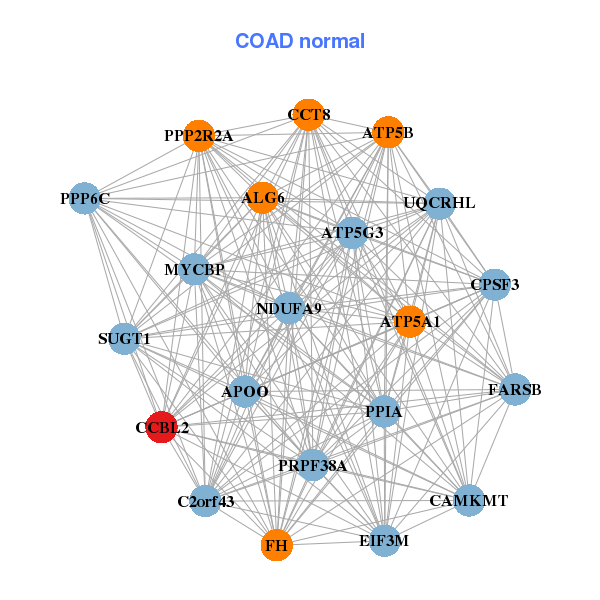
| * Co-Expression network figures were drawn using R package igraph. Only the top 20 genes with the highest correlations were shown. Red circle: input gene, orange circle: cell metabolism gene, sky circle: other gene |
: Open all plots for all cancer types
| Top |
: Open all interacting genes' information including KEGG pathway for all interacting genes from DAVID
| Top |
| Pharmacological Information for CCBL2 |
| DB Category | DB Name | DB's ID and Url link |
| * Gene Centered Interaction Network. |
 |
| * Drug Centered Interaction Network. |
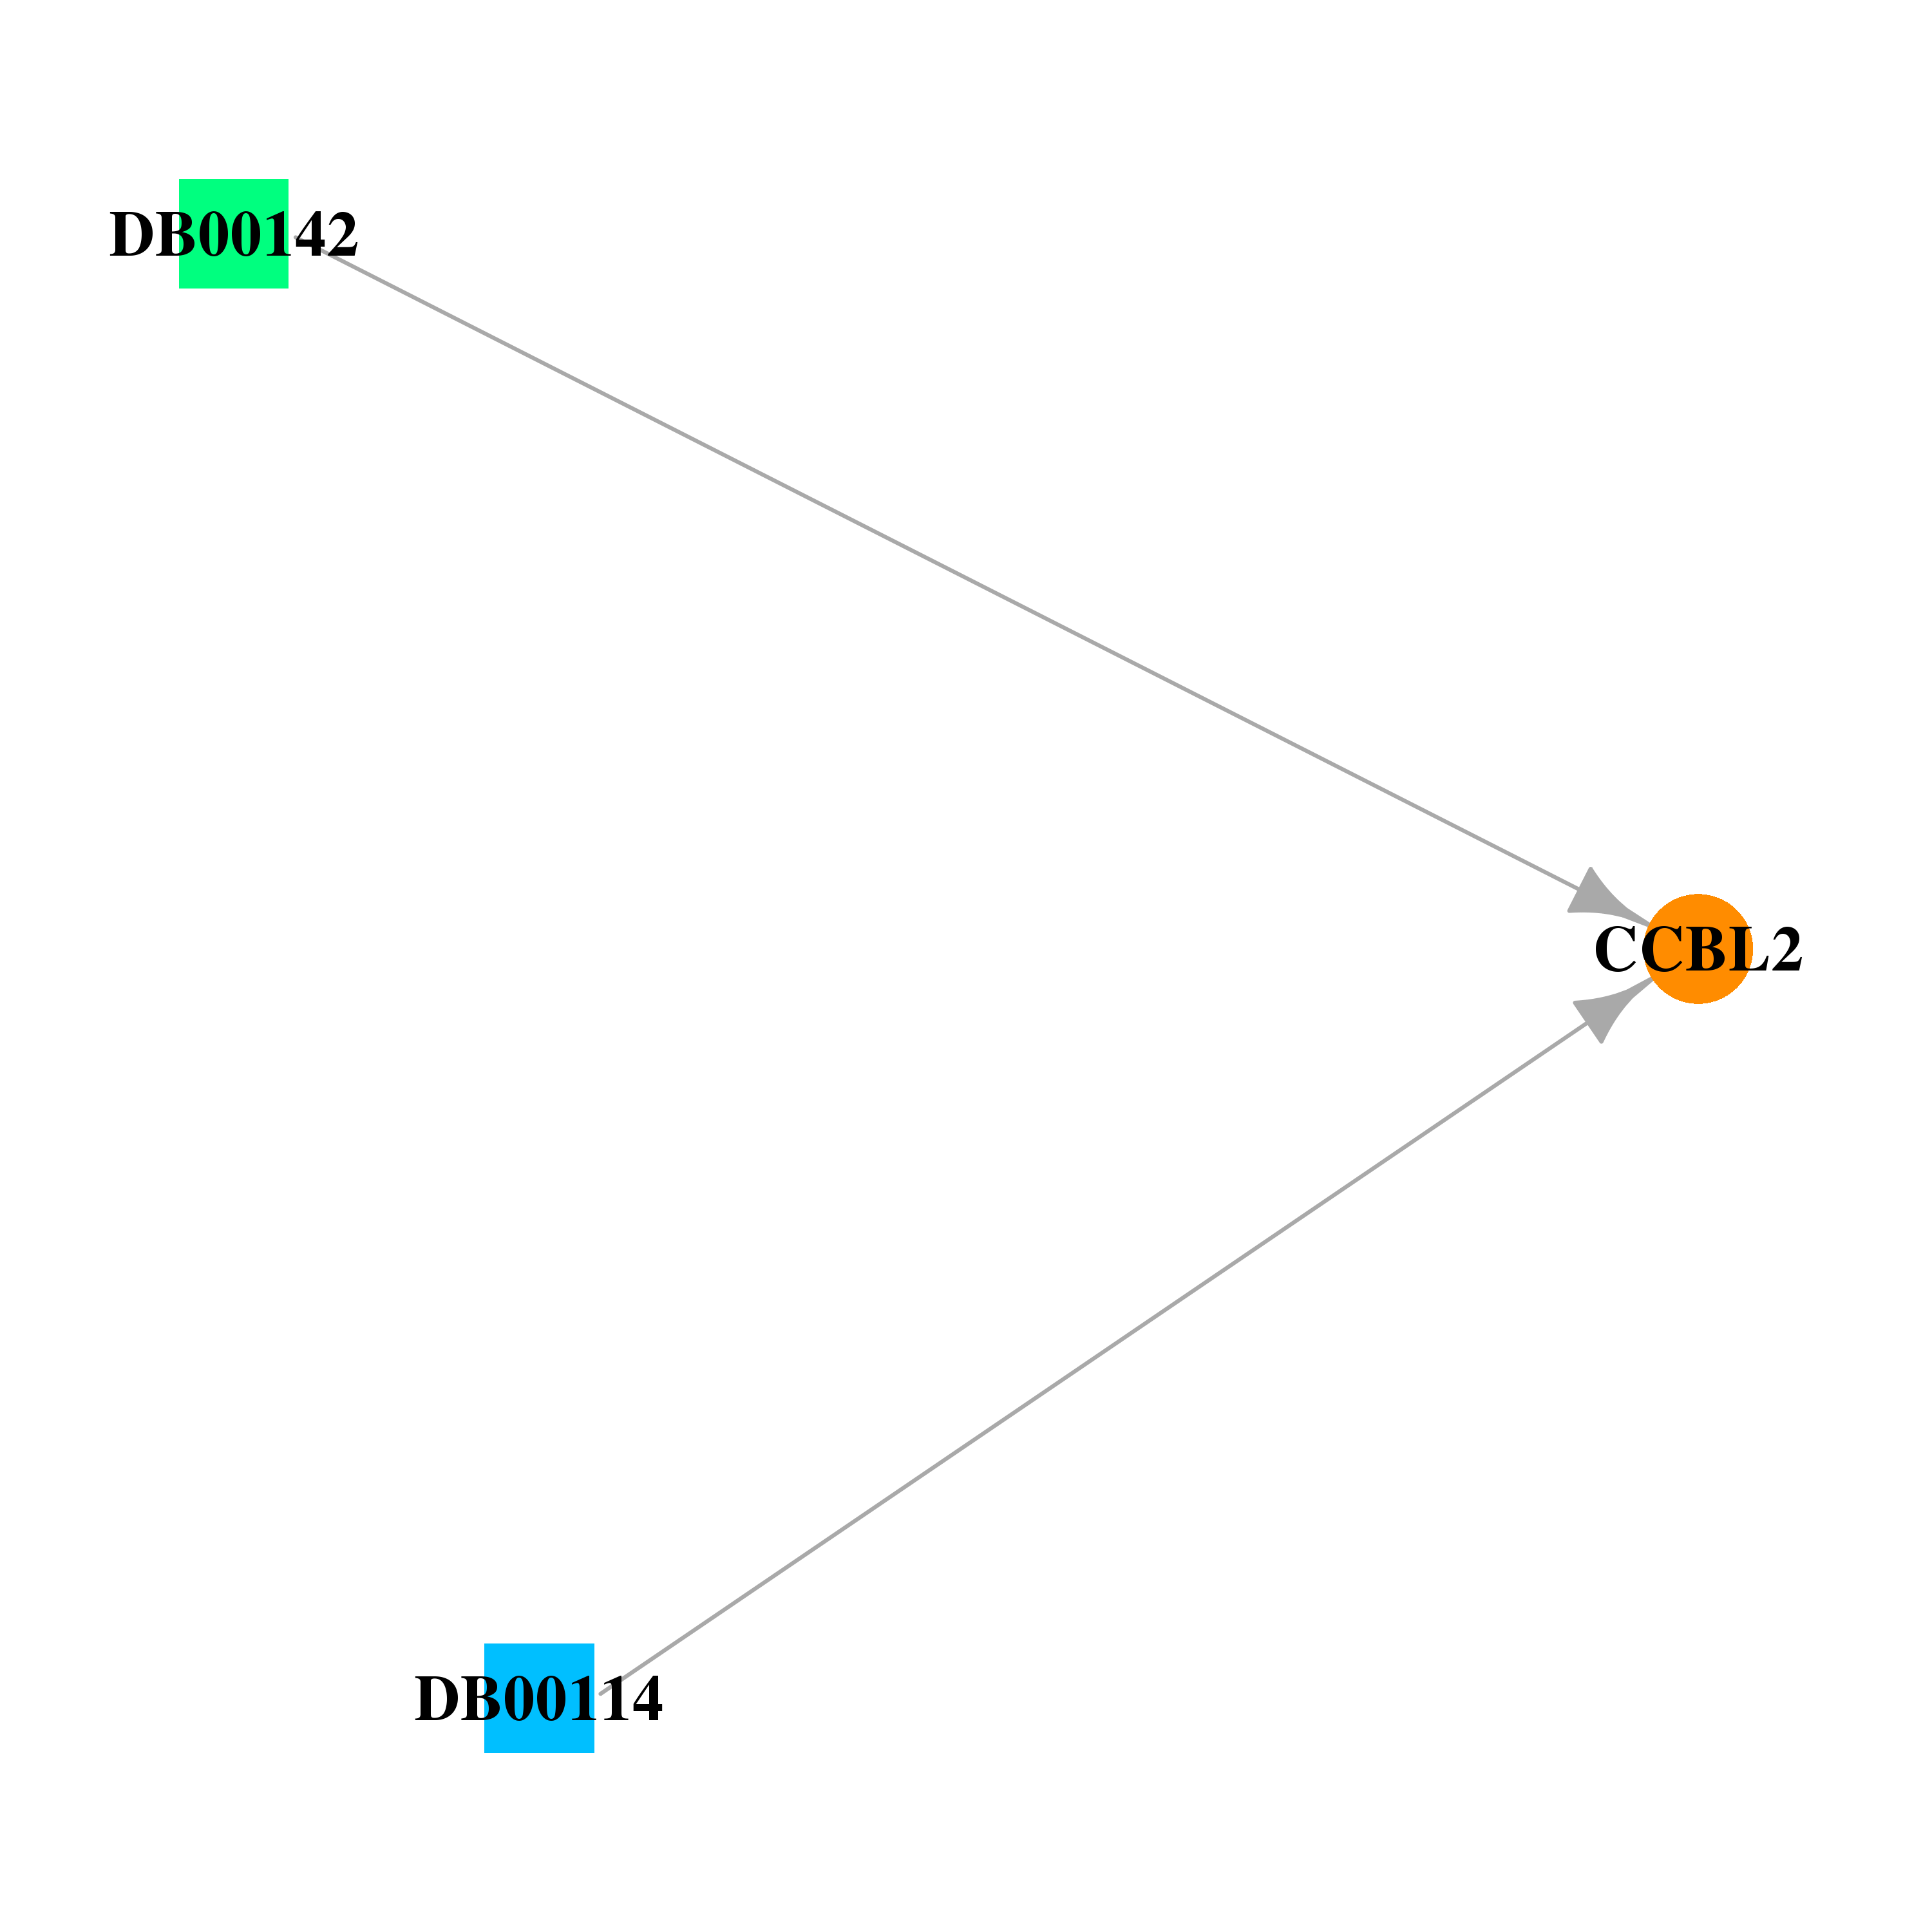
| DrugBank ID | Target Name | Drug Groups | Generic Name | Drug Centered Network | Drug Structure |
| DB00114 | cysteine conjugate-beta lyase 2 | nutraceutical | Pyridoxal Phosphate |  |  |
| DB00142 | cysteine conjugate-beta lyase 2 | approved; nutraceutical | L-Glutamic Acid | 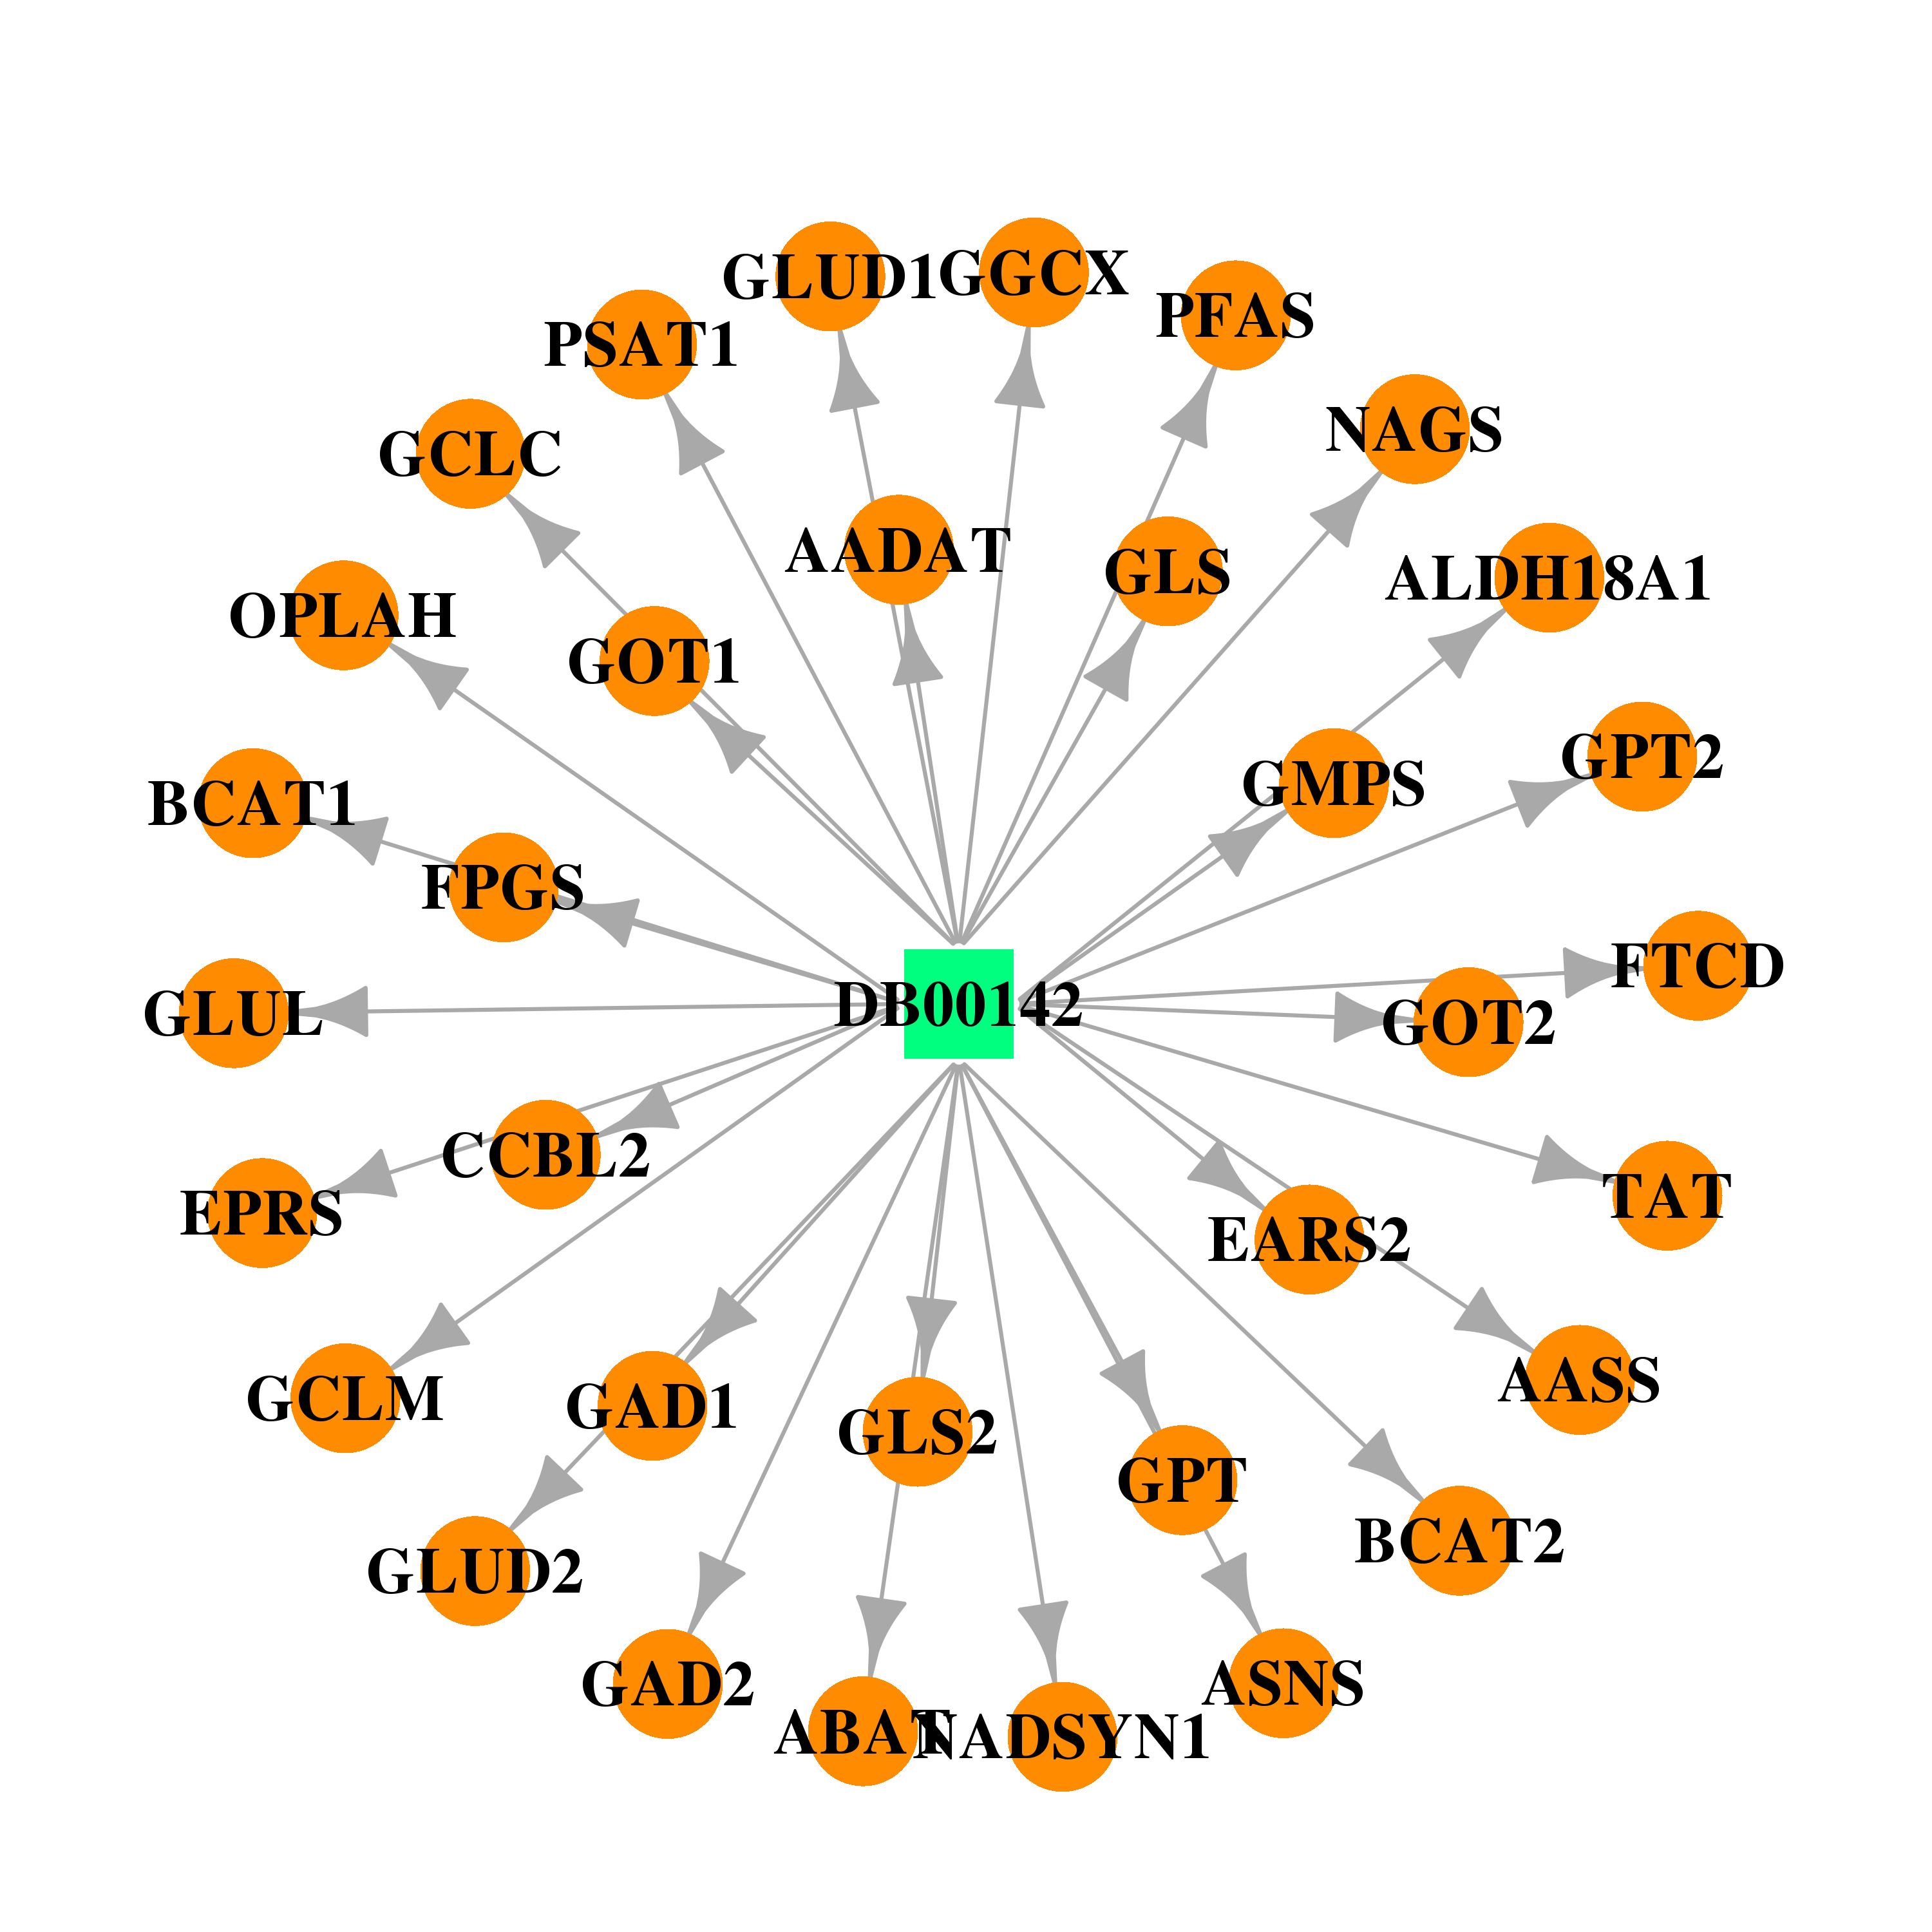 | 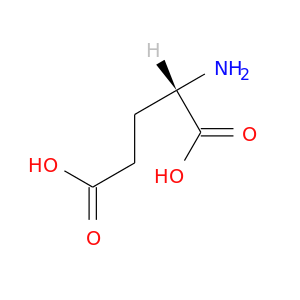 |
| Top |
| Cross referenced IDs for CCBL2 |
| * We obtained these cross-references from Uniprot database. It covers 150 different DBs, 18 categories. http://www.uniprot.org/help/cross_references_section |
: Open all cross reference information
|
Copyright © 2016-Present - The Univsersity of Texas Health Science Center at Houston @ |