|
|||||||||||||||||||||||||||||||||||||||||||||||||||||||||||||||||||||||||||||||||||||||||||||||||||||||||||||||||||||||||||||||||||||||||||||||||||||||||||||||||||||||||||||||||||||||||||||||||||||||||||||||||||||||||||||||||||||||||||||||||||||||||||||||||||||||||||||||||||||||||||||||||||||||||||||||||||||||||||||||||||||||||||||||||||||||||||||||
| |
| Phenotypic Information (metabolism pathway, cancer, disease, phenome) |
| |
| |
| Gene-Gene Network Information: Co-Expression Network, Interacting Genes & KEGG |
| |
|


| Gene Summary for PROS1 |
| Top |
| Phenotypic Information for PROS1(metabolism pathway, cancer, disease, phenome) |
| Cancer | CGAP: PROS1 |
| Familial Cancer Database: PROS1 | |
| * This gene is included in those cancer gene databases. |
|
|
|
|
|
| . | |||||||||||||||||||||||||||||||||||||||||||||||||||||||||||||||||||||||||||||||||||||||||||||||||||||||||||||||||||||||||||||||||||||||||||||||||||||||||||||||||||||||||||||||||||||||||||||||||||||||||||||||||||||||||||||||||||||||||||||||||||||||||||||||||||||||||||||||||||||||||||||||||||||||||||||||||||||||||||||||||||||||||||||||||||||||||
Oncogene 1 | Significant driver gene in | ||||||||||||||||||||||||||||||||||||||||||||||||||||||||||||||||||||||||||||||||||||||||||||||||||||||||||||||||||||||||||||||||||||||||||||||||||||||||||||||||||||||||||||||||||||||||||||||||||||||||||||||||||||||||||||||||||||||||||||||||||||||||||||||||||||||||||||||||||||||||||||||||||||||||||||||||||||||||||||||||||||||||||||||||||||||||||||||
| cf) number; DB name 1 Oncogene; http://nar.oxfordjournals.org/content/35/suppl_1/D721.long, 2 Tumor Suppressor gene; https://bioinfo.uth.edu/TSGene/, 3 Cancer Gene Census; http://www.nature.com/nrc/journal/v4/n3/abs/nrc1299.html, 4 CancerGenes; http://nar.oxfordjournals.org/content/35/suppl_1/D721.long, 5 Network of Cancer Gene; http://ncg.kcl.ac.uk/index.php, 1Therapeutic Vulnerabilities in Cancer; http://cbio.mskcc.org/cancergenomics/statius/ |
| REACTOME_METABOLISM_OF_PROTEINS | |
| OMIM | 176880; gene. 612336; phenotype. 614514; phenotype. |
| Orphanet | 743; Hereditary thrombophilia due to congenital protein S deficiency. |
| Disease | KEGG Disease: PROS1 |
| MedGen: PROS1 (Human Medical Genetics with Condition) | |
| ClinVar: PROS1 | |
| Phenotype | MGI: PROS1 (International Mouse Phenotyping Consortium) |
| PhenomicDB: PROS1 | |
| Mutations for PROS1 |
| * Under tables are showing count per each tissue to give us broad intuition about tissue specific mutation patterns.You can go to the detailed page for each mutation database's web site. |
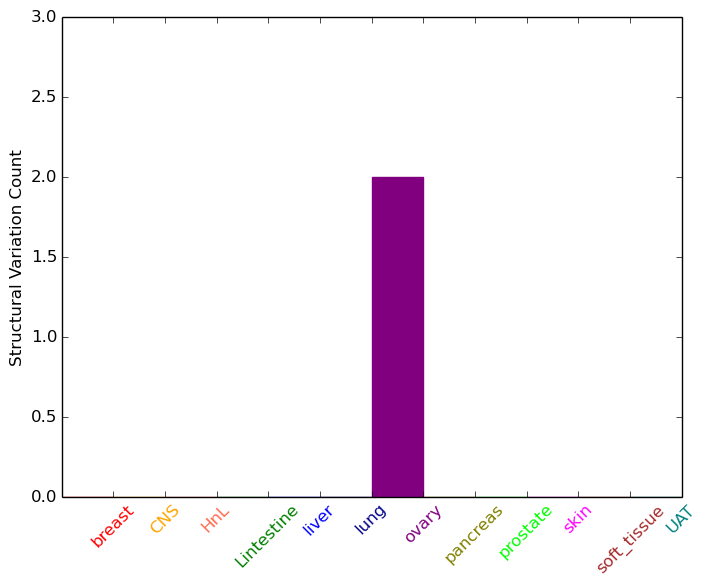
| - Statistics for Tissue and Mutation type | Top |
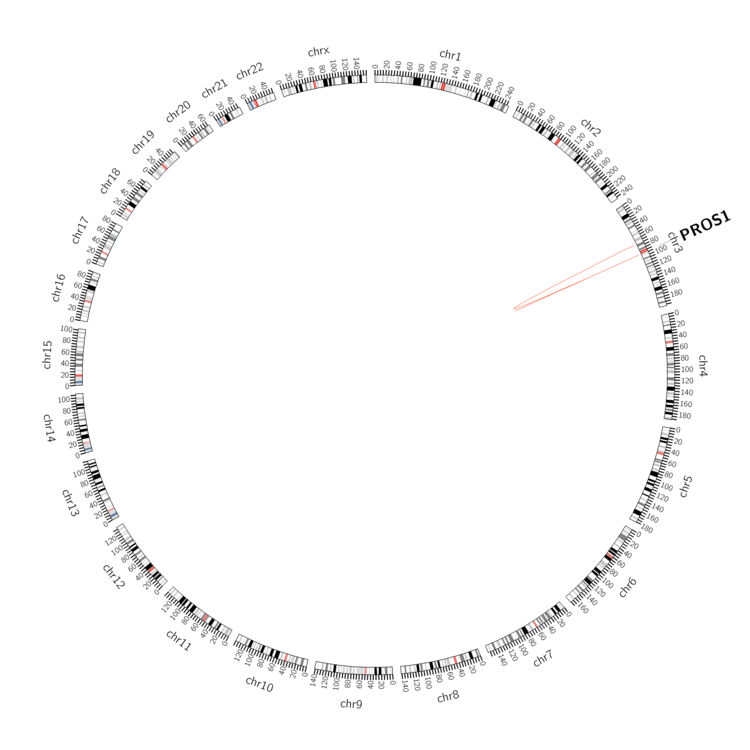 |
| - For Inter-chromosomal Variations |
| There's no inter-chromosomal structural variation. |
| - For Intra-chromosomal Variations |
| * Intra-chromosomal variantions includes 'intrachromosomal amplicon to amplicon', 'intrachromosomal amplicon to non-amplified dna', 'intrachromosomal deletion', 'intrachromosomal fold-back inversion', 'intrachromosomal inversion', 'intrachromosomal tandem duplication', 'Intrachromosomal unknown type', 'intrachromosomal with inverted orientation', 'intrachromosomal with non-inverted orientation'. |
 |
| Sample | Symbol_a | Chr_a | Start_a | End_a | Symbol_b | Chr_b | Start_b | End_b |
| ovary | PROS1 | chr3 | 93647956 | 93647976 | PROS1 | chr3 | 93648128 | 93648148 |
| ovary | PROS1 | chr3 | 93676151 | 93676171 | chr3 | 73753822 | 73753842 |
| cf) Tissue number; Tissue name (1;Breast, 2;Central_nervous_system, 3;Haematopoietic_and_lymphoid_tissue, 4;Large_intestine, 5;Liver, 6;Lung, 7;Ovary, 8;Pancreas, 9;Prostate, 10;Skin, 11;Soft_tissue, 12;Upper_aerodigestive_tract) |
| * From mRNA Sanger sequences, Chitars2.0 arranged chimeric transcripts. This table shows PROS1 related fusion information. |
| ID | Head Gene | Tail Gene | Accession | Gene_a | qStart_a | qEnd_a | Chromosome_a | tStart_a | tEnd_a | Gene_a | qStart_a | qEnd_a | Chromosome_a | tStart_a | tEnd_a |
| BE185151 | SDC1 | 12 | 180 | 2 | 20401901 | 20402069 | PROS1 | 176 | 433 | 3 | 93628822 | 93629079 | |
| AW579277 | PROS1 | 1 | 237 | 3 | 93678727 | 93678963 | GLUL | 231 | 294 | 1 | 182353484 | 182353547 | |
| Top |
| Mutation type/ Tissue ID | brca | cns | cerv | endome | haematopo | kidn | Lintest | liver | lung | ns | ovary | pancre | prost | skin | stoma | thyro | urina | |||
| Total # sample | 1 | 1 | ||||||||||||||||||
| GAIN (# sample) | 1 | 1 | ||||||||||||||||||
| LOSS (# sample) |
| cf) Tissue ID; Tissue type (1; Breast, 2; Central_nervous_system, 3; Cervix, 4; Endometrium, 5; Haematopoietic_and_lymphoid_tissue, 6; Kidney, 7; Large_intestine, 8; Liver, 9; Lung, 10; NS, 11; Ovary, 12; Pancreas, 13; Prostate, 14; Skin, 15; Stomach, 16; Thyroid, 17; Urinary_tract) |
| Top |
|
 |
| Top |
| Stat. for Non-Synonymous SNVs (# total SNVs=111) | (# total SNVs=22) |
 |  |
(# total SNVs=0) | (# total SNVs=1) |
 |
| Top |
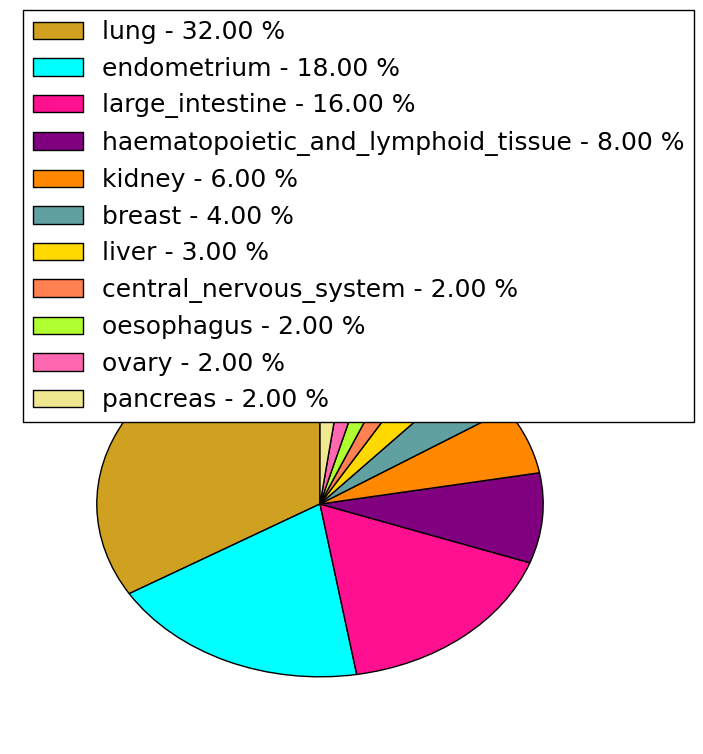
| * When you move the cursor on each content, you can see more deailed mutation information on the Tooltip. Those are primary_site,primary_histology,mutation(aa),pubmedID. |
| GRCh37 position | Mutation(aa) | Unique sampleID count |
| chr3:93615439-93615439 | p.R316C | 5 |
| chr3:93646100-93646100 | p.P76P | 3 |
| chr3:93595919-93595919 | p.S587S | 2 |
| chr3:93598096-93598096 | p.G519S | 2 |
| chr3:93603584-93603584 | p.H494Y | 2 |
| chr3:93617331-93617331 | p.K270N | 2 |
| chr3:93611944-93611944 | p.R330W | 2 |
| chr3:93619687-93619687 | p.E230K | 2 |
| chr3:93598107-93598107 | p.R515H | 2 |
| chr3:93624637-93624637 | p.D198Y | 2 |
| Top |
|
 |
| Point Mutation/ Tissue ID | 1 | 2 | 3 | 4 | 5 | 6 | 7 | 8 | 9 | 10 | 11 | 12 | 13 | 14 | 15 | 16 | 17 | 18 | 19 | 20 |
| # sample | 4 | 1 | 12 | 2 | 4 | 2 | 2 | 21 | 7 | 2 | 1 | 13 | 11 | 1 | 17 | |||||
| # mutation | 4 | 1 | 15 | 2 | 4 | 2 | 2 | 24 | 7 | 2 | 1 | 13 | 11 | 1 | 24 | |||||
| nonsynonymous SNV | 4 | 1 | 11 | 1 | 4 | 2 | 2 | 21 | 5 | 2 | 1 | 12 | 7 | 1 | 18 | |||||
| synonymous SNV | 4 | 1 | 3 | 2 | 1 | 4 | 6 |
| cf) Tissue ID; Tissue type (1; BLCA[Bladder Urothelial Carcinoma], 2; BRCA[Breast invasive carcinoma], 3; CESC[Cervical squamous cell carcinoma and endocervical adenocarcinoma], 4; COAD[Colon adenocarcinoma], 5; GBM[Glioblastoma multiforme], 6; Glioma Low Grade, 7; HNSC[Head and Neck squamous cell carcinoma], 8; KICH[Kidney Chromophobe], 9; KIRC[Kidney renal clear cell carcinoma], 10; KIRP[Kidney renal papillary cell carcinoma], 11; LAML[Acute Myeloid Leukemia], 12; LUAD[Lung adenocarcinoma], 13; LUSC[Lung squamous cell carcinoma], 14; OV[Ovarian serous cystadenocarcinoma ], 15; PAAD[Pancreatic adenocarcinoma], 16; PRAD[Prostate adenocarcinoma], 17; SKCM[Skin Cutaneous Melanoma], 18:STAD[Stomach adenocarcinoma], 19:THCA[Thyroid carcinoma], 20:UCEC[Uterine Corpus Endometrial Carcinoma]) |
| Top |
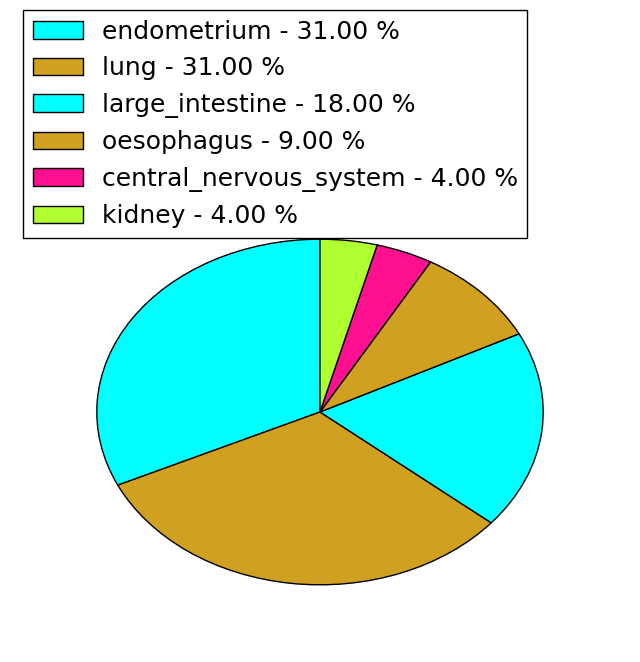
| * We represented just top 10 SNVs. When you move the cursor on each content, you can see more deailed mutation information on the Tooltip. Those are primary_site, primary_histology, mutation(aa), pubmedID. |
| Genomic Position | Mutation(aa) | Unique sampleID count |
| chr3:93598107 | p.R316C | 3 |
| chr3:93615439 | p.R515H | 3 |
| chr3:93646100 | p.P76P | 2 |
| chr3:93595919 | p.S587S | 2 |
| chr3:93617331 | p.K270N | 2 |
| chr3:93603626 | p.S501S | 1 |
| chr3:93615497 | p.P416P | 1 |
| chr3:93624914 | p.D333N | 1 |
| chr3:93605255 | p.N258N | 1 |
| chr3:93617367 | p.G170C | 1 |
| * Copy number data were extracted from TCGA using R package TCGA-Assembler. The URLs of all public data files on TCGA DCC data server were gathered on Jan-05-2015. Function ProcessCNAData in TCGA-Assembler package was used to obtain gene-level copy number value which is calculated as the average copy number of the genomic region of a gene. |
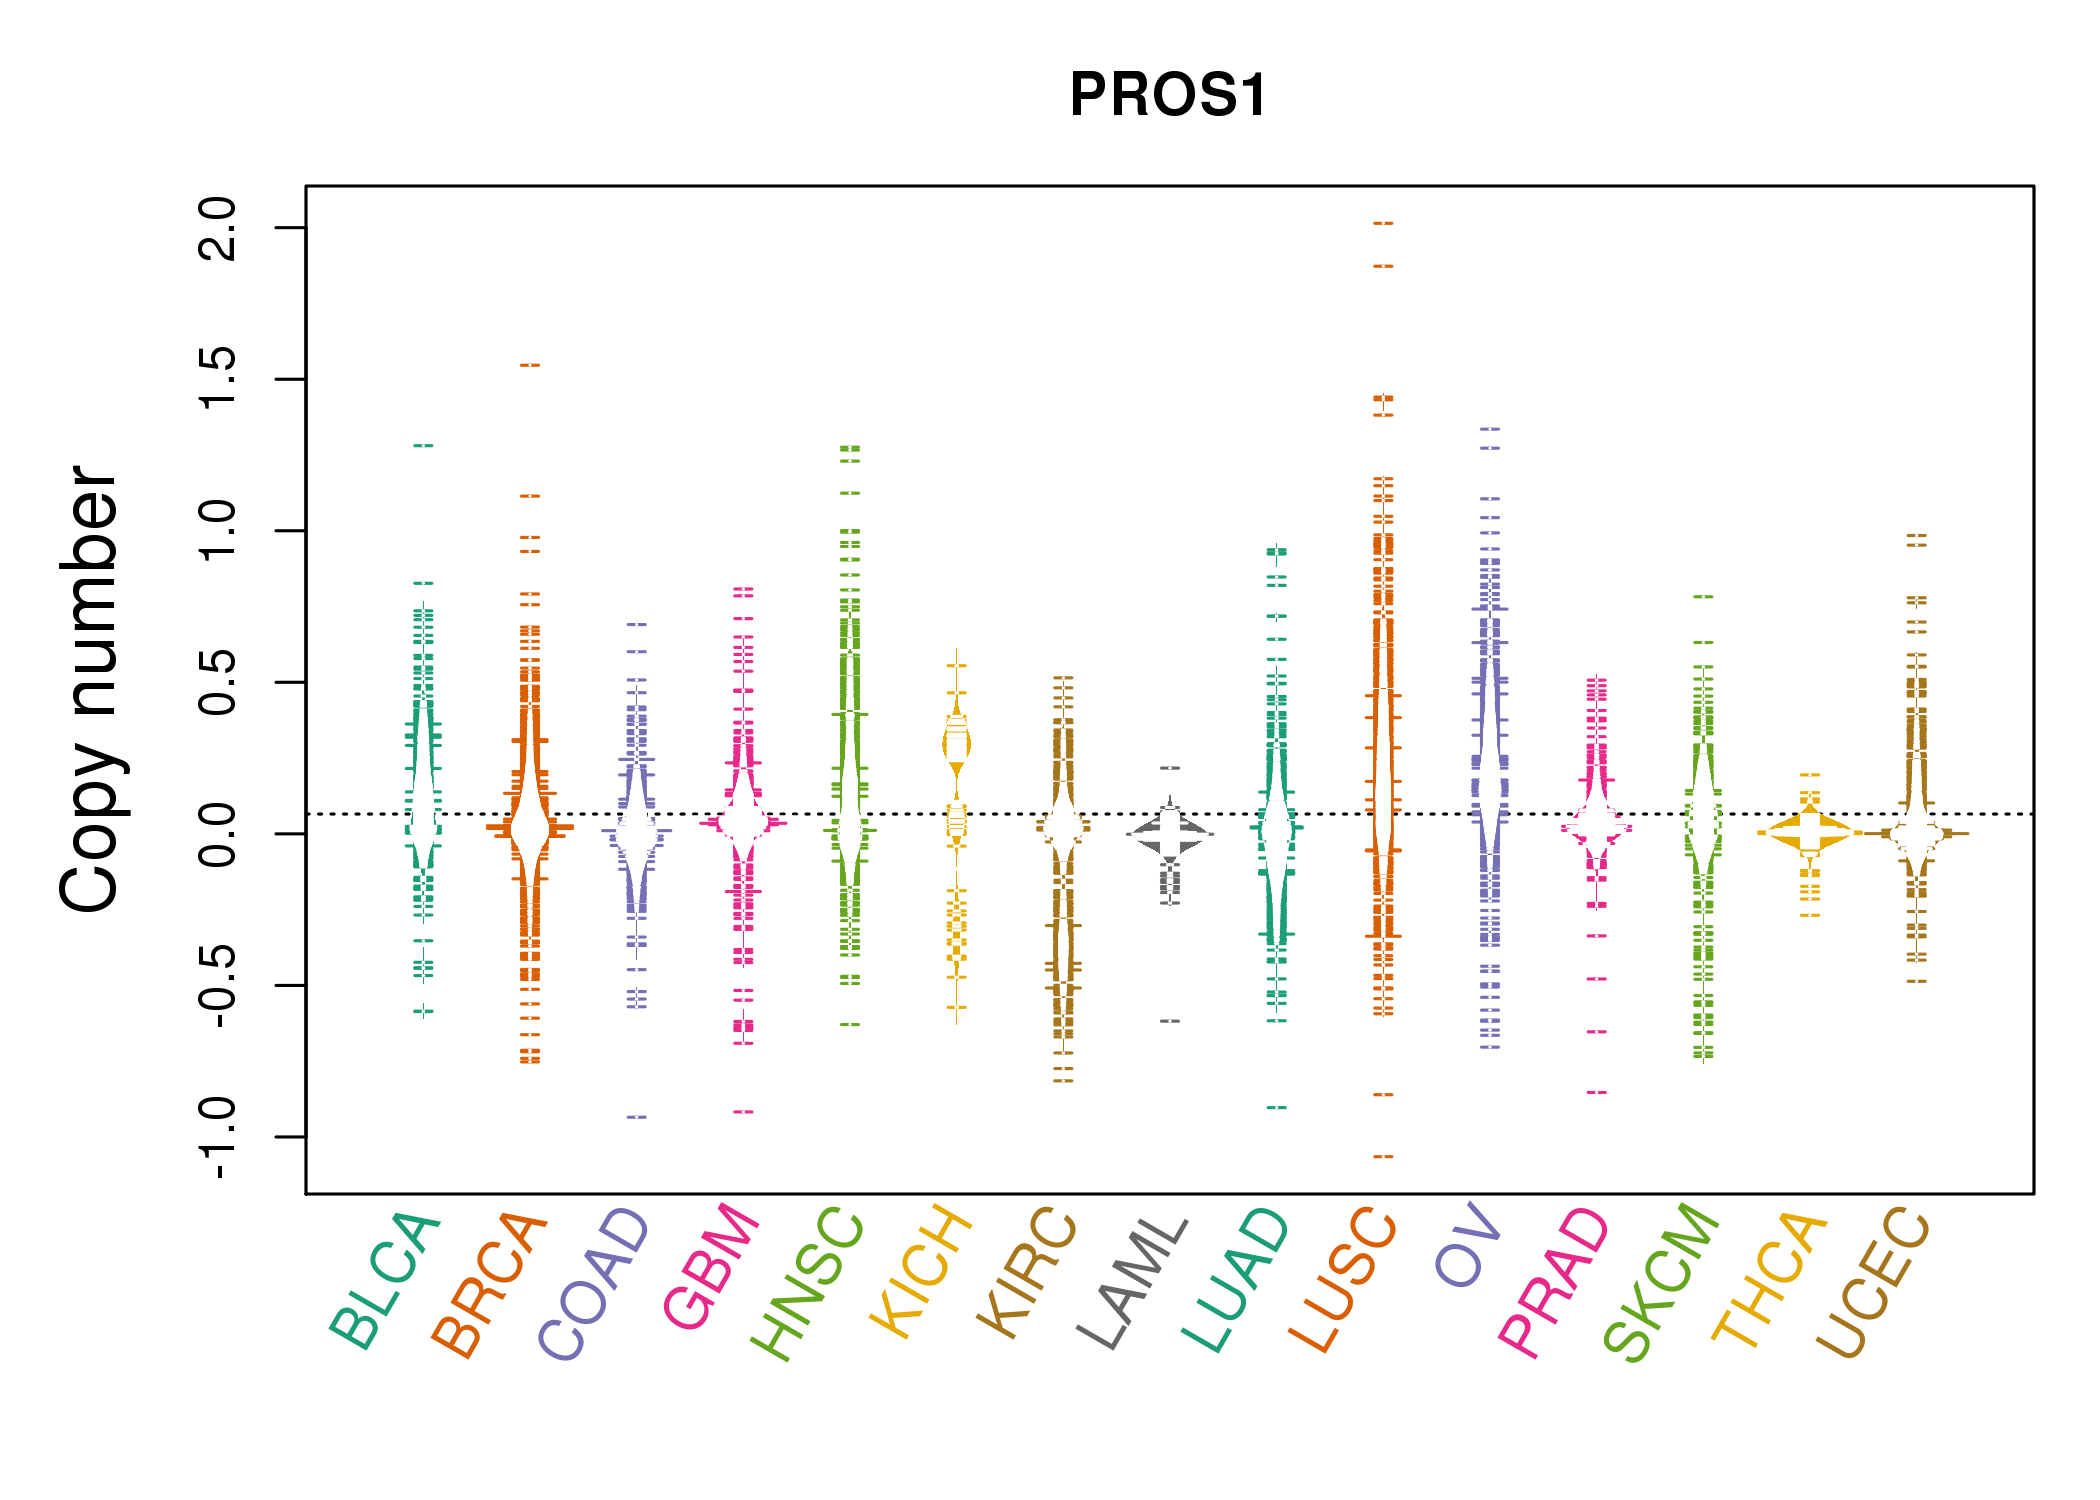 |
| cf) Tissue ID[Tissue type]: BLCA[Bladder Urothelial Carcinoma], BRCA[Breast invasive carcinoma], CESC[Cervical squamous cell carcinoma and endocervical adenocarcinoma], COAD[Colon adenocarcinoma], GBM[Glioblastoma multiforme], Glioma Low Grade, HNSC[Head and Neck squamous cell carcinoma], KICH[Kidney Chromophobe], KIRC[Kidney renal clear cell carcinoma], KIRP[Kidney renal papillary cell carcinoma], LAML[Acute Myeloid Leukemia], LUAD[Lung adenocarcinoma], LUSC[Lung squamous cell carcinoma], OV[Ovarian serous cystadenocarcinoma ], PAAD[Pancreatic adenocarcinoma], PRAD[Prostate adenocarcinoma], SKCM[Skin Cutaneous Melanoma], STAD[Stomach adenocarcinoma], THCA[Thyroid carcinoma], UCEC[Uterine Corpus Endometrial Carcinoma] |
| Top |
| Gene Expression for PROS1 |
| * CCLE gene expression data were extracted from CCLE_Expression_Entrez_2012-10-18.res: Gene-centric RMA-normalized mRNA expression data. |
 |
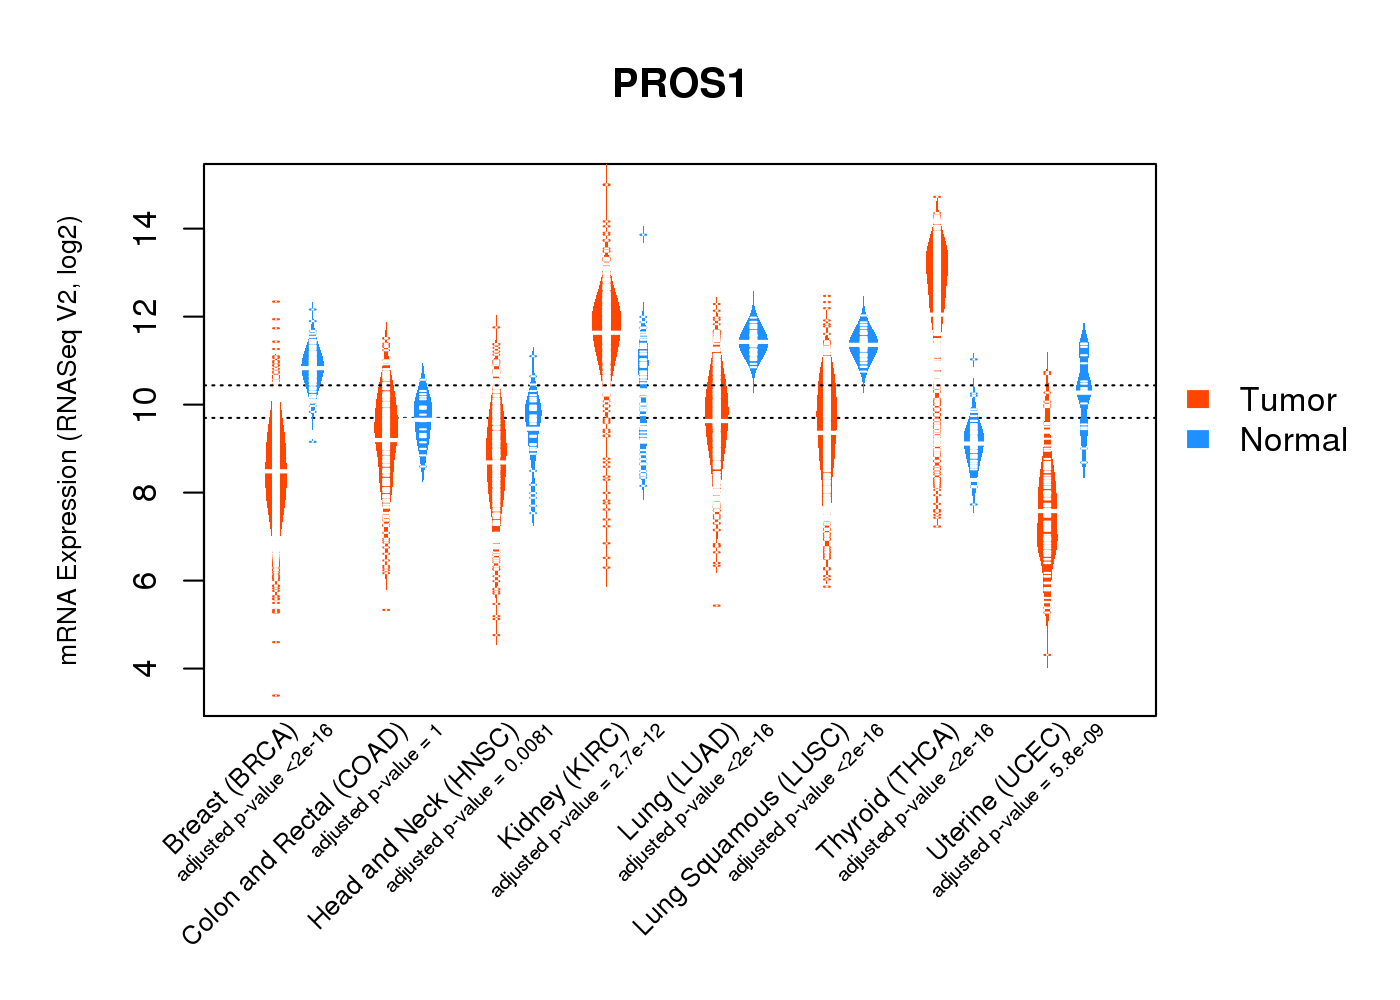
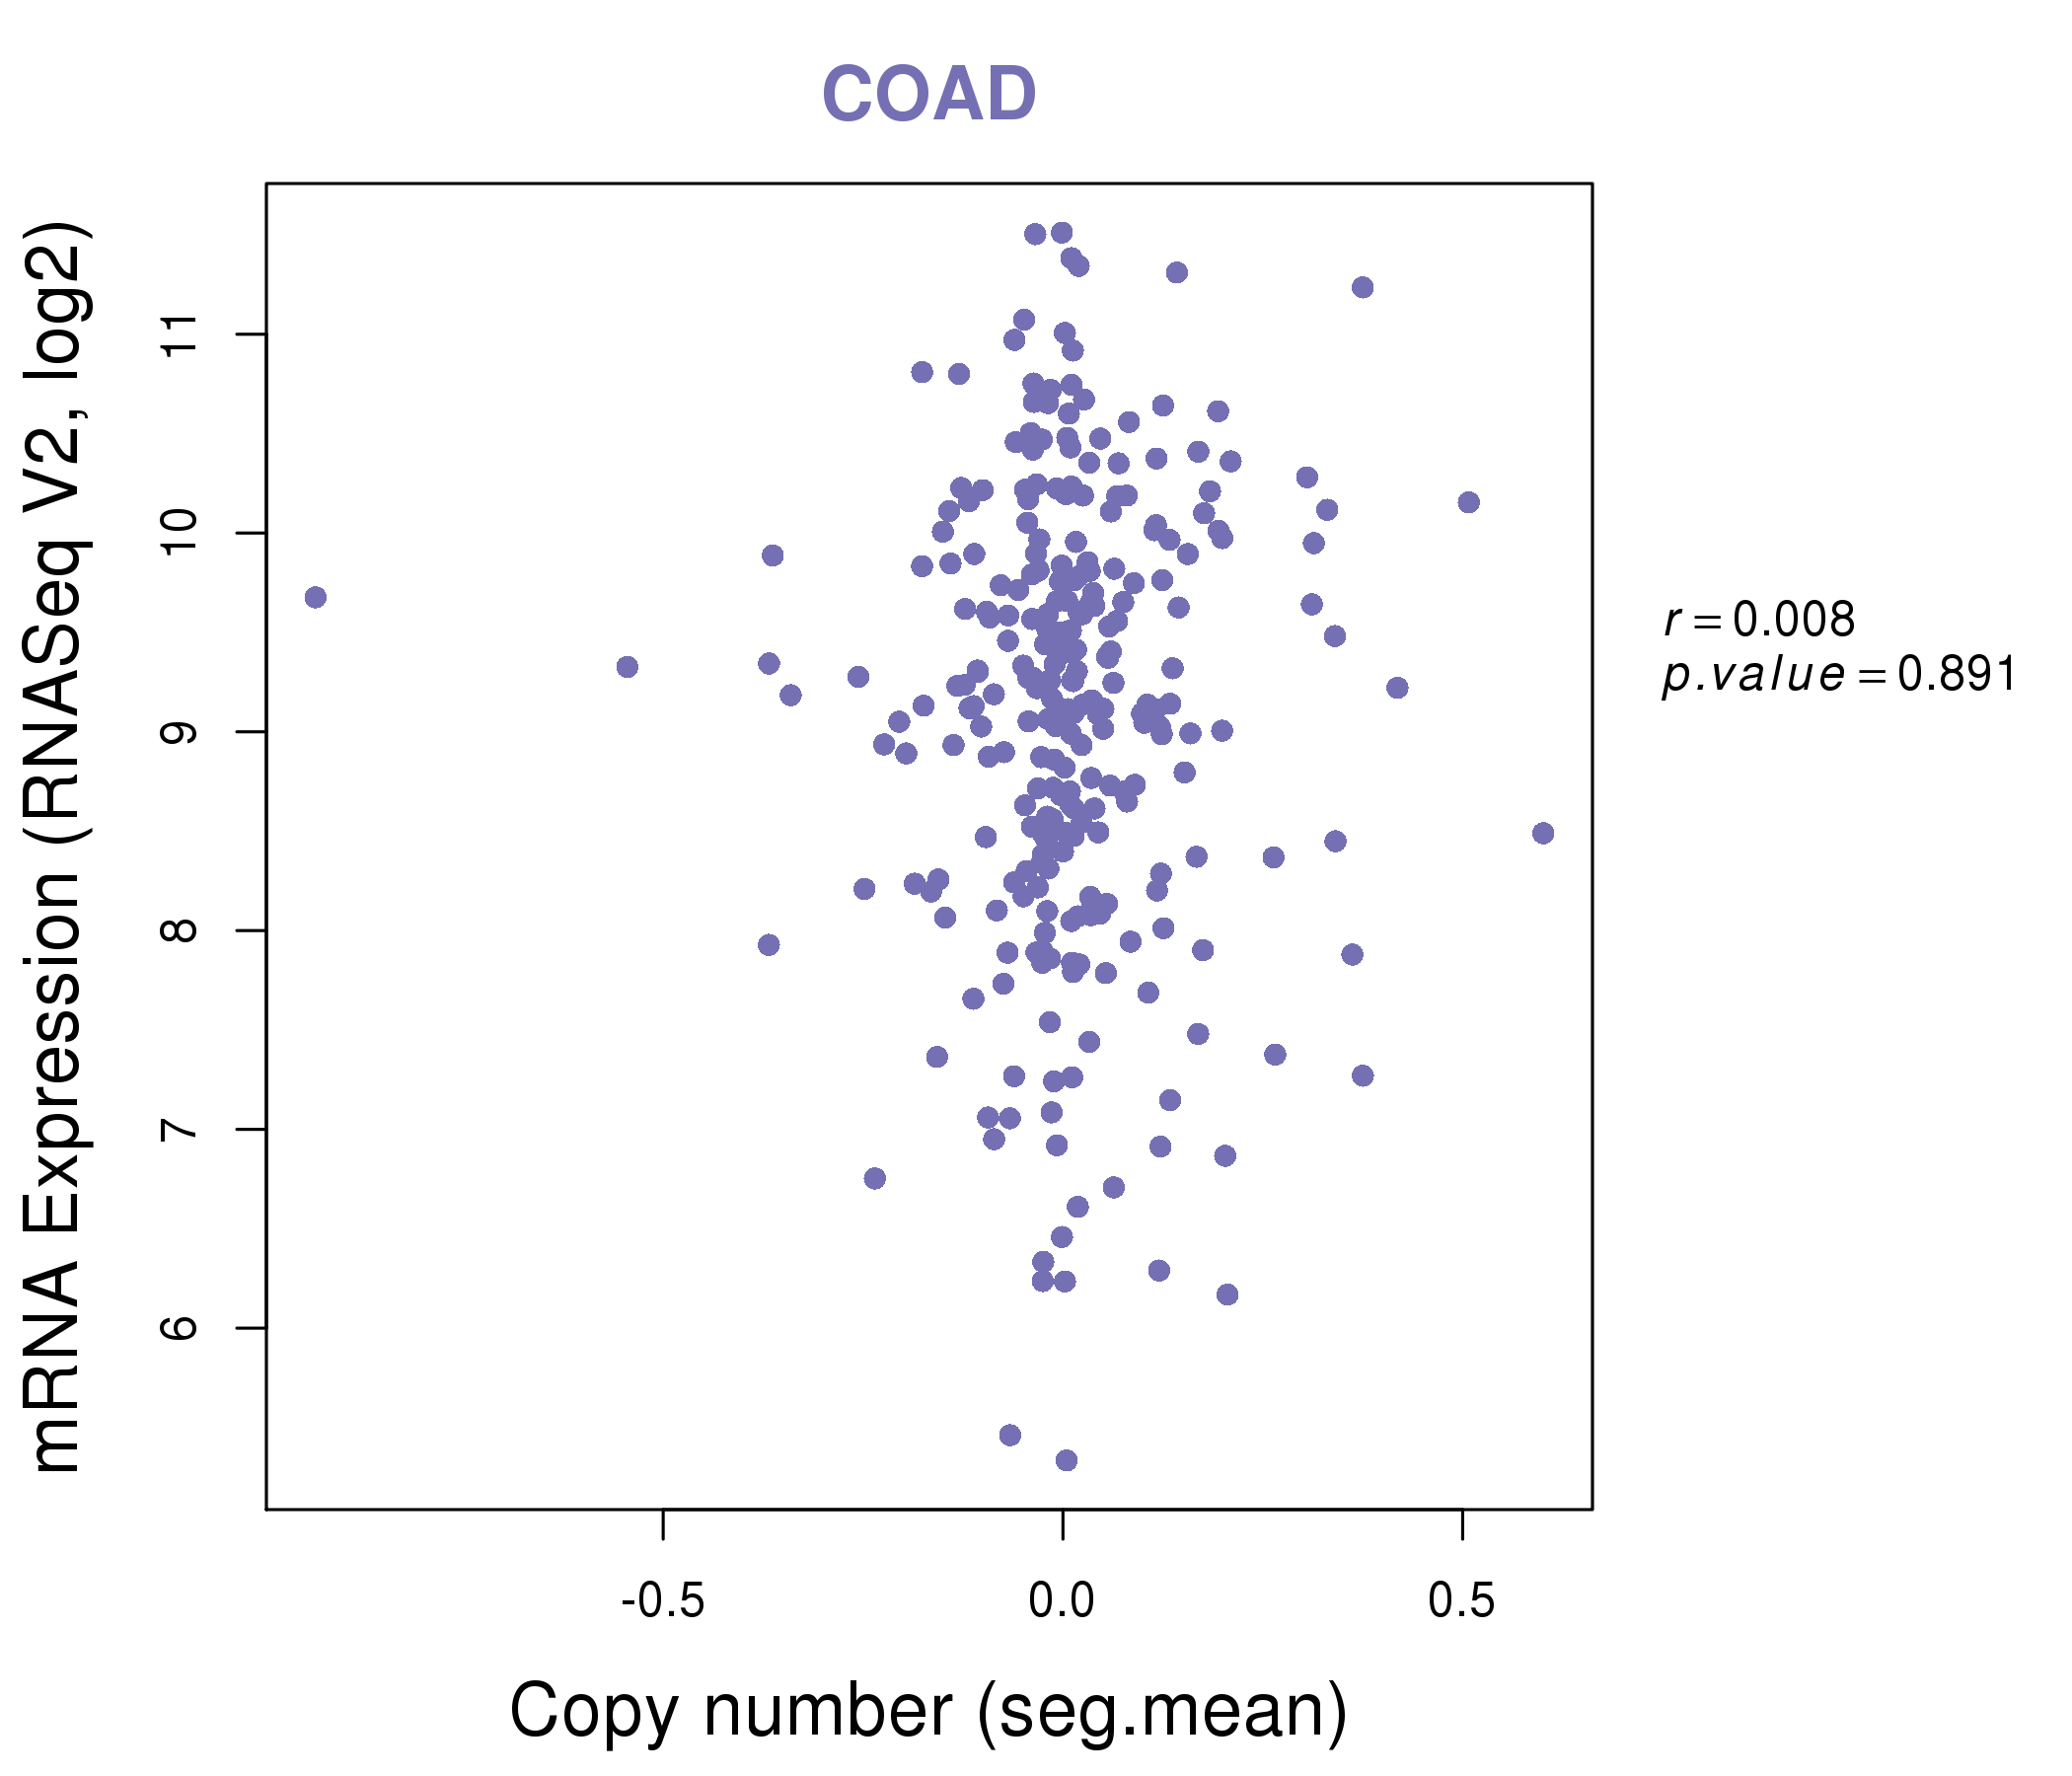
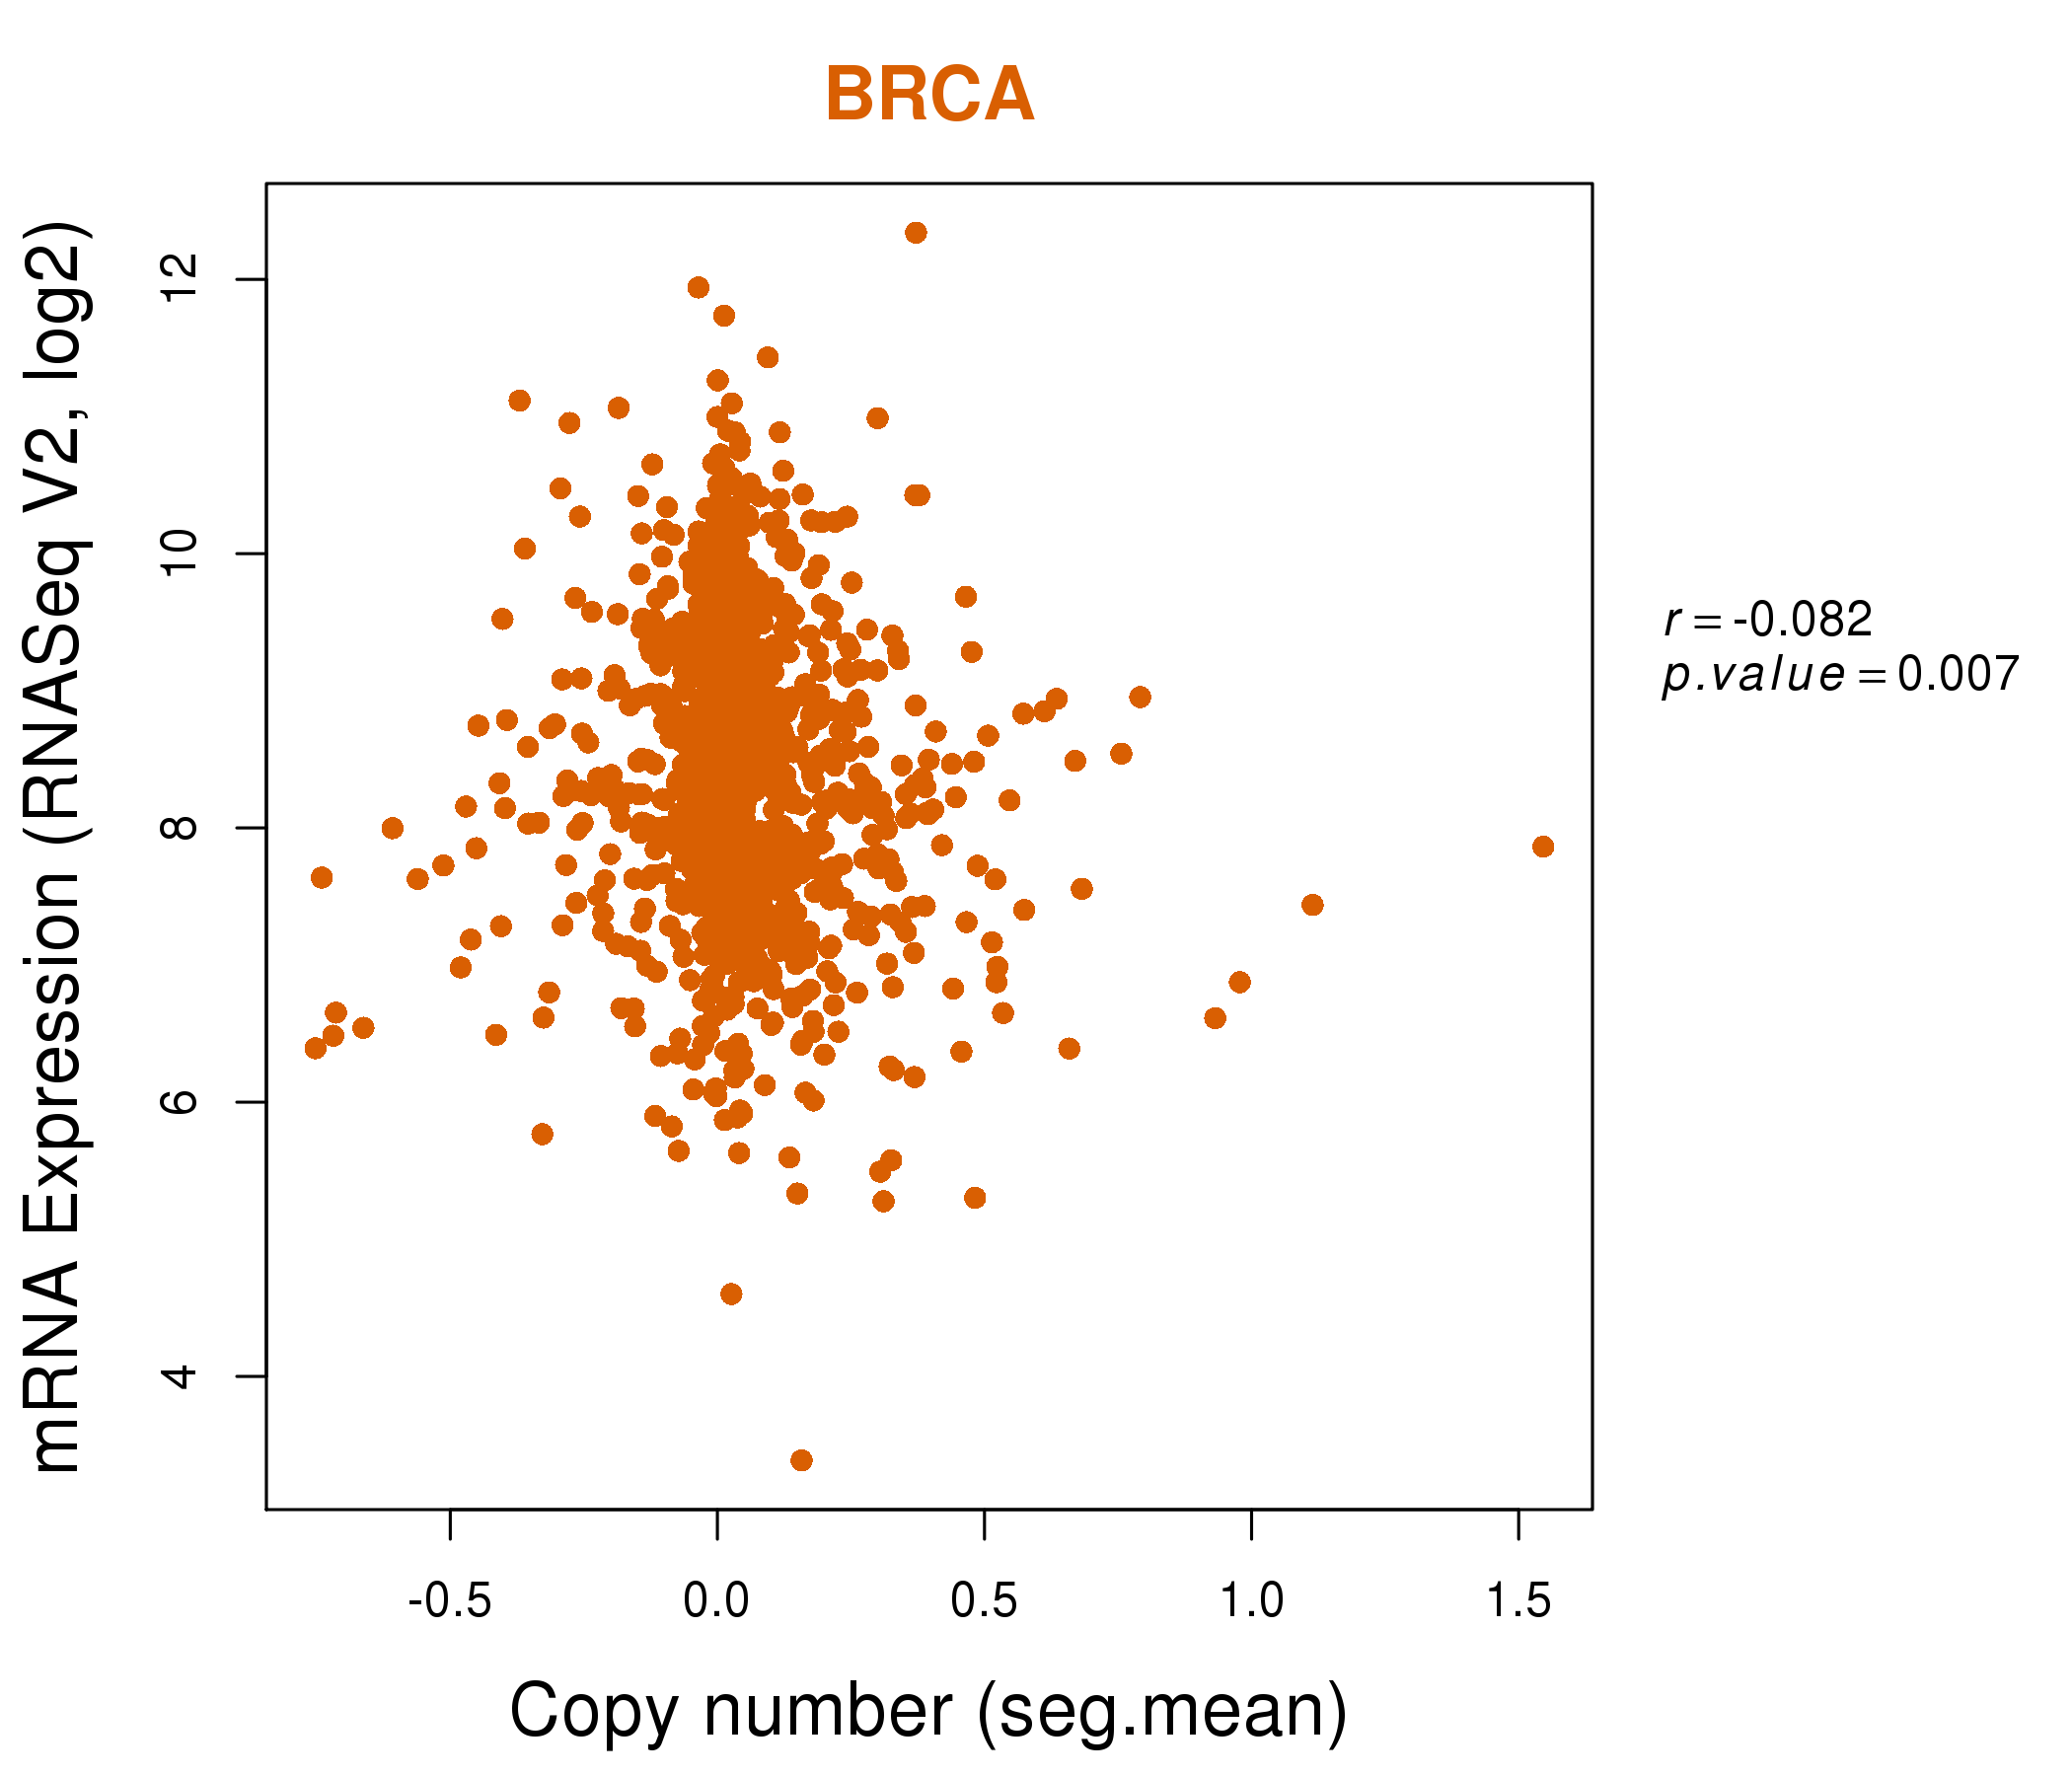
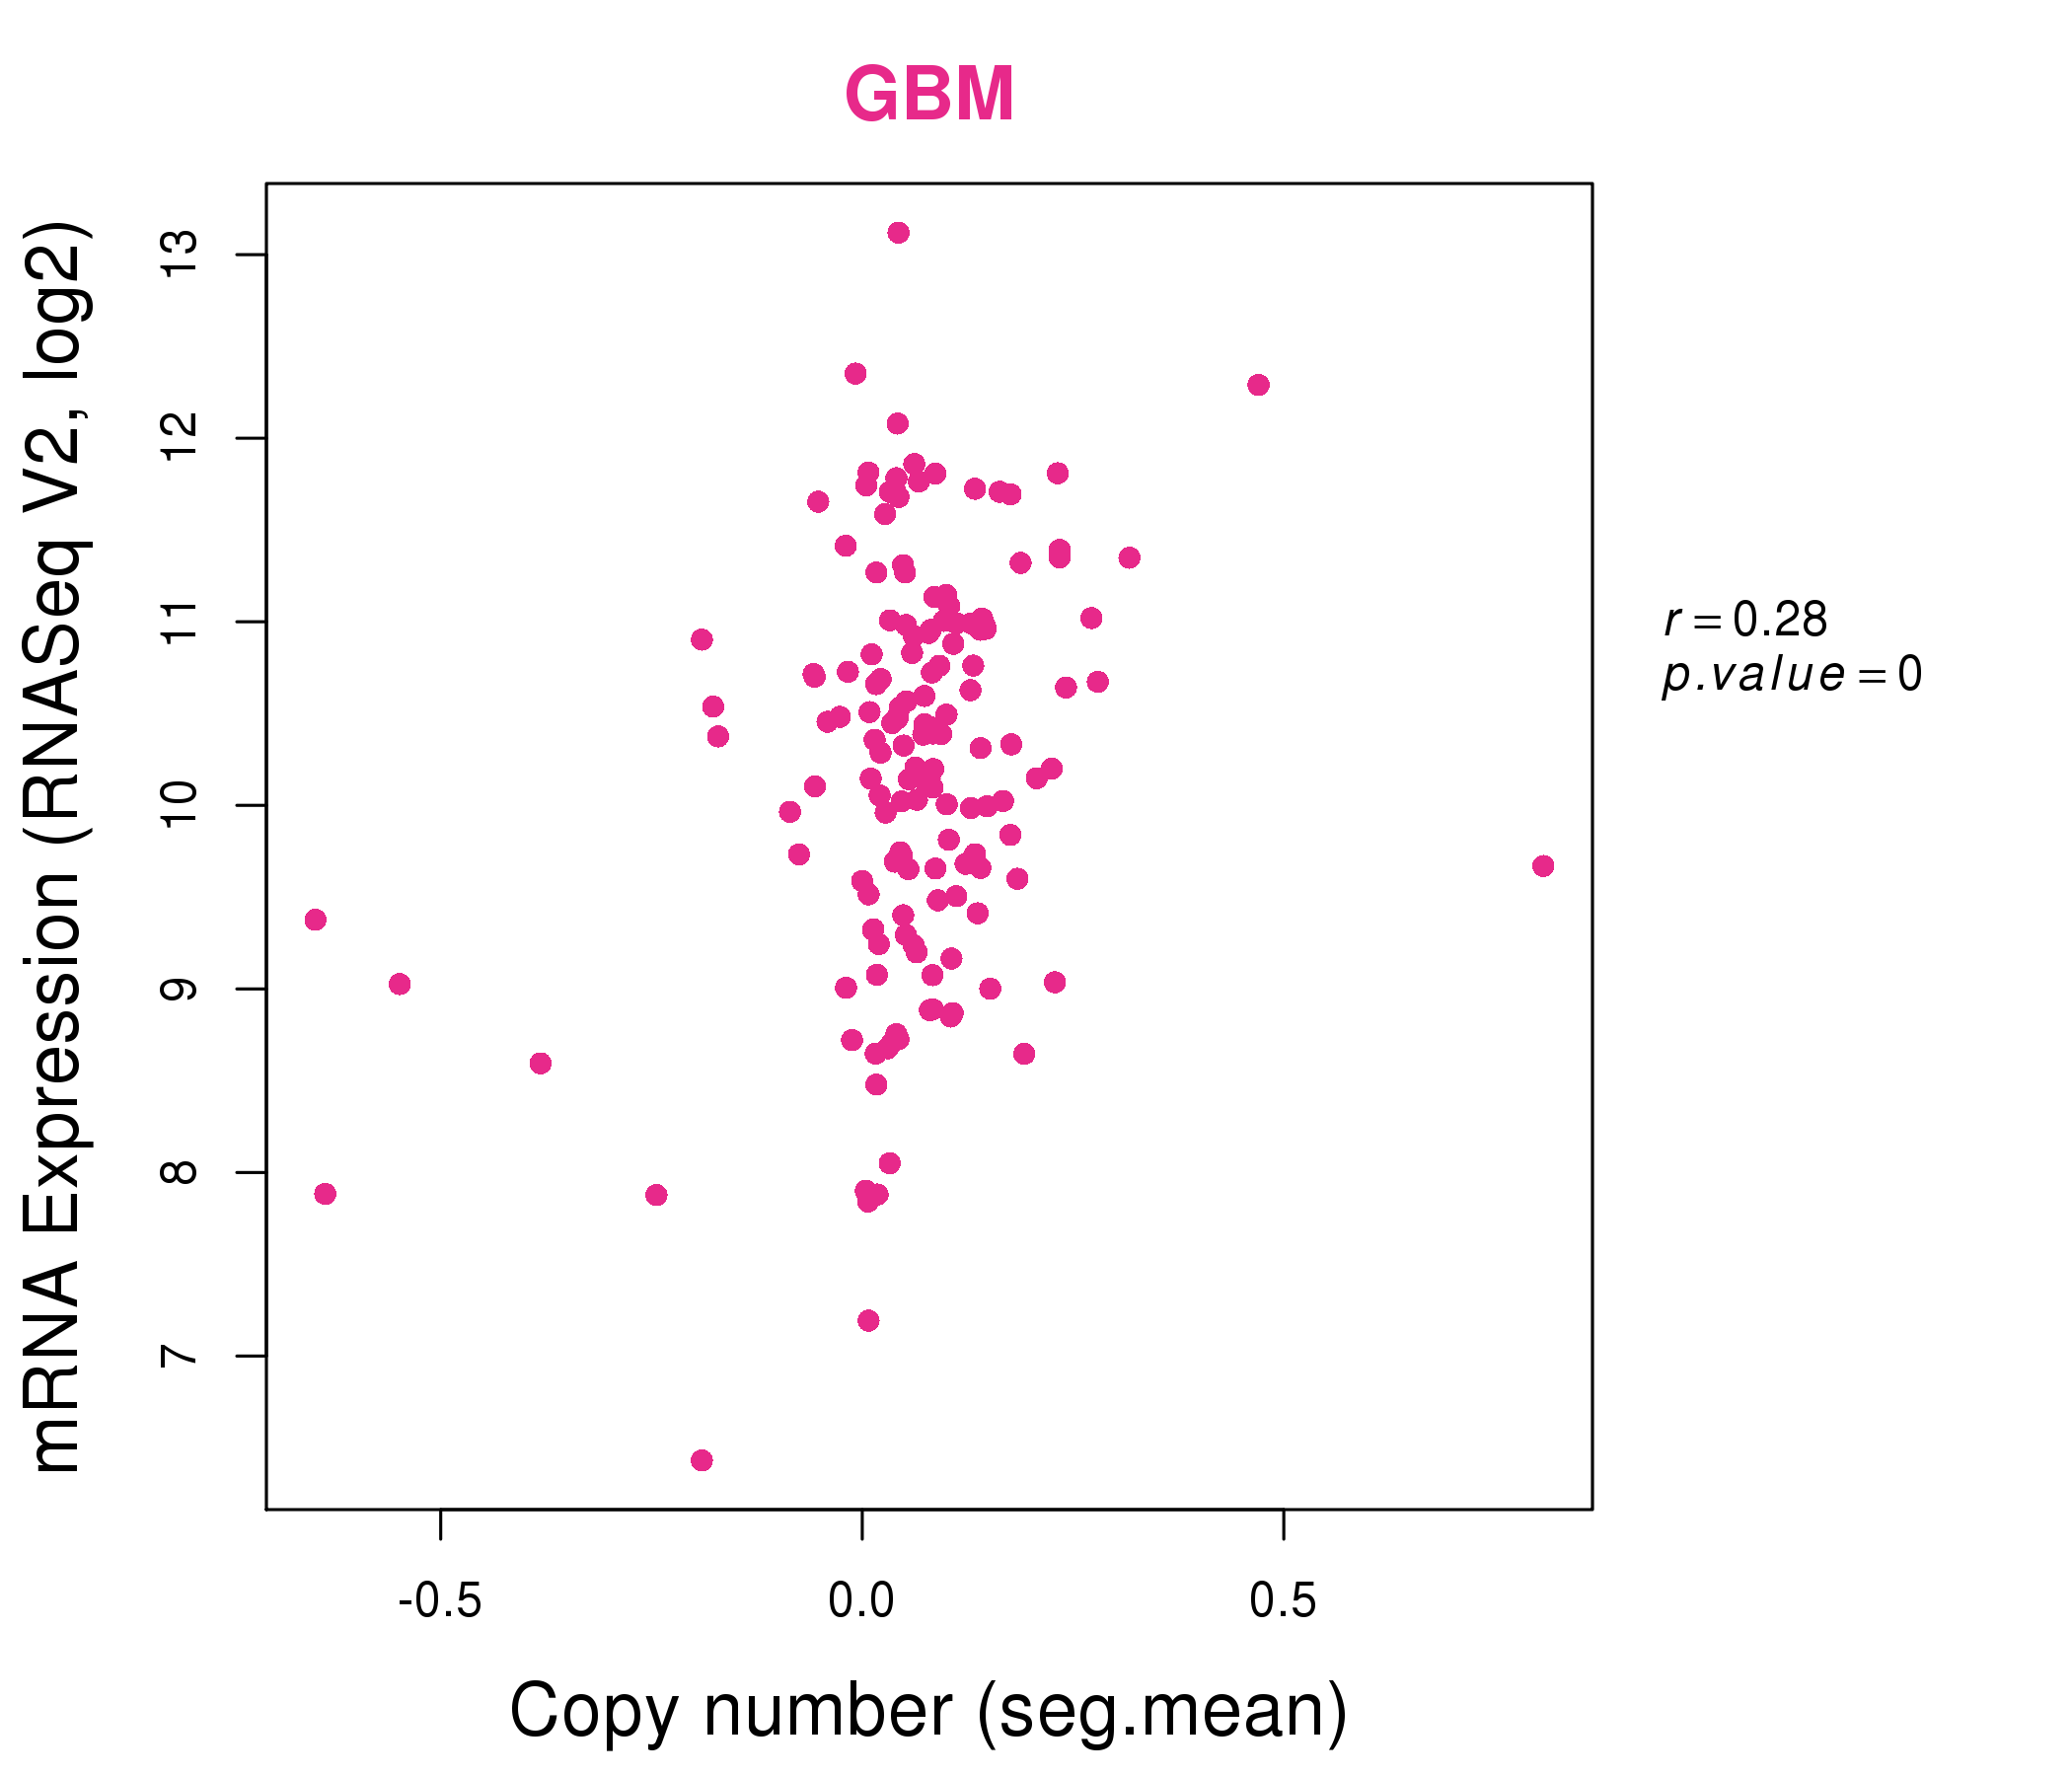
| * Normalized gene expression data of RNASeqV2 was extracted from TCGA using R package TCGA-Assembler. The URLs of all public data files on TCGA DCC data server were gathered at Jan-05-2015. Only eight cancer types have enough normal control samples for differential expression analysis. (t test, adjusted p<0.05 (using Benjamini-Hochberg FDR)) |
 |
| Top |
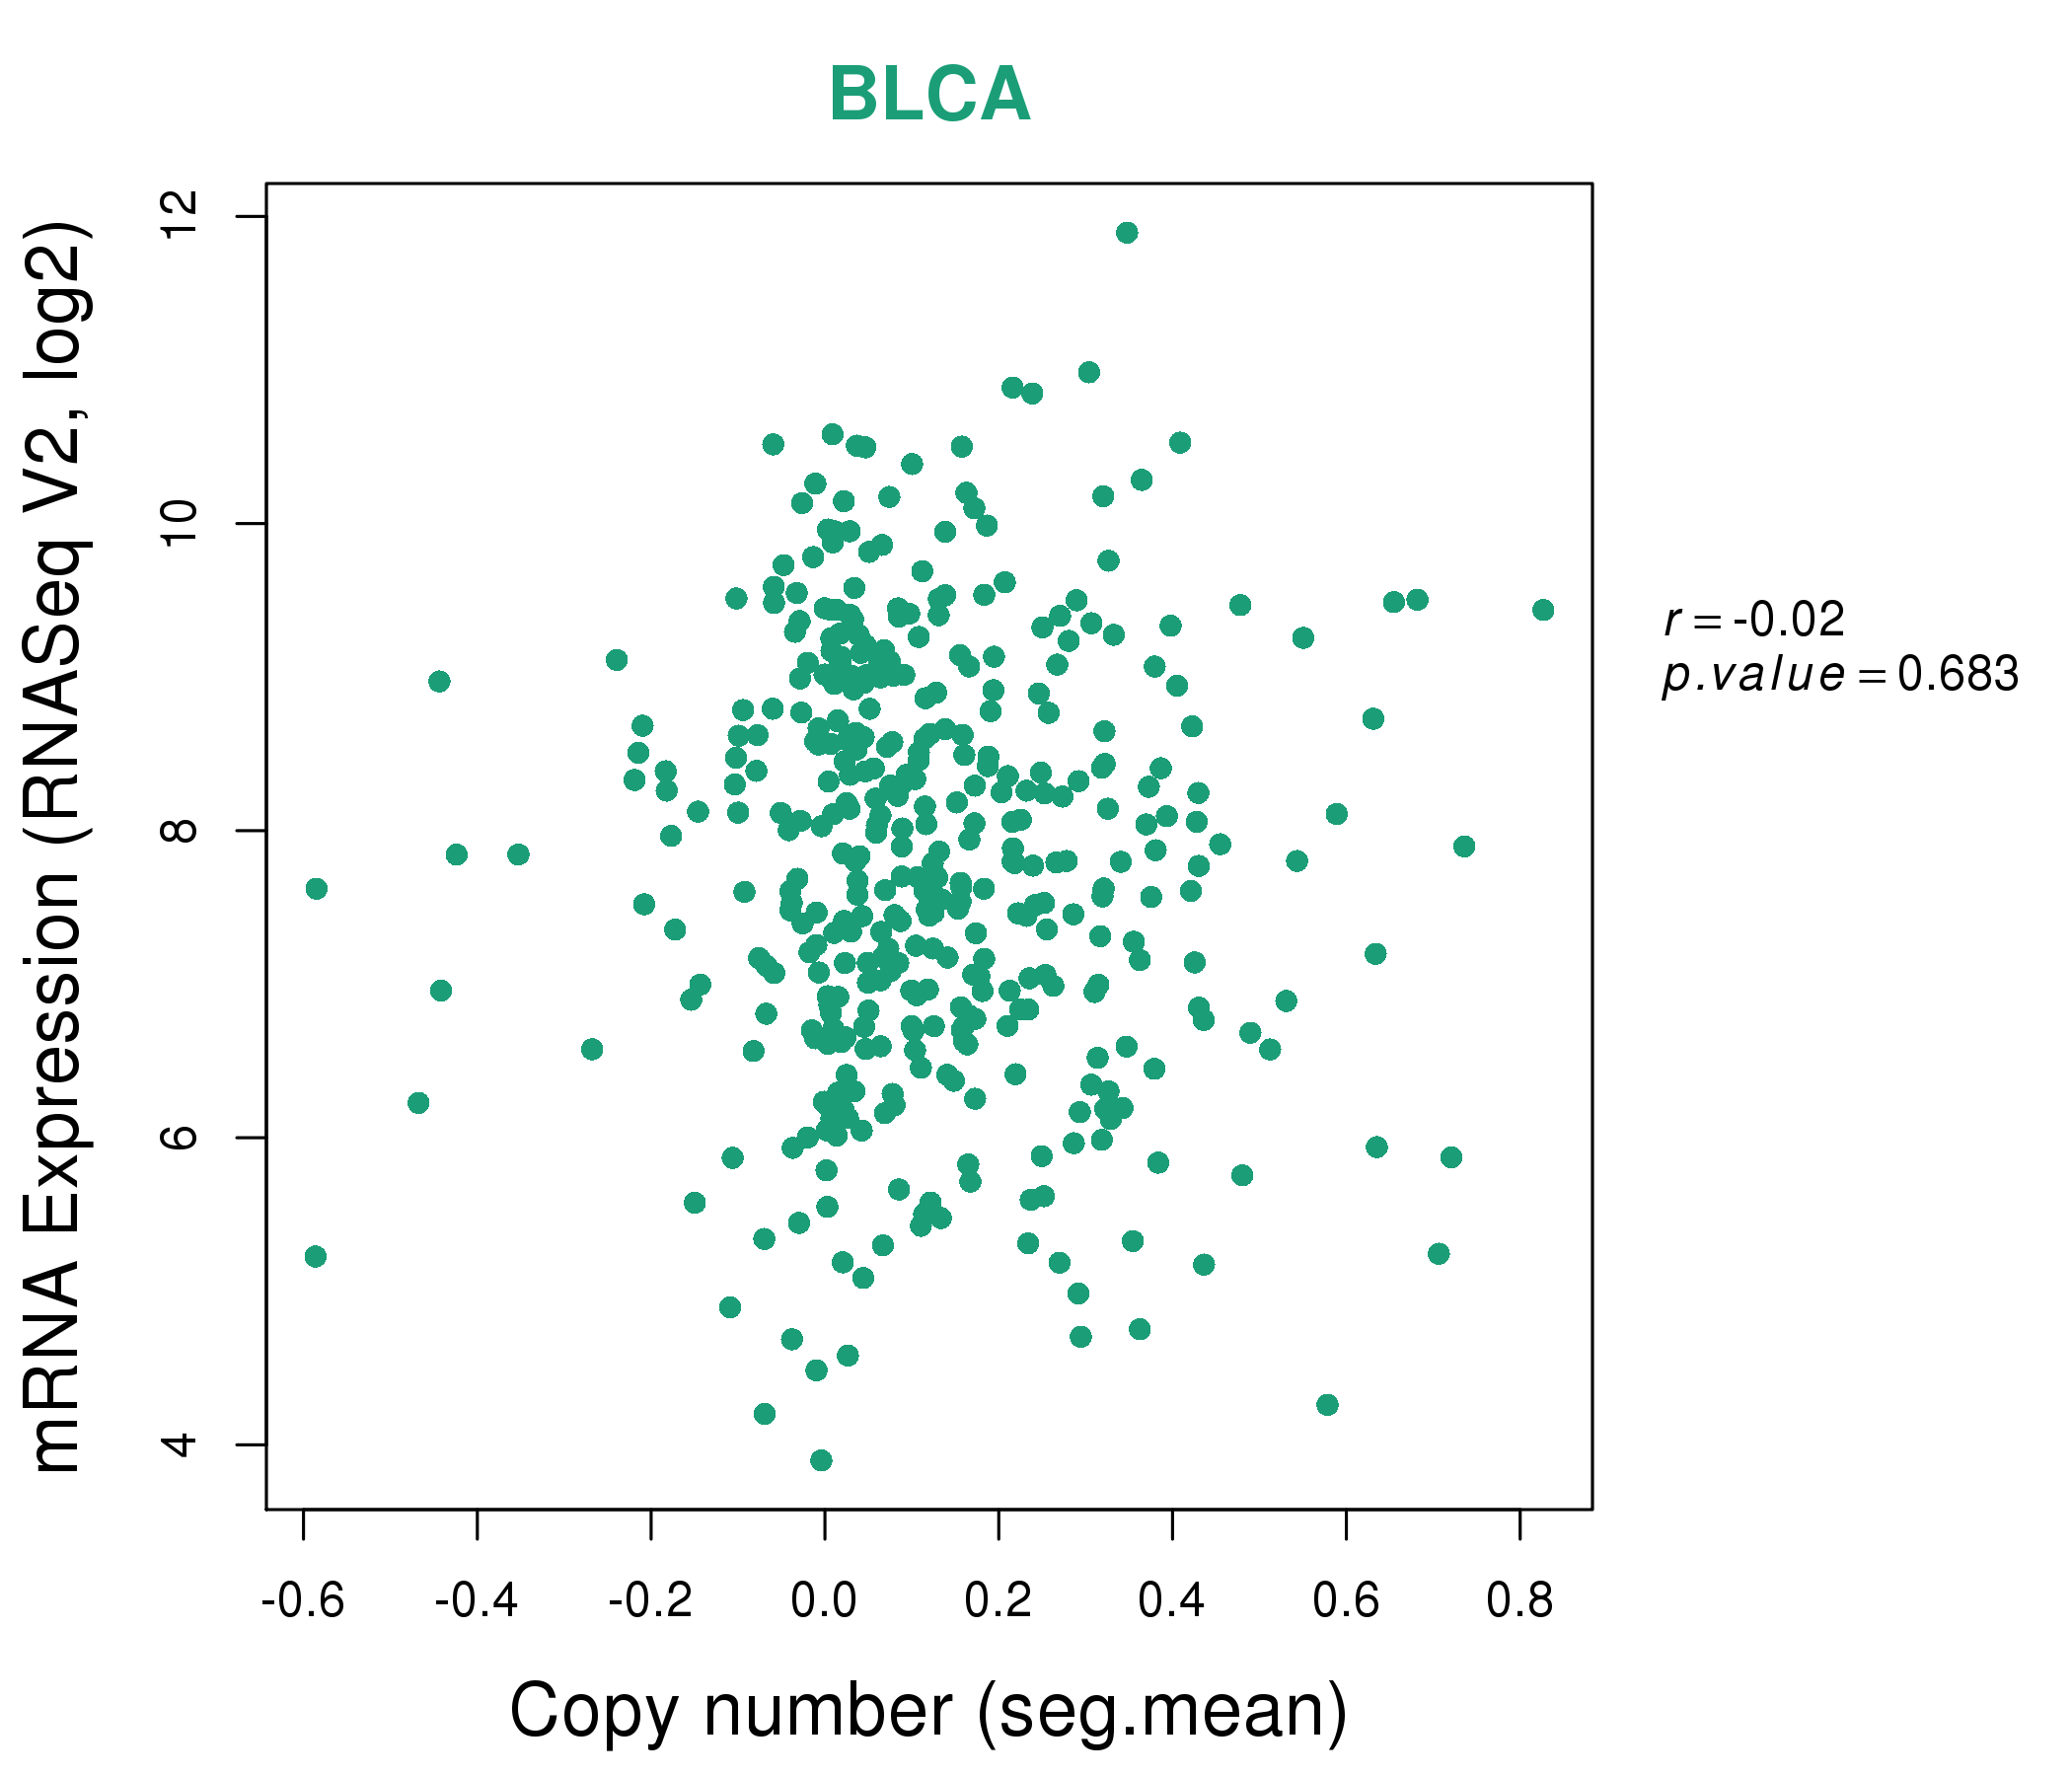
| * This plots show the correlation between CNV and gene expression. |
: Open all plots for all cancer types
 |
|
 |
|
| Top |
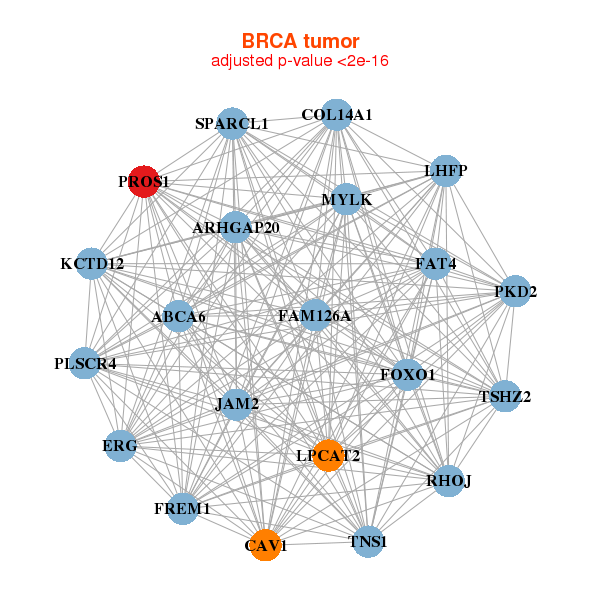
| Gene-Gene Network Information |
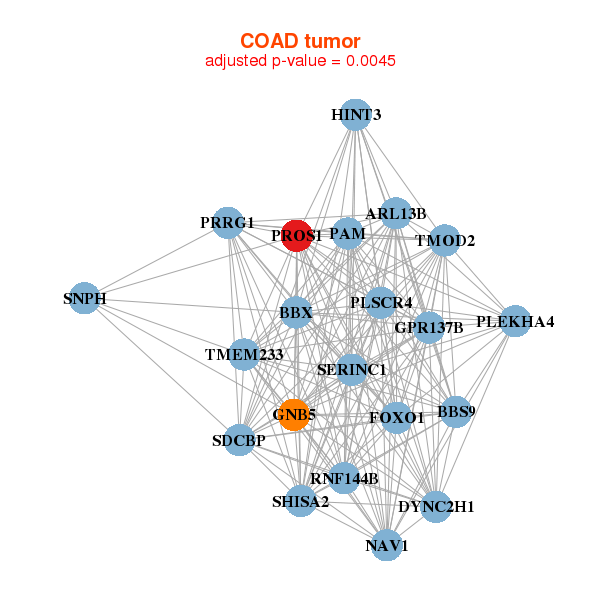
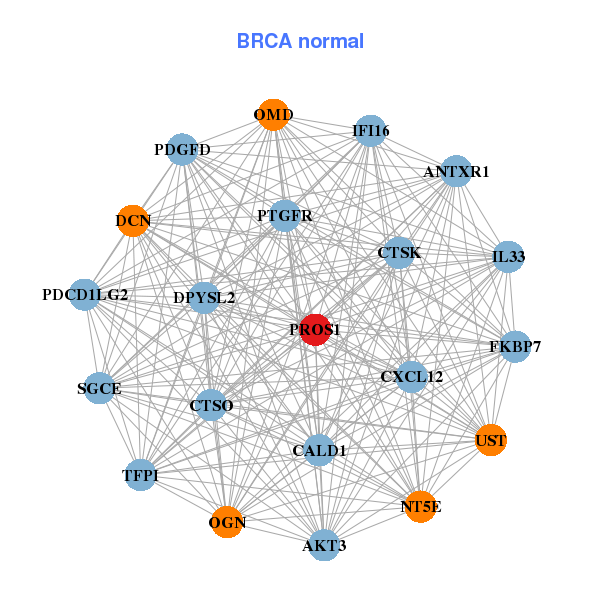
| * Co-Expression network figures were drawn using R package igraph. Only the top 20 genes with the highest correlations were shown. Red circle: input gene, orange circle: cell metabolism gene, sky circle: other gene |
: Open all plots for all cancer types
 |
| ||||
| ABCA6,ARHGAP20,CAV1,COL14A1,ERG,FAM126A,FAT4, FOXO1,FREM1,JAM2,KCTD12,LHFP,LPCAT2,MYLK, PKD2,PLSCR4,PROS1,RHOJ,SPARCL1,TNS1,TSHZ2 | AKT3,ANTXR1,CALD1,CTSK,CTSO,CXCL12,DCN, DPYSL2,FKBP7,IFI16,IL33,NT5E,OGN,OMD, PDCD1LG2,PDGFD,PROS1,PTGFR,SGCE,TFPI,UST | ||||
 |
| ||||
| ARL13B,BBS9,BBX,DYNC2H1,FOXO1,GNB5,GPR137B, HINT3,NAV1,PAM,PLEKHA4,PLSCR4,PROS1,PRRG1, RNF144B,SDCBP,SERINC1,SHISA2,SNPH,TMEM233,TMOD2 | C10orf120,IZUMO2,TDRP,CELA2B,CGB2,COX7B2,FAM153B, GJA10,GNA14,KCTD12,LRRC36,MC2R,OPN1LW,PDP1, PROP1,PROS1,SLITRK5,SNORA38B,TDRD1,UTS2,WFDC6 |
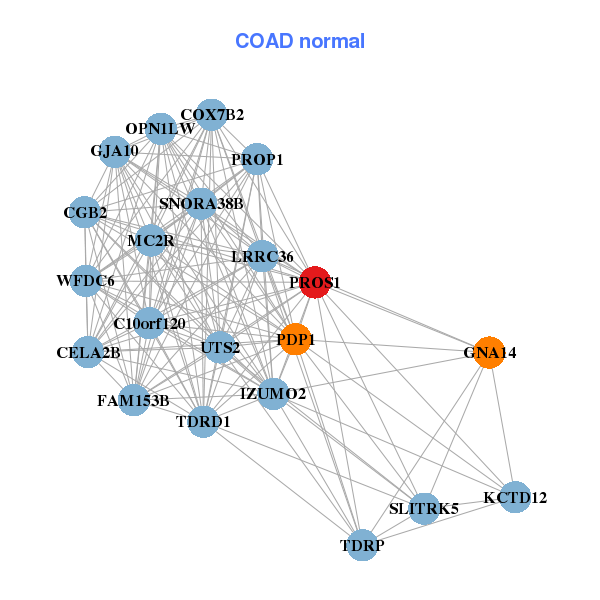
| * Co-Expression network figures were drawn using R package igraph. Only the top 20 genes with the highest correlations were shown. Red circle: input gene, orange circle: cell metabolism gene, sky circle: other gene |
: Open all plots for all cancer types
| Top |
: Open all interacting genes' information including KEGG pathway for all interacting genes from DAVID
| Top |
| Pharmacological Information for PROS1 |
| DB Category | DB Name | DB's ID and Url link |
| Organism-specific databases | PharmGKB | PA33809; -. |
| Organism-specific databases | CTD | 5627; -. |
| * Gene Centered Interaction Network. |
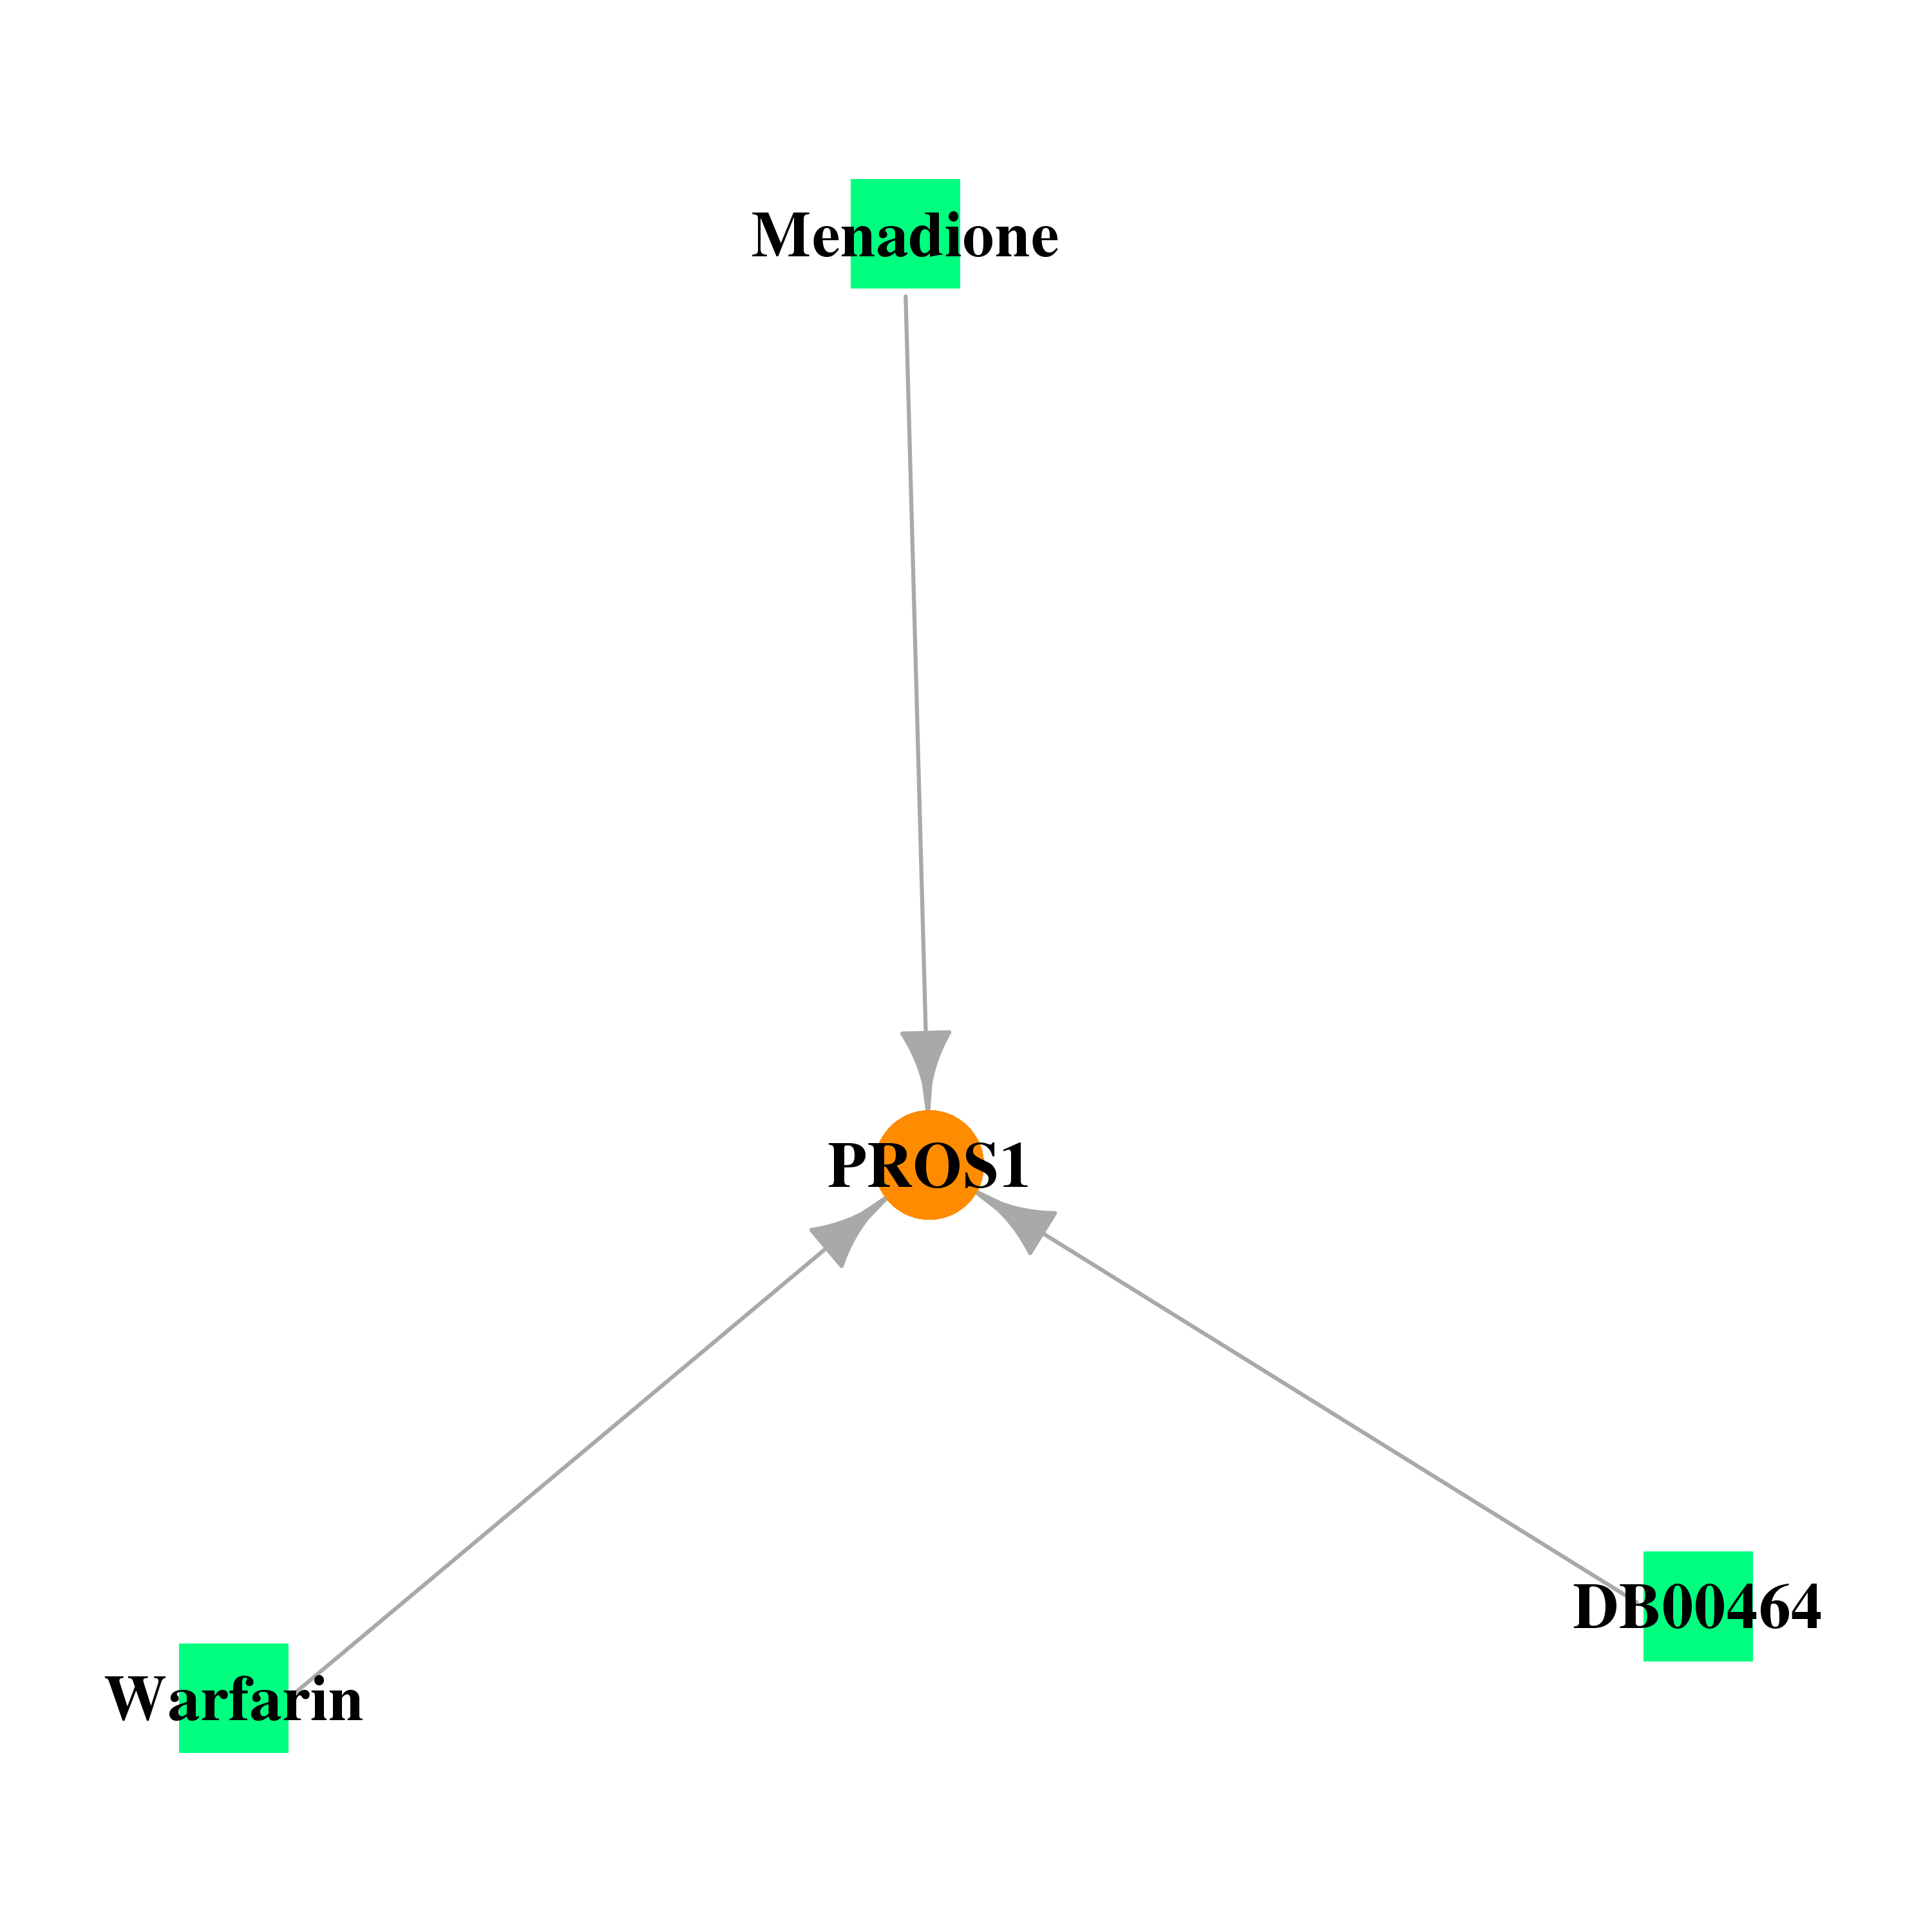 |
| * Drug Centered Interaction Network. |
| DrugBank ID | Target Name | Drug Groups | Generic Name | Drug Centered Network | Drug Structure |
| DB00170 | protein S (alpha) | approved; nutraceutical | Menadione |  |  |
| DB00464 | protein S (alpha) | approved | Sodium Tetradecyl Sulfate | 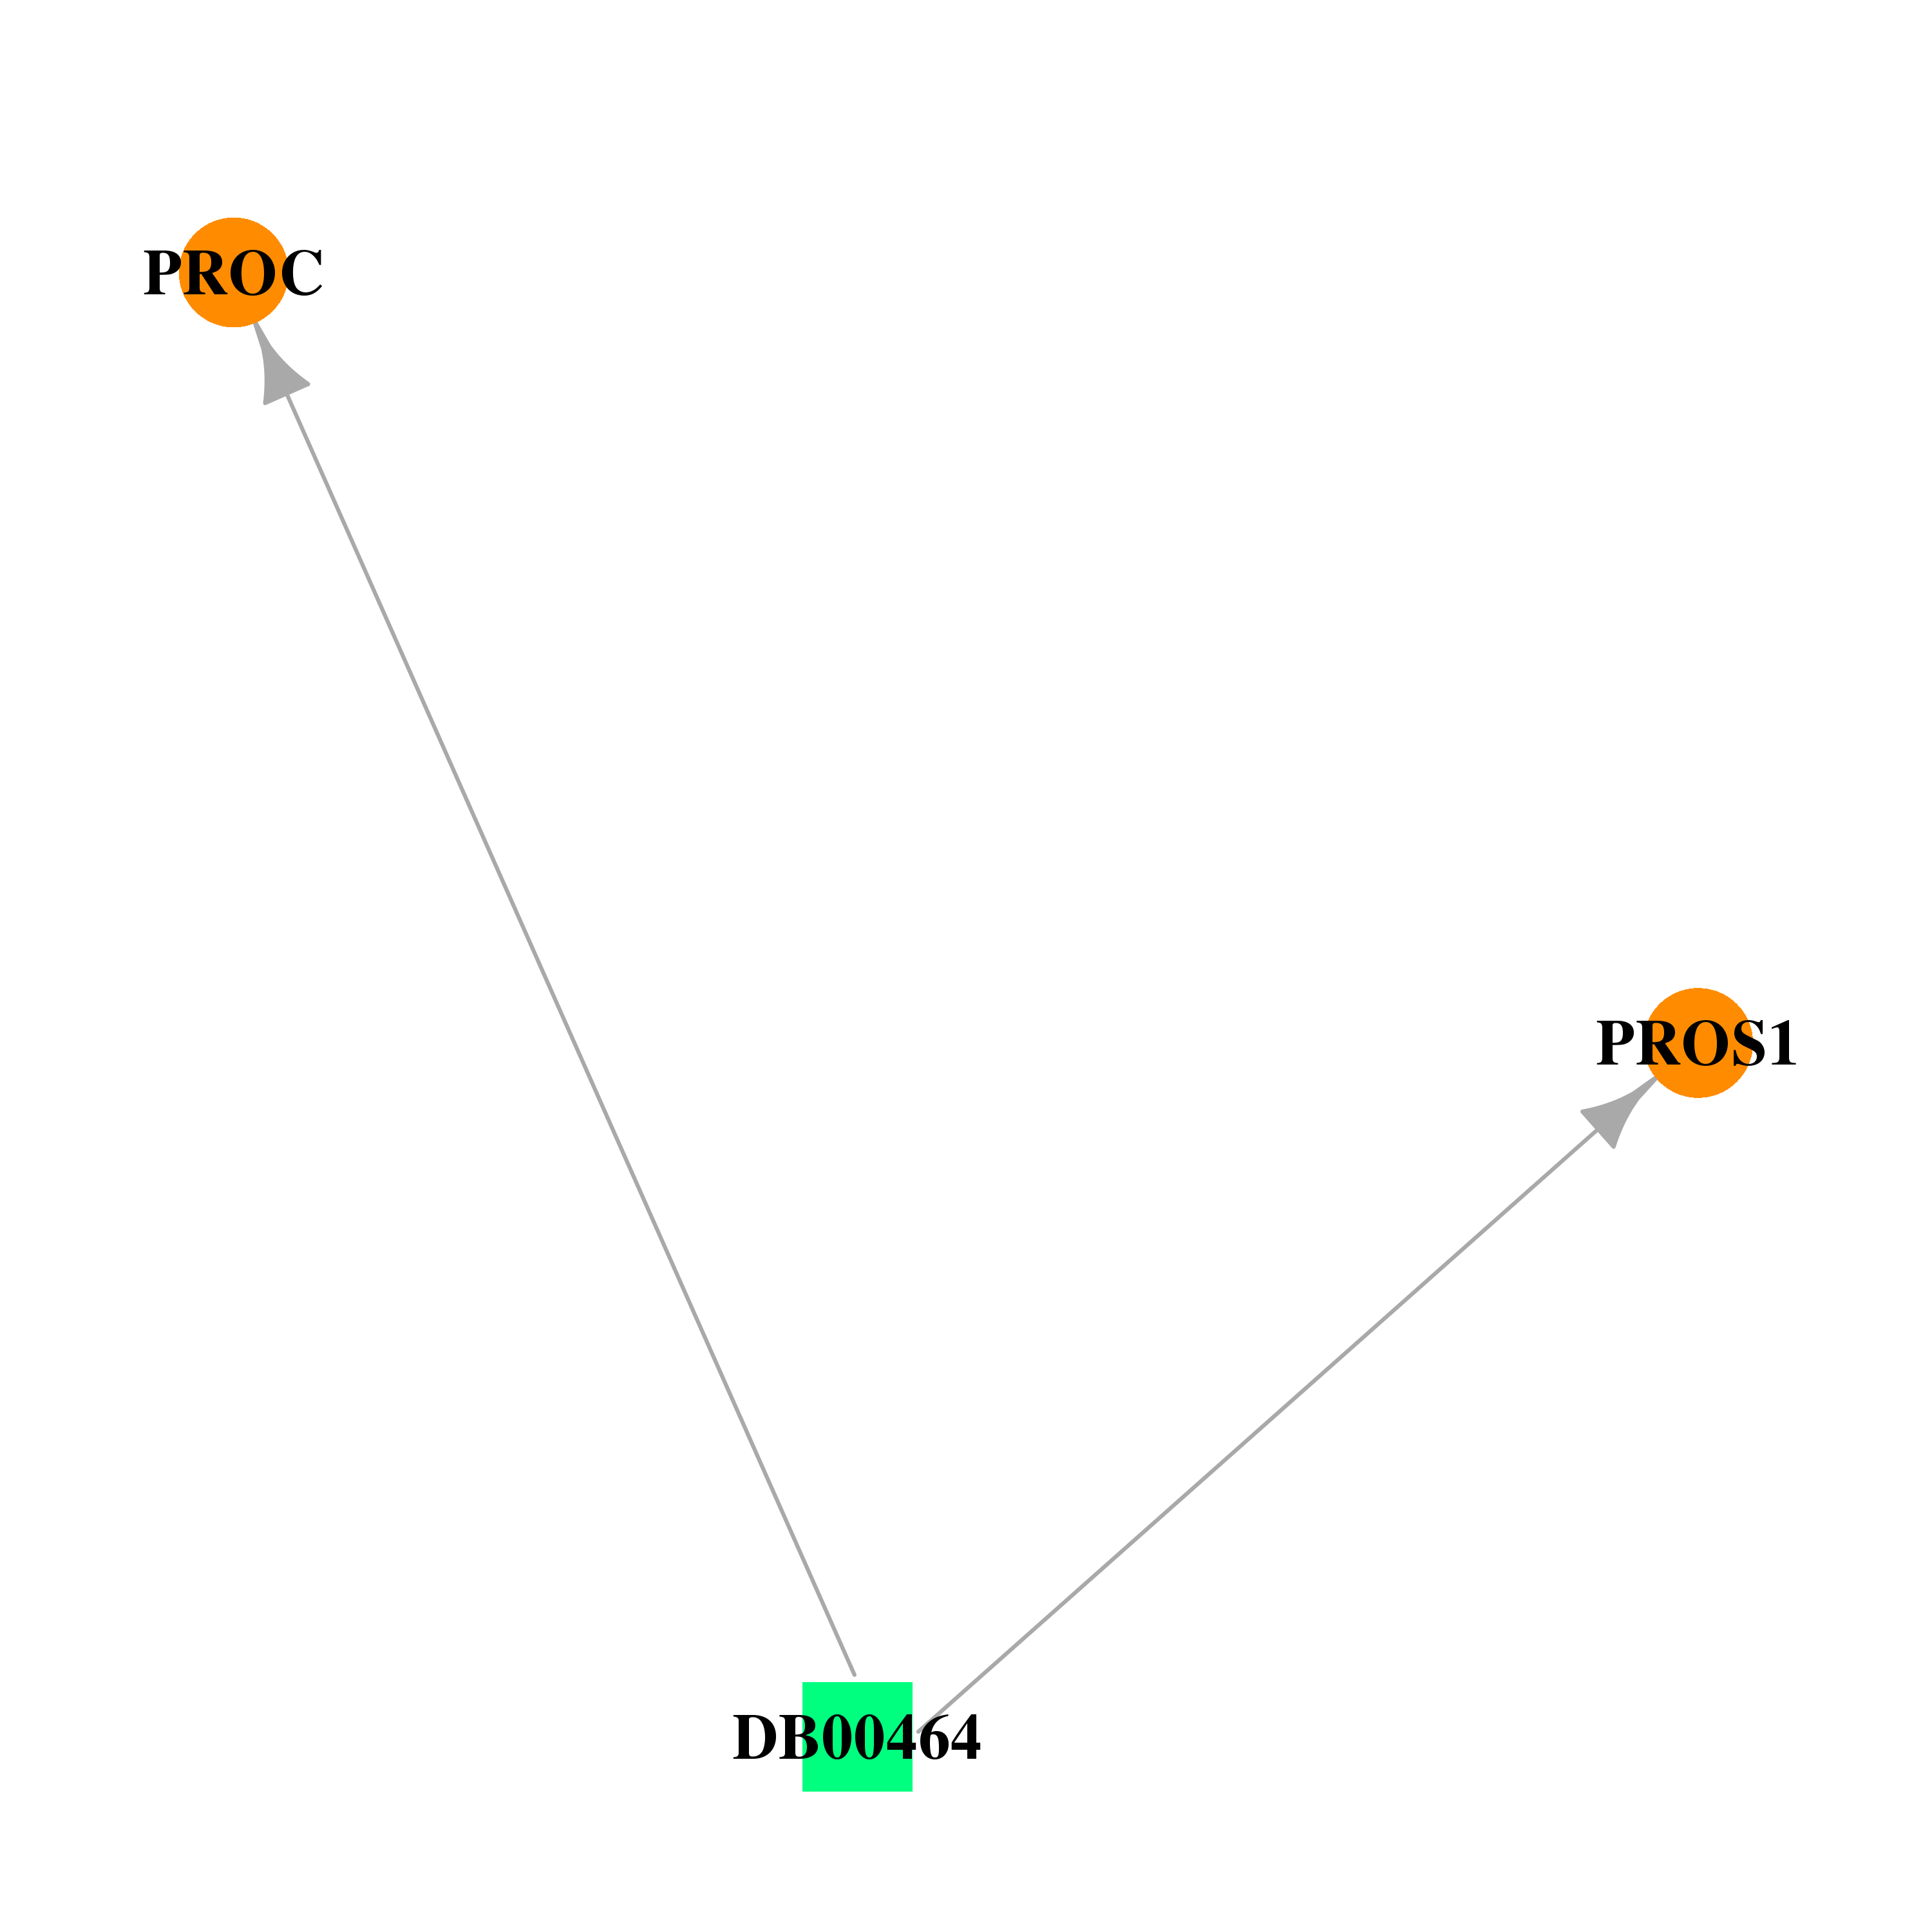 |  |
| DB00682 | protein S (alpha) | approved | Warfarin |  | 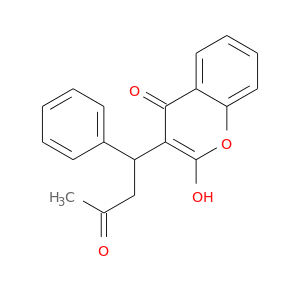 |
| Top |
| Cross referenced IDs for PROS1 |
| * We obtained these cross-references from Uniprot database. It covers 150 different DBs, 18 categories. http://www.uniprot.org/help/cross_references_section |
: Open all cross reference information
|
Copyright © 2016-Present - The Univsersity of Texas Health Science Center at Houston @ |