|
|||||||||||||||||||||||||||||||||||||||||||||||||||||||||||||||||||||||||||||||||||||||||||||||||||||||||||||||||||||||||||||||||||||||||||||||||||||||||||||||||||||||||||||||||||||||||||||||||||||||||||||||||||||||||||||||||||||||||||||||||||||||||||||||||||||||||||||||||||||||||||||||||||||||||||||||||||||||||||||||||||||||||||||
| |
| Phenotypic Information (metabolism pathway, cancer, disease, phenome) |
| |
| |
| Gene-Gene Network Information: Co-Expression Network, Interacting Genes & KEGG |
| |
|


| Gene Summary for LGMN |
| Top |
| Phenotypic Information for LGMN(metabolism pathway, cancer, disease, phenome) |
| Cancer | CGAP: LGMN |
| Familial Cancer Database: LGMN | |
| * This gene is included in those cancer gene databases. |
|
|
|
|
|
| . | |||||||||||||||||||||||||||||||||||||||||||||||||||||||||||||||||||||||||||||||||||||||||||||||||||||||||||||||||||||||||||||||||||||||||||||||||||||||||||||||||||||||||||||||||||||||||||||||||||||||||||||||||||||||||||||||||||||||||||||||||||||||||||||||||||||||||||||||||||||||||||||||||||||||||||||||||||||||||||||||||||||||
Oncogene 1 | Significant driver gene in | ||||||||||||||||||||||||||||||||||||||||||||||||||||||||||||||||||||||||||||||||||||||||||||||||||||||||||||||||||||||||||||||||||||||||||||||||||||||||||||||||||||||||||||||||||||||||||||||||||||||||||||||||||||||||||||||||||||||||||||||||||||||||||||||||||||||||||||||||||||||||||||||||||||||||||||||||||||||||||||||||||||||||||||
| cf) number; DB name 1 Oncogene; http://nar.oxfordjournals.org/content/35/suppl_1/D721.long, 2 Tumor Suppressor gene; https://bioinfo.uth.edu/TSGene/, 3 Cancer Gene Census; http://www.nature.com/nrc/journal/v4/n3/abs/nrc1299.html, 4 CancerGenes; http://nar.oxfordjournals.org/content/35/suppl_1/D721.long, 5 Network of Cancer Gene; http://ncg.kcl.ac.uk/index.php, 1Therapeutic Vulnerabilities in Cancer; http://cbio.mskcc.org/cancergenomics/statius/ |
| REACTOME_METABOLISM_OF_STEROID_HORMONES_AND_VITAMINS_A_AND_D REACTOME_METABOLISM_OF_LIPIDS_AND_LIPOPROTEINS | |
| OMIM | |
| Orphanet | |
| Disease | KEGG Disease: LGMN |
| MedGen: LGMN (Human Medical Genetics with Condition) | |
| ClinVar: LGMN | |
| Phenotype | MGI: LGMN (International Mouse Phenotyping Consortium) |
| PhenomicDB: LGMN | |
| Mutations for LGMN |
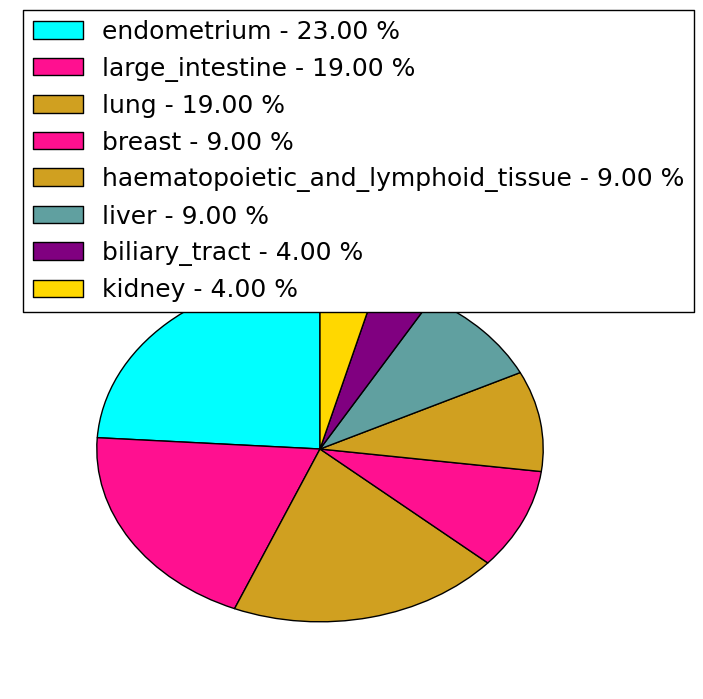
| * Under tables are showing count per each tissue to give us broad intuition about tissue specific mutation patterns.You can go to the detailed page for each mutation database's web site. |
| There's no structural variation information in COSMIC data for this gene. |
| * From mRNA Sanger sequences, Chitars2.0 arranged chimeric transcripts. This table shows LGMN related fusion information. |
| ID | Head Gene | Tail Gene | Accession | Gene_a | qStart_a | qEnd_a | Chromosome_a | tStart_a | tEnd_a | Gene_a | qStart_a | qEnd_a | Chromosome_a | tStart_a | tEnd_a |
| CN269392 | RPL18 | 7 | 510 | 19 | 49119141 | 49122421 | LGMN | 502 | 618 | 14 | 93170154 | 93170270 | |
| AU138144 | LOC100507412 | 1 | 122 | ? | 109636 | 109757 | LGMN | 123 | 661 | 14 | 93182516 | 93214972 | |
| AW450755 | COL6A3 | 18 | 100 | 2 | 238232660 | 238232742 | LGMN | 97 | 368 | 14 | 93178236 | 93180796 | |
| AA157183 | LGMN | 1 | 85 | 14 | 93214868 | 93214953 | ENO1 | 86 | 422 | 1 | 8928060 | 8938673 | |
| BP392190 | LGMN | 1 | 113 | 14 | 93176154 | 93178052 | VCAN | 113 | 501 | 5 | 82876748 | 82877136 | |
| AW753026 | LGMN | 100 | 261 | 14 | 93183766 | 93185212 | LGMN | 256 | 482 | 14 | 93182289 | 93182515 | |
| BC008004 | VPS4A | 30 | 998 | 16 | 69356476 | 69358908 | LGMN | 999 | 2936 | 14 | 93170154 | 93214930 | |
| Top |
| Mutation type/ Tissue ID | brca | cns | cerv | endome | haematopo | kidn | Lintest | liver | lung | ns | ovary | pancre | prost | skin | stoma | thyro | urina | |||
| Total # sample | 3 | |||||||||||||||||||
| GAIN (# sample) | ||||||||||||||||||||
| LOSS (# sample) | 3 |
| cf) Tissue ID; Tissue type (1; Breast, 2; Central_nervous_system, 3; Cervix, 4; Endometrium, 5; Haematopoietic_and_lymphoid_tissue, 6; Kidney, 7; Large_intestine, 8; Liver, 9; Lung, 10; NS, 11; Ovary, 12; Pancreas, 13; Prostate, 14; Skin, 15; Stomach, 16; Thyroid, 17; Urinary_tract) |
| Top |
|
 |
| Top |
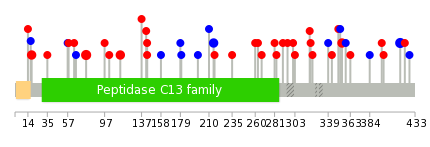
| Stat. for Non-Synonymous SNVs (# total SNVs=21) | (# total SNVs=10) |
 |  |
(# total SNVs=0) | (# total SNVs=0) |
| Top |
| * When you move the cursor on each content, you can see more deailed mutation information on the Tooltip. Those are primary_site,primary_histology,mutation(aa),pubmedID. |
| GRCh37 position | Mutation(aa) | Unique sampleID count |
| chr14:93185098-93185098 | p.S77F | 3 |
| chr14:93170993-93170993 | p.P417P | 3 |
| chr14:93178266-93178266 | p.S215S | 2 |
| chr14:93199080-93199080 | p.V18I | 2 |
| chr14:93182544-93182544 | p.L114R | 2 |
| chr14:93179217-93179217 | p.? | 2 |
| chr14:93180173-93180173 | p.R180R | 2 |
| chr14:93176072-93176072 | p.T322N | 1 |
| chr14:93185138-93185138 | p.E64K | 1 |
| chr14:93178044-93178044 | p.S260L | 1 |
| Top |
|
 |
| Point Mutation/ Tissue ID | 1 | 2 | 3 | 4 | 5 | 6 | 7 | 8 | 9 | 10 | 11 | 12 | 13 | 14 | 15 | 16 | 17 | 18 | 19 | 20 |
| # sample | 6 | 4 | 1 | 4 | 5 | 6 | 1 | 6 | ||||||||||||
| # mutation | 6 | 4 | 1 | 4 | 6 | 7 | 1 | 6 | ||||||||||||
| nonsynonymous SNV | 2 | 2 | 1 | 3 | 6 | 4 | 5 | |||||||||||||
| synonymous SNV | 4 | 2 | 1 | 3 | 1 | 1 |
| cf) Tissue ID; Tissue type (1; BLCA[Bladder Urothelial Carcinoma], 2; BRCA[Breast invasive carcinoma], 3; CESC[Cervical squamous cell carcinoma and endocervical adenocarcinoma], 4; COAD[Colon adenocarcinoma], 5; GBM[Glioblastoma multiforme], 6; Glioma Low Grade, 7; HNSC[Head and Neck squamous cell carcinoma], 8; KICH[Kidney Chromophobe], 9; KIRC[Kidney renal clear cell carcinoma], 10; KIRP[Kidney renal papillary cell carcinoma], 11; LAML[Acute Myeloid Leukemia], 12; LUAD[Lung adenocarcinoma], 13; LUSC[Lung squamous cell carcinoma], 14; OV[Ovarian serous cystadenocarcinoma ], 15; PAAD[Pancreatic adenocarcinoma], 16; PRAD[Prostate adenocarcinoma], 17; SKCM[Skin Cutaneous Melanoma], 18:STAD[Stomach adenocarcinoma], 19:THCA[Thyroid carcinoma], 20:UCEC[Uterine Corpus Endometrial Carcinoma]) |
| Top |
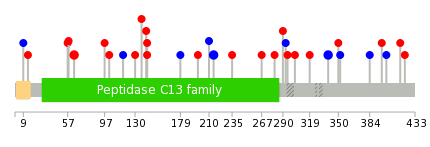
| * We represented just top 10 SNVs. When you move the cursor on each content, you can see more deailed mutation information on the Tooltip. Those are primary_site, primary_histology, mutation(aa), pubmedID. |
| Genomic Position | Mutation(aa) | Unique sampleID count |
| chr14:93178266 | p.L339L,LGMN | 2 |
| chr14:93185138 | p.E64K,LGMN | 2 |
| chr14:93176022 | p.S215S,LGMN | 2 |
| chr14:93178024 | p.R350H,LGMN | 1 |
| chr14:93182534 | p.F142L,LGMN | 1 |
| chr14:93172867 | p.P137L,LGMN | 1 |
| chr14:93178208 | p.L319P,LGMN | 1 |
| chr14:93183739 | p.G130D,LGMN | 1 |
| chr14:93172963 | p.D303Y,LGMN | 1 |
| chr14:93183754 | p.L117L,LGMN | 1 |
| * Copy number data were extracted from TCGA using R package TCGA-Assembler. The URLs of all public data files on TCGA DCC data server were gathered on Jan-05-2015. Function ProcessCNAData in TCGA-Assembler package was used to obtain gene-level copy number value which is calculated as the average copy number of the genomic region of a gene. |
 |
| cf) Tissue ID[Tissue type]: BLCA[Bladder Urothelial Carcinoma], BRCA[Breast invasive carcinoma], CESC[Cervical squamous cell carcinoma and endocervical adenocarcinoma], COAD[Colon adenocarcinoma], GBM[Glioblastoma multiforme], Glioma Low Grade, HNSC[Head and Neck squamous cell carcinoma], KICH[Kidney Chromophobe], KIRC[Kidney renal clear cell carcinoma], KIRP[Kidney renal papillary cell carcinoma], LAML[Acute Myeloid Leukemia], LUAD[Lung adenocarcinoma], LUSC[Lung squamous cell carcinoma], OV[Ovarian serous cystadenocarcinoma ], PAAD[Pancreatic adenocarcinoma], PRAD[Prostate adenocarcinoma], SKCM[Skin Cutaneous Melanoma], STAD[Stomach adenocarcinoma], THCA[Thyroid carcinoma], UCEC[Uterine Corpus Endometrial Carcinoma] |
| Top |
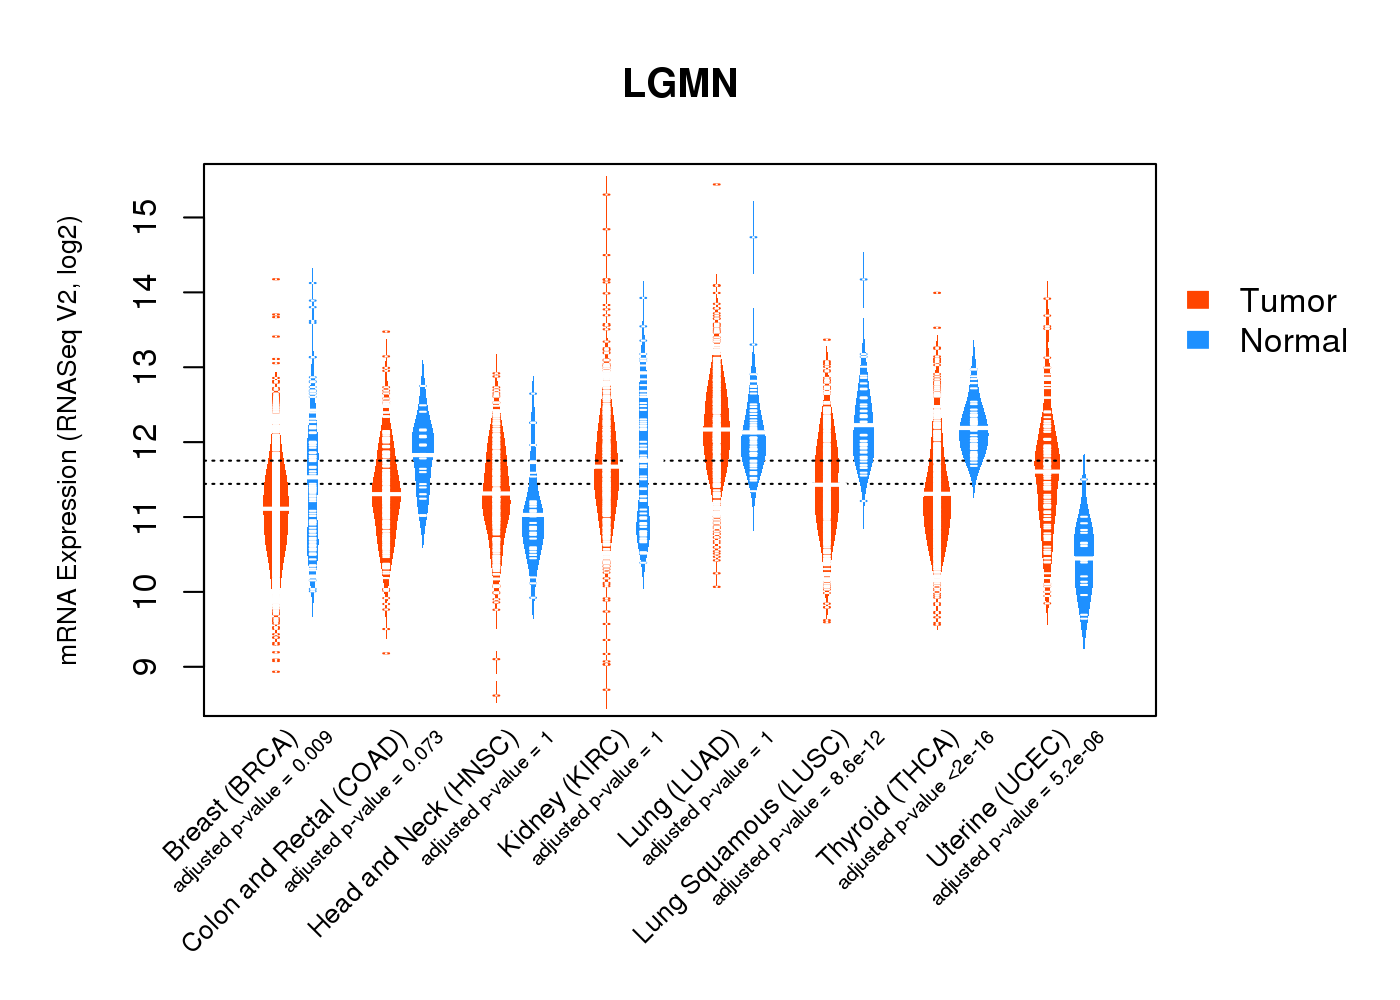
| Gene Expression for LGMN |
| * CCLE gene expression data were extracted from CCLE_Expression_Entrez_2012-10-18.res: Gene-centric RMA-normalized mRNA expression data. |
 |
| * Normalized gene expression data of RNASeqV2 was extracted from TCGA using R package TCGA-Assembler. The URLs of all public data files on TCGA DCC data server were gathered at Jan-05-2015. Only eight cancer types have enough normal control samples for differential expression analysis. (t test, adjusted p<0.05 (using Benjamini-Hochberg FDR)) |
 |
| Top |
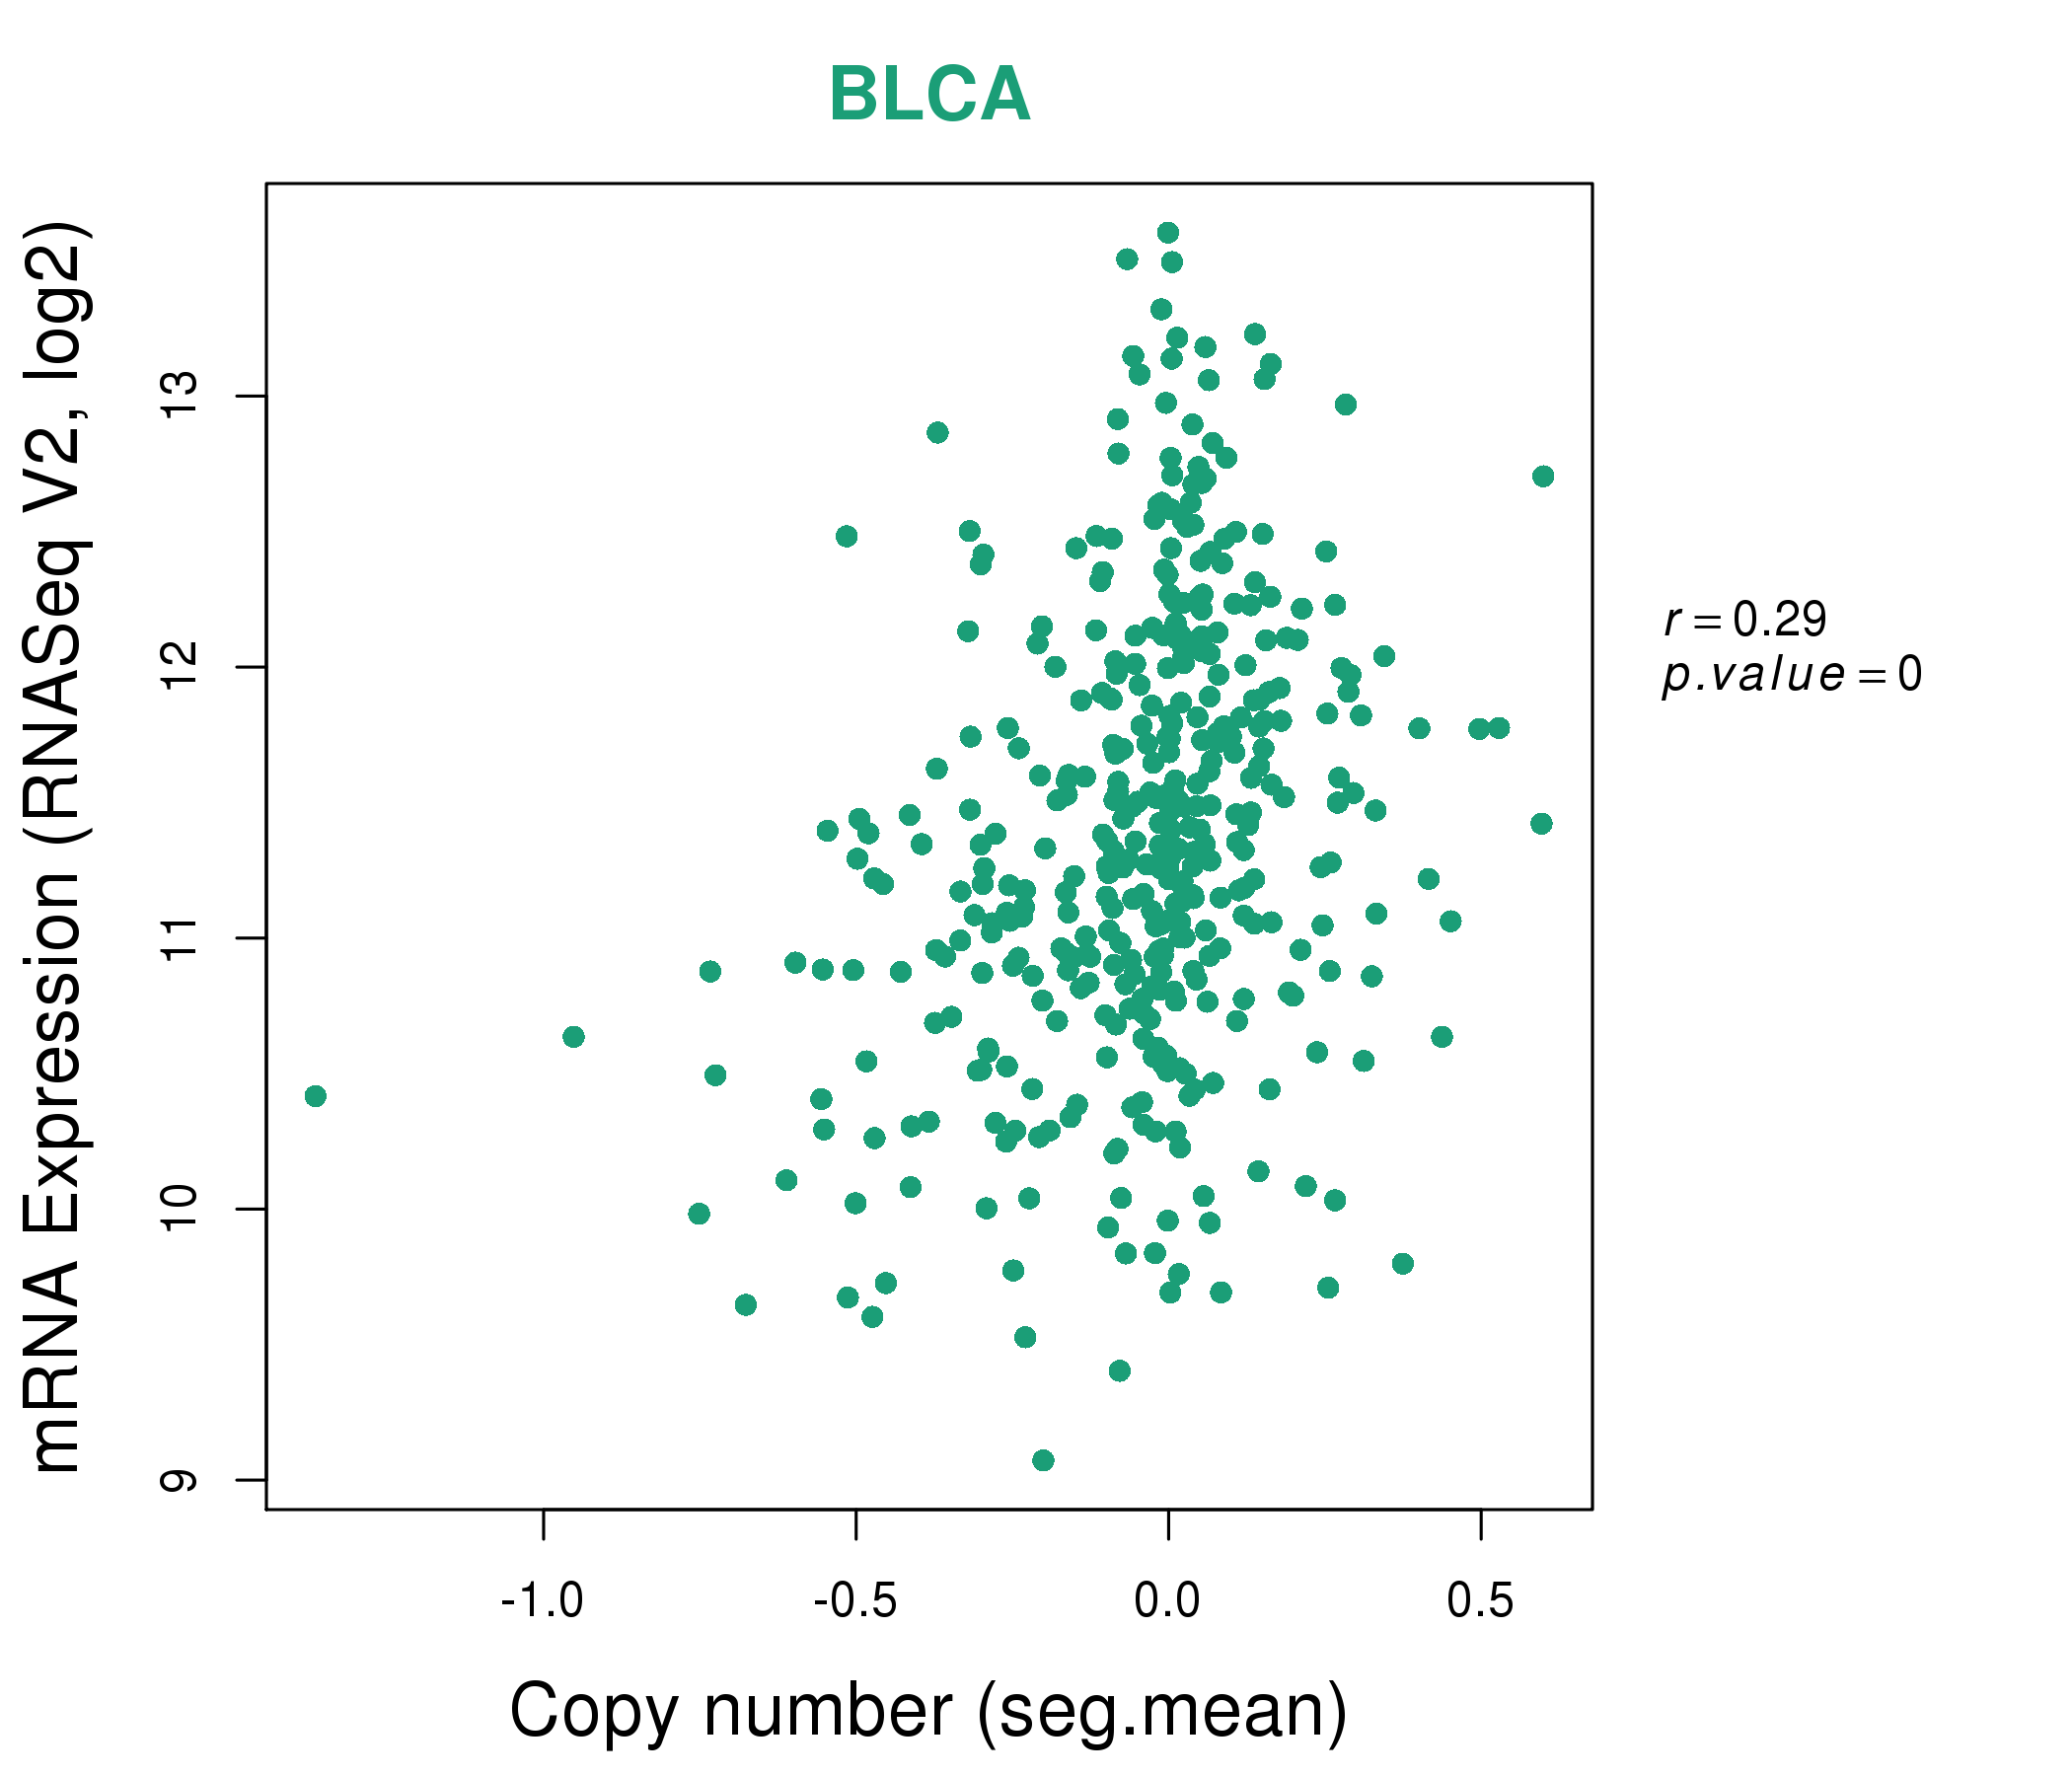
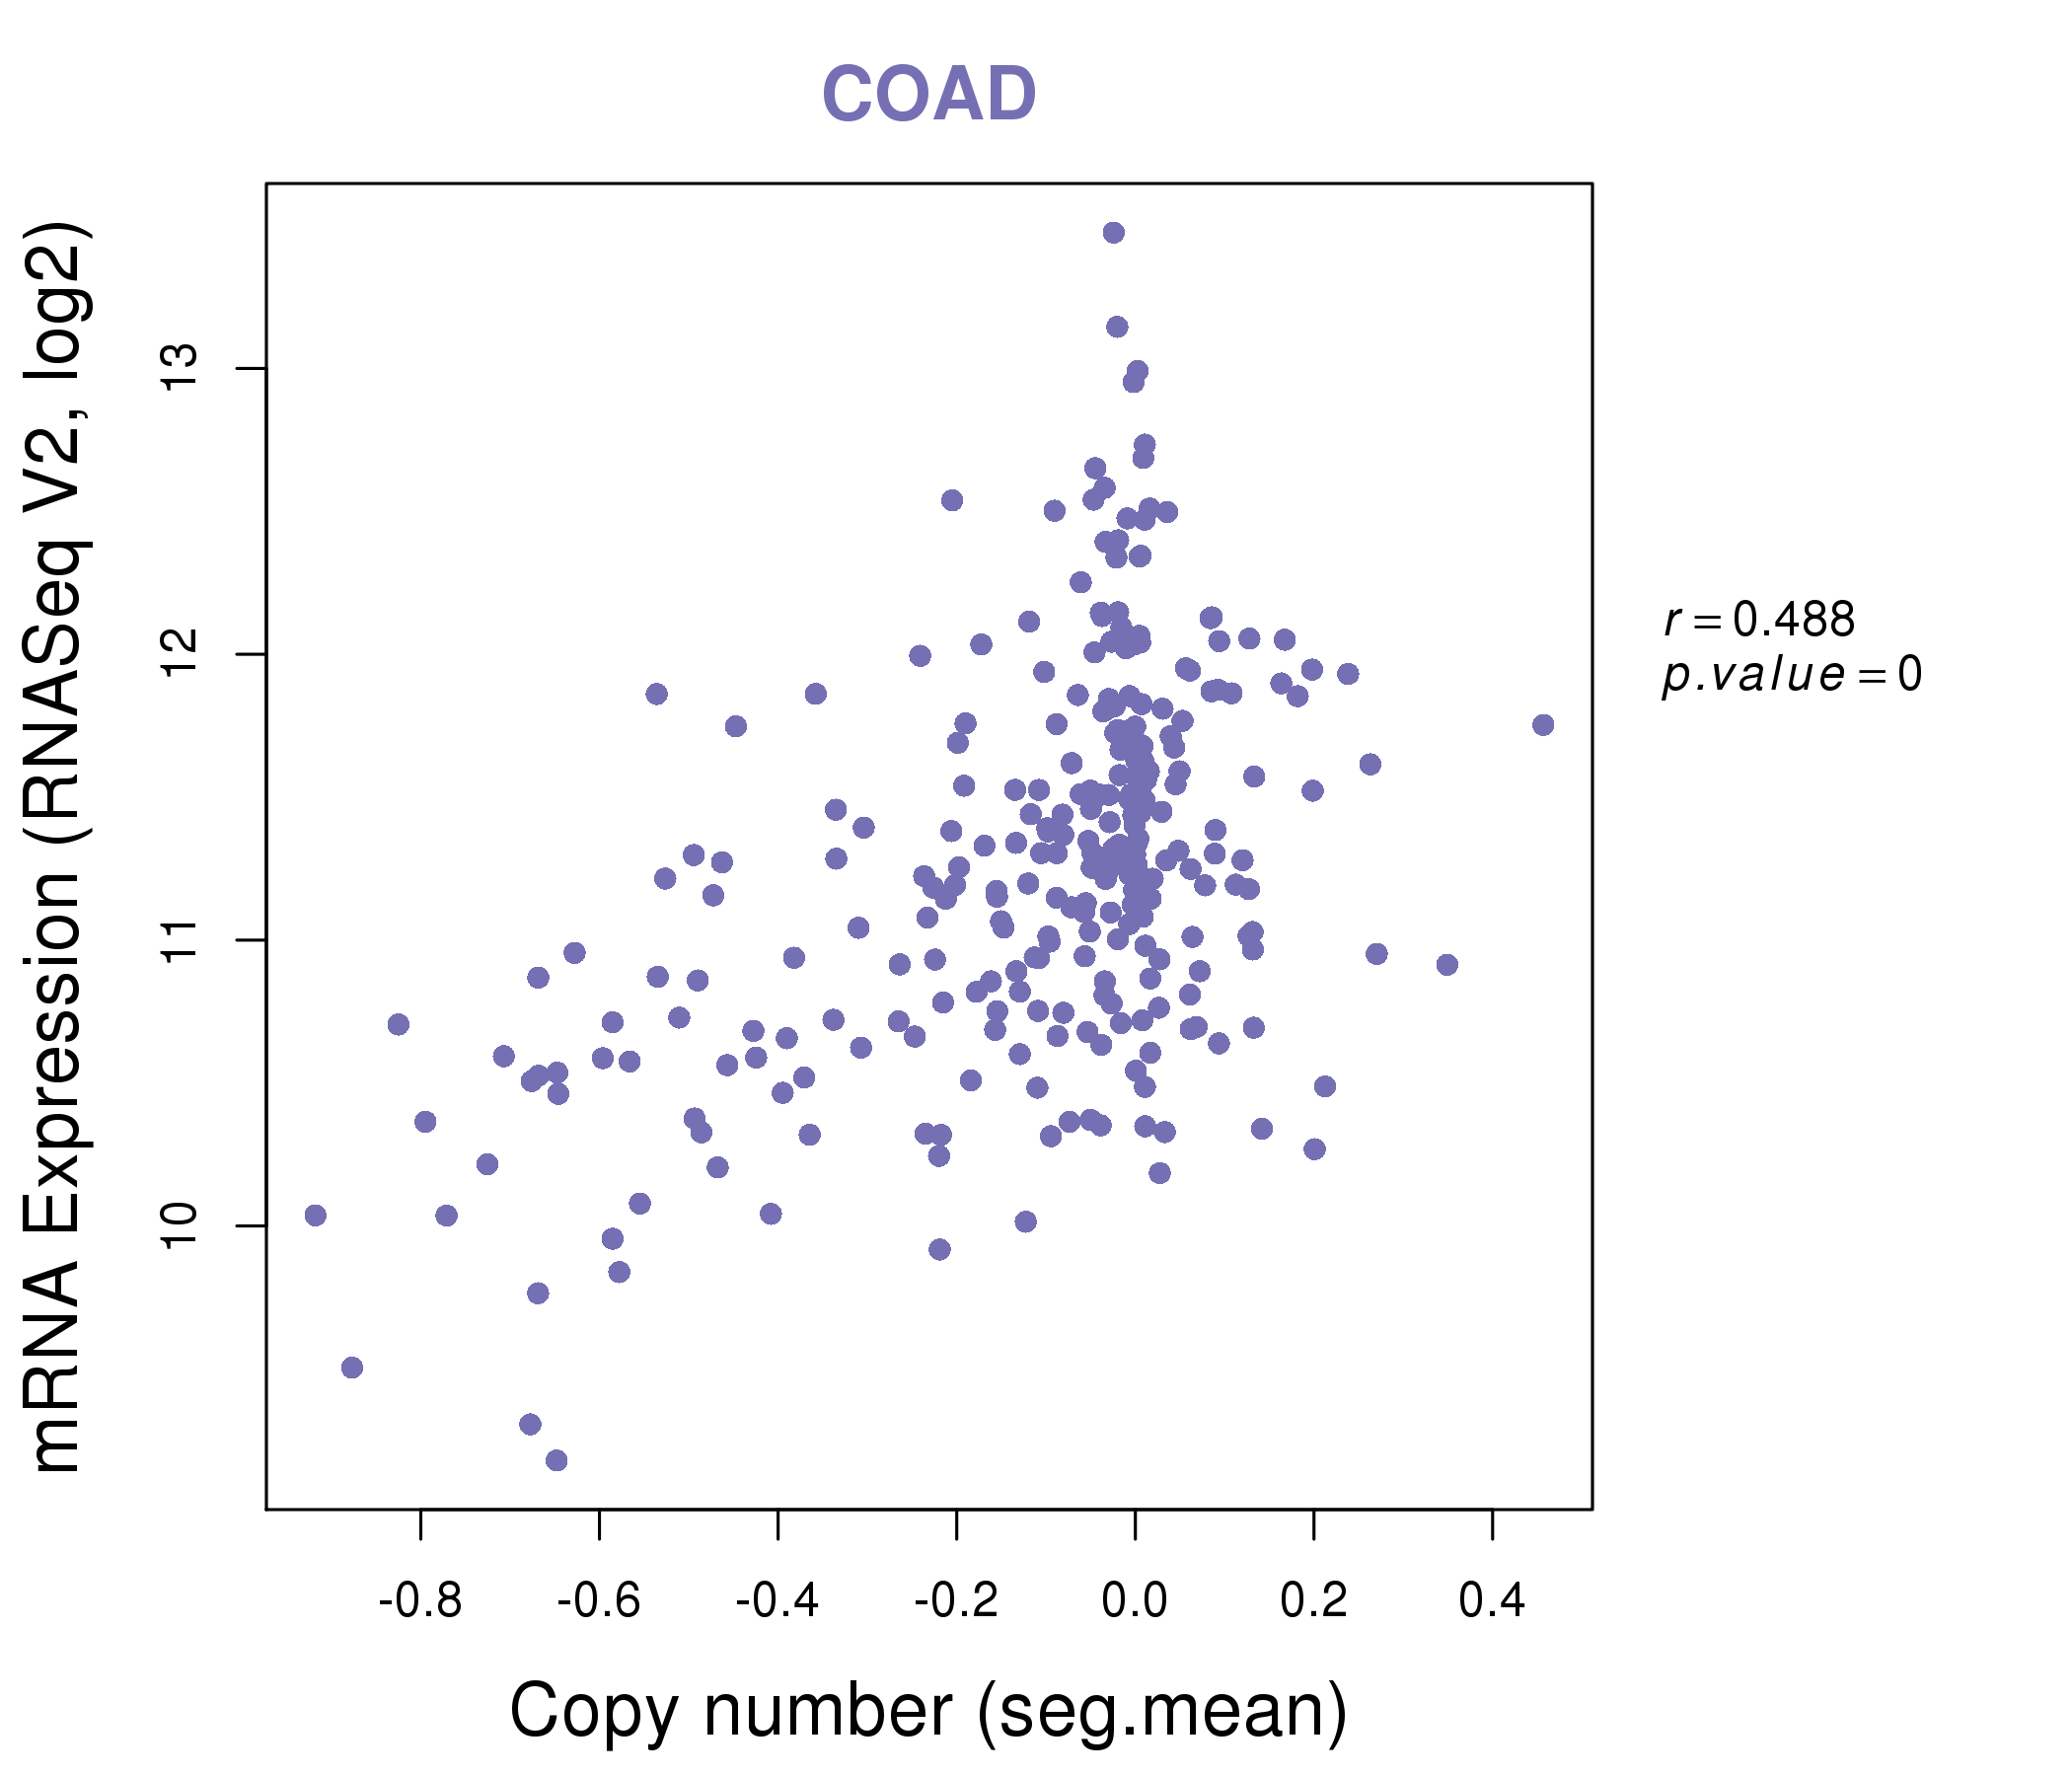
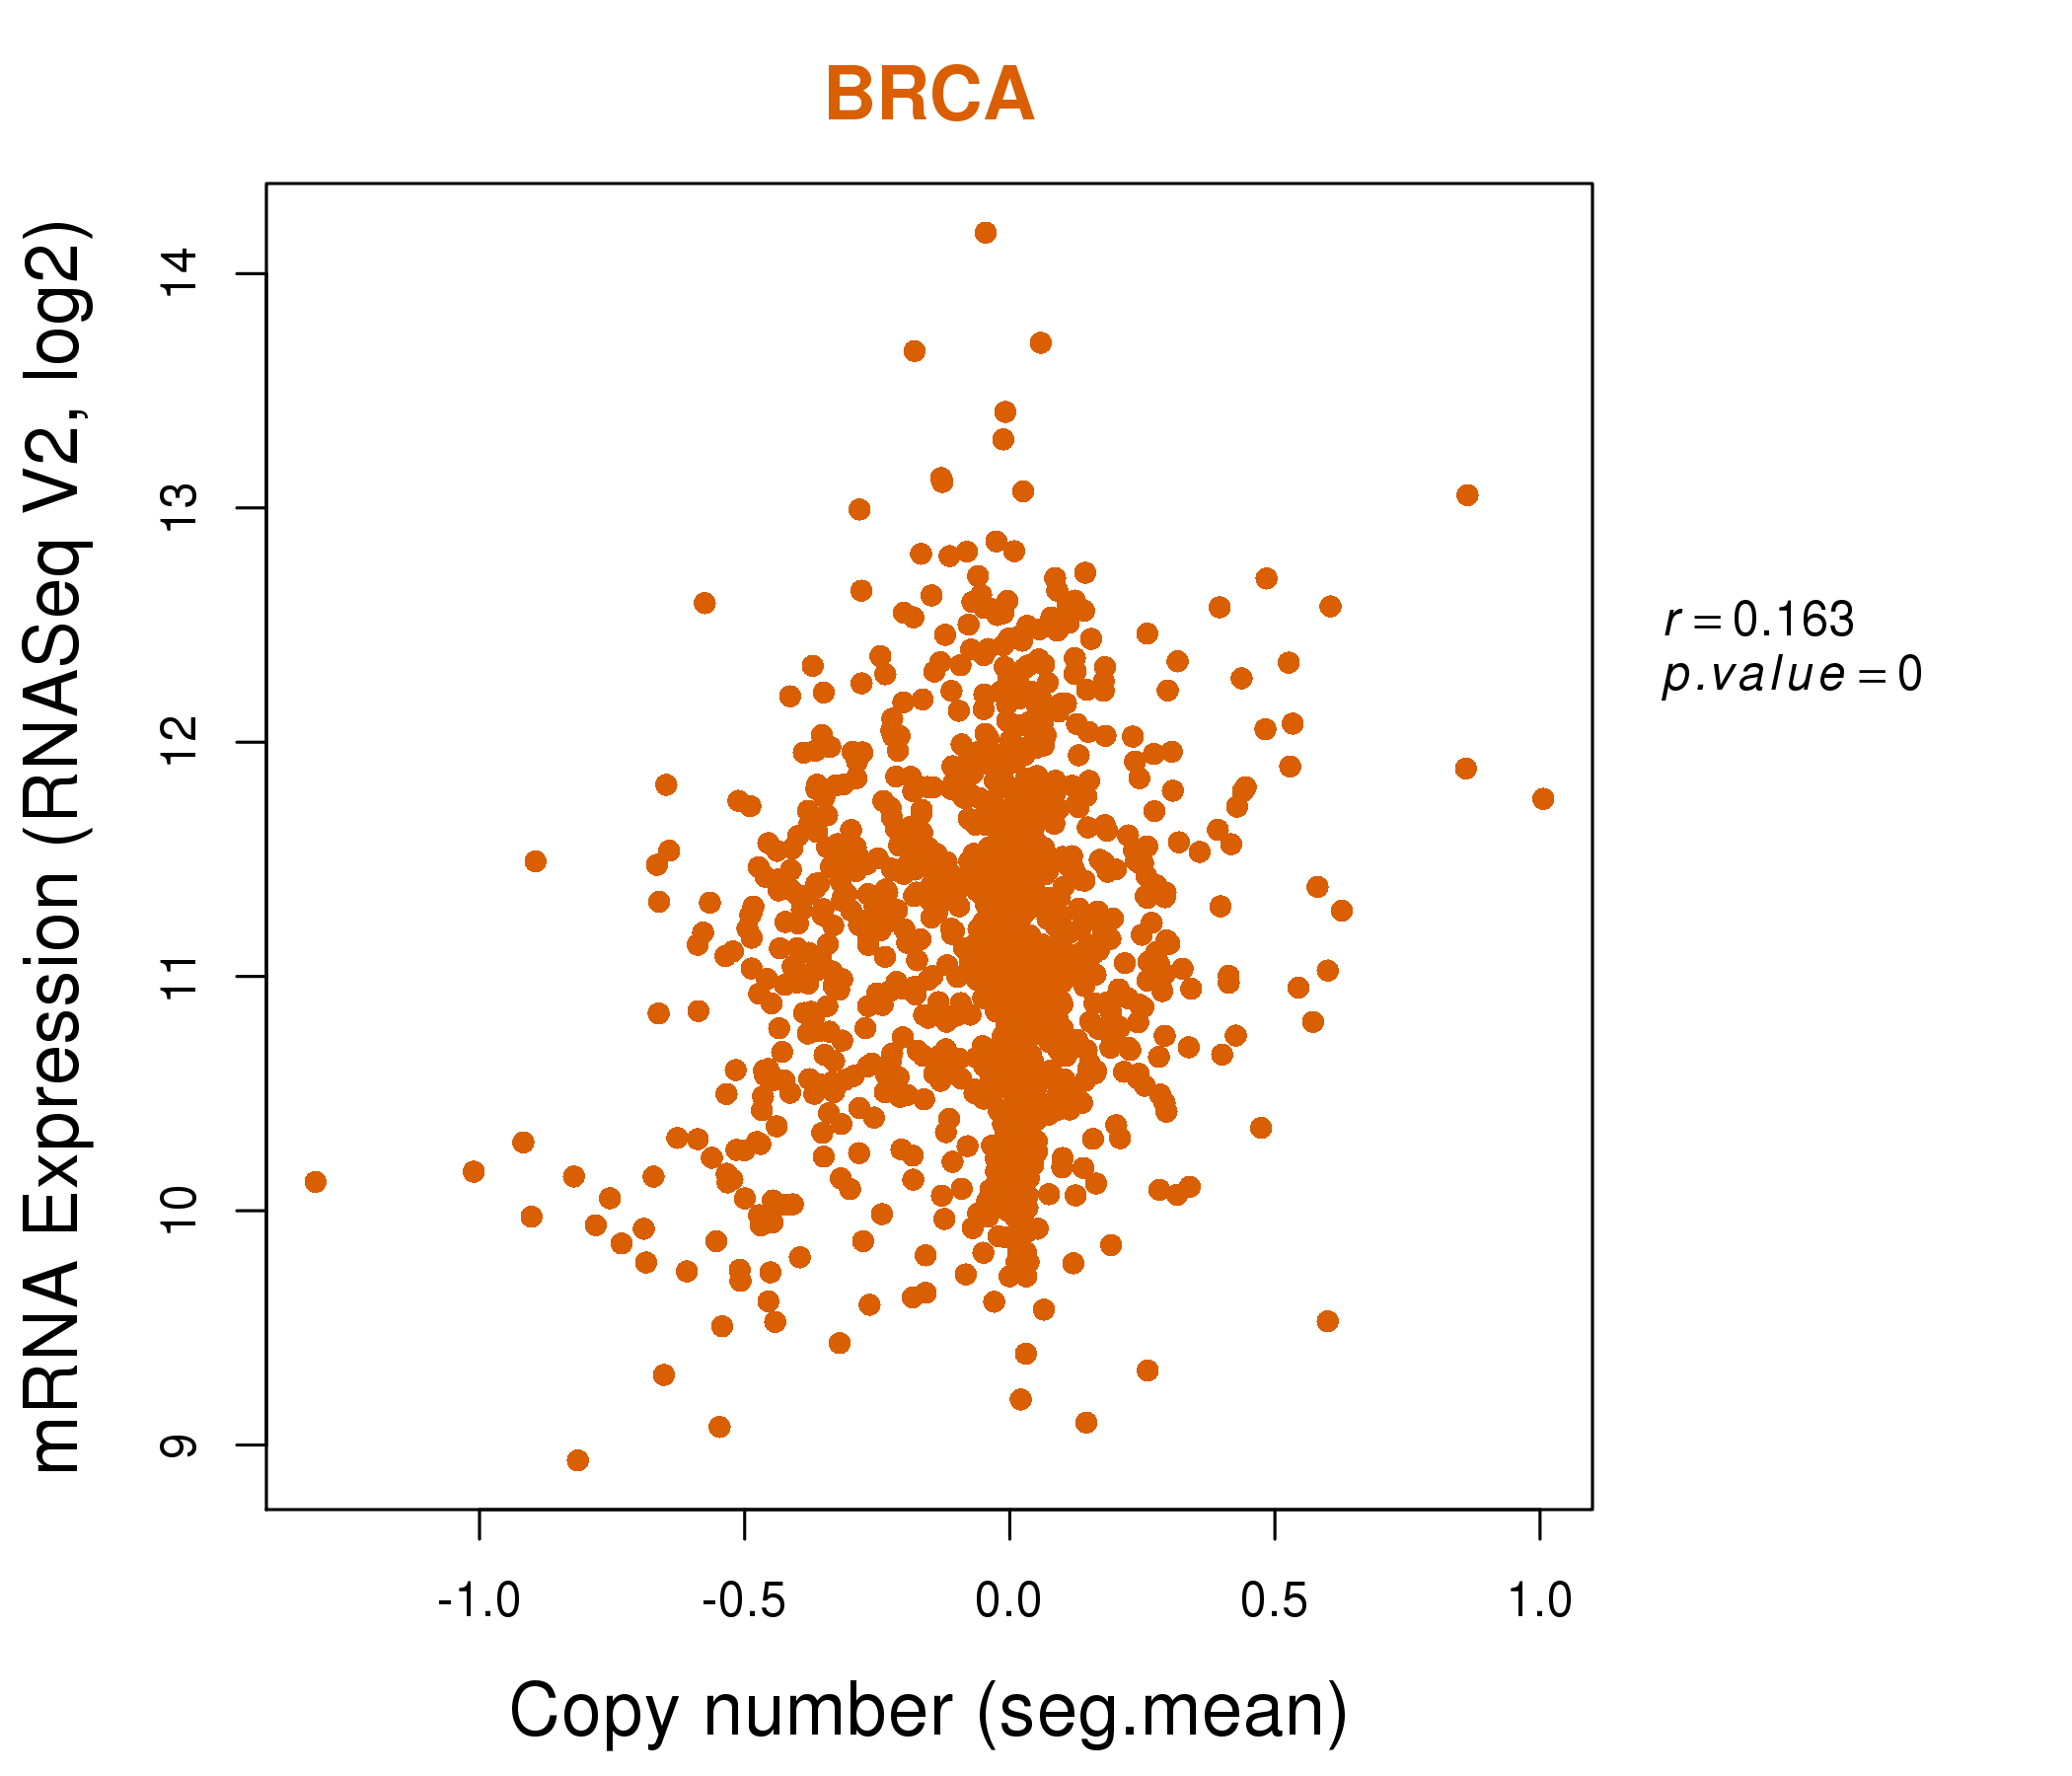
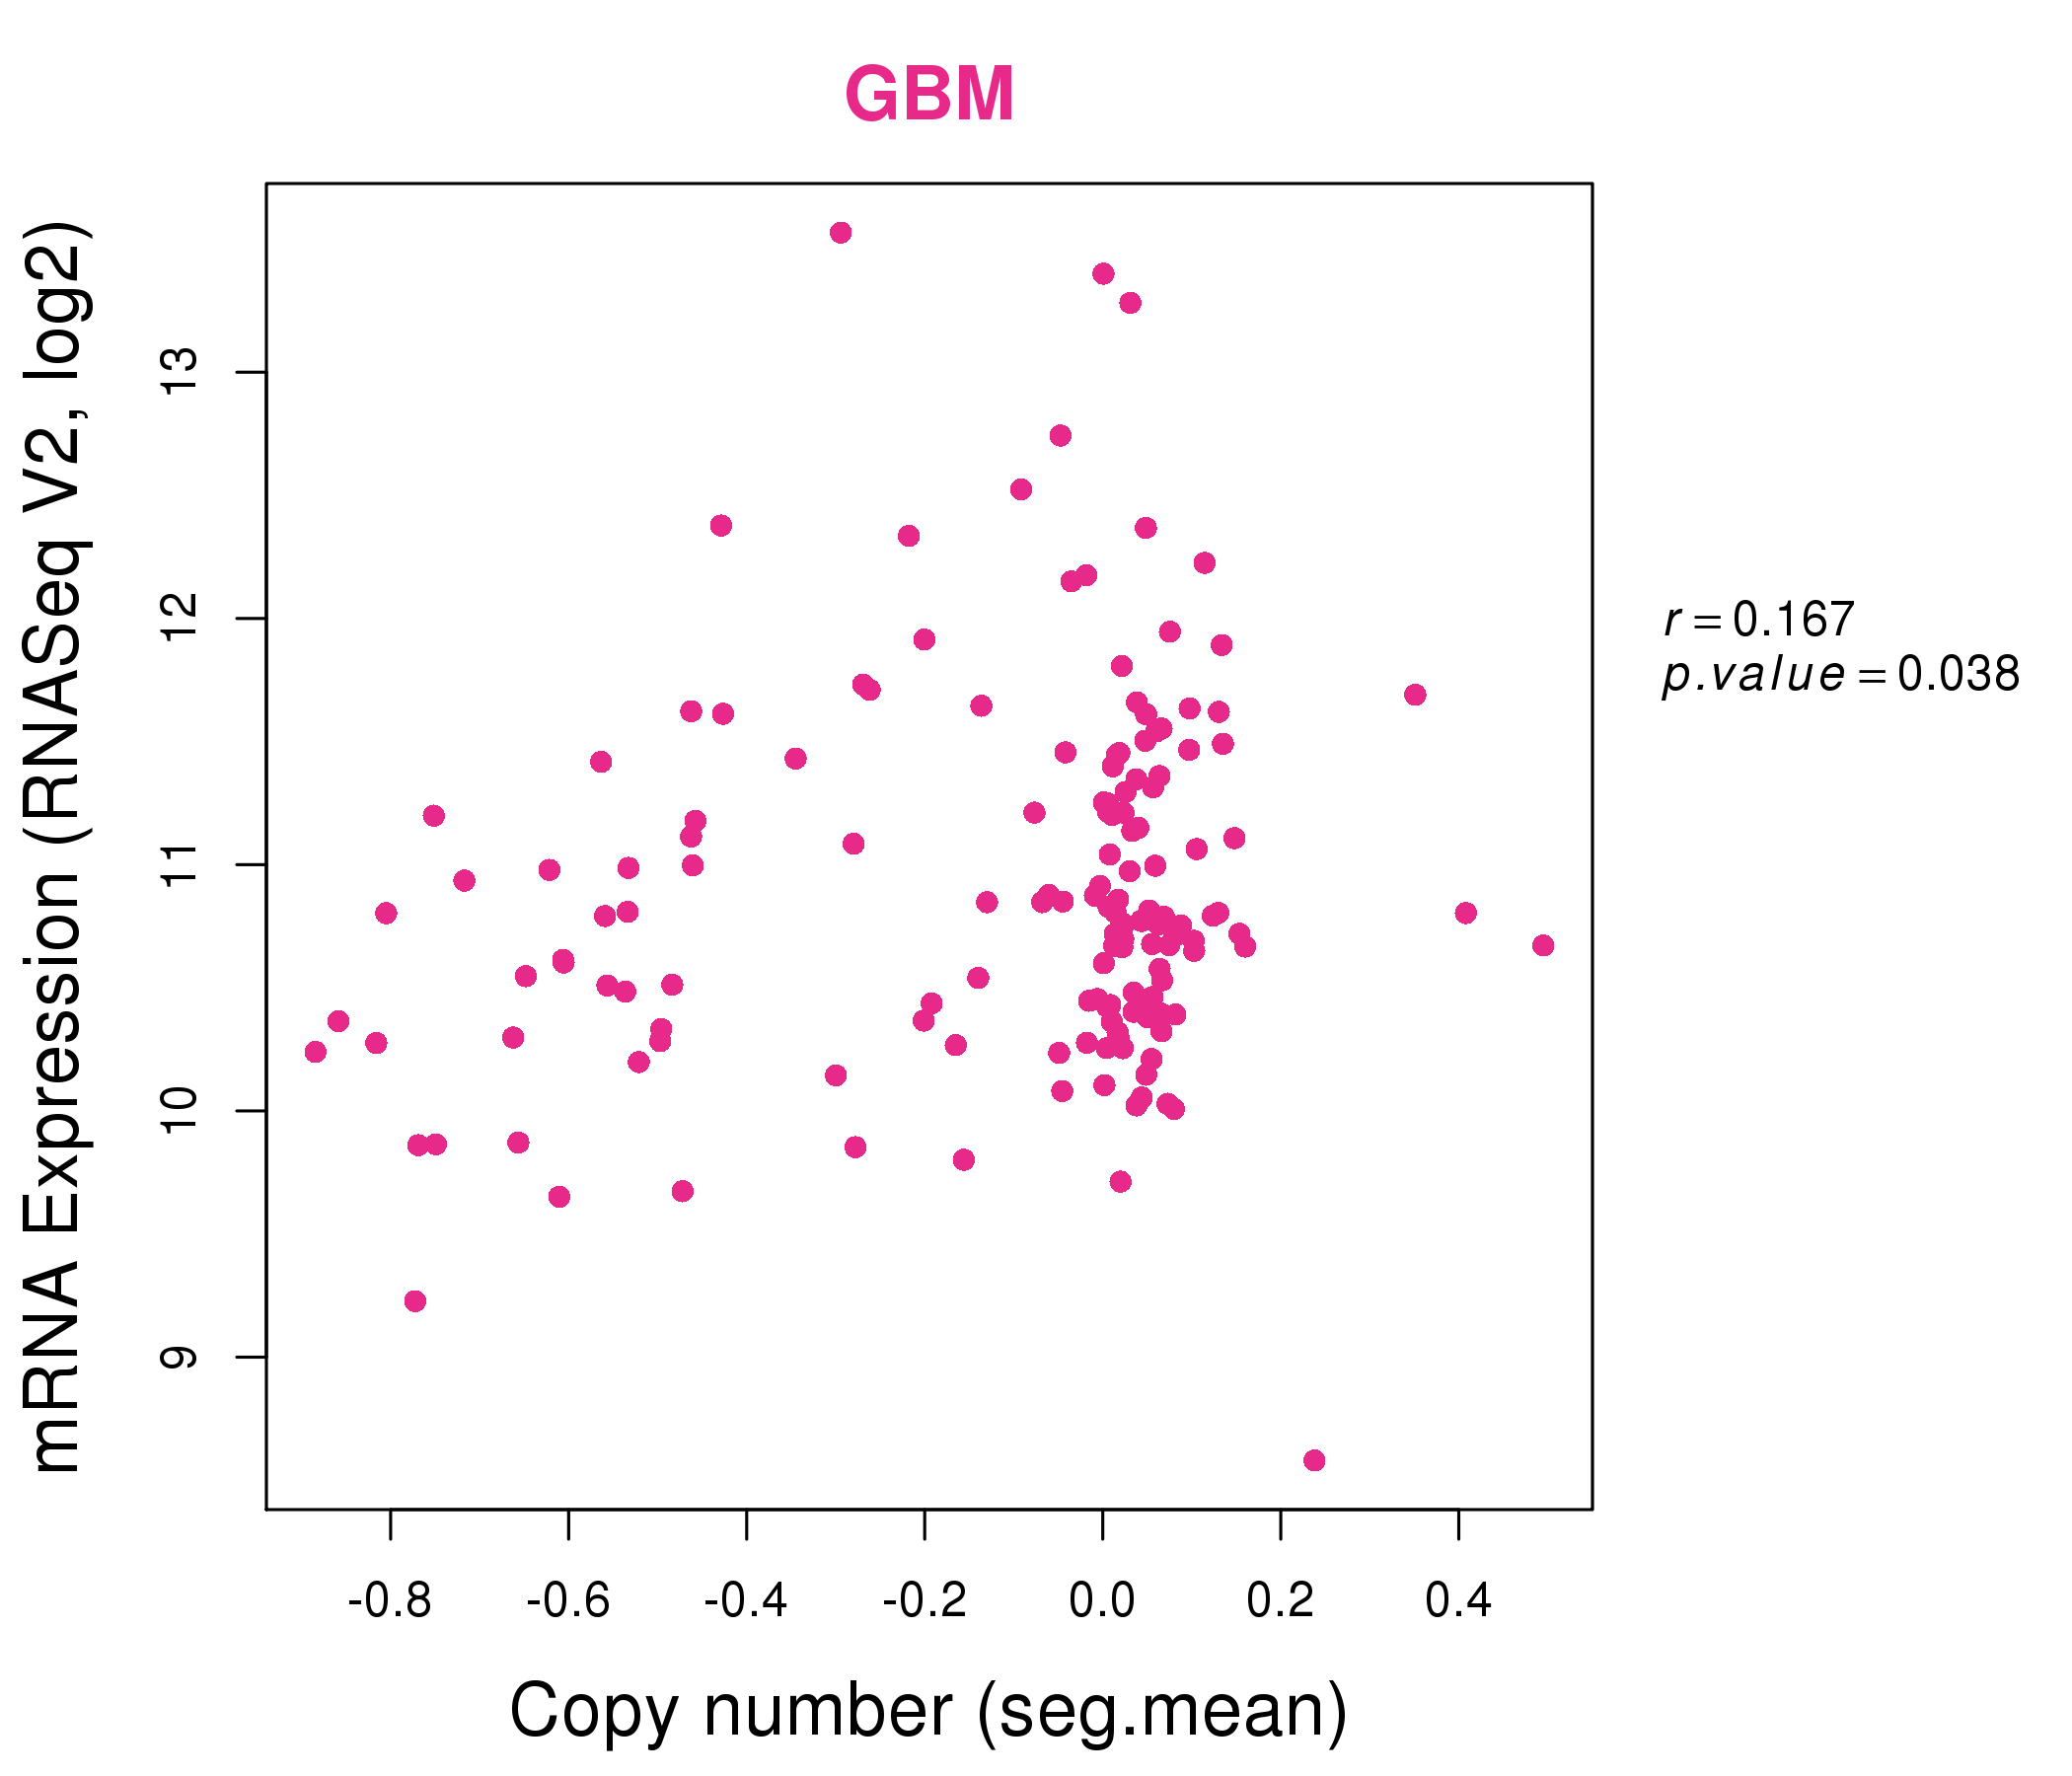
| * This plots show the correlation between CNV and gene expression. |
: Open all plots for all cancer types
 |
|
 |
|
| Top |
| Gene-Gene Network Information |
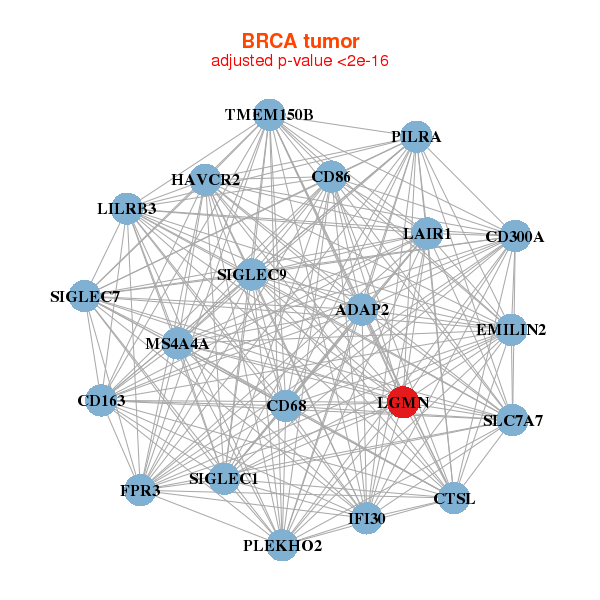
| * Co-Expression network figures were drawn using R package igraph. Only the top 20 genes with the highest correlations were shown. Red circle: input gene, orange circle: cell metabolism gene, sky circle: other gene |
: Open all plots for all cancer types
 |
| ||||
| ADAP2,CD163,CD300A,CD68,CD86,CTSL,EMILIN2, FPR3,HAVCR2,IFI30,LAIR1,LGMN,LILRB3,MS4A4A, PILRA,PLEKHO2,SIGLEC1,SIGLEC7,SIGLEC9,SLC7A7,TMEM150B | BCAT1,C2,C3AR1,CD33,CLEC10A,CMKLR1,CSF1R, FOLR2,HAVCR2,ITGAM,LGMN,LILRA6,LILRB5,MPP1, MS4A4A,MS4A6A,NCF2,RASGRP4,RNASE1,SIGLEC1,VSIG4 | ||||
 |
| ||||
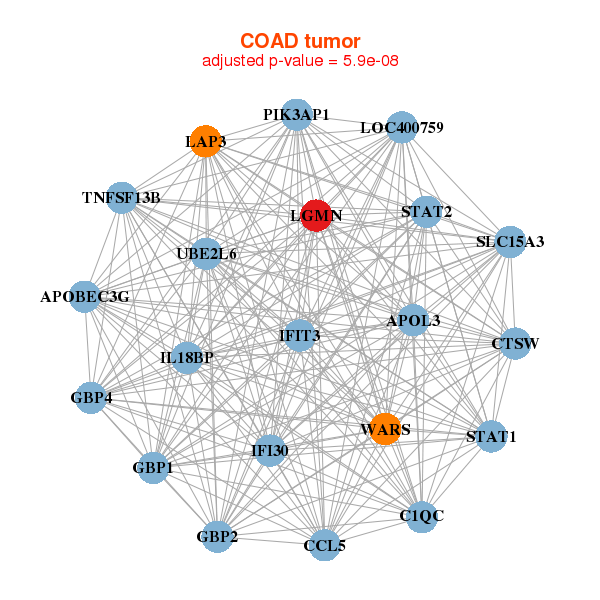
| APOBEC3G,APOL3,C1QC,CCL5,CTSW,GBP1,GBP2, GBP4,IFI30,IFIT3,IL18BP,LAP3,LGMN,LOC400759, PIK3AP1,SLC15A3,STAT1,STAT2,TNFSF13B,UBE2L6,WARS | ACRBP,ALDH3B1,ARRB2,CD68,DNASE1L1,EMB,FTL, GHDC,KCNG2,LGMN,LIPA,LOC647121,MST1,PFKFB4, RHBDL1,SEC16B,SERPINA1,SIRPA,SLC2A7,SLCO2B1,VNN1 |
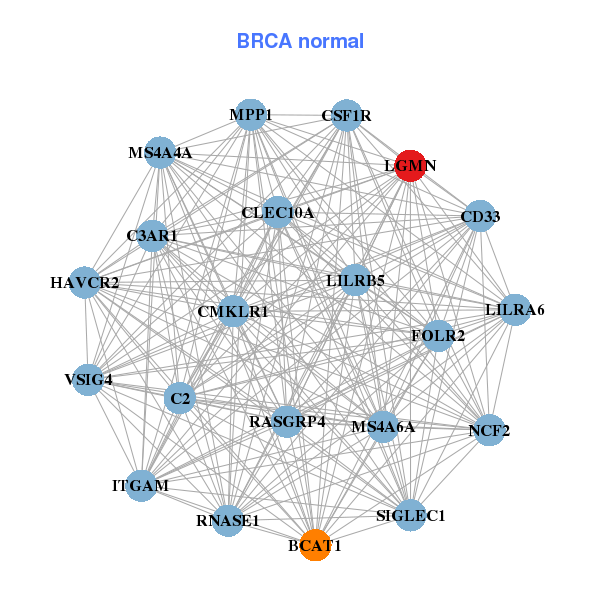
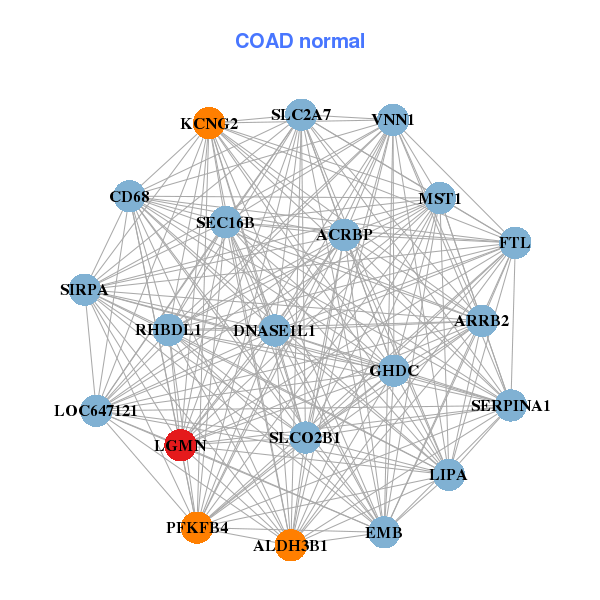
| * Co-Expression network figures were drawn using R package igraph. Only the top 20 genes with the highest correlations were shown. Red circle: input gene, orange circle: cell metabolism gene, sky circle: other gene |
: Open all plots for all cancer types
| Top |
: Open all interacting genes' information including KEGG pathway for all interacting genes from DAVID
| Top |
| Pharmacological Information for LGMN |
| DB Category | DB Name | DB's ID and Url link |
| * Gene Centered Interaction Network. |
 |
| * Drug Centered Interaction Network. |
| DrugBank ID | Target Name | Drug Groups | Generic Name | Drug Centered Network | Drug Structure |
| DB00136 | legumain | approved; nutraceutical | Calcitriol |  | 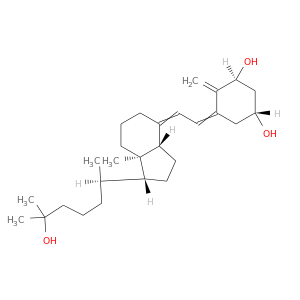 |
| Top |
| Cross referenced IDs for LGMN |
| * We obtained these cross-references from Uniprot database. It covers 150 different DBs, 18 categories. http://www.uniprot.org/help/cross_references_section |
: Open all cross reference information
|
Copyright © 2016-Present - The Univsersity of Texas Health Science Center at Houston @ |