|
||||||||||||||||||||
| |
| Phenotypic Information (metabolism pathway, cancer, disease, phenome) |
| |
| |
| Gene-Gene Network Information: Co-Expression Network, Interacting Genes & KEGG |
| |
|


| Gene Summary for CTPS2 |
| Top |
| Phenotypic Information for CTPS2(metabolism pathway, cancer, disease, phenome) |
| Cancer | CGAP: CTPS2 |
| Familial Cancer Database: CTPS2 | |
| * This gene is included in those cancer gene databases. |
|
|
|
|
|
|
| ||||||||||||||
Oncogene 1 | Significant driver gene in | |||||||||||||||||||
| cf) number; DB name 1 Oncogene; http://nar.oxfordjournals.org/content/35/suppl_1/D721.long, 2 Tumor Suppressor gene; https://bioinfo.uth.edu/TSGene/, 3 Cancer Gene Census; http://www.nature.com/nrc/journal/v4/n3/abs/nrc1299.html, 4 CancerGenes; http://nar.oxfordjournals.org/content/35/suppl_1/D721.long, 5 Network of Cancer Gene; http://ncg.kcl.ac.uk/index.php, 1Therapeutic Vulnerabilities in Cancer; http://cbio.mskcc.org/cancergenomics/statius/ |
| KEGG_PYRIMIDINE_METABOLISM REACTOME_METABOLISM_OF_NUCLEOTIDES | |
| OMIM | |
| Orphanet | |
| Disease | KEGG Disease: CTPS2 |
| MedGen: CTPS2 (Human Medical Genetics with Condition) | |
| ClinVar: CTPS2 | |
| Phenotype | MGI: CTPS2 (International Mouse Phenotyping Consortium) |
| PhenomicDB: CTPS2 | |
| Mutations for CTPS2 |
| * Under tables are showing count per each tissue to give us broad intuition about tissue specific mutation patterns.You can go to the detailed page for each mutation database's web site. |
| There's no structural variation information in COSMIC data for this gene. |
| * From mRNA Sanger sequences, Chitars2.0 arranged chimeric transcripts. This table shows CTPS2 related fusion information. |
| ID | Head Gene | Tail Gene | Accession | Gene_a | qStart_a | qEnd_a | Chromosome_a | tStart_a | tEnd_a | Gene_a | qStart_a | qEnd_a | Chromosome_a | tStart_a | tEnd_a |
| BF839137 | CTPS2 | 172 | 304 | X | 16672561 | 16672693 | SEC31A | 298 | 505 | 4 | 83803618 | 83803824 | |
| BE826026 | ERCC1 | 2 | 324 | 19 | 45977981 | 45978305 | CTPS2 | 321 | 389 | X | 16684855 | 16684923 | |
| CV403184 | CTPS2 | 6 | 152 | X | 16673802 | 16673950 | CTPS2 | 153 | 372 | X | 16659860 | 16660078 | |
| Top |
| There's no copy number variation information in COSMIC data for this gene. |
| Top |
|
 |
| Top |
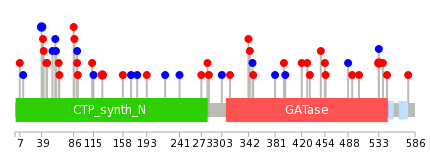
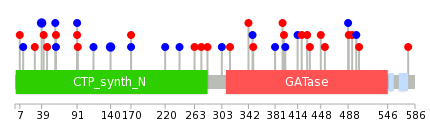
| Stat. for Non-Synonymous SNVs (# total SNVs=28) | (# total SNVs=14) |
 |  |
(# total SNVs=1) | (# total SNVs=0) |
 |
| Top |
| * When you move the cursor on each content, you can see more deailed mutation information on the Tooltip. Those are primary_site,primary_histology,mutation(aa),pubmedID. |
| GRCh37 position | Mutation(aa) | Unique sampleID count |
| chr23:16720909-16720909 | p.I39I | 2 |
| chr23:16716413-16716413 | p.Q128H | 2 |
| chr23:16627757-16627757 | p.P533L | 2 |
| chr23:16701278-16701278 | p.A315V | 1 |
| chr23:16720901-16720901 | p.Y42C | 1 |
| chr23:16635272-16635272 | p.? | 1 |
| chr23:16711539-16711539 | p.A170A | 1 |
| chr23:16685777-16685777 | p.? | 1 |
| chr23:16717123-16717123 | p.N87S | 1 |
| chr23:16701301-16701301 | p.Y307* | 1 |
| Top |
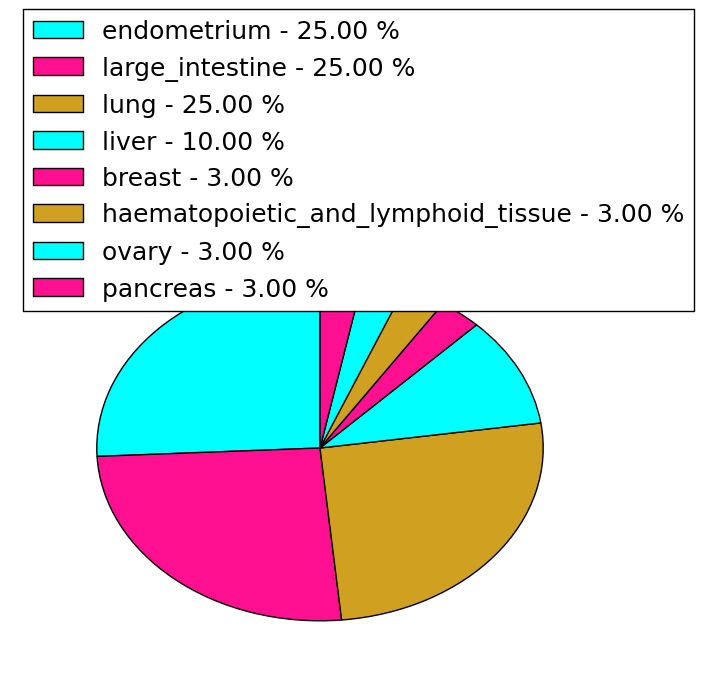
|
 |
| Point Mutation/ Tissue ID | 1 | 2 | 3 | 4 | 5 | 6 | 7 | 8 | 9 | 10 | 11 | 12 | 13 | 14 | 15 | 16 | 17 | 18 | 19 | 20 |
| # sample | 1 | 2 | 3 | 1 | 1 | 6 | 2 | 4 | 5 | 2 | 1 | 10 | ||||||||
| # mutation | 1 | 2 | 3 | 1 | 1 | 7 | 2 | 4 | 6 | 2 | 2 | 12 | ||||||||
| nonsynonymous SNV | 1 | 3 | 6 | 1 | 1 | 3 | 2 | 1 | 6 | |||||||||||
| synonymous SNV | 1 | 1 | 1 | 1 | 1 | 1 | 3 | 3 | 1 | 6 |
| cf) Tissue ID; Tissue type (1; BLCA[Bladder Urothelial Carcinoma], 2; BRCA[Breast invasive carcinoma], 3; CESC[Cervical squamous cell carcinoma and endocervical adenocarcinoma], 4; COAD[Colon adenocarcinoma], 5; GBM[Glioblastoma multiforme], 6; Glioma Low Grade, 7; HNSC[Head and Neck squamous cell carcinoma], 8; KICH[Kidney Chromophobe], 9; KIRC[Kidney renal clear cell carcinoma], 10; KIRP[Kidney renal papillary cell carcinoma], 11; LAML[Acute Myeloid Leukemia], 12; LUAD[Lung adenocarcinoma], 13; LUSC[Lung squamous cell carcinoma], 14; OV[Ovarian serous cystadenocarcinoma ], 15; PAAD[Pancreatic adenocarcinoma], 16; PRAD[Prostate adenocarcinoma], 17; SKCM[Skin Cutaneous Melanoma], 18:STAD[Stomach adenocarcinoma], 19:THCA[Thyroid carcinoma], 20:UCEC[Uterine Corpus Endometrial Carcinoma]) |
| Top |
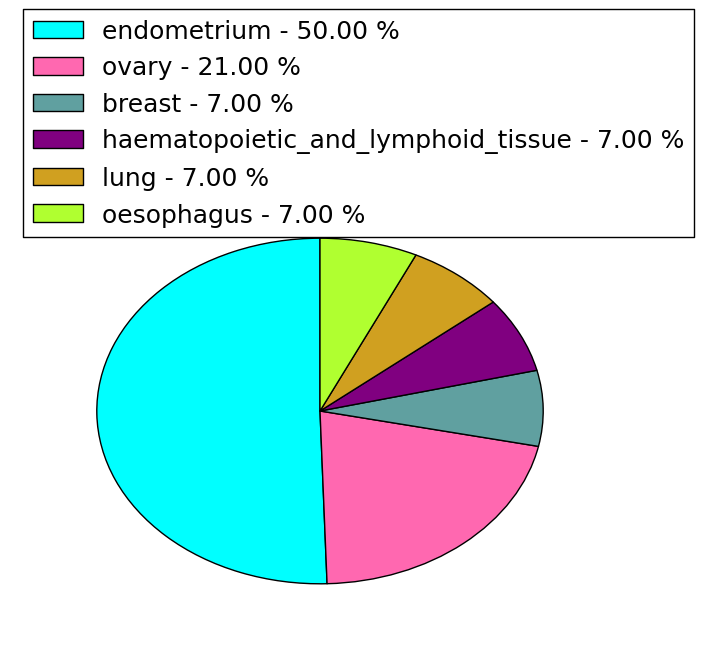
| * We represented just top 10 SNVs. When you move the cursor on each content, you can see more deailed mutation information on the Tooltip. Those are primary_site, primary_histology, mutation(aa), pubmedID. |
| Genomic Position | Mutation(aa) | Unique sampleID count |
| chrX:16716377 | p.P140P,CTPS2 | 2 |
| chrX:16720909 | p.I39I,CTPS2 | 2 |
| chrX:16657320 | p.L432V,CTPS2 | 1 |
| chrX:16720940 | p.V241V,CTPS2 | 1 |
| chrX:16696555 | p.S12S,CTPS2 | 1 |
| chrX:16716452 | p.A428T,CTPS2 | 1 |
| chrX:16685639 | p.T220T,CTPS2 | 1 |
| chrX:16720990 | p.T7M,CTPS2 | 1 |
| chrX:16701278 | p.D420N,CTPS2 | 1 |
| chrX:16717107 | p.A170A,CTPS2 | 1 |
| * Copy number data were extracted from TCGA using R package TCGA-Assembler. The URLs of all public data files on TCGA DCC data server were gathered on Jan-05-2015. Function ProcessCNAData in TCGA-Assembler package was used to obtain gene-level copy number value which is calculated as the average copy number of the genomic region of a gene. |
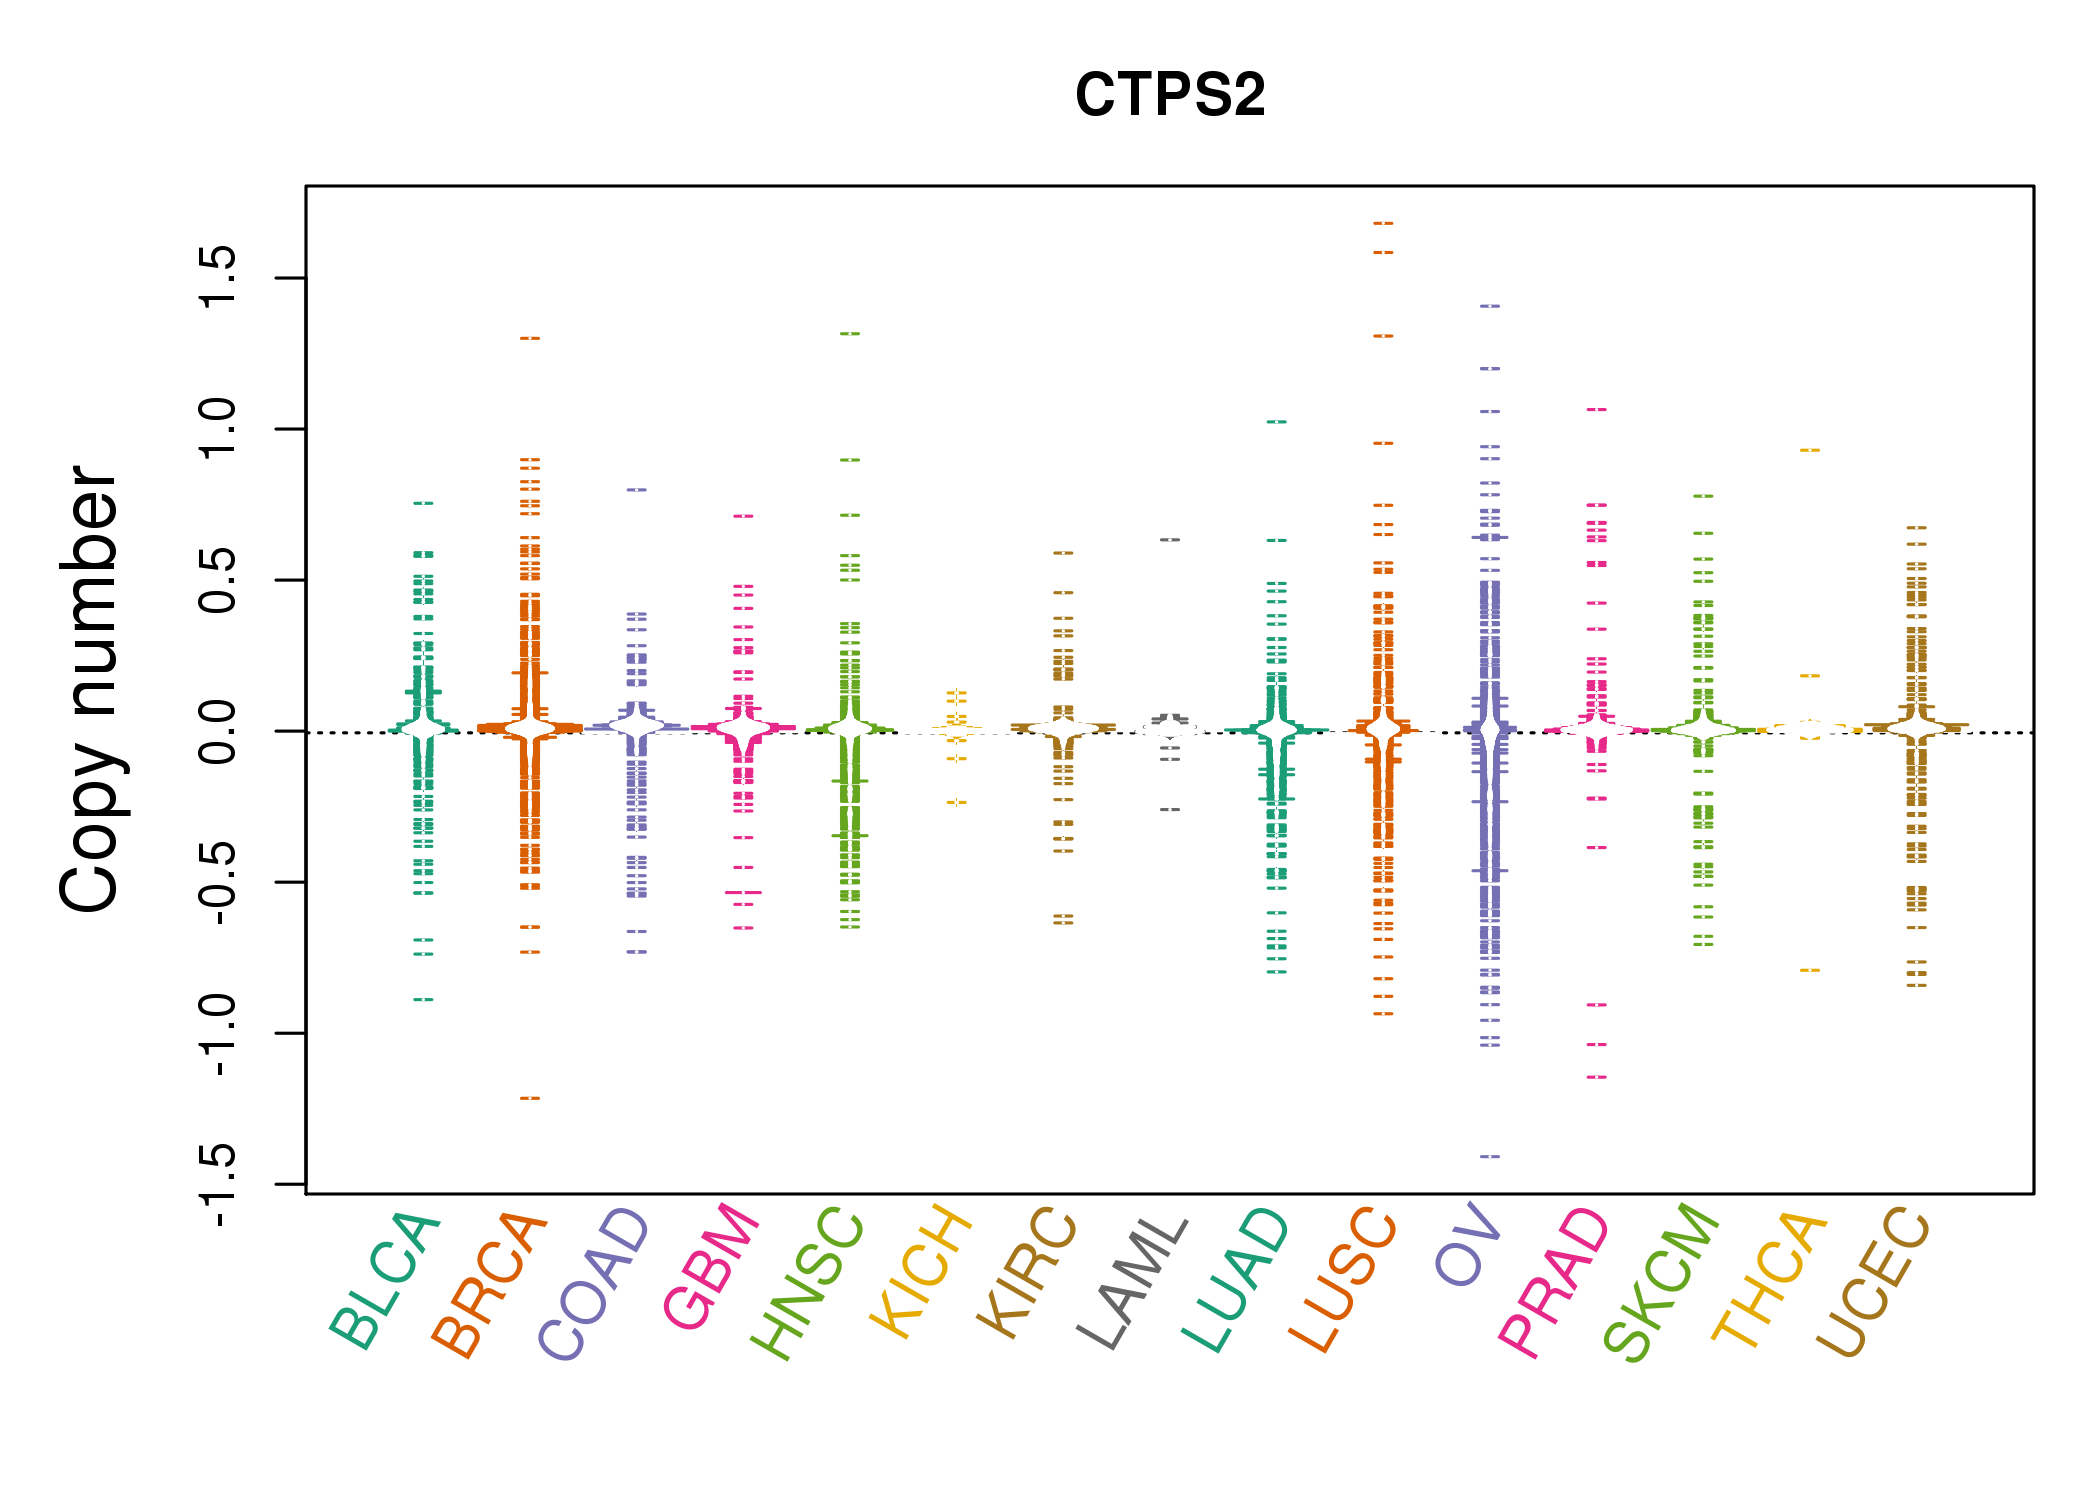 |
| cf) Tissue ID[Tissue type]: BLCA[Bladder Urothelial Carcinoma], BRCA[Breast invasive carcinoma], CESC[Cervical squamous cell carcinoma and endocervical adenocarcinoma], COAD[Colon adenocarcinoma], GBM[Glioblastoma multiforme], Glioma Low Grade, HNSC[Head and Neck squamous cell carcinoma], KICH[Kidney Chromophobe], KIRC[Kidney renal clear cell carcinoma], KIRP[Kidney renal papillary cell carcinoma], LAML[Acute Myeloid Leukemia], LUAD[Lung adenocarcinoma], LUSC[Lung squamous cell carcinoma], OV[Ovarian serous cystadenocarcinoma ], PAAD[Pancreatic adenocarcinoma], PRAD[Prostate adenocarcinoma], SKCM[Skin Cutaneous Melanoma], STAD[Stomach adenocarcinoma], THCA[Thyroid carcinoma], UCEC[Uterine Corpus Endometrial Carcinoma] |
| Top |
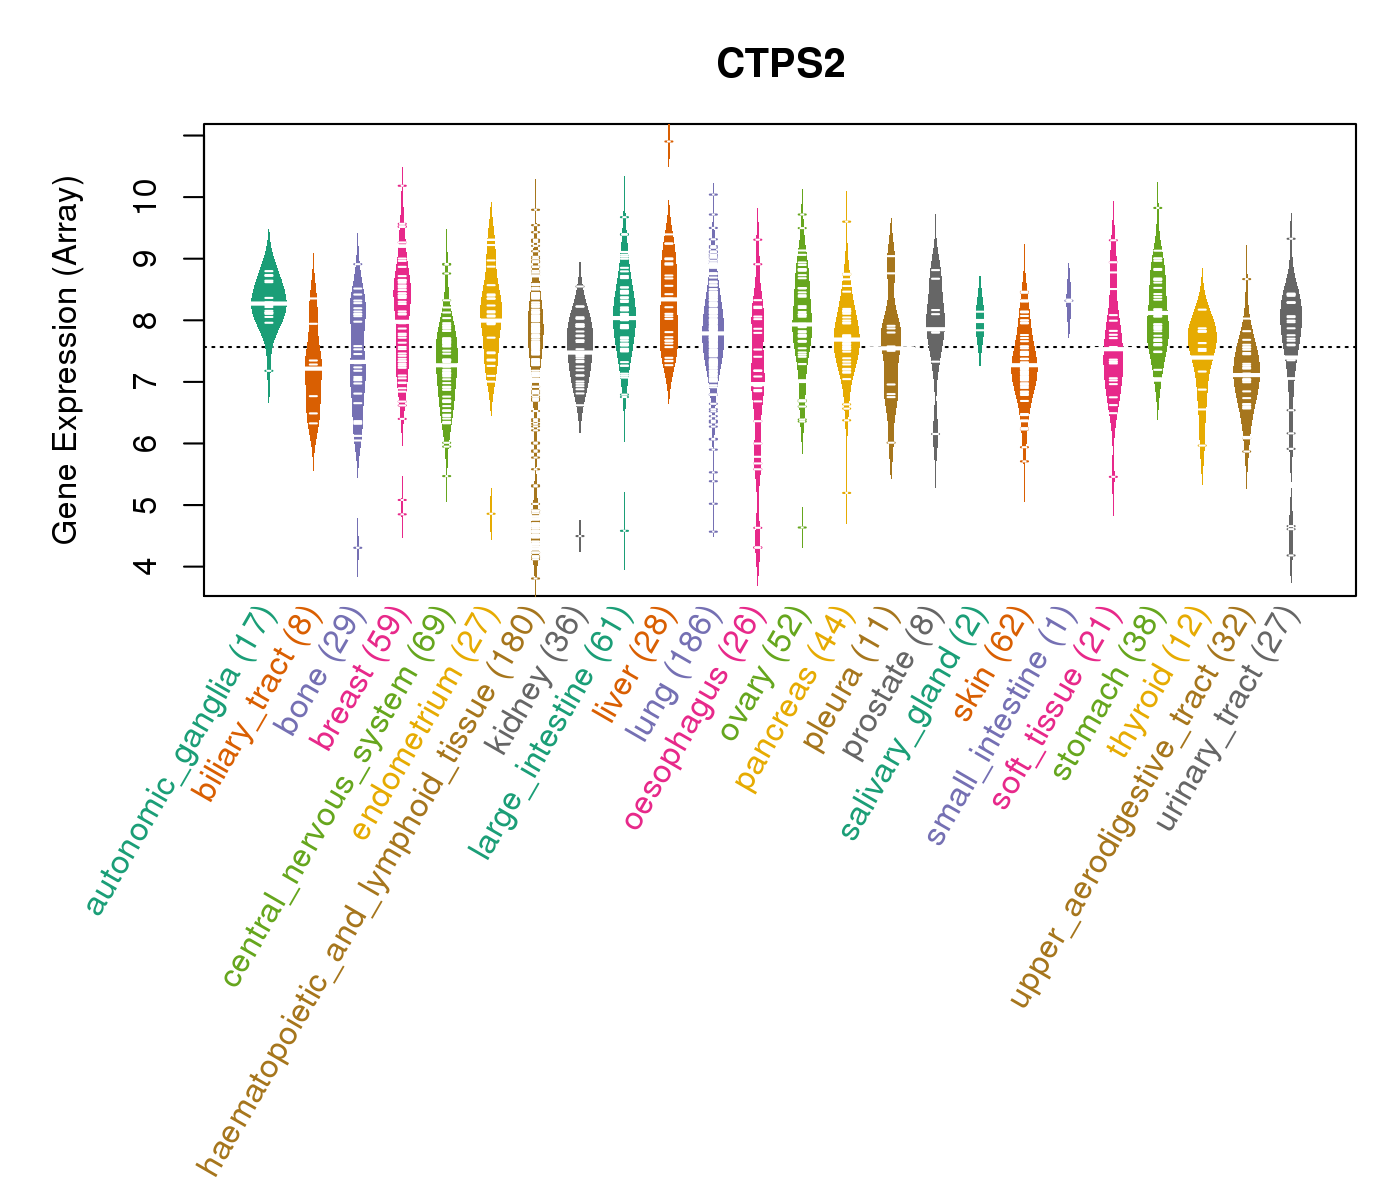
| Gene Expression for CTPS2 |
| * CCLE gene expression data were extracted from CCLE_Expression_Entrez_2012-10-18.res: Gene-centric RMA-normalized mRNA expression data. |
 |
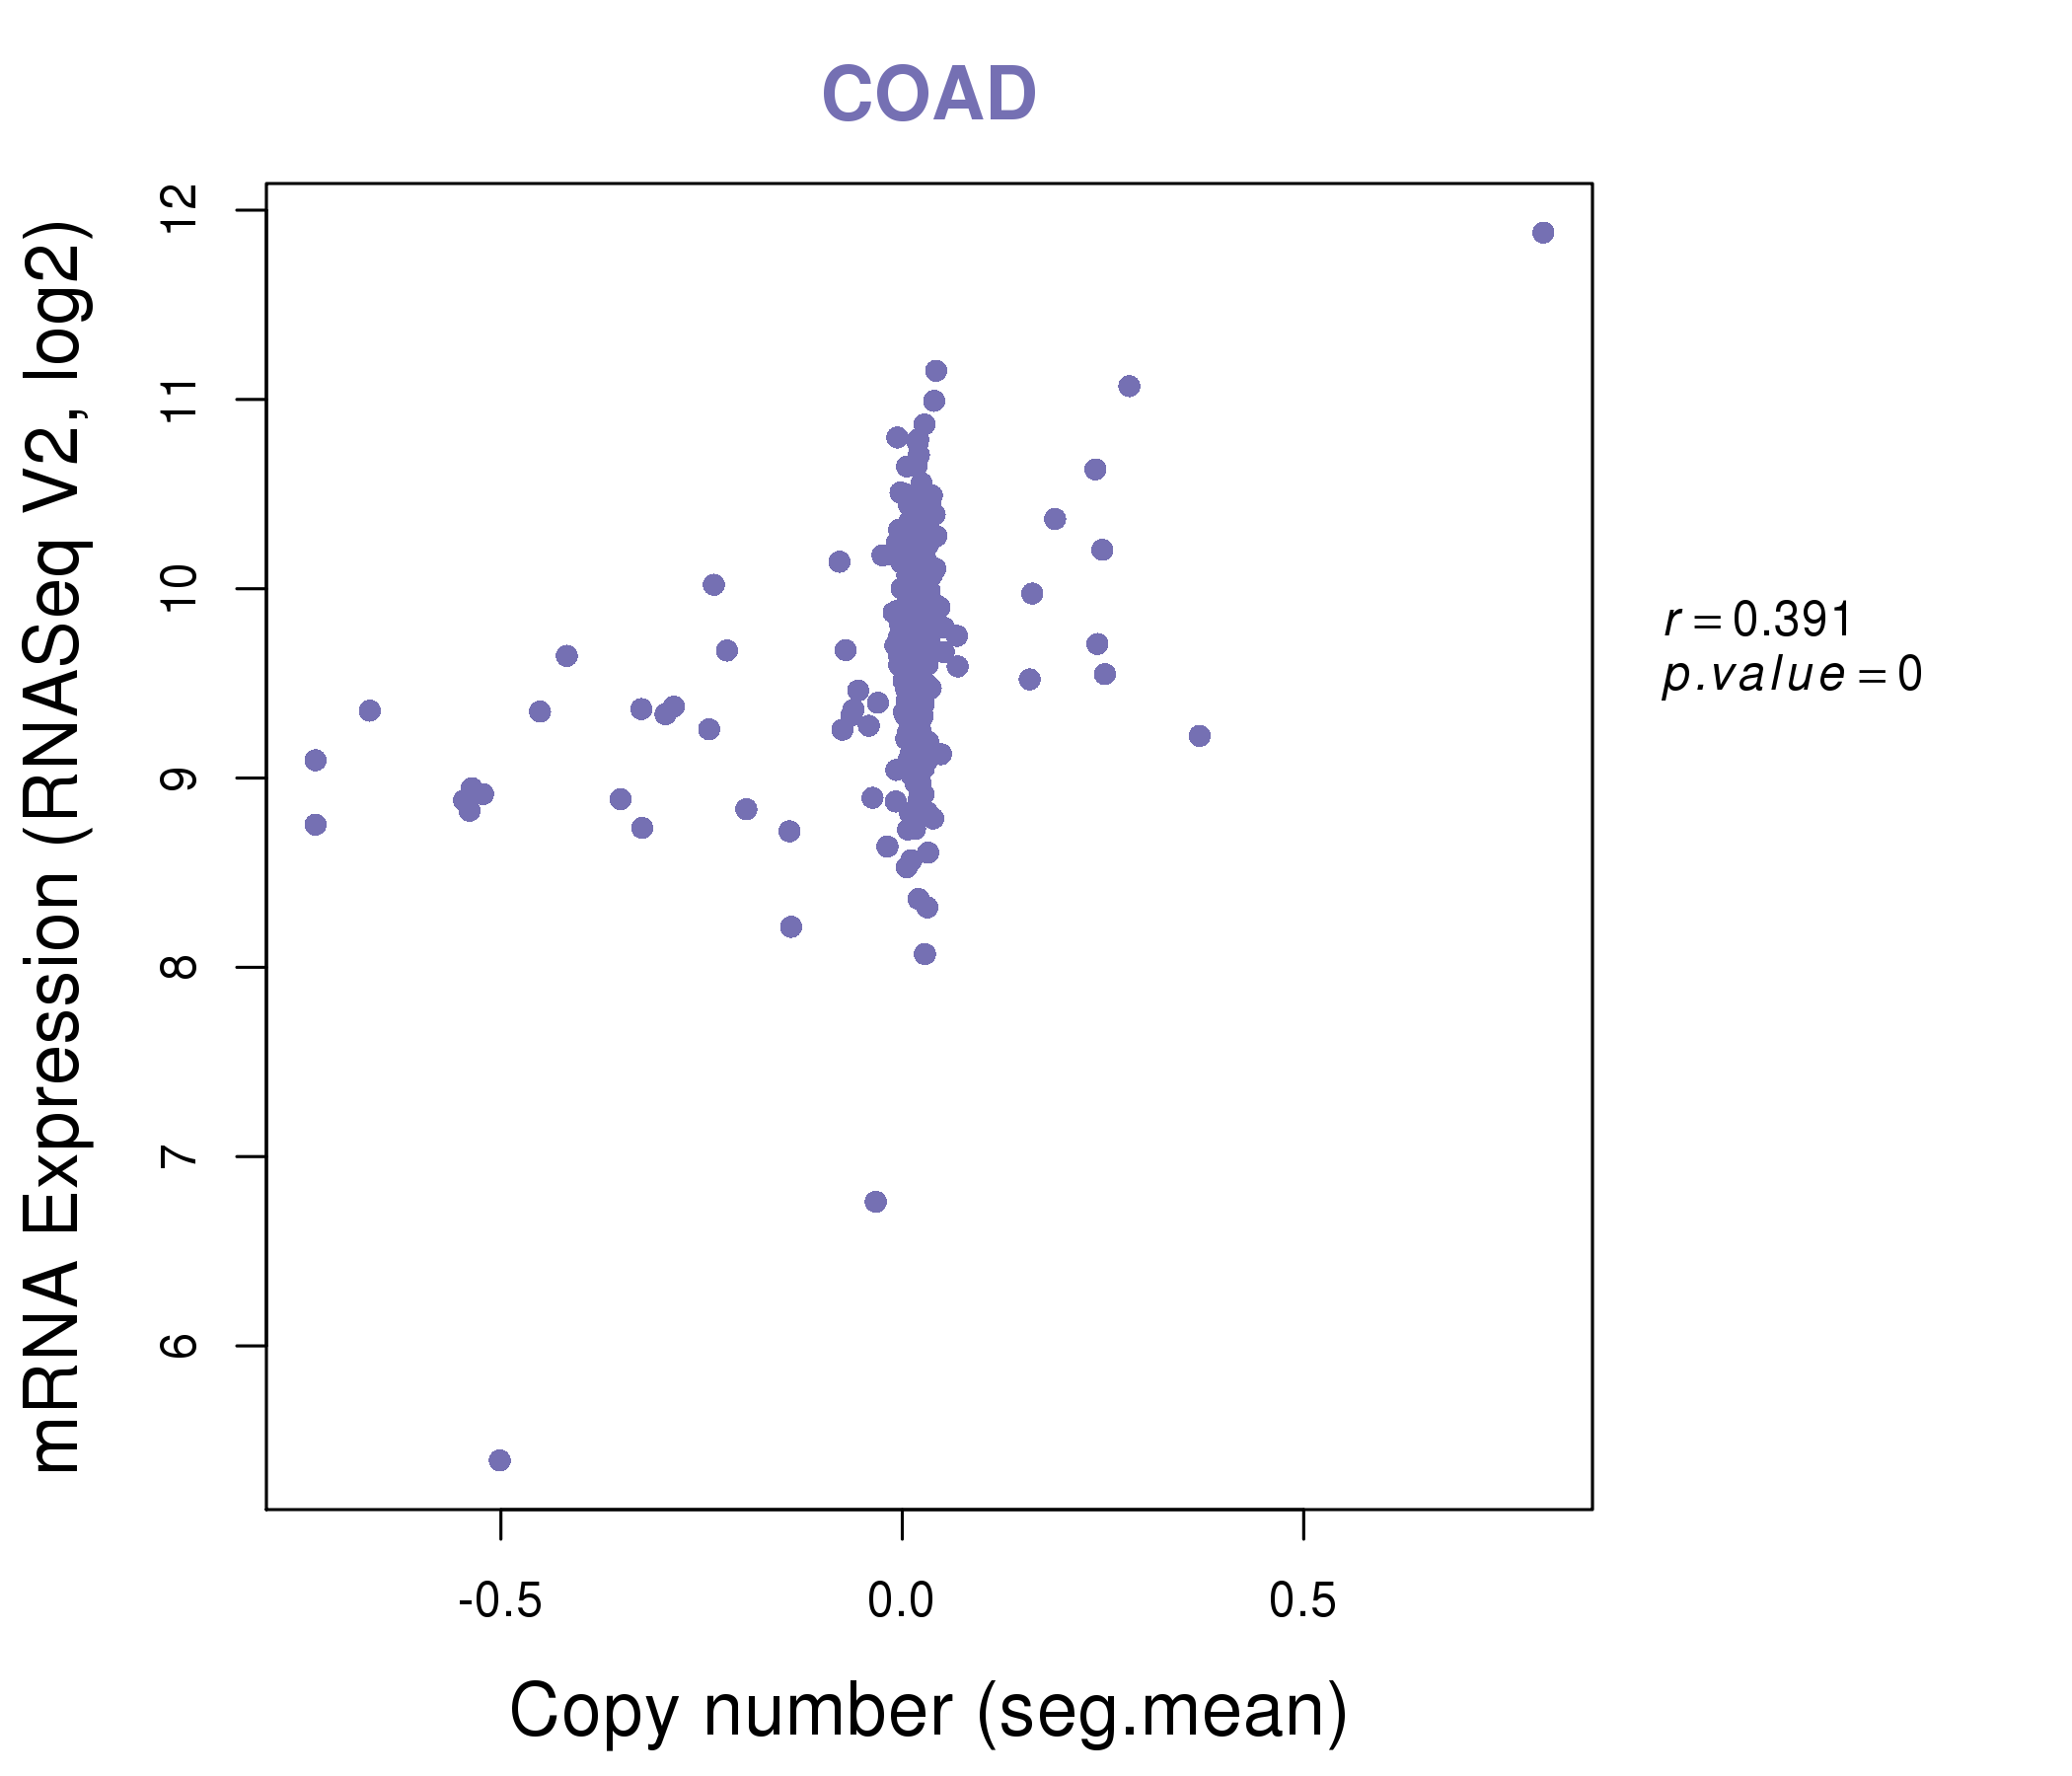
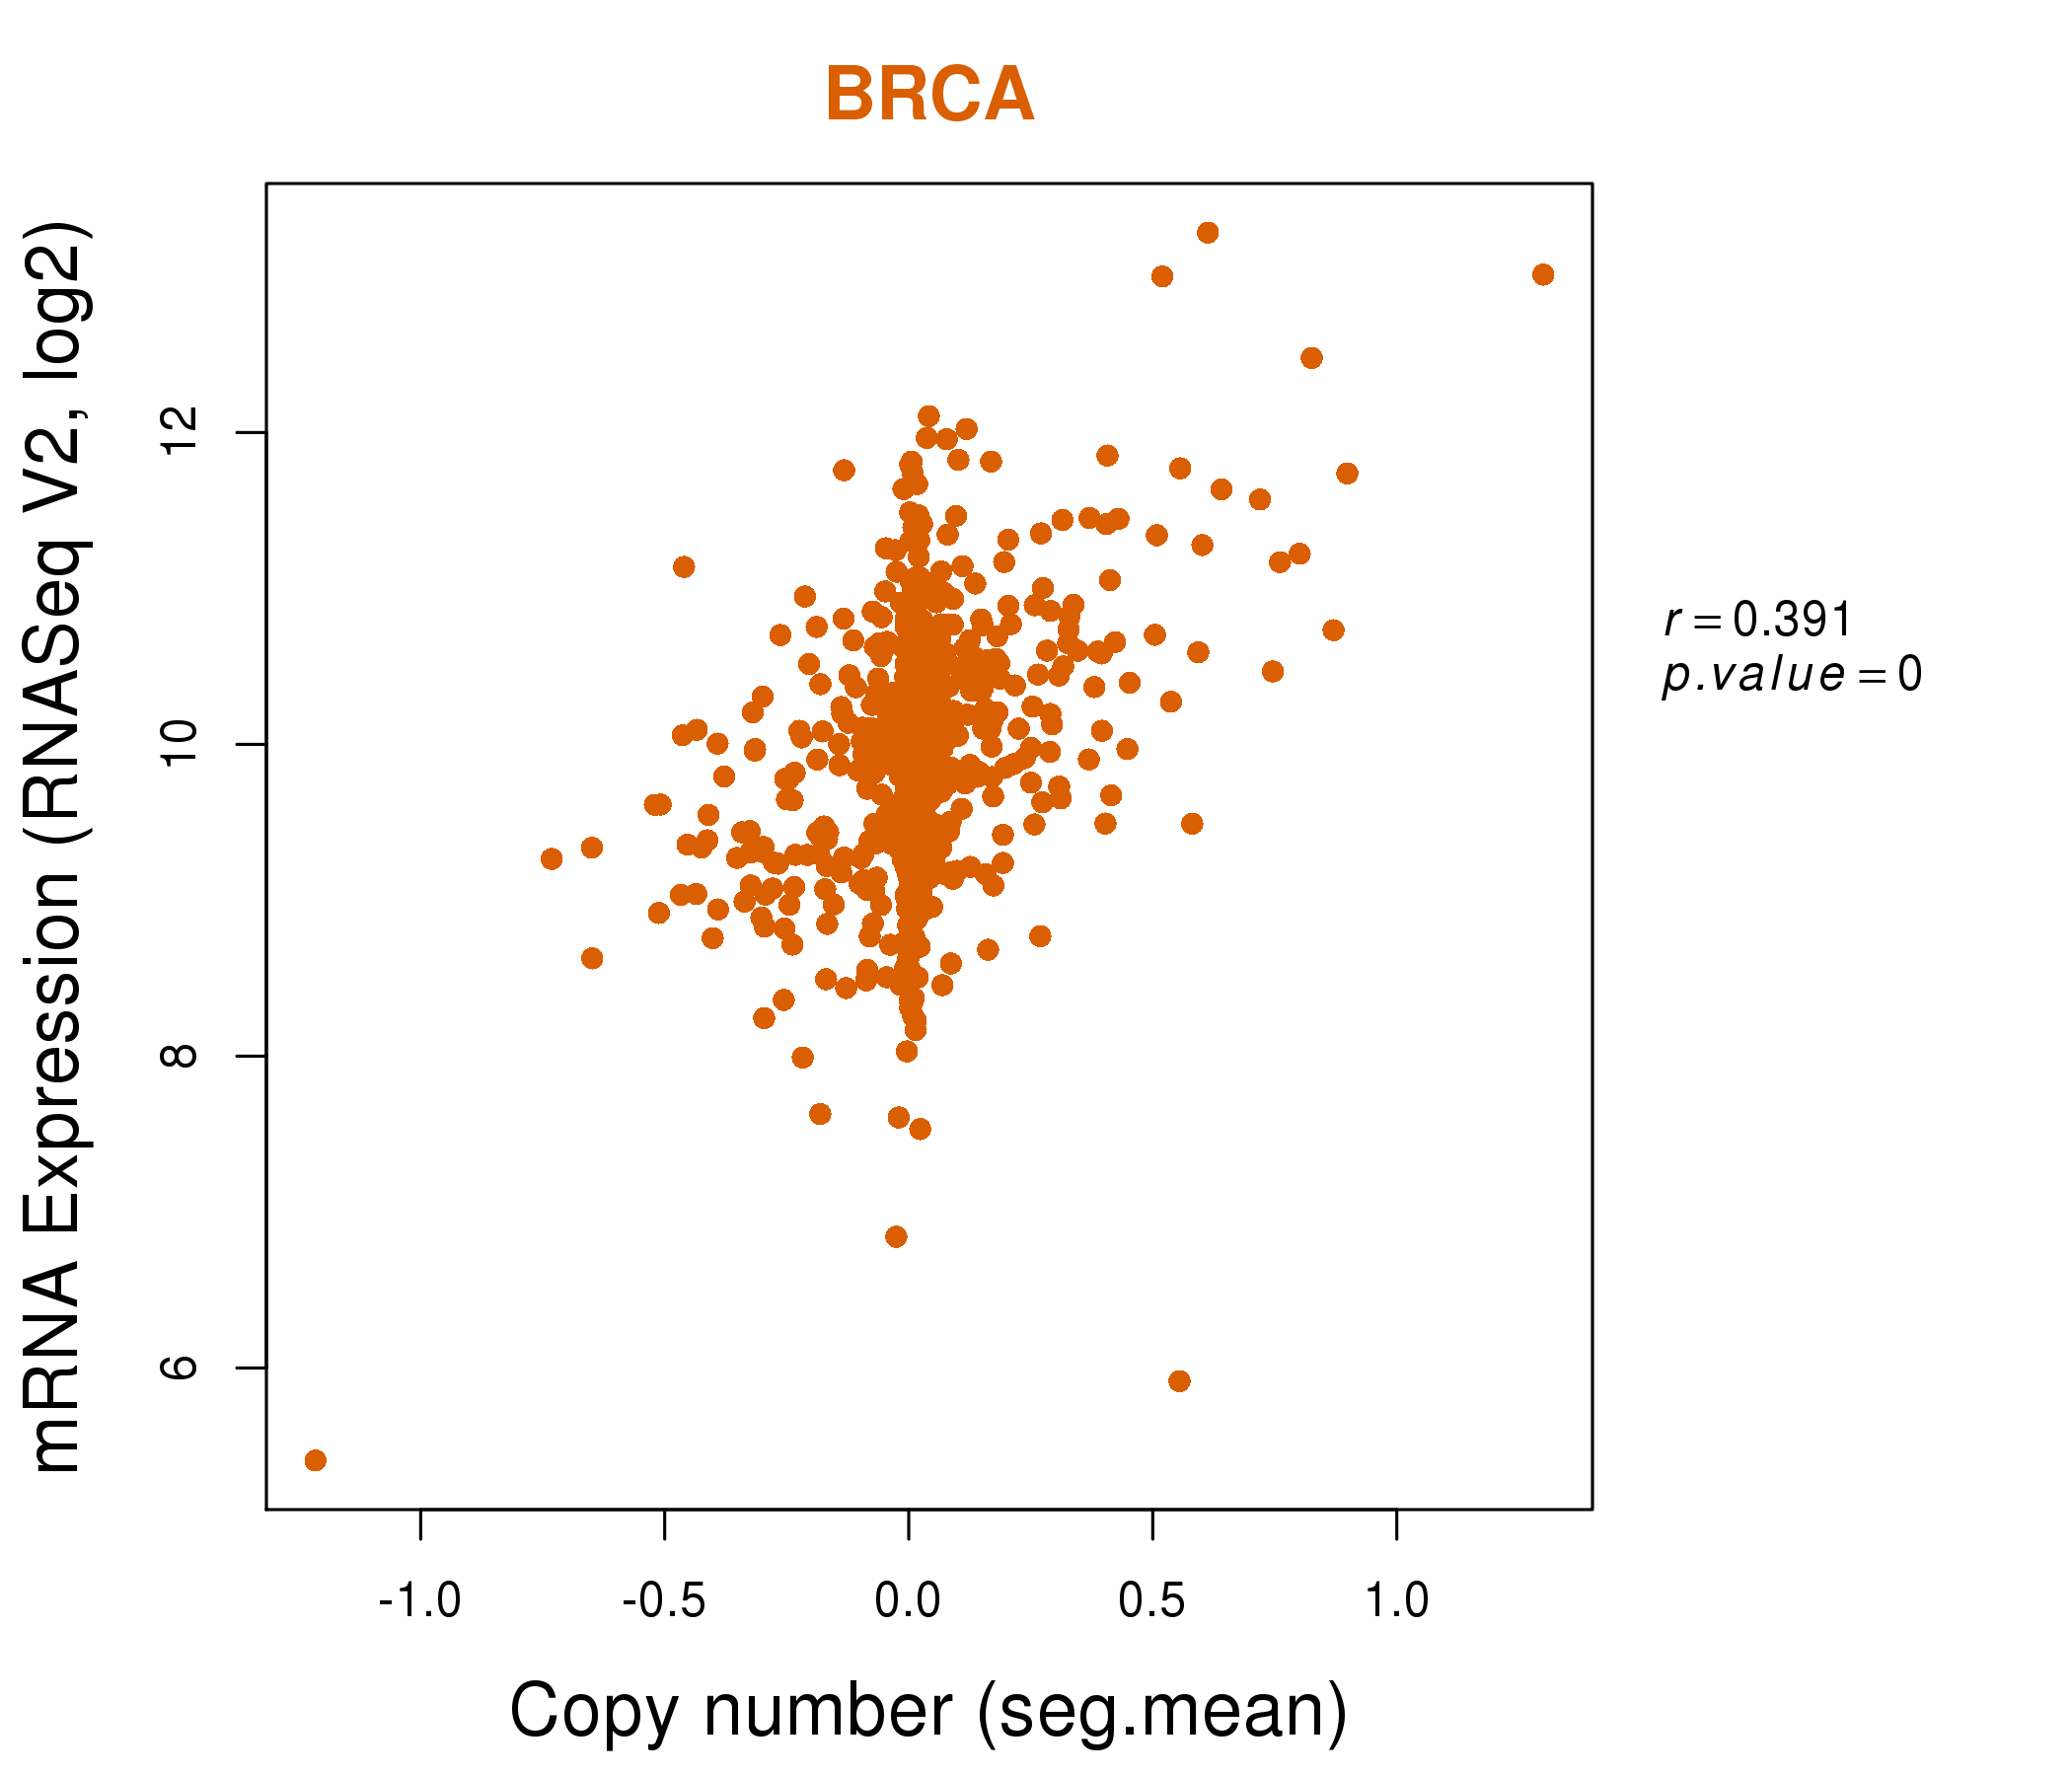
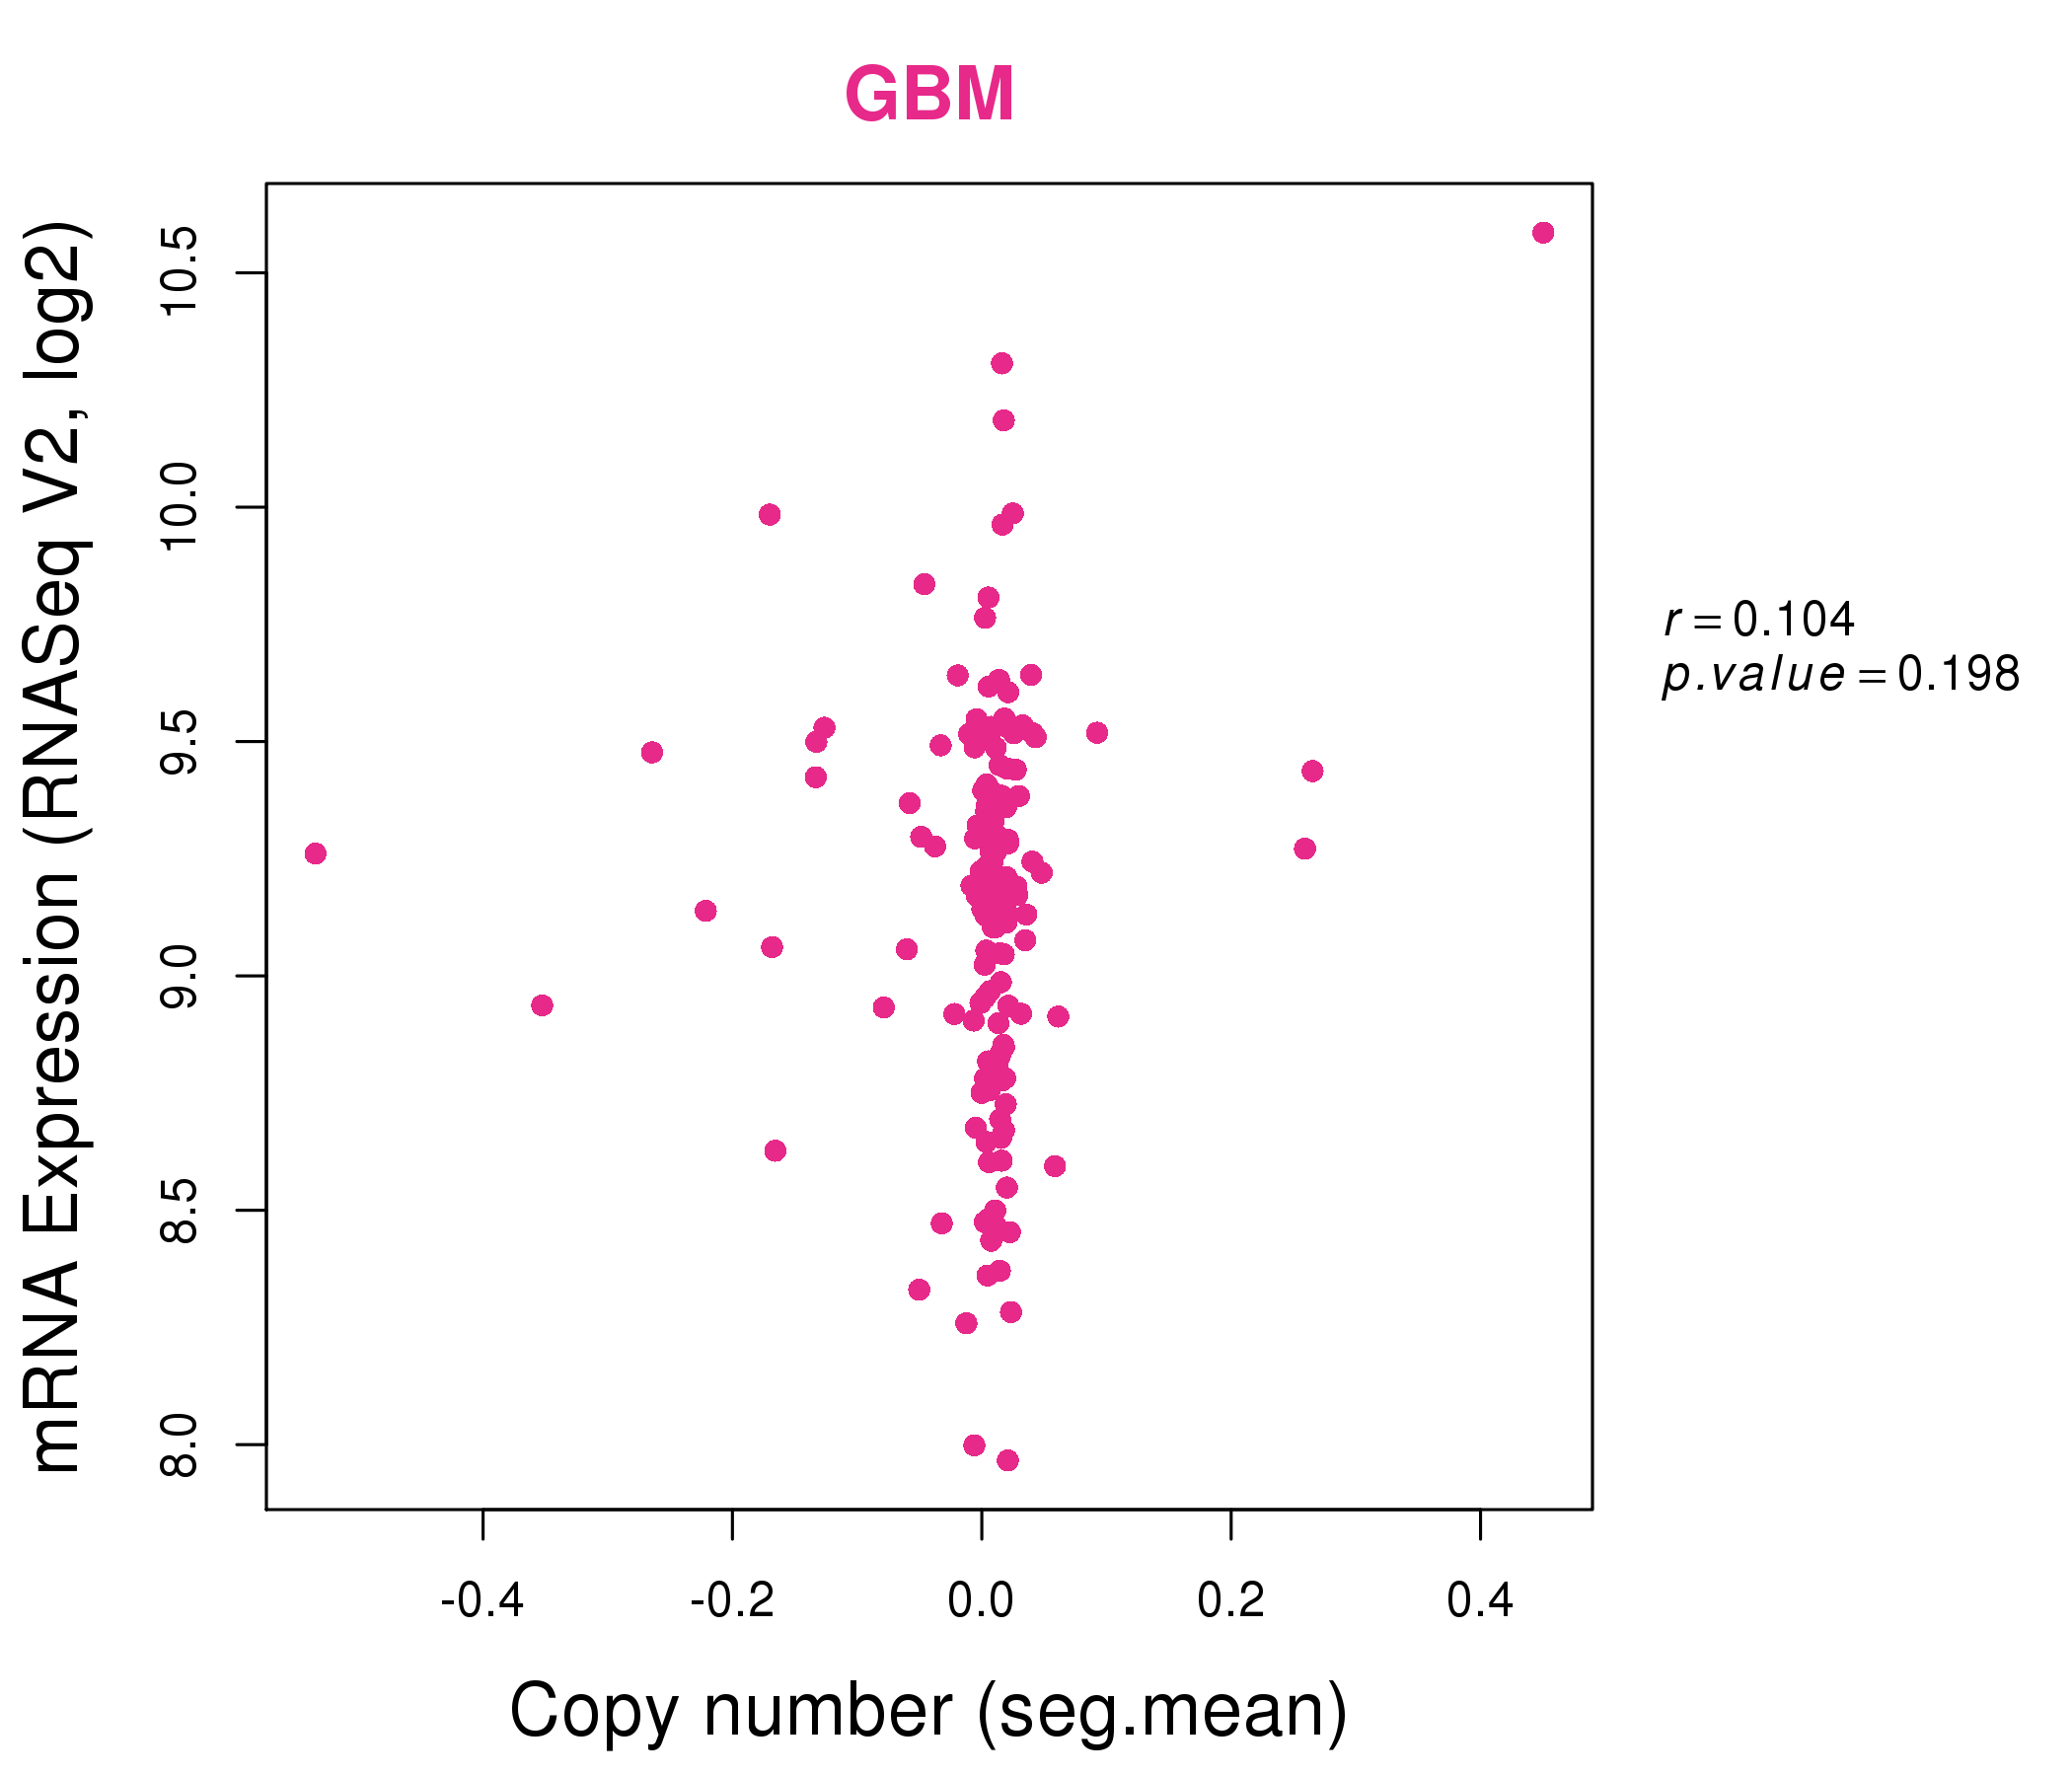
| * Normalized gene expression data of RNASeqV2 was extracted from TCGA using R package TCGA-Assembler. The URLs of all public data files on TCGA DCC data server were gathered at Jan-05-2015. Only eight cancer types have enough normal control samples for differential expression analysis. (t test, adjusted p<0.05 (using Benjamini-Hochberg FDR)) |
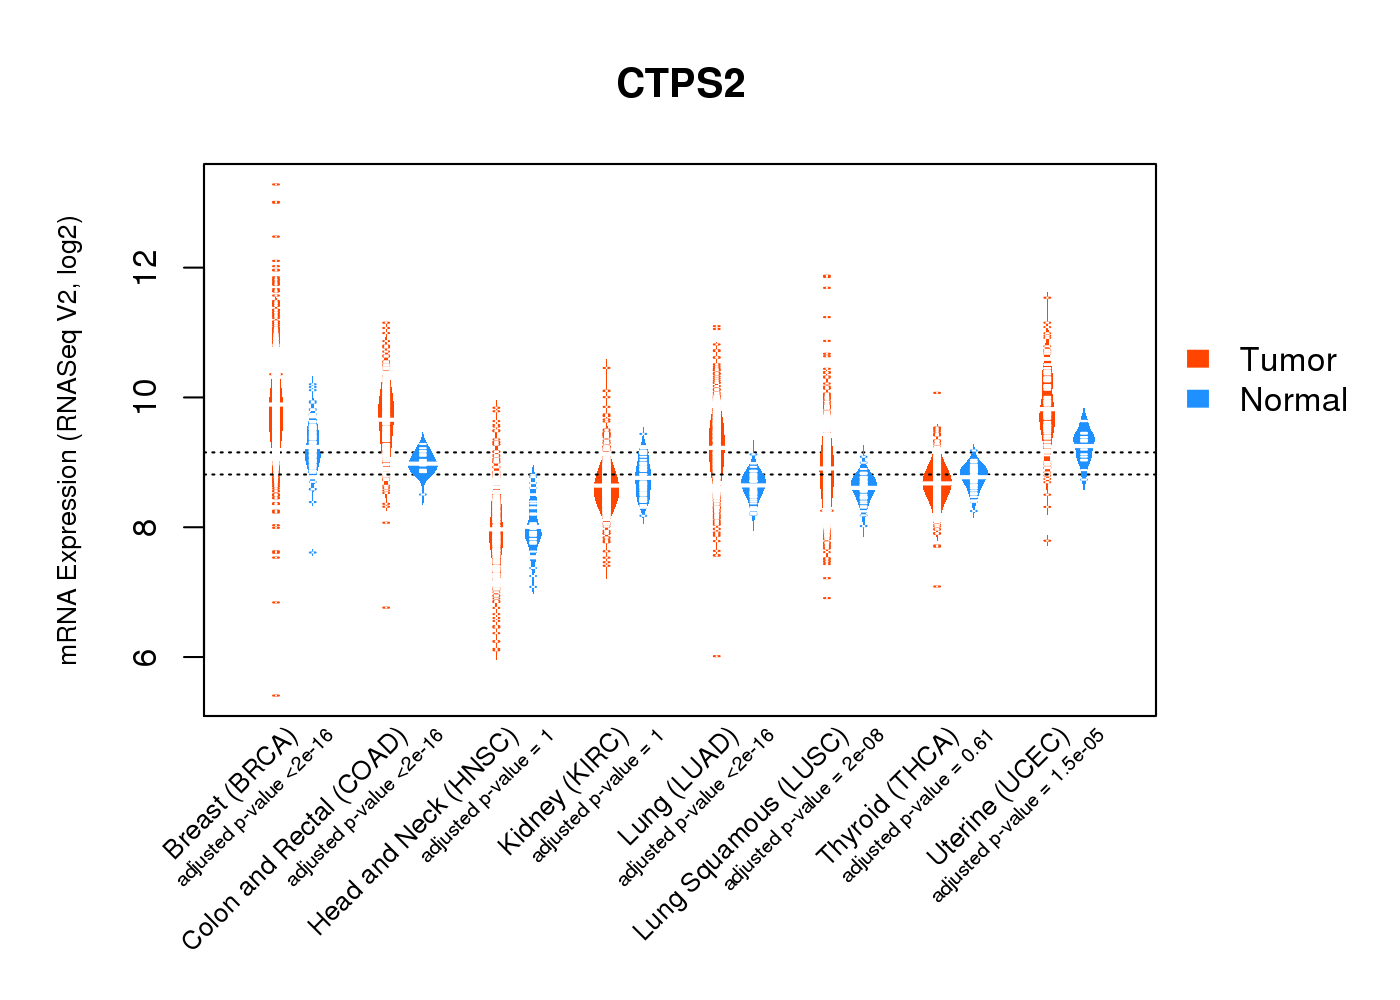 |
| Top |
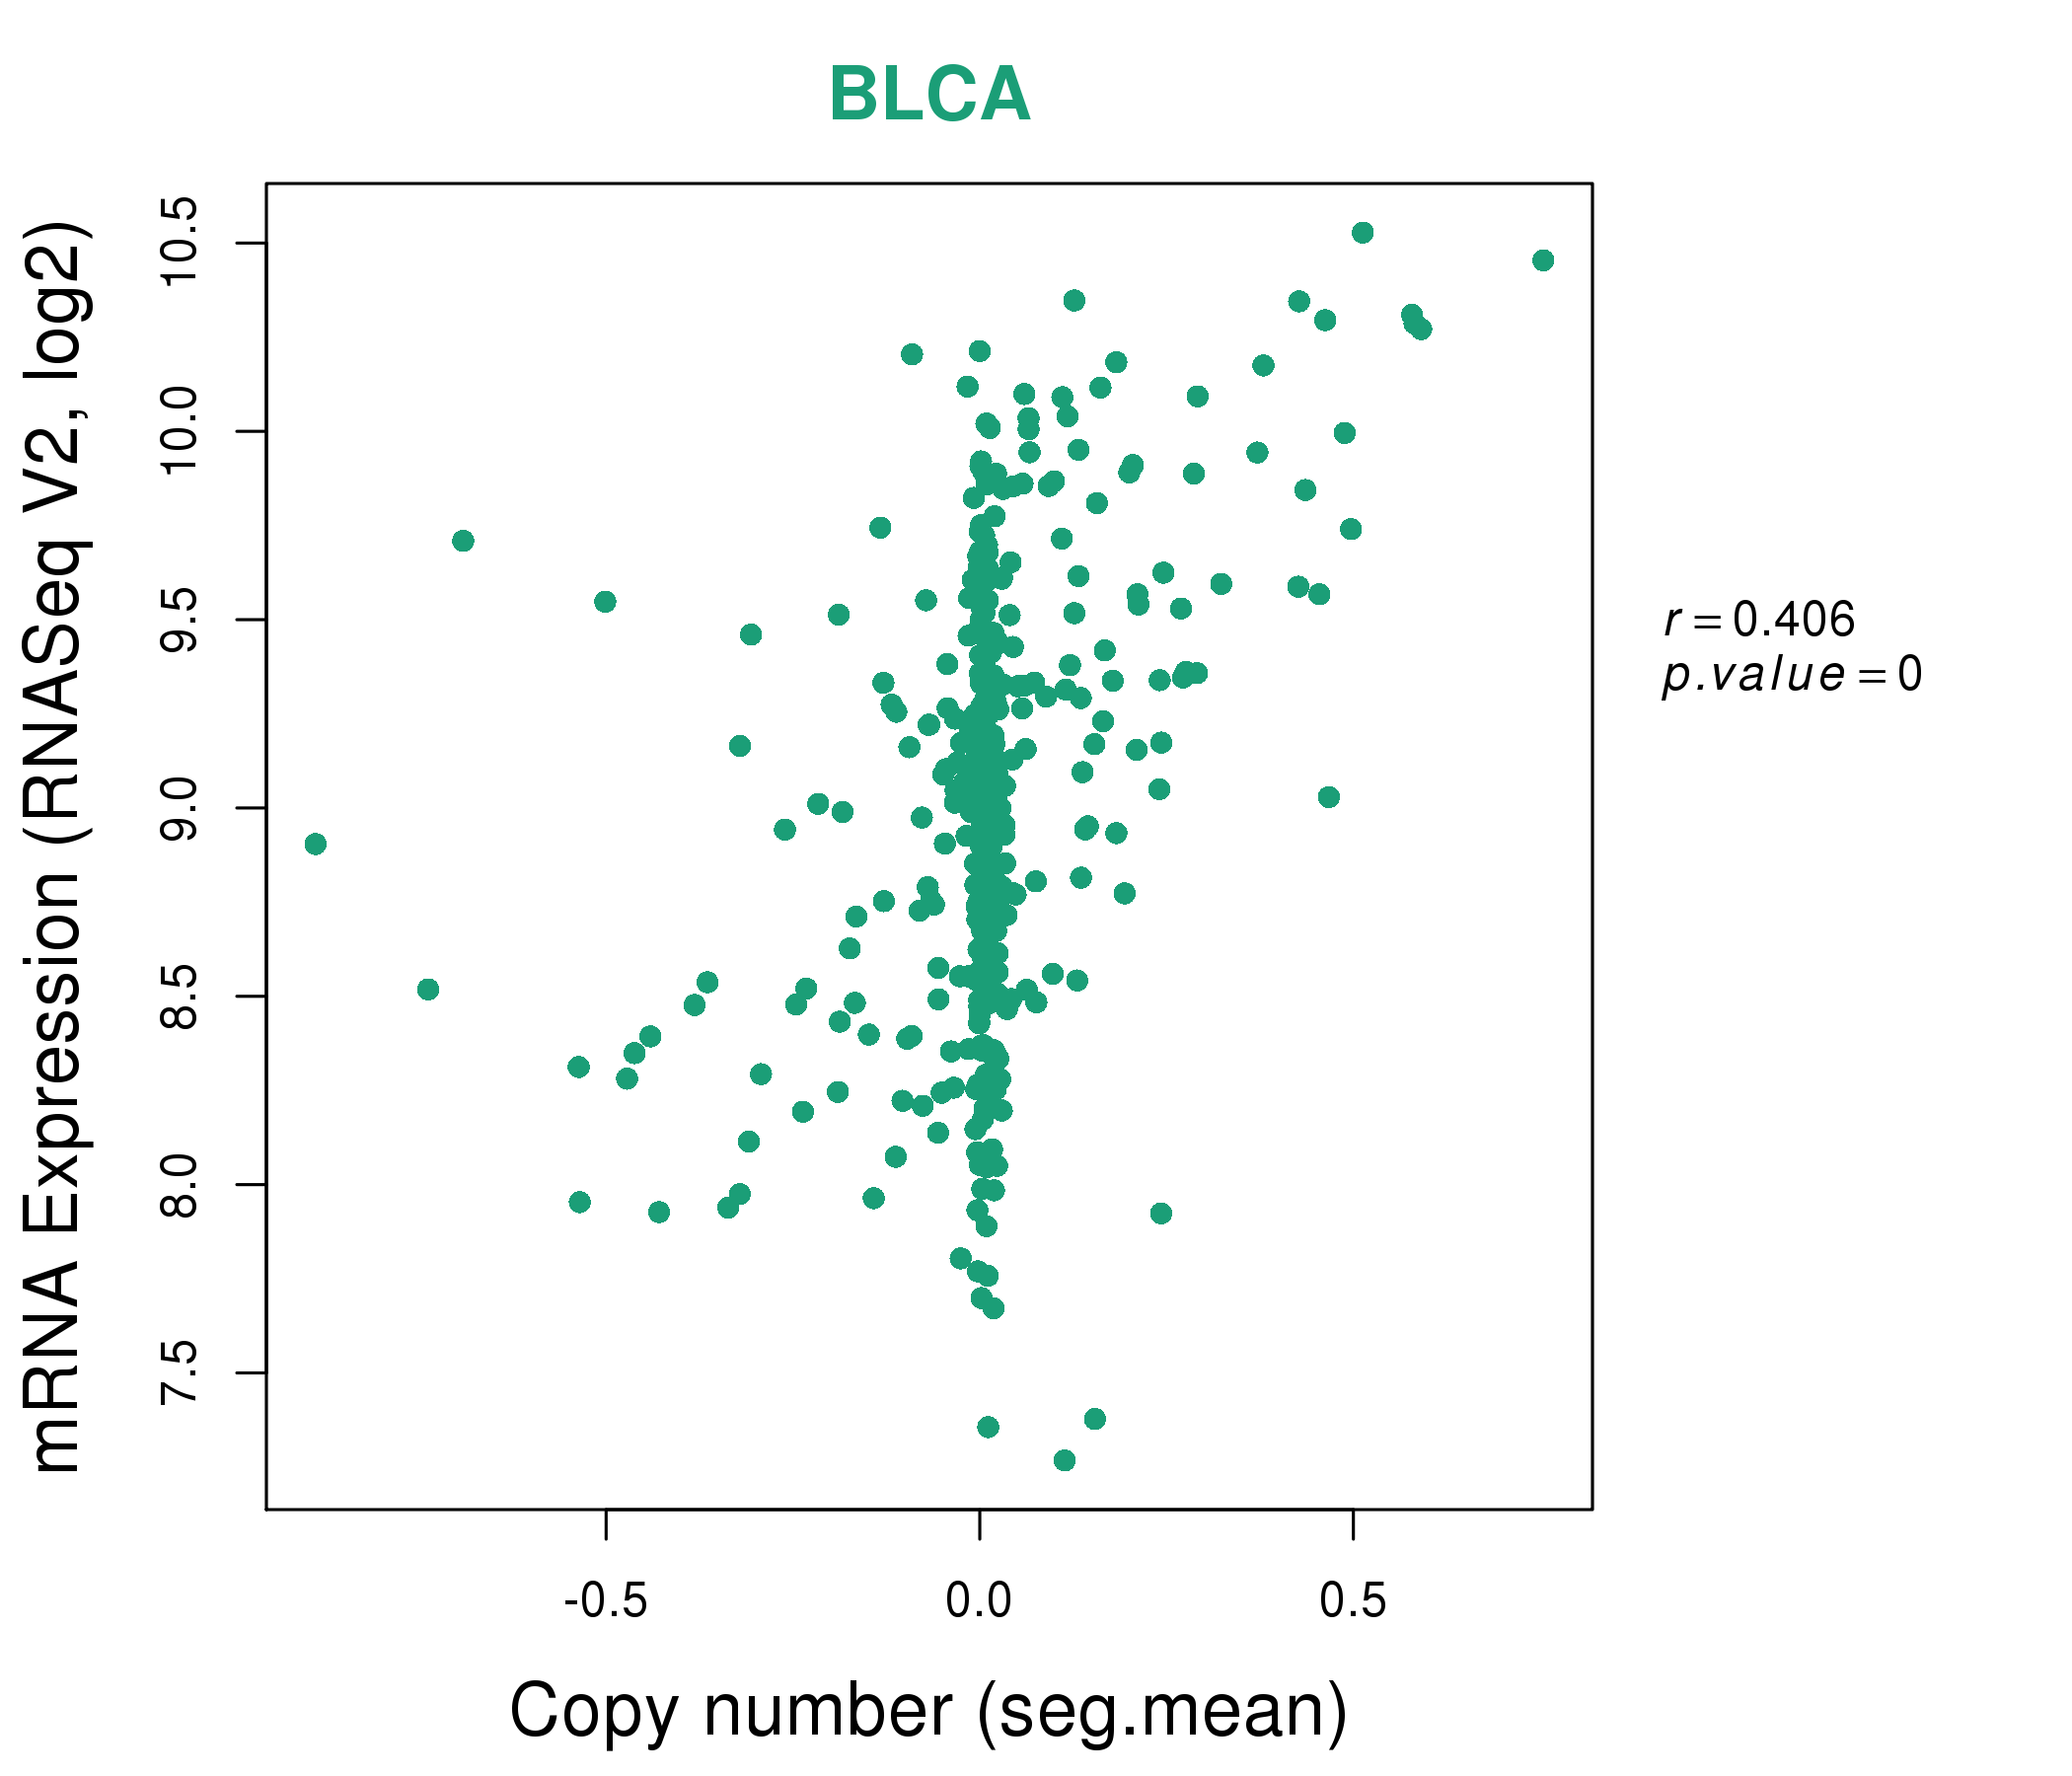
| * This plots show the correlation between CNV and gene expression. |
: Open all plots for all cancer types
 |
|
 |
|
| Top |
| Gene-Gene Network Information |
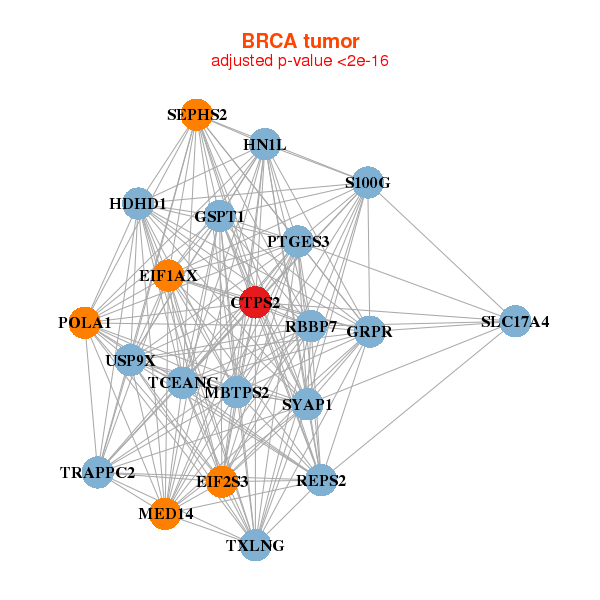
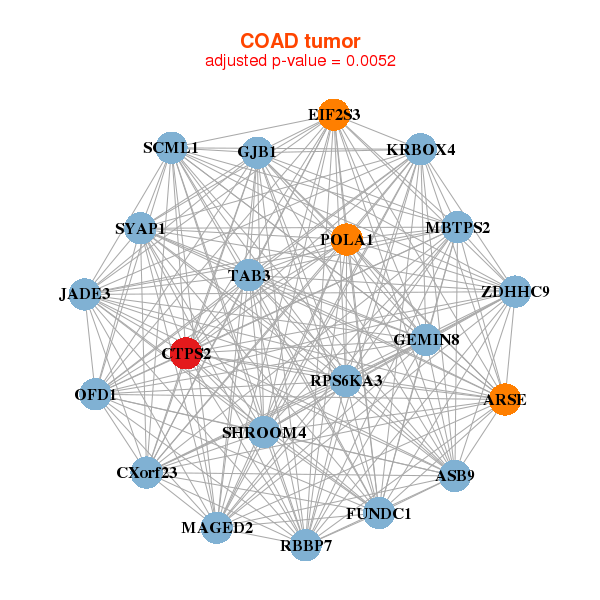
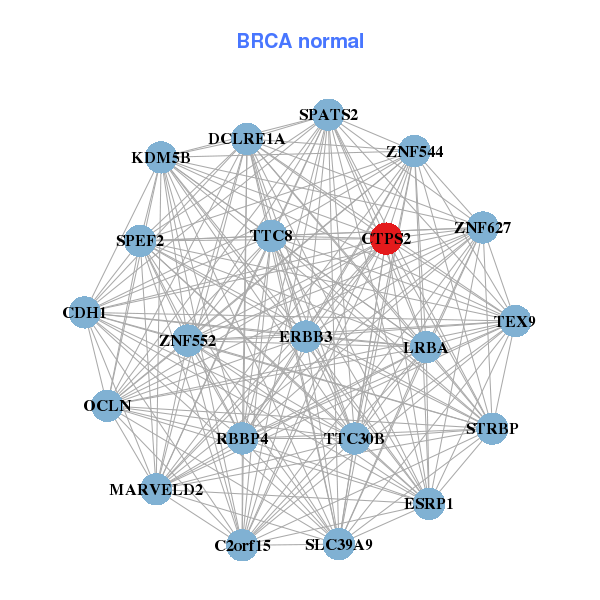
| * Co-Expression network figures were drawn using R package igraph. Only the top 20 genes with the highest correlations were shown. Red circle: input gene, orange circle: cell metabolism gene, sky circle: other gene |
: Open all plots for all cancer types
 |
|
| CTPS2,EIF1AX,EIF2S3,GRPR,GSPT1,HDHD1,HN1L, MBTPS2,MED14,POLA1,PTGES3,RBBP7,REPS2,S100G, SEPHS2,SLC17A4,SYAP1,TCEANC,TRAPPC2,TXLNG,USP9X | C2orf15,CDH1,CTPS2,DCLRE1A,ERBB3,ESRP1,KDM5B, LRBA,MARVELD2,OCLN,RBBP4,SLC39A9,SPATS2,SPEF2, STRBP,TEX9,TTC30B,TTC8,ZNF544,ZNF552,ZNF627 |
 |
|
| ARSE,ASB9,CTPS2,CXorf23,EIF2S3,FUNDC1,GEMIN8, GJB1,MAGED2,MBTPS2,OFD1,JADE3,POLA1,RBBP7, RPS6KA3,SCML1,SHROOM4,SYAP1,TAB3,ZDHHC9,KRBOX4 | ALDH5A1,ALG9,CTPS2,EIF2AK4,KDM1A,LRP11,MBTPS1, NONO,PABPC1,PAIP2B,PARP16,PLA2G12A,PLEKHA5,RBL2, ST18,SUDS3,TBCK,TTC37,TTLL2,TXNDC16,ZNF146 |
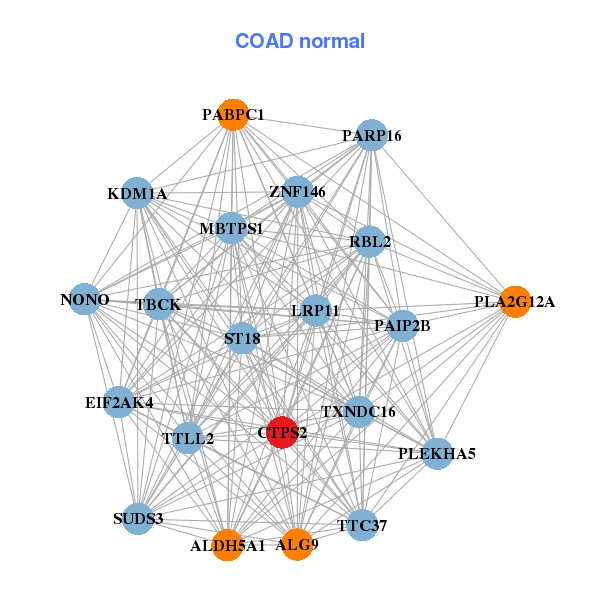
| * Co-Expression network figures were drawn using R package igraph. Only the top 20 genes with the highest correlations were shown. Red circle: input gene, orange circle: cell metabolism gene, sky circle: other gene |
: Open all plots for all cancer types
| Top |
: Open all interacting genes' information including KEGG pathway for all interacting genes from DAVID
| Top |
| Pharmacological Information for CTPS2 |
| There's no related Drug. |
| Top |
| Cross referenced IDs for CTPS2 |
| * We obtained these cross-references from Uniprot database. It covers 150 different DBs, 18 categories. http://www.uniprot.org/help/cross_references_section |
: Open all cross reference information
|
Copyright © 2016-Present - The Univsersity of Texas Health Science Center at Houston @ |