|
||||||||||||||||||||||||||||||||||||||||||||||||||||||||||||||||||||||||||||||||||||||||||||||||||||||||||||||||||||||||||||||||||||||||||||||||||||||||||||||||||||||||||||||||||||||||||||||||||||||||||||||||||||||||||||||||||||||||||||||||||||||||||||||||||||||||||||||||||||||||||||||||||||||||||||||||||||||||||
| |
| Phenotypic Information (metabolism pathway, cancer, disease, phenome) |
| |
| |
| Gene-Gene Network Information: Co-Expression Network, Interacting Genes & KEGG |
| |
|


| Gene Summary for PSAP |
| Basic gene info. | Gene symbol | PSAP |
| Gene name | prosaposin | |
| Synonyms | GLBA|SAP1 | |
| Cytomap | UCSC genome browser: 10q21-q22 | |
| Genomic location | chr10 :73576054-73611082 | |
| Type of gene | protein-coding | |
| RefGenes | NM_001042465.1, NM_001042466.1,NM_002778.2, | |
| Ensembl id | ENSG00000197746 | |
| Description | proactivator polypeptidesphingolipid activator protein-1 | |
| Modification date | 20141207 | |
| dbXrefs | MIM : 176801 | |
| HGNC : HGNC | ||
| Ensembl : ENSG00000197746 | ||
| HPRD : 01460 | ||
| Vega : OTTHUMG00000018429 | ||
| Protein | UniProt: go to UniProt's Cross Reference DB Table | |
| Expression | CleanEX: HS_PSAP | |
| BioGPS: 5660 | ||
| Gene Expression Atlas: ENSG00000197746 | ||
| The Human Protein Atlas: ENSG00000197746 | ||
| Pathway | NCI Pathway Interaction Database: PSAP | |
| KEGG: PSAP | ||
| REACTOME: PSAP | ||
| ConsensusPathDB | ||
| Pathway Commons: PSAP | ||
| Metabolism | MetaCyc: PSAP | |
| HUMANCyc: PSAP | ||
| Regulation | Ensembl's Regulation: ENSG00000197746 | |
| miRBase: chr10 :73,576,054-73,611,082 | ||
| TargetScan: NM_001042465 | ||
| cisRED: ENSG00000197746 | ||
| Context | iHOP: PSAP | |
| cancer metabolism search in PubMed: PSAP | ||
| UCL Cancer Institute: PSAP | ||
| Assigned class in ccmGDB | C | |
| Top |
| Phenotypic Information for PSAP(metabolism pathway, cancer, disease, phenome) |
| Cancer | CGAP: PSAP |
| Familial Cancer Database: PSAP | |
| * This gene is included in those cancer gene databases. |
|
|
|
|
|
|
| ||||||||||||||||||||||||||||||||||||||||||||||||||||||||||||||||||||||||||||||||||||||||||||||||||||||||||||||||||||||||||||||||||||||||||||||||||||||||||||||||||||||||||||||||||||||||||||||||||||||||||||||||||||||||||||||||||||||||||||||||||||||||||||||||||||||||||||||||||||||||||||||||||||||||||||||||||||
Oncogene 1 | Significant driver gene in | |||||||||||||||||||||||||||||||||||||||||||||||||||||||||||||||||||||||||||||||||||||||||||||||||||||||||||||||||||||||||||||||||||||||||||||||||||||||||||||||||||||||||||||||||||||||||||||||||||||||||||||||||||||||||||||||||||||||||||||||||||||||||||||||||||||||||||||||||||||||||||||||||||||||||||||||||||||||||
| cf) number; DB name 1 Oncogene; http://nar.oxfordjournals.org/content/35/suppl_1/D721.long, 2 Tumor Suppressor gene; https://bioinfo.uth.edu/TSGene/, 3 Cancer Gene Census; http://www.nature.com/nrc/journal/v4/n3/abs/nrc1299.html, 4 CancerGenes; http://nar.oxfordjournals.org/content/35/suppl_1/D721.long, 5 Network of Cancer Gene; http://ncg.kcl.ac.uk/index.php, 1Therapeutic Vulnerabilities in Cancer; http://cbio.mskcc.org/cancergenomics/statius/ |
| REACTOME_GLYCOSPHINGOLIPID_METABOLISM REACTOME_PHOSPHOLIPID_METABOLISM REACTOME_SPHINGOLIPID_METABOLISM REACTOME_METABOLISM_OF_LIPIDS_AND_LIPOPROTEINS | |
| OMIM | |
| Orphanet | |
| Disease | KEGG Disease: PSAP |
| MedGen: PSAP (Human Medical Genetics with Condition) | |
| ClinVar: PSAP | |
| Phenotype | MGI: PSAP (International Mouse Phenotyping Consortium) |
| PhenomicDB: PSAP | |
| Mutations for PSAP |
| * Under tables are showing count per each tissue to give us broad intuition about tissue specific mutation patterns.You can go to the detailed page for each mutation database's web site. |
| - Statistics for Tissue and Mutation type | Top |
 |
| - For Inter-chromosomal Variations |
| * Inter-chromosomal variantions includes 'interchromosomal amplicon to amplicon', 'interchromosomal amplicon to non-amplified dna', 'interchromosomal insertion', 'Interchromosomal unknown type'. |
 |
| - For Intra-chromosomal Variations |
| There's no intra-chromosomal structural variation. |
| Sample | Symbol_a | Chr_a | Start_a | End_a | Symbol_b | Chr_b | Start_b | End_b |
| ovary | PSAP | chr10 | 73579239 | 73579259 | chr2 | 219272992 | 219273012 |
| cf) Tissue number; Tissue name (1;Breast, 2;Central_nervous_system, 3;Haematopoietic_and_lymphoid_tissue, 4;Large_intestine, 5;Liver, 6;Lung, 7;Ovary, 8;Pancreas, 9;Prostate, 10;Skin, 11;Soft_tissue, 12;Upper_aerodigestive_tract) |
| * From mRNA Sanger sequences, Chitars2.0 arranged chimeric transcripts. This table shows PSAP related fusion information. |
| ID | Head Gene | Tail Gene | Accession | Gene_a | qStart_a | qEnd_a | Chromosome_a | tStart_a | tEnd_a | Gene_a | qStart_a | qEnd_a | Chromosome_a | tStart_a | tEnd_a |
| AW176753 | PSAP | 47 | 85 | 10 | 73577047 | 73577085 | CKB | 85 | 175 | 14 | 103986228 | 103986318 | |
| BG236863 | PSAP | 5 | 64 | 10 | 73576303 | 73576362 | PSAP | 60 | 205 | 10 | 73576365 | 73576510 | |
| AW608479 | PSAP | 1 | 206 | 10 | 73587814 | 73588741 | ACP5 | 196 | 544 | 19 | 11687572 | 11688133 | |
| BG993981 | PSAP | 1 | 147 | 10 | 73576349 | 73576496 | CAPG | 140 | 207 | 2 | 85621900 | 85621967 | |
| CA433301 | DMTN | 18 | 199 | 8 | 21939855 | 21940036 | PSAP | 198 | 423 | 10 | 73576180 | 73576405 | |
| BF918002 | PSAP | 1 | 454 | 10 | 73576874 | 73578467 | VRK3 | 446 | 567 | 19 | 50506373 | 50506494 | |
| CD370612 | PSAP | 16 | 183 | 10 | 73576055 | 73576222 | HLA-DPA1 | 180 | 539 | 6 | 4517338 | 4518037 | |
| BF853810 | RNF213 | 11 | 303 | 17 | 78355665 | 78355957 | PSAP | 297 | 563 | 10 | 73579325 | 73580021 | |
| BU190440 | PSMA4 | 2 | 311 | 15 | 78841212 | 78841523 | PSAP | 304 | 820 | 10 | 73578373 | 73579633 | |
| BQ028419 | DMTN | 18 | 200 | 8 | 21939855 | 21940036 | PSAP | 199 | 424 | 10 | 73576180 | 73576405 | |
| BP430892 | DNAH6 | 1 | 180 | 2 | 85004658 | 85005194 | PSAP | 181 | 423 | 10 | 73576359 | 73576601 | |
| CA308179 | TIAL1 | 15 | 313 | 10 | 121334924 | 121335222 | PSAP | 311 | 667 | 10 | 73579553 | 73585616 | |
| BE176600 | PSAP | 4 | 127 | 10 | 73587838 | 73588681 | PSAP | 120 | 534 | 10 | 73579569 | 73587811 | |
| BE930210 | PSAP | 34 | 142 | 10 | 73579997 | 73588678 | PSAP | 140 | 458 | 10 | 73576985 | 73578443 | |
| BF733880 | PSAP | 10 | 159 | 10 | 73576940 | 73577090 | PSAP | 156 | 330 | 10 | 73576741 | 73576914 | |
| BE707091 | GNAI2 | 20 | 206 | 3 | 50295821 | 50296003 | PSAP | 205 | 296 | 10 | 73579624 | 73580054 | |
| AW608472 | ACP5 | 1 | 347 | 19 | 11687572 | 11688133 | PSAP | 337 | 592 | 10 | 73587814 | 73588789 | |
| BG995962 | PSAP | 10 | 213 | 10 | 73576299 | 73576504 | THBS3 | 209 | 534 | 1 | 155167619 | 155167941 | |
| BE698722 | PSAP | 24 | 99 | 10 | 73579261 | 73579337 | PSAP | 89 | 442 | 10 | 73577100 | 73579252 | |
| BG996012 | PSAP | 1 | 280 | 10 | 73576217 | 73576496 | RNF187 | 267 | 555 | 1 | 228681907 | 228682196 | |
| AA019217 | PSAP | 8 | 145 | 10 | 73576057 | 73576194 | ABCA4 | 130 | 392 | 1 | 94492841 | 94493103 | |
| BI015407 | PSAP | 16 | 170 | 10 | 73580052 | 73581743 | IDH3B | 166 | 243 | 20 | 2640724 | 2640801 | |
| AA632698 | PSAP | 7 | 301 | 10 | 73576371 | 73576666 | PSAP | 300 | 423 | 10 | 73576249 | 73576373 | |
| CA311128 | PSAP | 19 | 82 | 10 | 73576303 | 73576366 | MAP3K5 | 72 | 276 | 6 | 136878752 | 136878956 | |
| BP391559 | ALDH9A1 | 16 | 304 | 1 | 165636545 | 165638556 | PSAP | 305 | 500 | 10 | 73576307 | 73576501 | |
| Top |
| Mutation type/ Tissue ID | brca | cns | cerv | endome | haematopo | kidn | Lintest | liver | lung | ns | ovary | pancre | prost | skin | stoma | thyro | urina | |||
| Total # sample | 1 | |||||||||||||||||||
| GAIN (# sample) | ||||||||||||||||||||
| LOSS (# sample) | 1 |
| cf) Tissue ID; Tissue type (1; Breast, 2; Central_nervous_system, 3; Cervix, 4; Endometrium, 5; Haematopoietic_and_lymphoid_tissue, 6; Kidney, 7; Large_intestine, 8; Liver, 9; Lung, 10; NS, 11; Ovary, 12; Pancreas, 13; Prostate, 14; Skin, 15; Stomach, 16; Thyroid, 17; Urinary_tract) |
| Top |
|
 |
| Top |
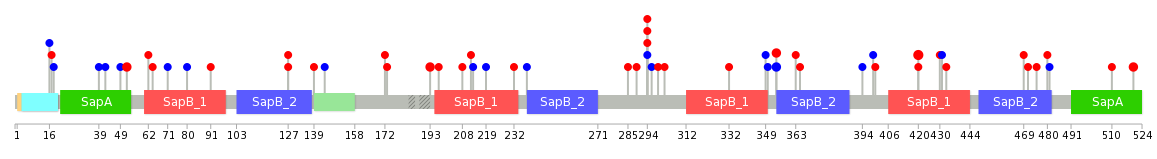
| Stat. for Non-Synonymous SNVs (# total SNVs=33) | (# total SNVs=14) |
 |  |
(# total SNVs=2) | (# total SNVs=0) |
 |
| Top |
| * When you move the cursor on each content, you can see more deailed mutation information on the Tooltip. Those are primary_site,primary_histology,mutation(aa),pubmedID. |
| GRCh37 position | Mutation(aa) | Unique sampleID count |
| chr10:73579313-73579313 | p.D420V | 3 |
| chr10:73579601-73579601 | p.S354S | 2 |
| chr10:73581662-73581662 | p.P294S | 2 |
| chr10:73587914-73587914 | p.D193H | 2 |
| chr10:73579602-73579602 | p.S354L | 2 |
| chr10:73577214-73577214 | p.R520H | 2 |
| chr10:73594149-73594149 | p.V52I | 2 |
| chr10:73579575-73579575 | p.T363M | 1 |
| chr10:73590888-73590888 | p.E124* | 1 |
| chr10:73581661-73581661 | p.P294H | 1 |
| Top |
|
 |
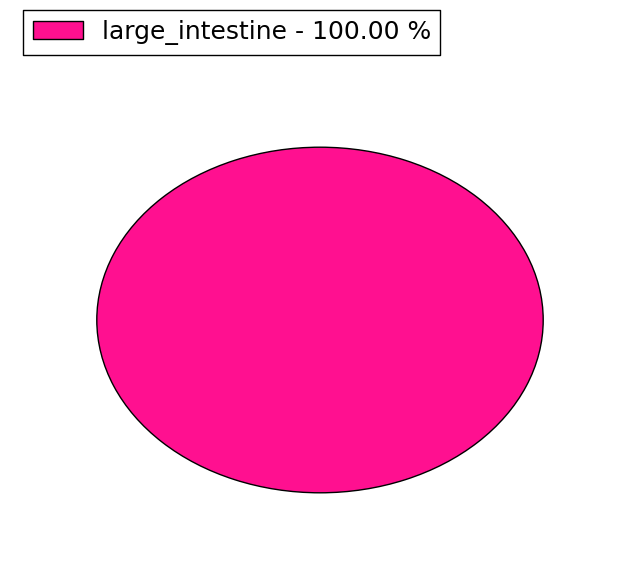
| Point Mutation/ Tissue ID | 1 | 2 | 3 | 4 | 5 | 6 | 7 | 8 | 9 | 10 | 11 | 12 | 13 | 14 | 15 | 16 | 17 | 18 | 19 | 20 |
| # sample | 2 | 1 | 9 | 2 | 1 | 7 | 2 | 4 | 6 | 2 | ||||||||||
| # mutation | 2 | 1 | 11 | 2 | 1 | 7 | 2 | 4 | 6 | 2 | ||||||||||
| nonsynonymous SNV | 1 | 8 | 2 | 1 | 5 | 2 | 1 | 5 | 1 | |||||||||||
| synonymous SNV | 1 | 1 | 3 | 2 | 3 | 1 | 1 |
| cf) Tissue ID; Tissue type (1; BLCA[Bladder Urothelial Carcinoma], 2; BRCA[Breast invasive carcinoma], 3; CESC[Cervical squamous cell carcinoma and endocervical adenocarcinoma], 4; COAD[Colon adenocarcinoma], 5; GBM[Glioblastoma multiforme], 6; Glioma Low Grade, 7; HNSC[Head and Neck squamous cell carcinoma], 8; KICH[Kidney Chromophobe], 9; KIRC[Kidney renal clear cell carcinoma], 10; KIRP[Kidney renal papillary cell carcinoma], 11; LAML[Acute Myeloid Leukemia], 12; LUAD[Lung adenocarcinoma], 13; LUSC[Lung squamous cell carcinoma], 14; OV[Ovarian serous cystadenocarcinoma ], 15; PAAD[Pancreatic adenocarcinoma], 16; PRAD[Prostate adenocarcinoma], 17; SKCM[Skin Cutaneous Melanoma], 18:STAD[Stomach adenocarcinoma], 19:THCA[Thyroid carcinoma], 20:UCEC[Uterine Corpus Endometrial Carcinoma]) |
| Top |
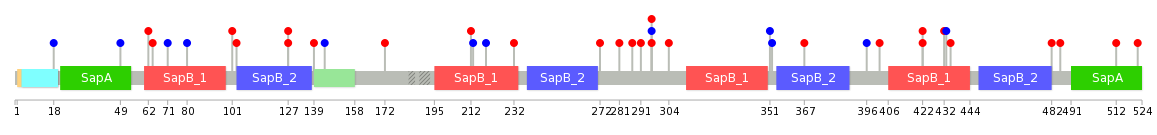
| * We represented just top 10 SNVs. When you move the cursor on each content, you can see more deailed mutation information on the Tooltip. Those are primary_site, primary_histology, mutation(aa), pubmedID. |
| Genomic Position | Mutation(aa) | Unique sampleID count |
| chr10:73581662 | p.P296T,PSAP | 2 |
| chr10:73588795 | p.V402M,PSAP | 1 |
| chr10:73579284 | p.M172T,PSAP | 1 |
| chr10:73581676 | p.P396P,PSAP | 1 |
| chr10:73588830 | p.H144H,PSAP | 1 |
| chr10:73579313 | p.G367S,PSAP | 1 |
| chr10:73581689 | p.E139K,PSAP | 1 |
| chr10:73588831 | p.P352P,PSAP | 1 |
| chr10:73579314 | p.R127L,PSAP | 1 |
| chr10:73581705 | p.L351L,PSAP | 1 |
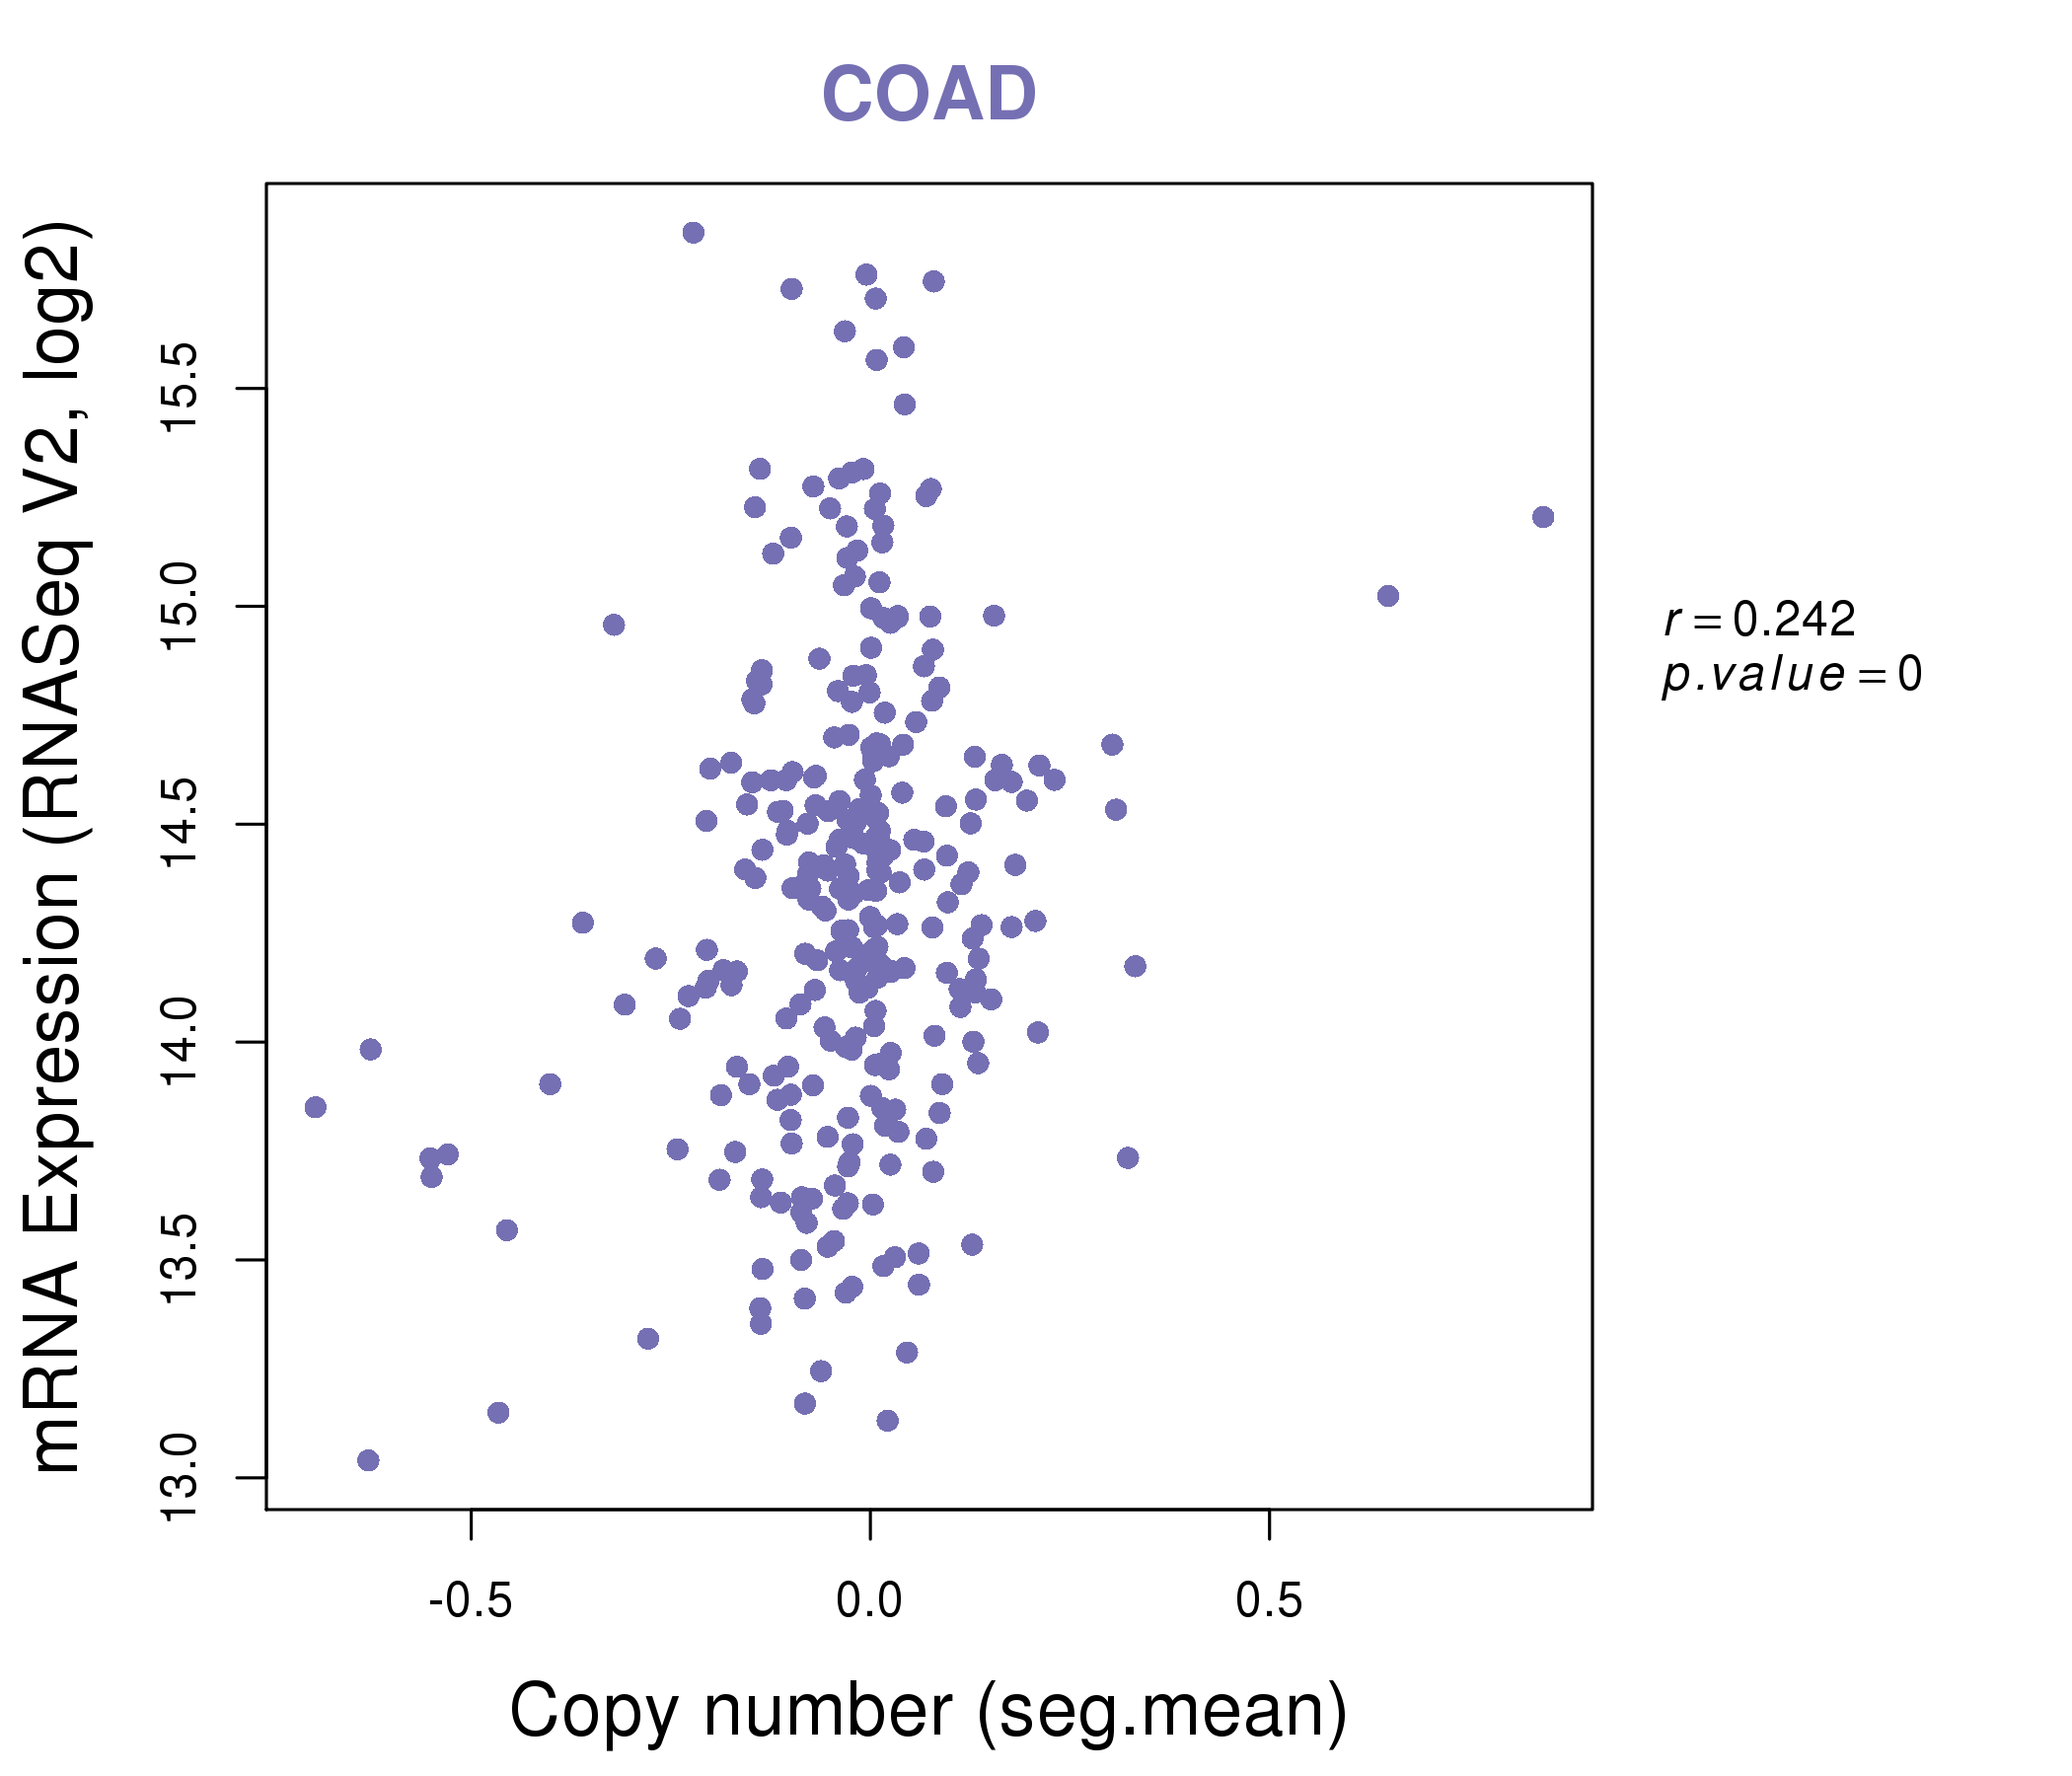
| * Copy number data were extracted from TCGA using R package TCGA-Assembler. The URLs of all public data files on TCGA DCC data server were gathered on Jan-05-2015. Function ProcessCNAData in TCGA-Assembler package was used to obtain gene-level copy number value which is calculated as the average copy number of the genomic region of a gene. |
 |
| cf) Tissue ID[Tissue type]: BLCA[Bladder Urothelial Carcinoma], BRCA[Breast invasive carcinoma], CESC[Cervical squamous cell carcinoma and endocervical adenocarcinoma], COAD[Colon adenocarcinoma], GBM[Glioblastoma multiforme], Glioma Low Grade, HNSC[Head and Neck squamous cell carcinoma], KICH[Kidney Chromophobe], KIRC[Kidney renal clear cell carcinoma], KIRP[Kidney renal papillary cell carcinoma], LAML[Acute Myeloid Leukemia], LUAD[Lung adenocarcinoma], LUSC[Lung squamous cell carcinoma], OV[Ovarian serous cystadenocarcinoma ], PAAD[Pancreatic adenocarcinoma], PRAD[Prostate adenocarcinoma], SKCM[Skin Cutaneous Melanoma], STAD[Stomach adenocarcinoma], THCA[Thyroid carcinoma], UCEC[Uterine Corpus Endometrial Carcinoma] |
| Top |
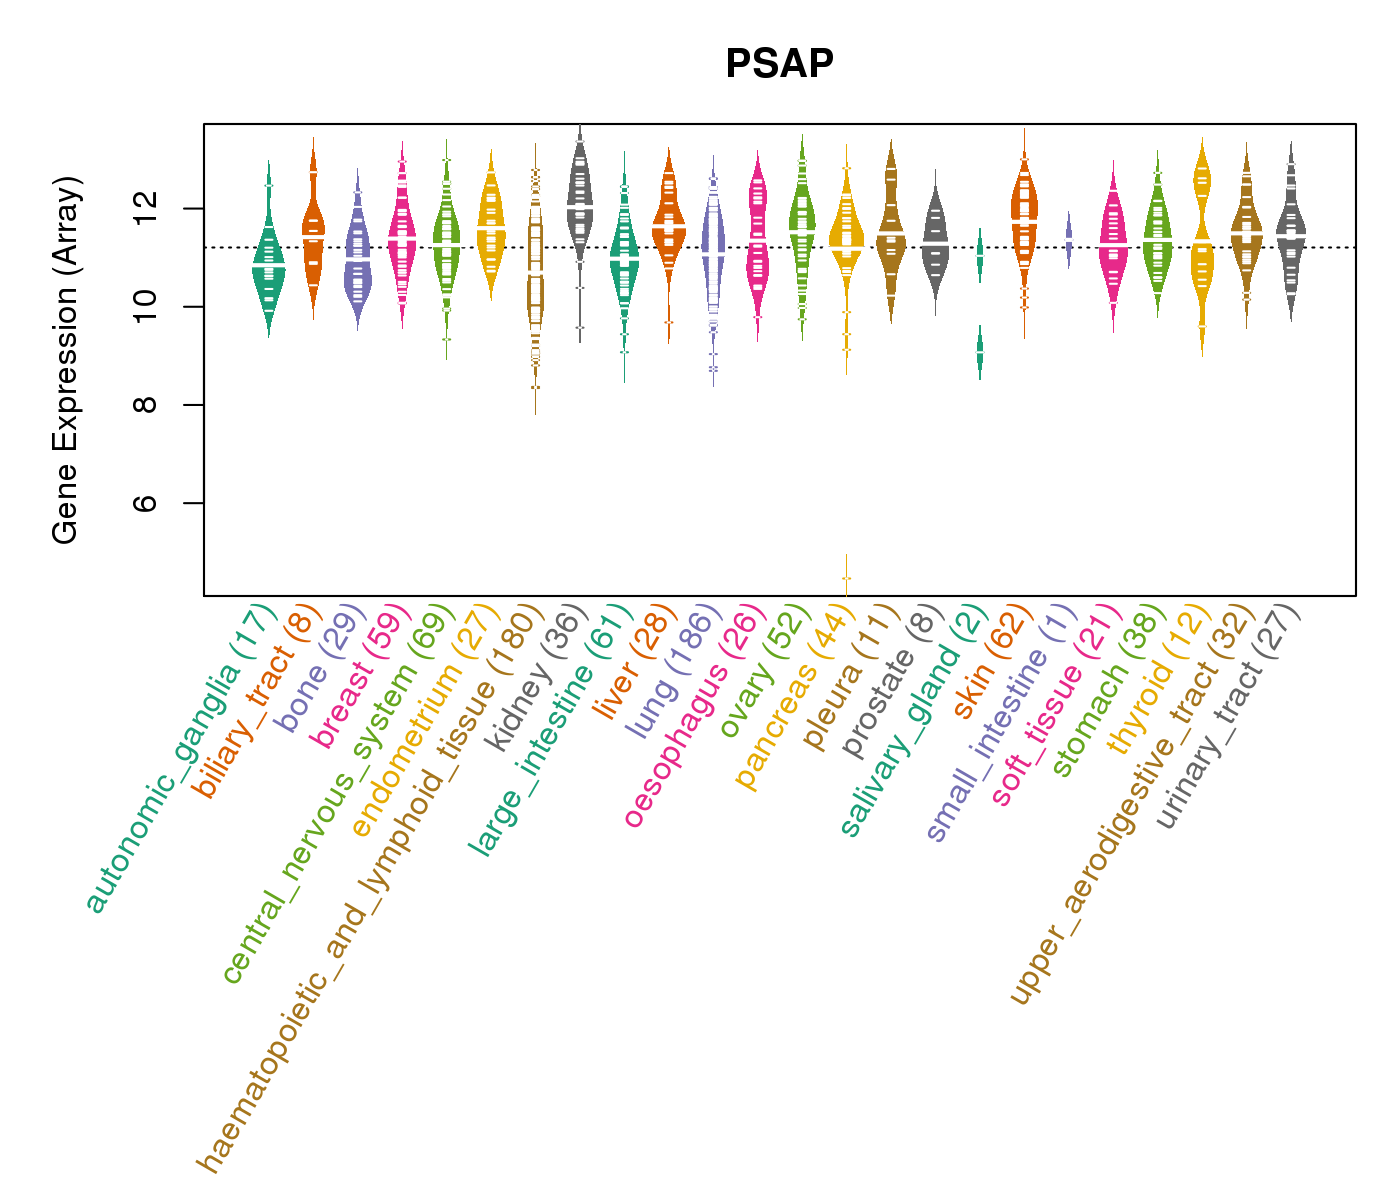
| Gene Expression for PSAP |
| * CCLE gene expression data were extracted from CCLE_Expression_Entrez_2012-10-18.res: Gene-centric RMA-normalized mRNA expression data. |
 |
| * Normalized gene expression data of RNASeqV2 was extracted from TCGA using R package TCGA-Assembler. The URLs of all public data files on TCGA DCC data server were gathered at Jan-05-2015. Only eight cancer types have enough normal control samples for differential expression analysis. (t test, adjusted p<0.05 (using Benjamini-Hochberg FDR)) |
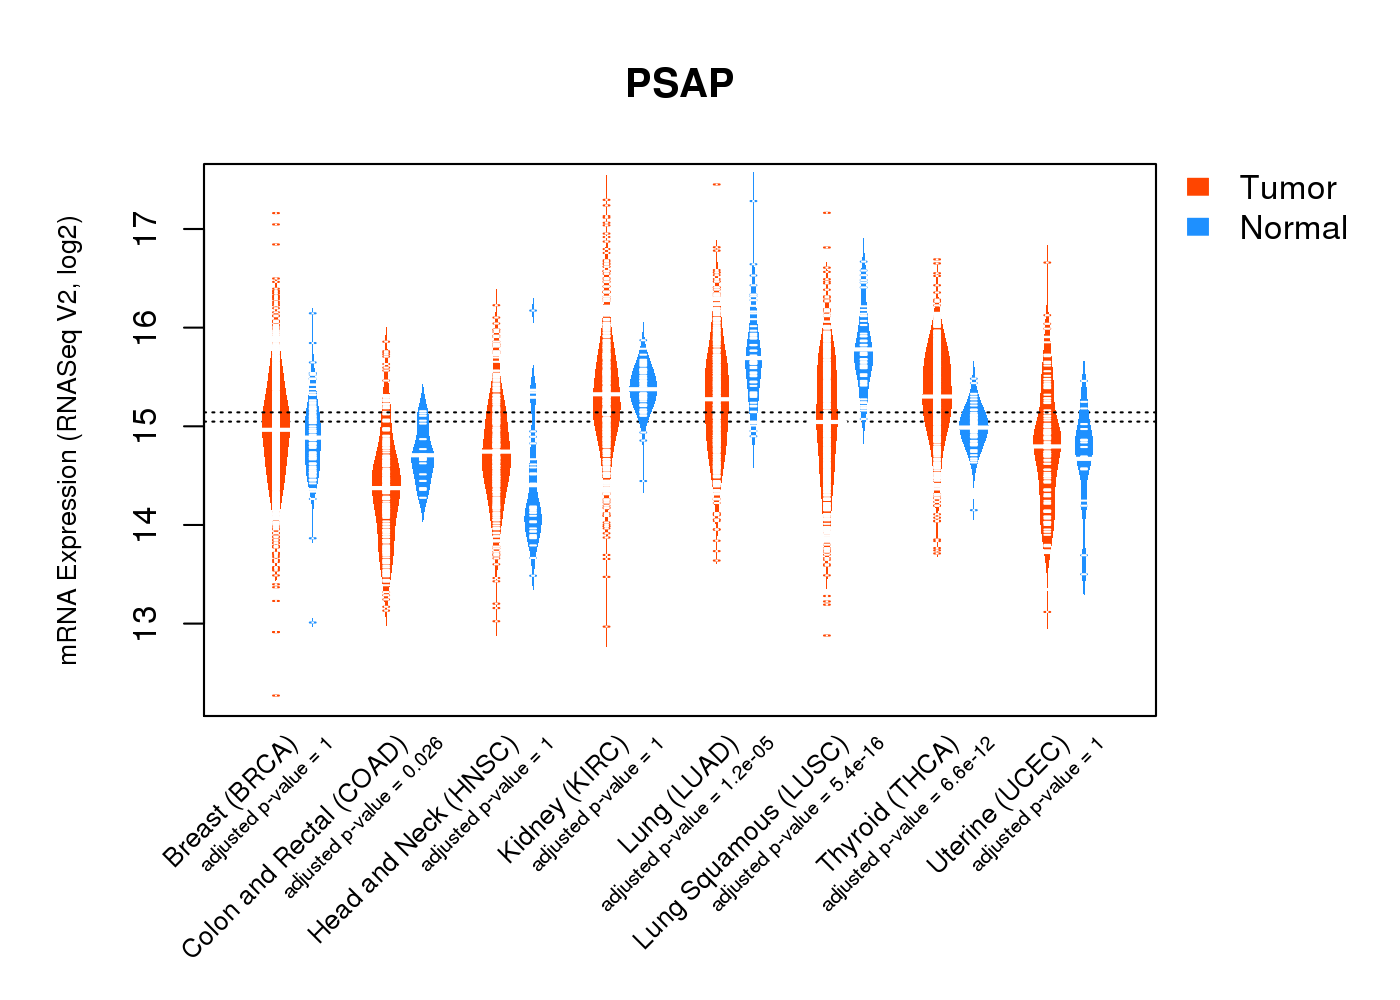 |
| Top |
| * This plots show the correlation between CNV and gene expression. |
: Open all plots for all cancer types
 |
|
 |
|


| Top |
| Gene-Gene Network Information |
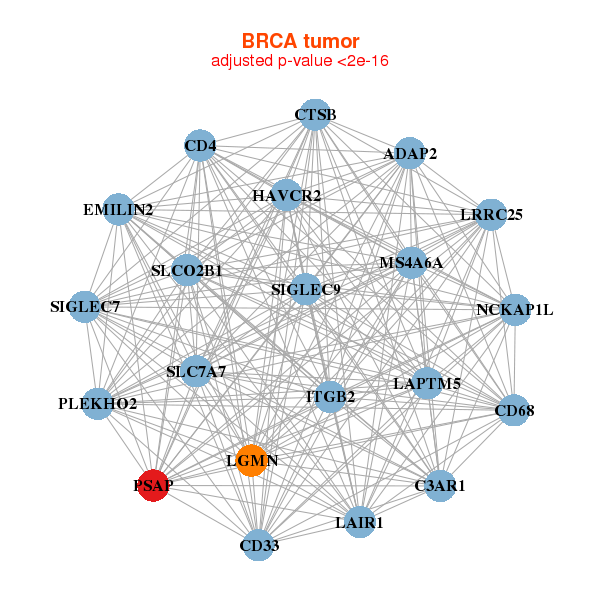
| * Co-Expression network figures were drawn using R package igraph. Only the top 20 genes with the highest correlations were shown. Red circle: input gene, orange circle: cell metabolism gene, sky circle: other gene |
: Open all plots for all cancer types
 |
|
| ADAP2,C3AR1,CD33,CD4,CD68,CTSB,EMILIN2, HAVCR2,ITGB2,LAIR1,LAPTM5,LGMN,LRRC25,MS4A6A, NCKAP1L,PLEKHO2,PSAP,SIGLEC7,SIGLEC9,SLC7A7,SLCO2B1 | ALDH3B1,CD4,CD68,CTSA,CTSB,FTL,COLGALT1, HAVCR2,LILRB4,LOXL3,LRRC25,MGAT1,NCF2,NFAM1, PI4K2A,PLA2G15,PSAP,RENBP,SLC15A3,SPI1,TRPV2 |
 |
|
| AIF1,C1QC,CD300C,CD4,CD84,CD86,CMKLR1, FPR3,GPNMB,HAVCR2,ITGB2,LAIR1,LAPTM5,LILRB4, LRRC25,PLD3,PLEKHO2,PSAP,SIGLEC7,SPI1,TYROBP | ACAA2,SOWAHD,AOAH,BCAS4,WBP1L,CCNDBP1,COG8, DDX19B,ATG13,MAN2B1,MB,DNMBP-AS1,PSAP,PTCRA, RNF135,SAT1,SARAF,TRAF7,TTC22,ZBTB3,ZSWIM3 |
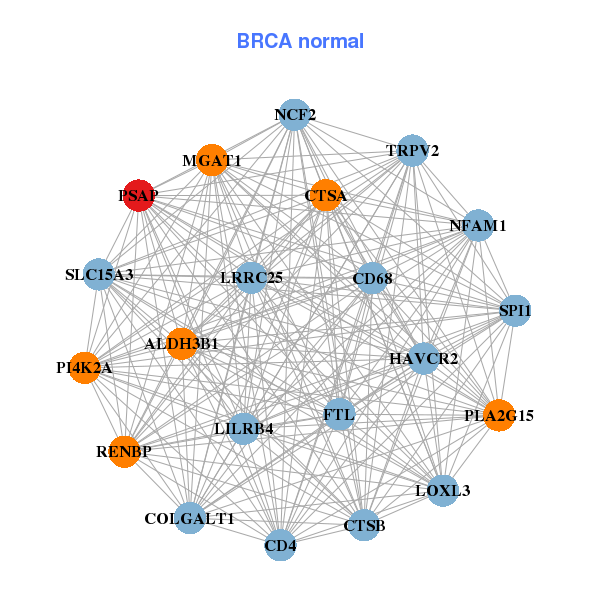

| * Co-Expression network figures were drawn using R package igraph. Only the top 20 genes with the highest correlations were shown. Red circle: input gene, orange circle: cell metabolism gene, sky circle: other gene |
: Open all plots for all cancer types
| Top |
: Open all interacting genes' information including KEGG pathway for all interacting genes from DAVID
| Top |
| Pharmacological Information for PSAP |
| There's no related Drug. |
| Top |
| Cross referenced IDs for PSAP |
| * We obtained these cross-references from Uniprot database. It covers 150 different DBs, 18 categories. http://www.uniprot.org/help/cross_references_section |
: Open all cross reference information
|
Copyright © 2016-Present - The Univsersity of Texas Health Science Center at Houston @ |