|
||||||||||||||||||||||||||||||||||||||||||||||||||||||||||||||||||||||||||||||||||||||||||||||||||||||||||||||||||||||||||||||||||||||||||||||||||||||||||||||||||||||||||||||||||||||||||||||||||||||||||||||||||||||||||||||||||||||||||||||||||||||||||||||||||||||||||||||||||||||||||||||||||||||||||||||||||||||||||
| |
| Phenotypic Information (metabolism pathway, cancer, disease, phenome) |
| |
| |
| Gene-Gene Network Information: Co-Expression Network, Interacting Genes & KEGG |
| |
|


| Gene Summary for INPP5E |
| Basic gene info. | Gene symbol | INPP5E |
| Gene name | inositol polyphosphate-5-phosphatase, 72 kDa | |
| Synonyms | CORS1|CPD4|JBTS1|MORMS|PPI5PIV | |
| Cytomap | UCSC genome browser: 9q34.3 | |
| Genomic location | chr9 :139323066-139334256 | |
| Type of gene | protein-coding | |
| RefGenes | NM_019892.4, | |
| Ensembl id | ENSG00000148384 | |
| Description | 72 kDa inositol polyphosphate 5-phosphatasephosphatidylinositol (4,5) bisphosphate 5-phosphatasephosphatidylinositol 4,5-bisphosphate 5-phosphatasephosphatidylinositol polyphosphate 5-phosphatase type IVphosphatidylinositol-4,5-bisphosphate 5-phosphat | |
| Modification date | 20141219 | |
| dbXrefs | MIM : 613037 | |
| HGNC : HGNC | ||
| Ensembl : ENSG00000148384 | ||
| HPRD : 17151 | ||
| Vega : OTTHUMG00000020927 | ||
| Protein | UniProt: go to UniProt's Cross Reference DB Table | |
| Expression | CleanEX: HS_INPP5E | |
| BioGPS: 56623 | ||
| Gene Expression Atlas: ENSG00000148384 | ||
| The Human Protein Atlas: ENSG00000148384 | ||
| Pathway | NCI Pathway Interaction Database: INPP5E | |
| KEGG: INPP5E | ||
| REACTOME: INPP5E | ||
| ConsensusPathDB | ||
| Pathway Commons: INPP5E | ||
| Metabolism | MetaCyc: INPP5E | |
| HUMANCyc: INPP5E | ||
| Regulation | Ensembl's Regulation: ENSG00000148384 | |
| miRBase: chr9 :139,323,066-139,334,256 | ||
| TargetScan: NM_019892 | ||
| cisRED: ENSG00000148384 | ||
| Context | iHOP: INPP5E | |
| cancer metabolism search in PubMed: INPP5E | ||
| UCL Cancer Institute: INPP5E | ||
| Assigned class in ccmGDB | C | |
| Top |
| Phenotypic Information for INPP5E(metabolism pathway, cancer, disease, phenome) |
| Cancer | CGAP: INPP5E |
| Familial Cancer Database: INPP5E | |
| * This gene is included in those cancer gene databases. |
|
|
|
|
|
|
| ||||||||||||||||||||||||||||||||||||||||||||||||||||||||||||||||||||||||||||||||||||||||||||||||||||||||||||||||||||||||||||||||||||||||||||||||||||||||||||||||||||||||||||||||||||||||||||||||||||||||||||||||||||||||||||||||||||||||||||||||||||||||||||||||||||||||||||||||||||||||||||||||||||||||||||||||||||
Oncogene 1 | Significant driver gene in | |||||||||||||||||||||||||||||||||||||||||||||||||||||||||||||||||||||||||||||||||||||||||||||||||||||||||||||||||||||||||||||||||||||||||||||||||||||||||||||||||||||||||||||||||||||||||||||||||||||||||||||||||||||||||||||||||||||||||||||||||||||||||||||||||||||||||||||||||||||||||||||||||||||||||||||||||||||||||
| cf) number; DB name 1 Oncogene; http://nar.oxfordjournals.org/content/35/suppl_1/D721.long, 2 Tumor Suppressor gene; https://bioinfo.uth.edu/TSGene/, 3 Cancer Gene Census; http://www.nature.com/nrc/journal/v4/n3/abs/nrc1299.html, 4 CancerGenes; http://nar.oxfordjournals.org/content/35/suppl_1/D721.long, 5 Network of Cancer Gene; http://ncg.kcl.ac.uk/index.php, 1Therapeutic Vulnerabilities in Cancer; http://cbio.mskcc.org/cancergenomics/statius/ |
| KEGG_INOSITOL_PHOSPHATE_METABOLISM REACTOME_PHOSPHOLIPID_METABOLISM REACTOME_PI_METABOLISM REACTOME_METABOLISM_OF_LIPIDS_AND_LIPOPROTEINS | |
| OMIM | |
| Orphanet | |
| Disease | KEGG Disease: INPP5E |
| MedGen: INPP5E (Human Medical Genetics with Condition) | |
| ClinVar: INPP5E | |
| Phenotype | MGI: INPP5E (International Mouse Phenotyping Consortium) |
| PhenomicDB: INPP5E | |
| Mutations for INPP5E |
| * Under tables are showing count per each tissue to give us broad intuition about tissue specific mutation patterns.You can go to the detailed page for each mutation database's web site. |
| There's no structural variation information in COSMIC data for this gene. |
| * From mRNA Sanger sequences, Chitars2.0 arranged chimeric transcripts. This table shows INPP5E related fusion information. |
| ID | Head Gene | Tail Gene | Accession | Gene_a | qStart_a | qEnd_a | Chromosome_a | tStart_a | tEnd_a | Gene_a | qStart_a | qEnd_a | Chromosome_a | tStart_a | tEnd_a |
| CN331953 | INPP5E | 1 | 63 | 9 | 139327456 | 139327518 | INPP5E | 59 | 493 | 9 | 139324798 | 139327019 | |
| Top |
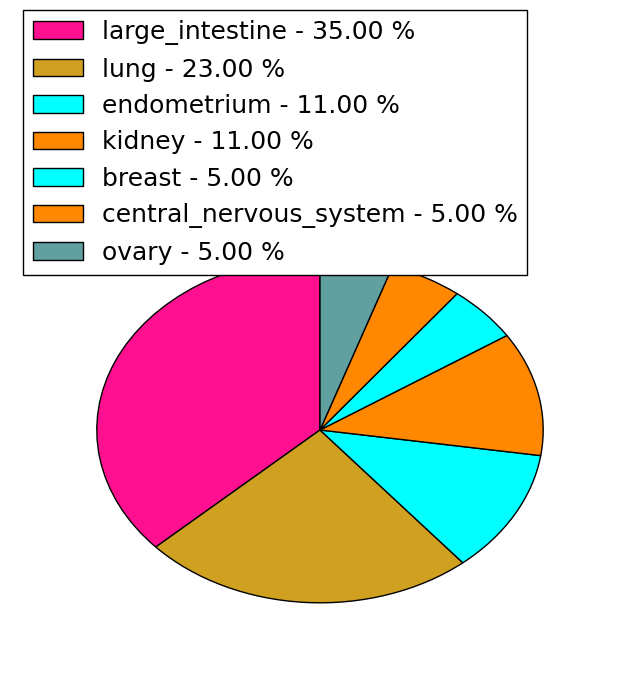
| Mutation type/ Tissue ID | brca | cns | cerv | endome | haematopo | kidn | Lintest | liver | lung | ns | ovary | pancre | prost | skin | stoma | thyro | urina | |||
| Total # sample | 1 | |||||||||||||||||||
| GAIN (# sample) | 1 | |||||||||||||||||||
| LOSS (# sample) |
| cf) Tissue ID; Tissue type (1; Breast, 2; Central_nervous_system, 3; Cervix, 4; Endometrium, 5; Haematopoietic_and_lymphoid_tissue, 6; Kidney, 7; Large_intestine, 8; Liver, 9; Lung, 10; NS, 11; Ovary, 12; Pancreas, 13; Prostate, 14; Skin, 15; Stomach, 16; Thyroid, 17; Urinary_tract) |
| Top |
|
 |
| Top |
| Stat. for Non-Synonymous SNVs (# total SNVs=17) | (# total SNVs=7) |
 |  |
(# total SNVs=0) | (# total SNVs=0) |
| Top |
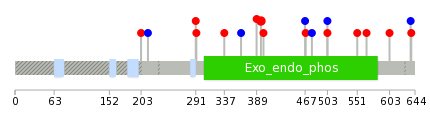
| * When you move the cursor on each content, you can see more deailed mutation information on the Tooltip. Those are primary_site,primary_histology,mutation(aa),pubmedID. |
| GRCh37 position | Mutation(aa) | Unique sampleID count |
| chr9:139333264-139333264 | p.S203F | 2 |
| chr9:139333269-139333269 | p.I201M | 2 |
| chr9:139326304-139326304 | p.H507H | 2 |
| chr9:139327500-139327500 | p.R396H | 2 |
| chr9:139324835-139324835 | p.G566C | 1 |
| chr9:139326934-139326934 | p.A462T | 1 |
| chr9:139327645-139327645 | p.S374L | 1 |
| chr9:139325466-139325466 | p.T551T | 1 |
| chr9:139326959-139326959 | p.P453P | 1 |
| chr9:139327661-139327661 | p.G369C | 1 |
| Top |
|
 |
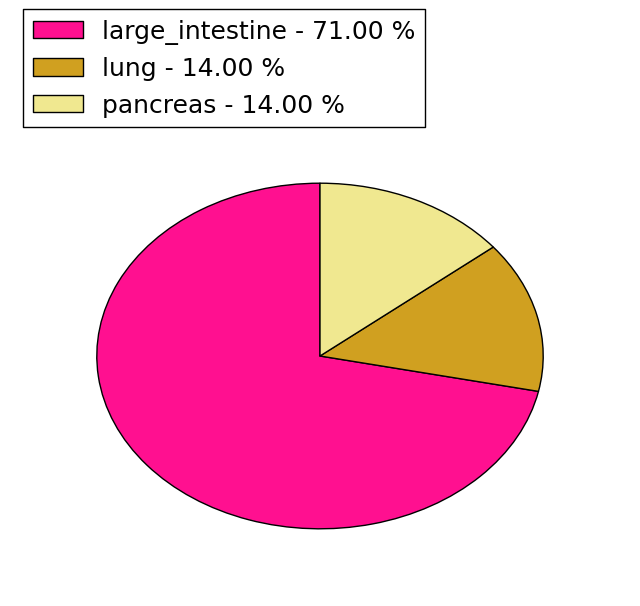
| Point Mutation/ Tissue ID | 1 | 2 | 3 | 4 | 5 | 6 | 7 | 8 | 9 | 10 | 11 | 12 | 13 | 14 | 15 | 16 | 17 | 18 | 19 | 20 |
| # sample | 1 | 3 | 1 | 2 | 3 | 3 | 6 | 1 | ||||||||||||
| # mutation | 1 | 3 | 1 | 2 | 3 | 3 | 6 | 1 | ||||||||||||
| nonsynonymous SNV | 2 | 1 | 2 | 2 | 6 | 1 | ||||||||||||||
| synonymous SNV | 1 | 1 | 1 | 3 |
| cf) Tissue ID; Tissue type (1; BLCA[Bladder Urothelial Carcinoma], 2; BRCA[Breast invasive carcinoma], 3; CESC[Cervical squamous cell carcinoma and endocervical adenocarcinoma], 4; COAD[Colon adenocarcinoma], 5; GBM[Glioblastoma multiforme], 6; Glioma Low Grade, 7; HNSC[Head and Neck squamous cell carcinoma], 8; KICH[Kidney Chromophobe], 9; KIRC[Kidney renal clear cell carcinoma], 10; KIRP[Kidney renal papillary cell carcinoma], 11; LAML[Acute Myeloid Leukemia], 12; LUAD[Lung adenocarcinoma], 13; LUSC[Lung squamous cell carcinoma], 14; OV[Ovarian serous cystadenocarcinoma ], 15; PAAD[Pancreatic adenocarcinoma], 16; PRAD[Prostate adenocarcinoma], 17; SKCM[Skin Cutaneous Melanoma], 18:STAD[Stomach adenocarcinoma], 19:THCA[Thyroid carcinoma], 20:UCEC[Uterine Corpus Endometrial Carcinoma]) |
| Top |
| * We represented just top 10 SNVs. When you move the cursor on each content, you can see more deailed mutation information on the Tooltip. Those are primary_site, primary_histology, mutation(aa), pubmedID. |
| Genomic Position | Mutation(aa) | Unique sampleID count |
| chr9:139327500 | p.R396H | 2 |
| chr9:139327487 | p.S364S | 1 |
| chr9:139324149 | p.G337R | 1 |
| chr9:139324151 | p.R292H | 1 |
| chr9:139327520 | p.S638N | 1 |
| chr9:139324254 | p.A291T | 1 |
| chr9:139327674 | p.S637S | 1 |
| chr9:139324835 | p.S214S | 1 |
| chr9:139328514 | p.P603Q | 1 |
| chr9:139325467 | p.S203F | 1 |
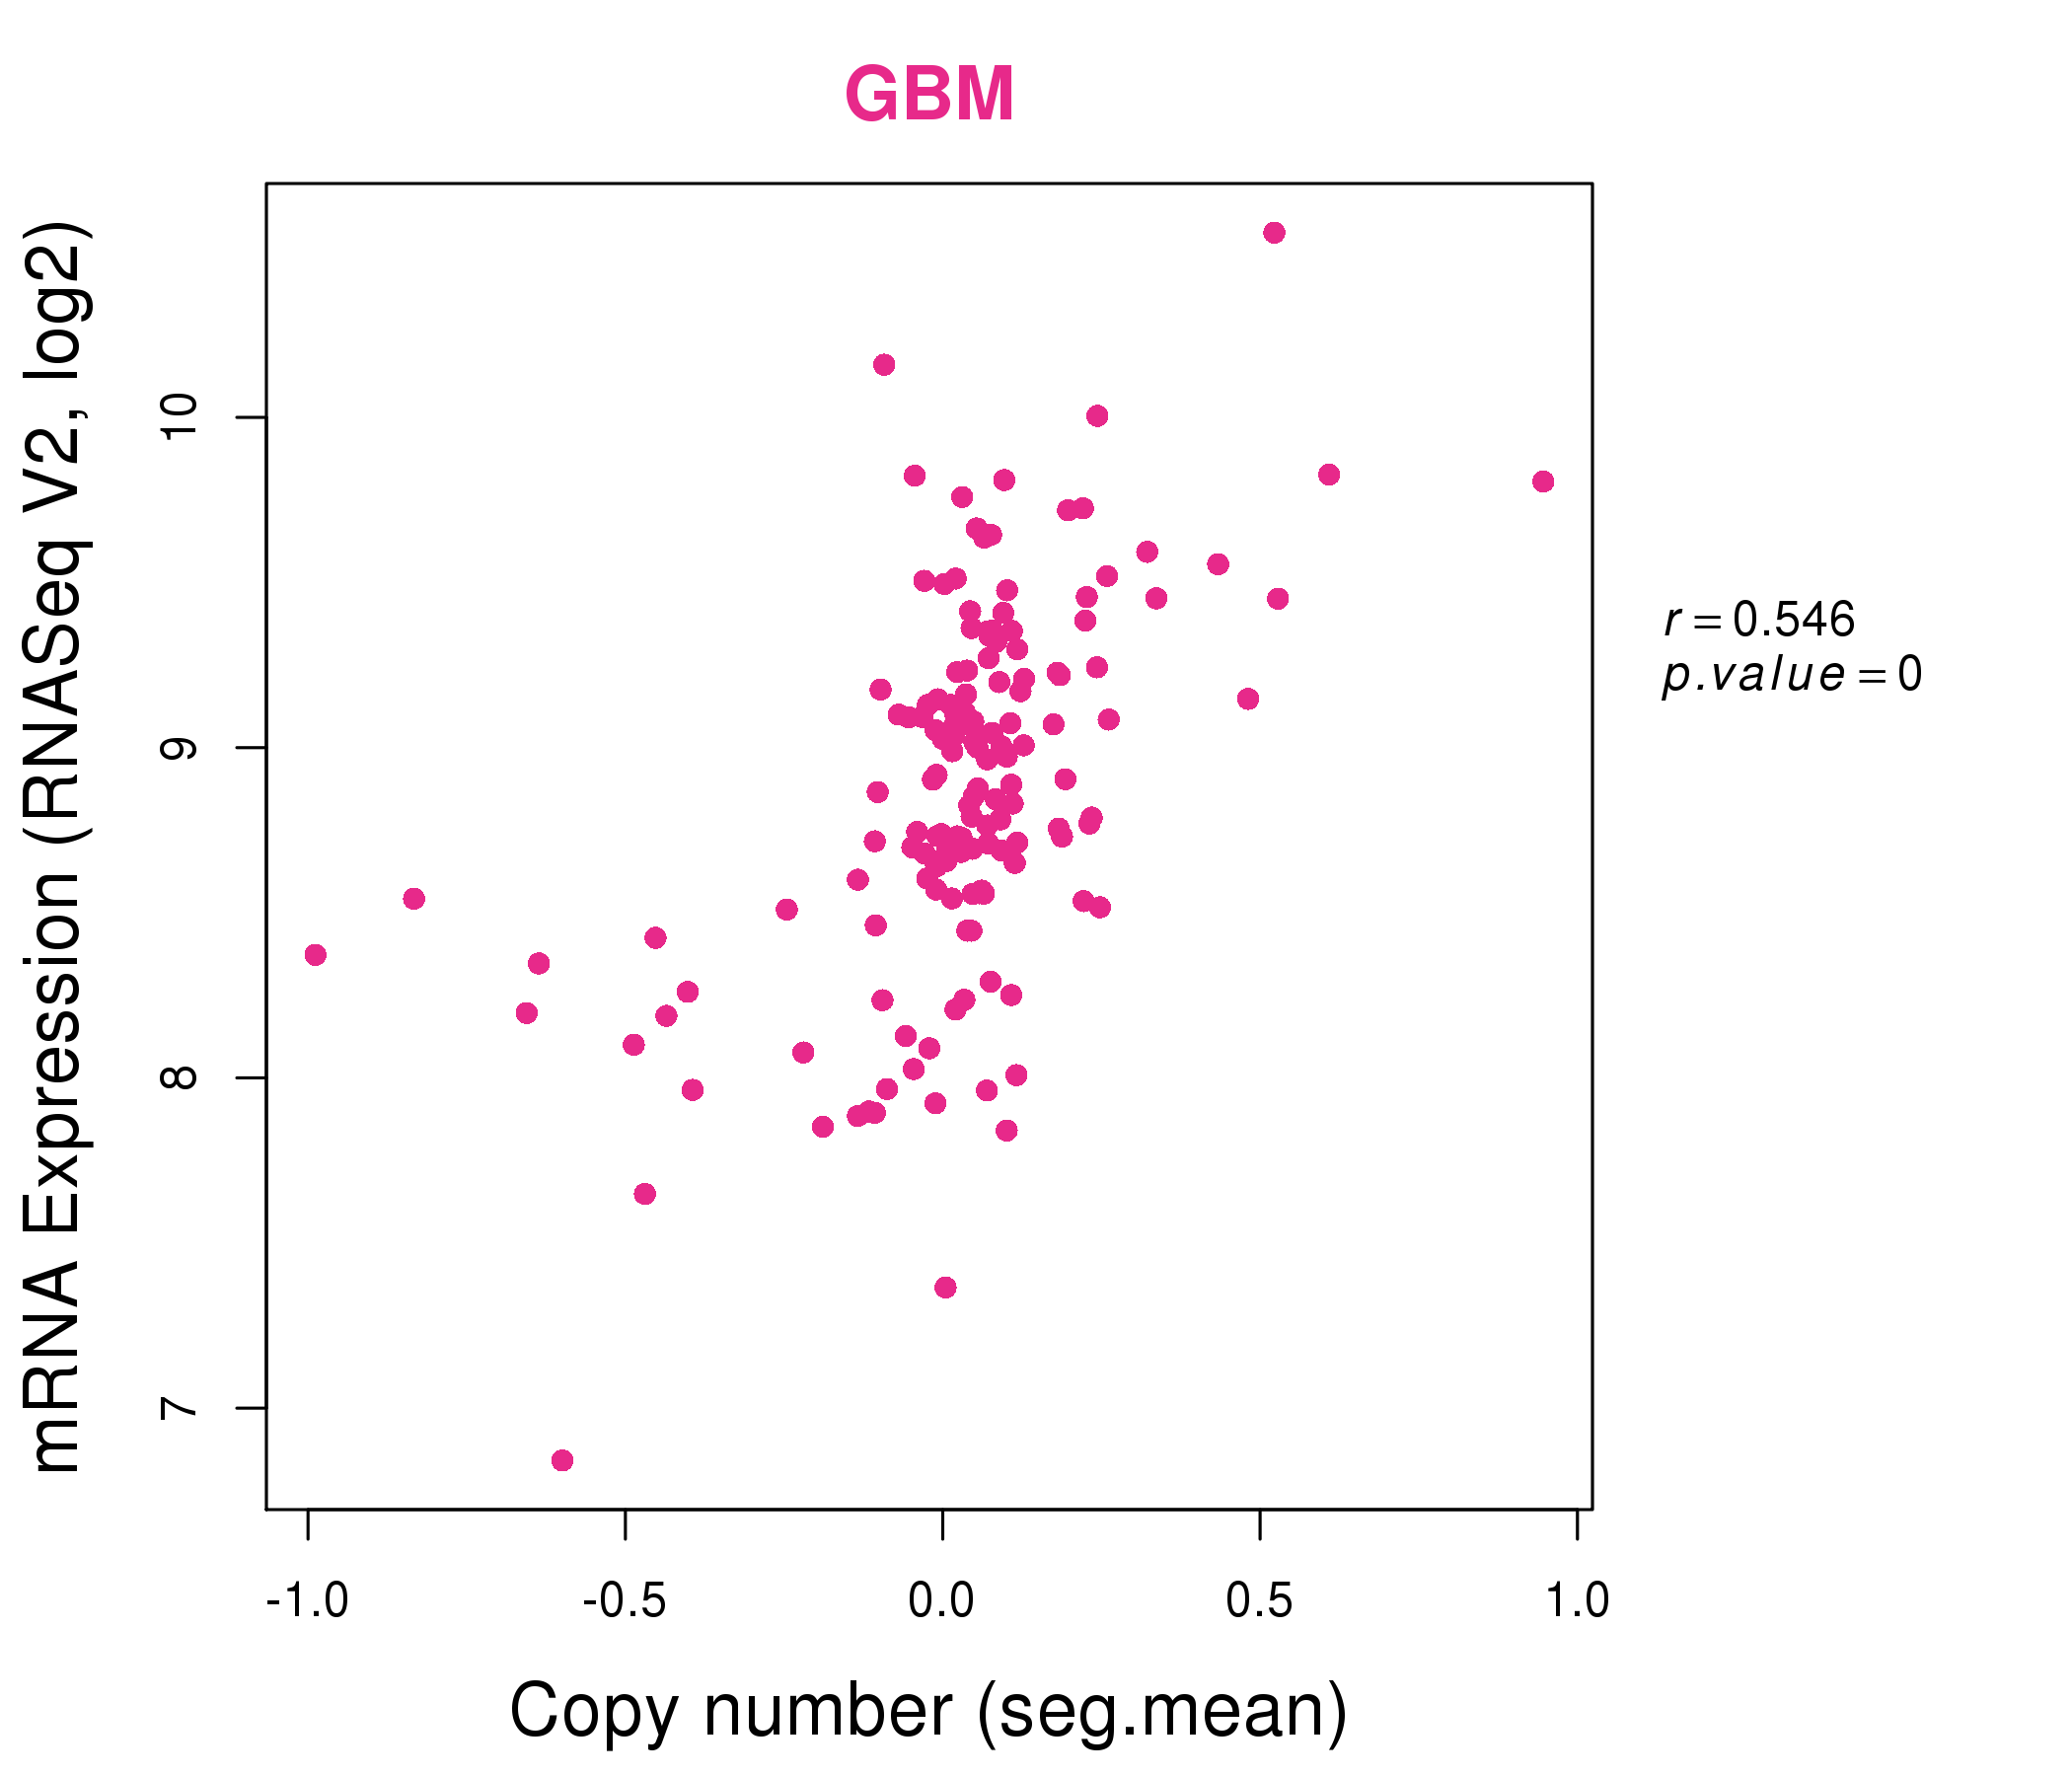
| * Copy number data were extracted from TCGA using R package TCGA-Assembler. The URLs of all public data files on TCGA DCC data server were gathered on Jan-05-2015. Function ProcessCNAData in TCGA-Assembler package was used to obtain gene-level copy number value which is calculated as the average copy number of the genomic region of a gene. |
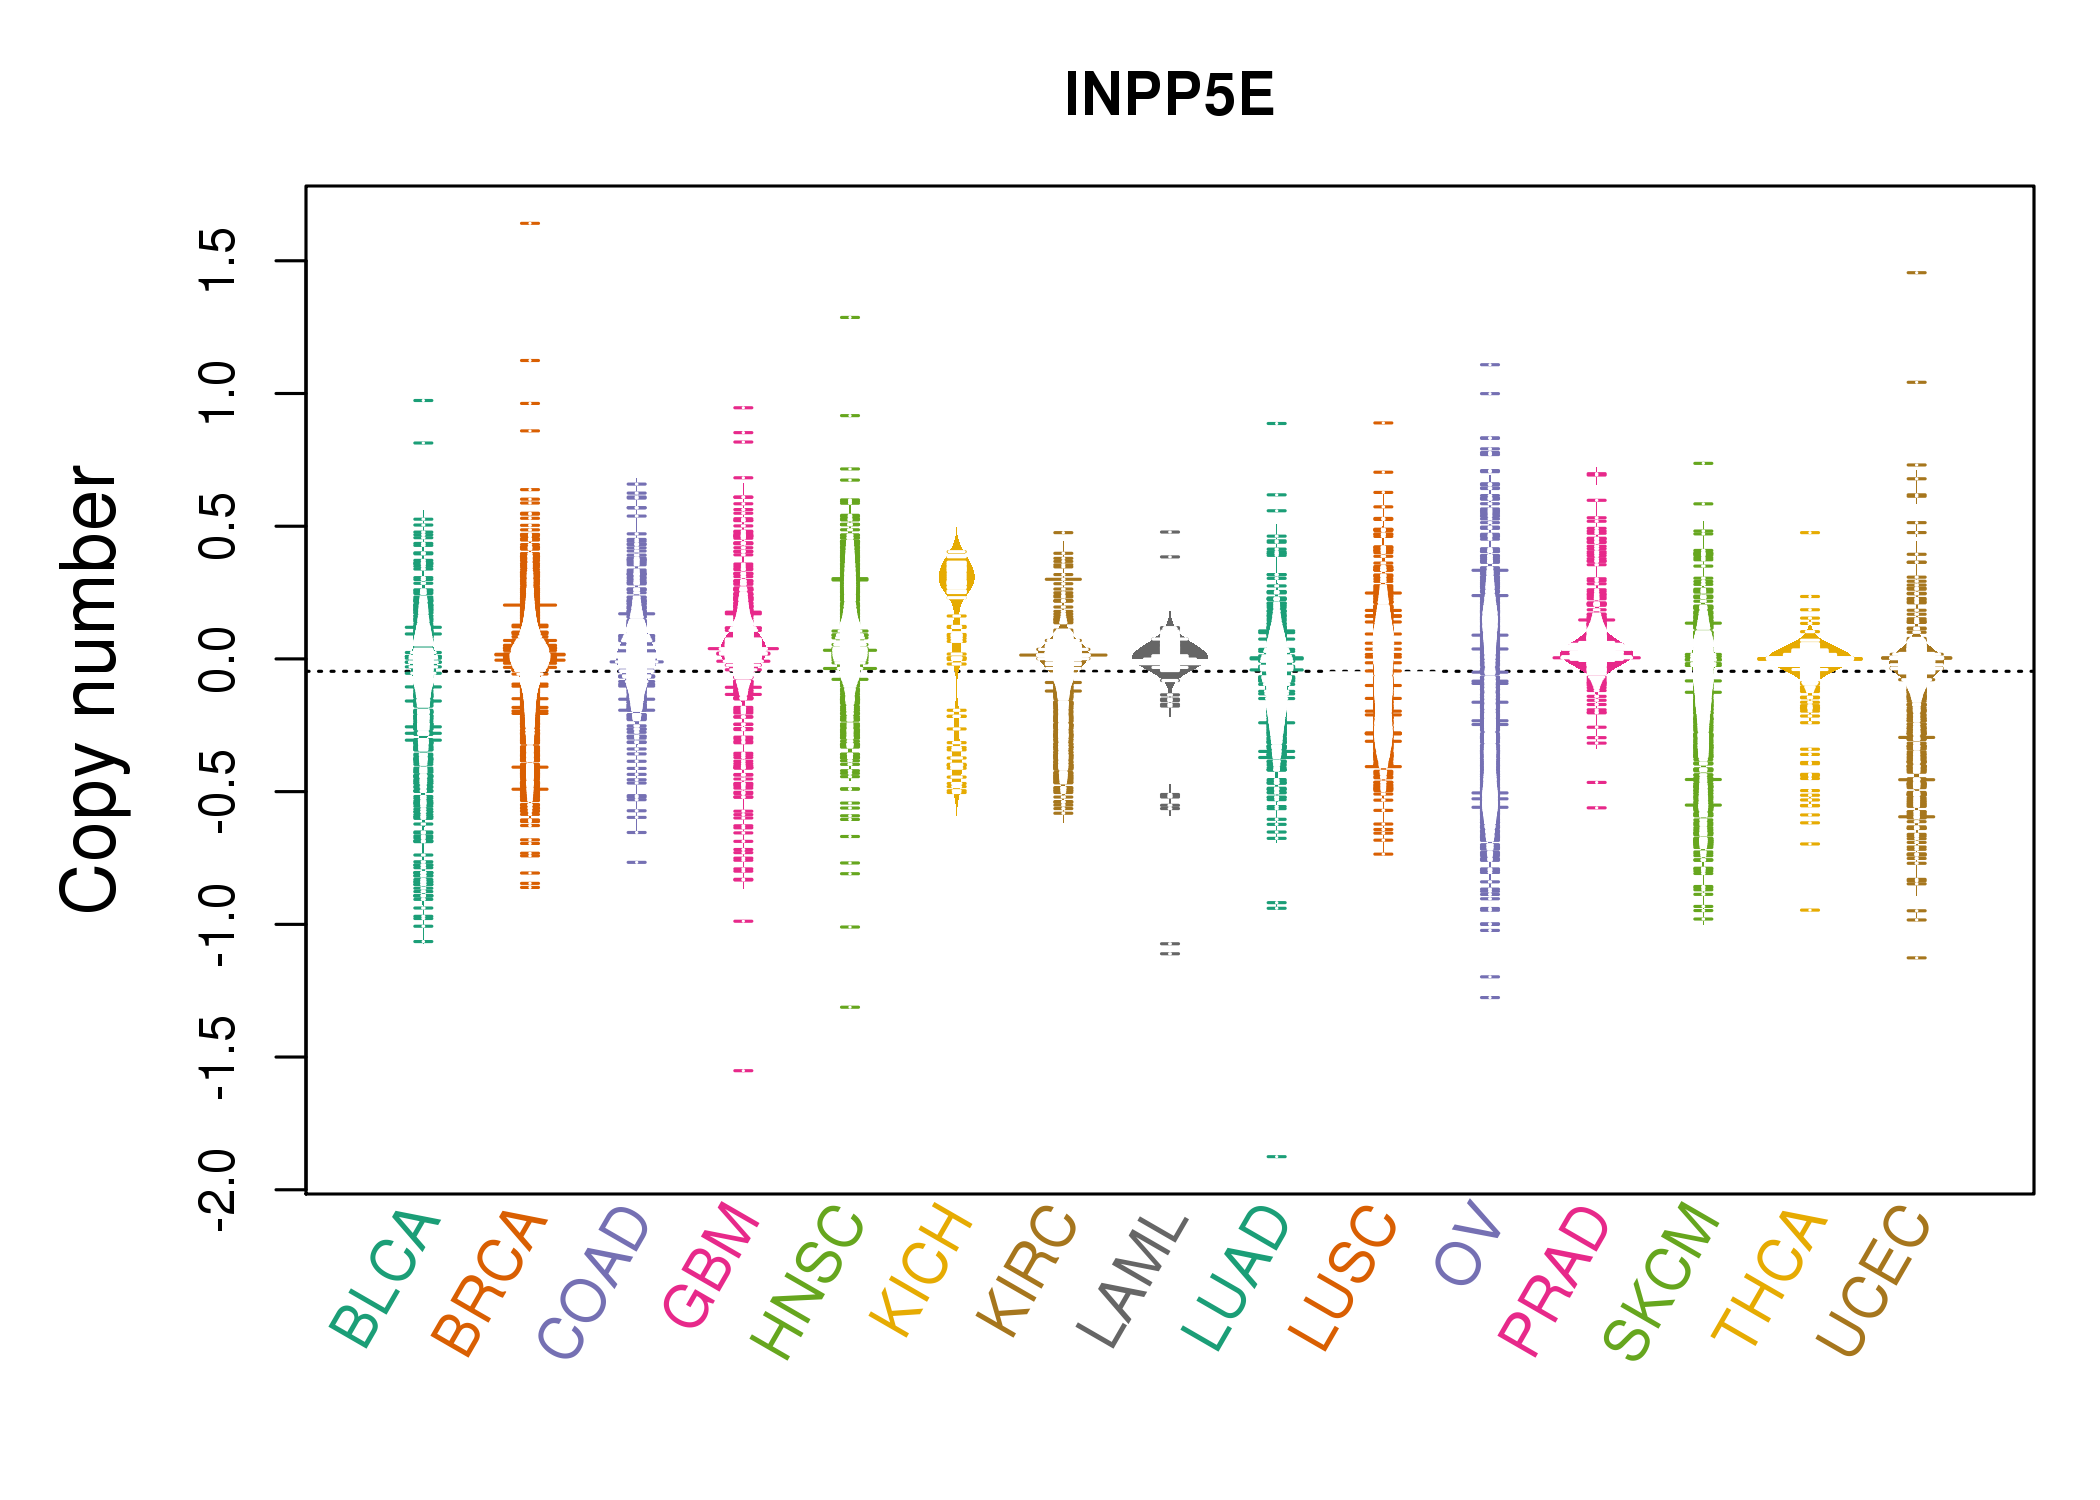 |
| cf) Tissue ID[Tissue type]: BLCA[Bladder Urothelial Carcinoma], BRCA[Breast invasive carcinoma], CESC[Cervical squamous cell carcinoma and endocervical adenocarcinoma], COAD[Colon adenocarcinoma], GBM[Glioblastoma multiforme], Glioma Low Grade, HNSC[Head and Neck squamous cell carcinoma], KICH[Kidney Chromophobe], KIRC[Kidney renal clear cell carcinoma], KIRP[Kidney renal papillary cell carcinoma], LAML[Acute Myeloid Leukemia], LUAD[Lung adenocarcinoma], LUSC[Lung squamous cell carcinoma], OV[Ovarian serous cystadenocarcinoma ], PAAD[Pancreatic adenocarcinoma], PRAD[Prostate adenocarcinoma], SKCM[Skin Cutaneous Melanoma], STAD[Stomach adenocarcinoma], THCA[Thyroid carcinoma], UCEC[Uterine Corpus Endometrial Carcinoma] |
| Top |
| Gene Expression for INPP5E |
| * CCLE gene expression data were extracted from CCLE_Expression_Entrez_2012-10-18.res: Gene-centric RMA-normalized mRNA expression data. |
 |
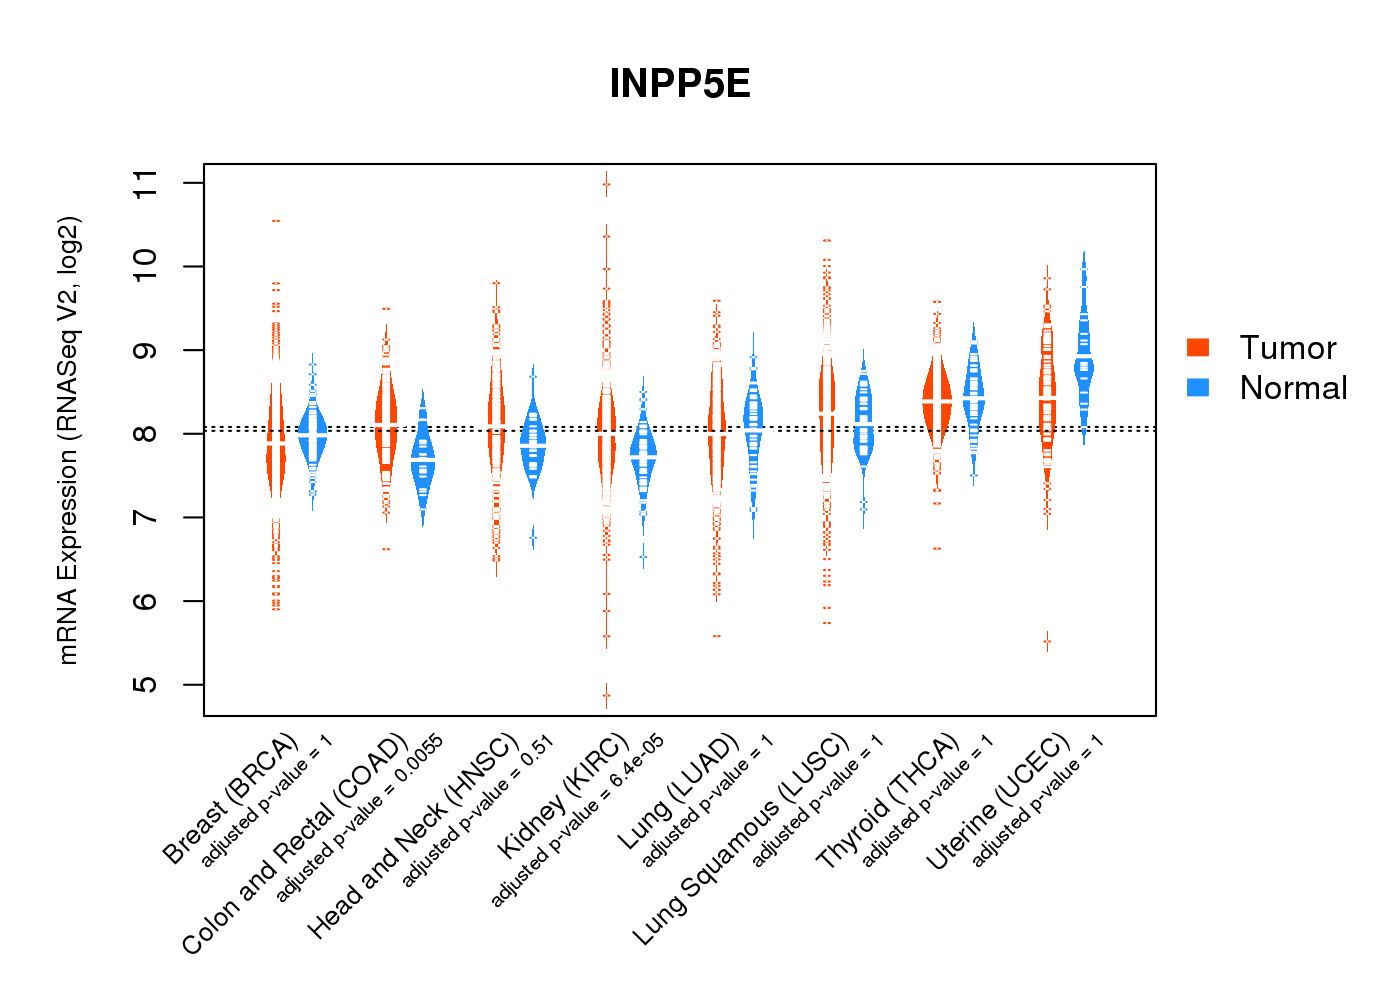
| * Normalized gene expression data of RNASeqV2 was extracted from TCGA using R package TCGA-Assembler. The URLs of all public data files on TCGA DCC data server were gathered at Jan-05-2015. Only eight cancer types have enough normal control samples for differential expression analysis. (t test, adjusted p<0.05 (using Benjamini-Hochberg FDR)) |
 |
| Top |
| * This plots show the correlation between CNV and gene expression. |
: Open all plots for all cancer types
 |
|
 |
|

| Top |
| Gene-Gene Network Information |
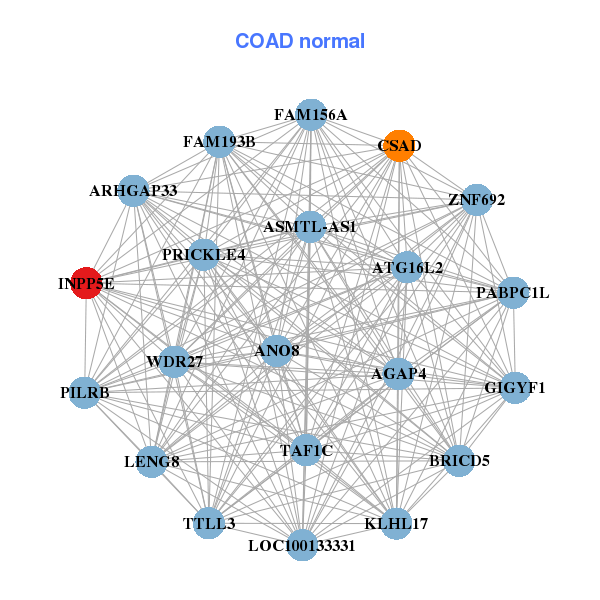
| * Co-Expression network figures were drawn using R package igraph. Only the top 20 genes with the highest correlations were shown. Red circle: input gene, orange circle: cell metabolism gene, sky circle: other gene |
: Open all plots for all cancer types
 |
|
| ANAPC2,ARHGAP33,ASB6,ENTHD2,RABL6,CAPN10,NELFB, CROCCP2,EXD3,FBXW5,GPSM1,GTF3C5,INPP5E,RALGDS, SDCCAG3,CLASRP,SNAPC4,TRAF2,UBAC1,DPH7,ZMYND19 | ABTB1,ANKRD13D,ENTHD2,TMEM74B,CDK9,CENPT,EGFL8, FAM160B2,FRS3,HDAC7,INPP5E,LCAT,LMBR1L,MAP3K11, MTMR9LP,SLC39A13,TAZ,TJAP1,TNFRSF14,TNFRSF25,USF1 |
 |
|
| AGAP4,CCNL2,CDK10,CENPT,EGFL8,FAM193B,FAM73B, GIGYF1,INPP5E,LENG8,LOC100130015,PILRB,RALGDS,CLASRP, SNAPC4,TAF1C,TCTE3,TSC1,WDR27,DPH7,ZNF767P | AGAP4,ANO8,ARHGAP33,ATG16L2,BRICD5,CSAD,FAM156A, FAM193B,GIGYF1,INPP5E,KLHL17,LENG8,LOC100133331,ASMTL-AS1, PABPC1L,PILRB,PRICKLE4,TAF1C,TTLL3,WDR27,ZNF692 |

| * Co-Expression network figures were drawn using R package igraph. Only the top 20 genes with the highest correlations were shown. Red circle: input gene, orange circle: cell metabolism gene, sky circle: other gene |
: Open all plots for all cancer types
| Top |
: Open all interacting genes' information including KEGG pathway for all interacting genes from DAVID
| Top |
| Pharmacological Information for INPP5E |
| There's no related Drug. |
| Top |
| Cross referenced IDs for INPP5E |
| * We obtained these cross-references from Uniprot database. It covers 150 different DBs, 18 categories. http://www.uniprot.org/help/cross_references_section |
: Open all cross reference information
|
Copyright © 2016-Present - The Univsersity of Texas Health Science Center at Houston @ |