|
|||||||||||||||||||||||||||||||||||||||||||||||||||||||||||||||||||||||||||||||||||||||||||||||||||||||||||||||||||||||||||||||||||||||||||||||||||||||||||||||||||||||||||||||||||||||||||||||||||||||||||||||||||||||||||||||||||||||||||||||||||||||||||||||||||||||||||||||||||||||||||||||||||||||||||||||||||||||||||||||||||||||||||||||||||||||||
| |
| Phenotypic Information (metabolism pathway, cancer, disease, phenome) |
| |
| |
| Gene-Gene Network Information: Co-Expression Network, Interacting Genes & KEGG |
| |
|


| Gene Summary for PSMA3 |
| Top |
| Phenotypic Information for PSMA3(metabolism pathway, cancer, disease, phenome) |
| Cancer | CGAP: PSMA3 |
| Familial Cancer Database: PSMA3 | |
| * This gene is included in those cancer gene databases. |
|
|
|
|
|
| . | |||||||||||||||||||||||||||||||||||||||||||||||||||||||||||||||||||||||||||||||||||||||||||||||||||||||||||||||||||||||||||||||||||||||||||||||||||||||||||||||||||||||||||||||||||||||||||||||||||||||||||||||||||||||||||||||||||||||||||||||||||||||||||||||||||||||||||||||||||||||||||||||||||||||||||||||||||||||||||||||||||||||||||||||||||
Oncogene 1 | Significant driver gene in | ||||||||||||||||||||||||||||||||||||||||||||||||||||||||||||||||||||||||||||||||||||||||||||||||||||||||||||||||||||||||||||||||||||||||||||||||||||||||||||||||||||||||||||||||||||||||||||||||||||||||||||||||||||||||||||||||||||||||||||||||||||||||||||||||||||||||||||||||||||||||||||||||||||||||||||||||||||||||||||||||||||||||||||||||||||||||
| cf) number; DB name 1 Oncogene; http://nar.oxfordjournals.org/content/35/suppl_1/D721.long, 2 Tumor Suppressor gene; https://bioinfo.uth.edu/TSGene/, 3 Cancer Gene Census; http://www.nature.com/nrc/journal/v4/n3/abs/nrc1299.html, 4 CancerGenes; http://nar.oxfordjournals.org/content/35/suppl_1/D721.long, 5 Network of Cancer Gene; http://ncg.kcl.ac.uk/index.php, 1Therapeutic Vulnerabilities in Cancer; http://cbio.mskcc.org/cancergenomics/statius/ |
| REACTOME_METABOLISM_OF_AMINO_ACIDS_AND_DERIVATIVES REACTOME_METABOLISM_OF_MRNA REACTOME_METABOLISM_OF_RNA | |
| OMIM | |
| Orphanet | |
| Disease | KEGG Disease: PSMA3 |
| MedGen: PSMA3 (Human Medical Genetics with Condition) | |
| ClinVar: PSMA3 | |
| Phenotype | MGI: PSMA3 (International Mouse Phenotyping Consortium) |
| PhenomicDB: PSMA3 | |
| Mutations for PSMA3 |
| * Under tables are showing count per each tissue to give us broad intuition about tissue specific mutation patterns.You can go to the detailed page for each mutation database's web site. |
| There's no structural variation information in COSMIC data for this gene. |
| * From mRNA Sanger sequences, Chitars2.0 arranged chimeric transcripts. This table shows PSMA3 related fusion information. |
| ID | Head Gene | Tail Gene | Accession | Gene_a | qStart_a | qEnd_a | Chromosome_a | tStart_a | tEnd_a | Gene_a | qStart_a | qEnd_a | Chromosome_a | tStart_a | tEnd_a |
| Top |
| Mutation type/ Tissue ID | brca | cns | cerv | endome | haematopo | kidn | Lintest | liver | lung | ns | ovary | pancre | prost | skin | stoma | thyro | urina | |||
| Total # sample | 1 | |||||||||||||||||||
| GAIN (# sample) | 1 | |||||||||||||||||||
| LOSS (# sample) |
| cf) Tissue ID; Tissue type (1; Breast, 2; Central_nervous_system, 3; Cervix, 4; Endometrium, 5; Haematopoietic_and_lymphoid_tissue, 6; Kidney, 7; Large_intestine, 8; Liver, 9; Lung, 10; NS, 11; Ovary, 12; Pancreas, 13; Prostate, 14; Skin, 15; Stomach, 16; Thyroid, 17; Urinary_tract) |
| Top |
|
 |
| Top |
| Stat. for Non-Synonymous SNVs (# total SNVs=23) | (# total SNVs=11) |
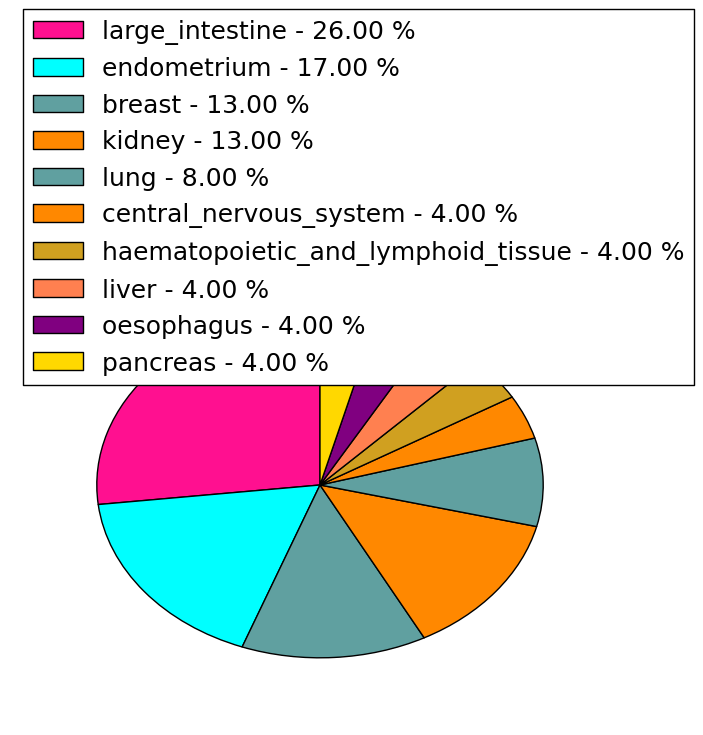 | 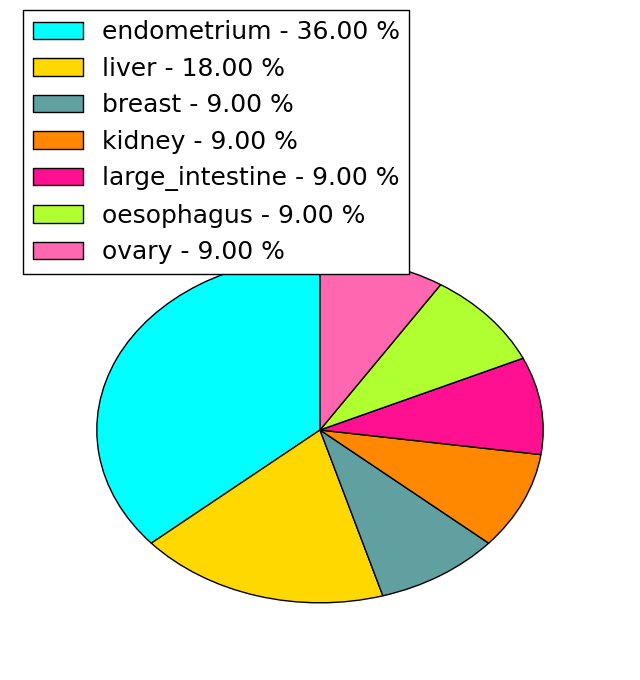 |
(# total SNVs=0) | (# total SNVs=0) |
| Top |
| * When you move the cursor on each content, you can see more deailed mutation information on the Tooltip. Those are primary_site,primary_histology,mutation(aa),pubmedID. |
| GRCh37 position | Mutation(aa) | Unique sampleID count |
| chr14:58724656-58724656 | p.R115I | 2 |
| chr14:58737155-58737155 | p.E204K | 2 |
| chr14:58737656-58737656 | p.T221T | 2 |
| chr14:58727739-58727739 | p.? | 2 |
| chr14:58724527-58724527 | p.N98T | 1 |
| chr14:58730469-58730469 | p.T175M | 1 |
| chr14:58714467-58714467 | p.? | 1 |
| chr14:58737688-58737688 | p.I232T | 1 |
| chr14:58724642-58724642 | p.? | 1 |
| chr14:58730477-58730477 | p.E178Q | 1 |
| Top |
|
 |
| Point Mutation/ Tissue ID | 1 | 2 | 3 | 4 | 5 | 6 | 7 | 8 | 9 | 10 | 11 | 12 | 13 | 14 | 15 | 16 | 17 | 18 | 19 | 20 |
| # sample | 3 | 6 | 1 | 3 | 2 | 1 | 6 | |||||||||||||
| # mutation | 3 | 6 | 1 | 3 | 2 | 1 | 5 | |||||||||||||
| nonsynonymous SNV | 2 | 5 | 1 | 2 | 2 | 1 | 2 | |||||||||||||
| synonymous SNV | 1 | 1 | 1 | 3 |
| cf) Tissue ID; Tissue type (1; BLCA[Bladder Urothelial Carcinoma], 2; BRCA[Breast invasive carcinoma], 3; CESC[Cervical squamous cell carcinoma and endocervical adenocarcinoma], 4; COAD[Colon adenocarcinoma], 5; GBM[Glioblastoma multiforme], 6; Glioma Low Grade, 7; HNSC[Head and Neck squamous cell carcinoma], 8; KICH[Kidney Chromophobe], 9; KIRC[Kidney renal clear cell carcinoma], 10; KIRP[Kidney renal papillary cell carcinoma], 11; LAML[Acute Myeloid Leukemia], 12; LUAD[Lung adenocarcinoma], 13; LUSC[Lung squamous cell carcinoma], 14; OV[Ovarian serous cystadenocarcinoma ], 15; PAAD[Pancreatic adenocarcinoma], 16; PRAD[Prostate adenocarcinoma], 17; SKCM[Skin Cutaneous Melanoma], 18:STAD[Stomach adenocarcinoma], 19:THCA[Thyroid carcinoma], 20:UCEC[Uterine Corpus Endometrial Carcinoma]) |
| Top |
| * We represented just top 10 SNVs. When you move the cursor on each content, you can see more deailed mutation information on the Tooltip. Those are primary_site, primary_histology, mutation(aa), pubmedID. |
| Genomic Position | Mutation(aa) | Unique sampleID count |
| chr14:58737155 | p.E204K,PSMA3 | 3 |
| chr14:58724656 | p.R115T,PSMA3 | 2 |
| chr14:58737146 | p.G39V,PSMA3 | 1 |
| chr14:58718854 | p.I232T,PSMA3 | 1 |
| chr14:58718929 | p.R41I,PSMA3 | 1 |
| chr14:58737187 | p.S250P,PSMA3 | 1 |
| chr14:58718946 | p.R66I,PSMA3 | 1 |
| chr14:58737668 | p.S250S,PSMA3 | 1 |
| chr14:58737676 | p.R72W,PSMA3 | 1 |
| chr14:58724681 | p.Y123Y,PSMA3 | 1 |
| * Copy number data were extracted from TCGA using R package TCGA-Assembler. The URLs of all public data files on TCGA DCC data server were gathered on Jan-05-2015. Function ProcessCNAData in TCGA-Assembler package was used to obtain gene-level copy number value which is calculated as the average copy number of the genomic region of a gene. |
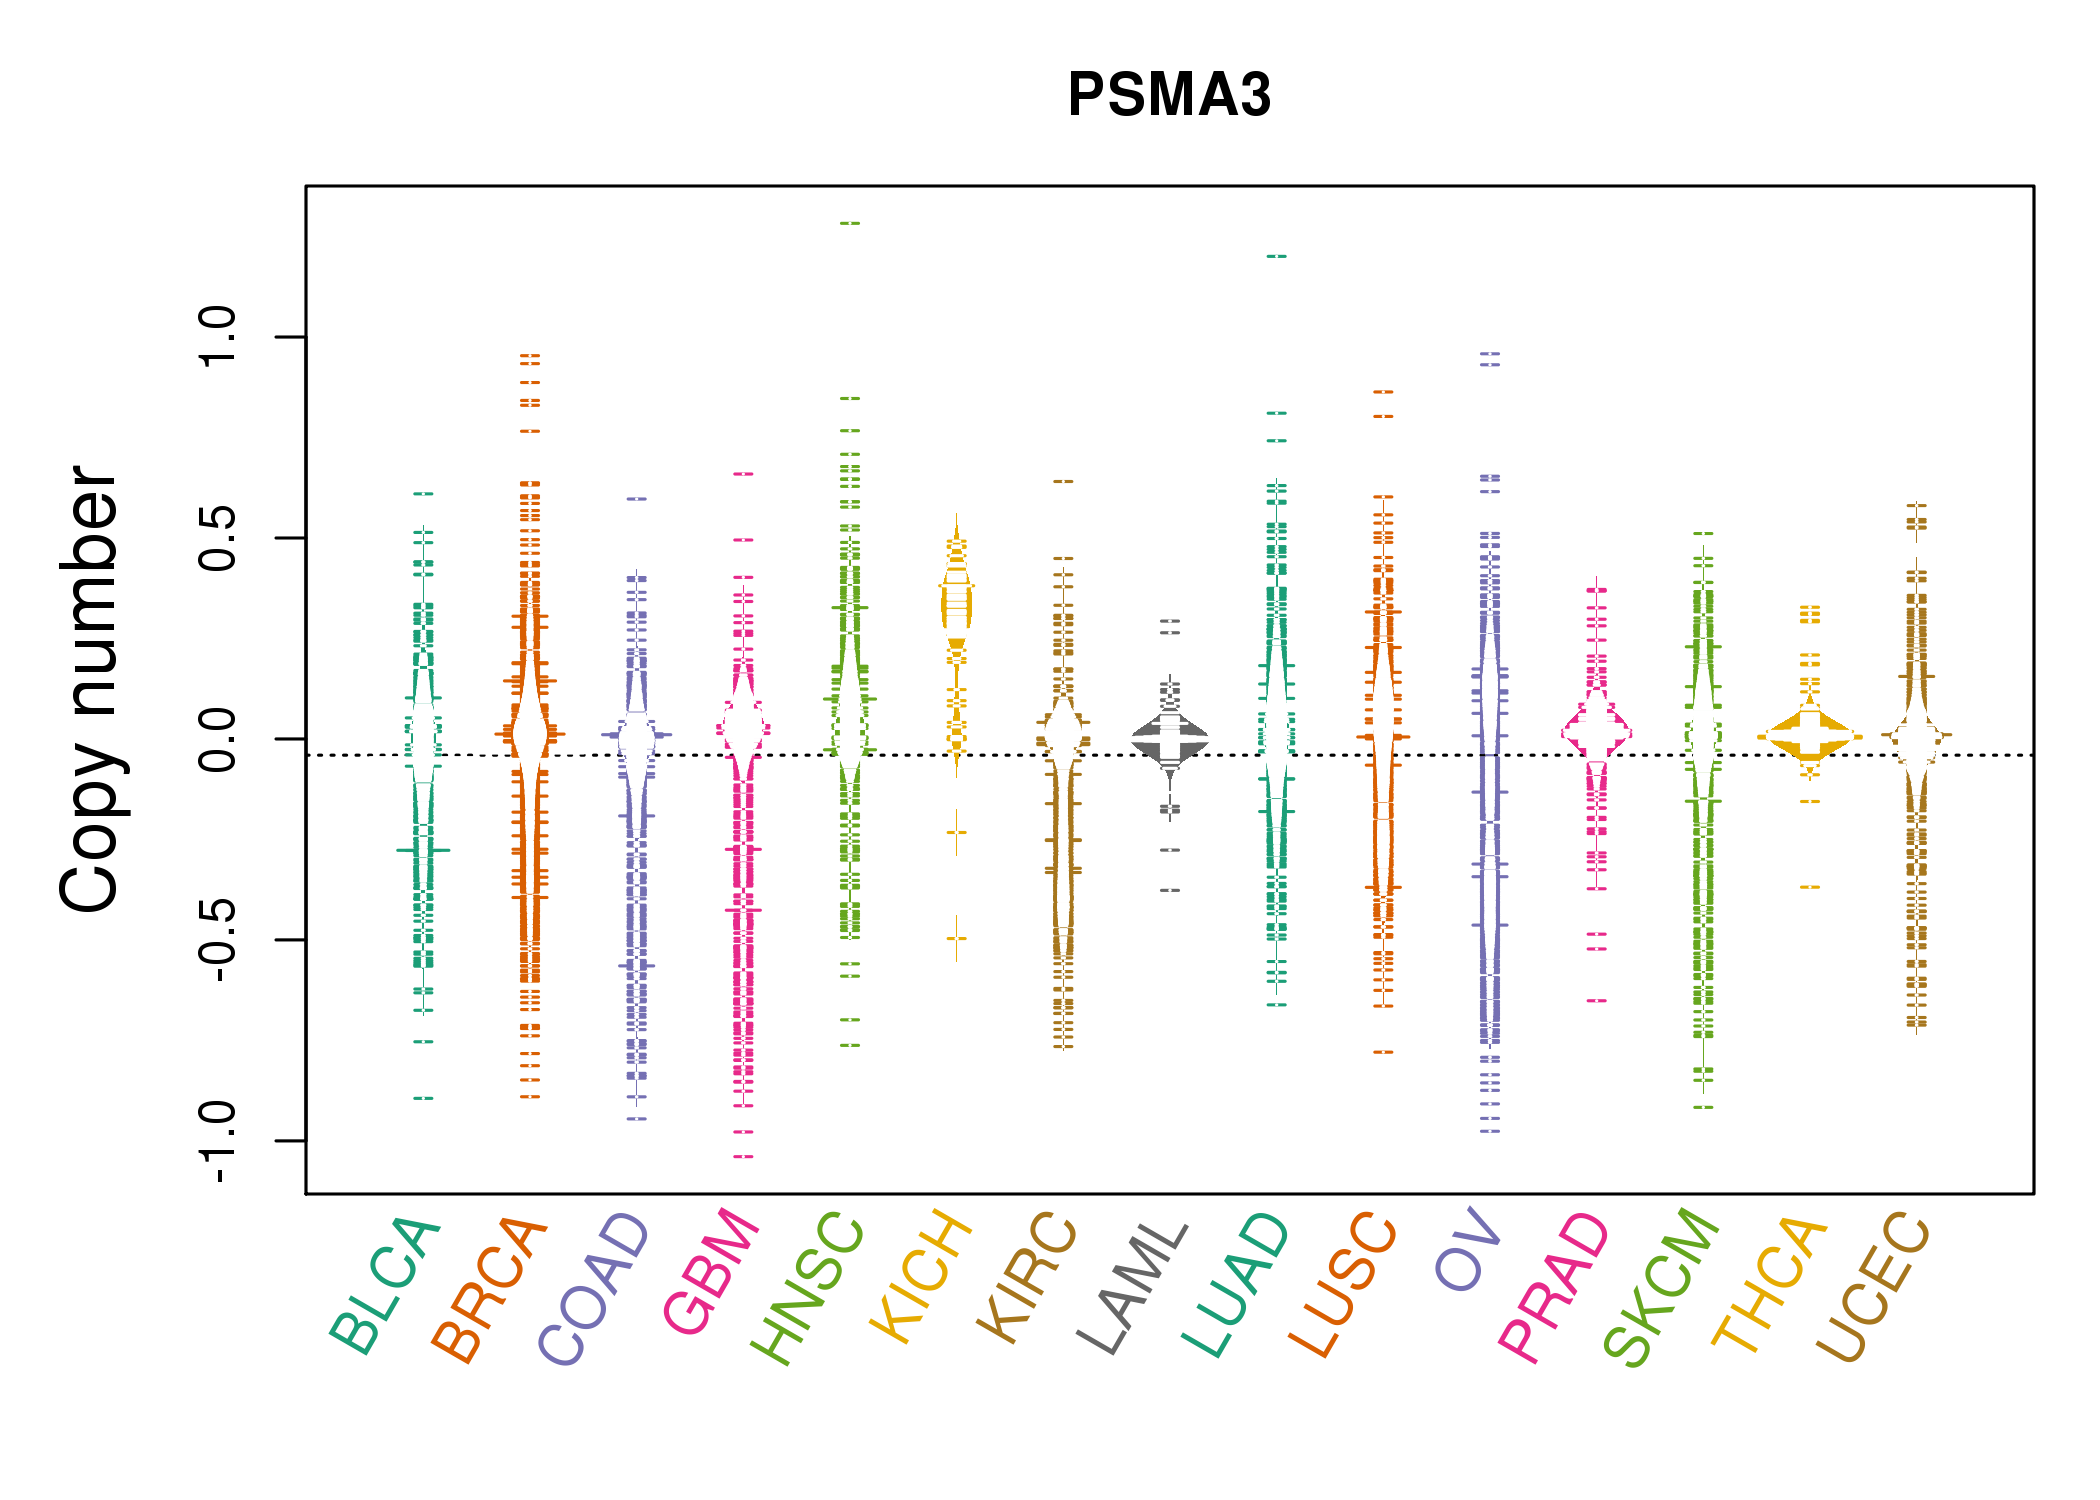 |
| cf) Tissue ID[Tissue type]: BLCA[Bladder Urothelial Carcinoma], BRCA[Breast invasive carcinoma], CESC[Cervical squamous cell carcinoma and endocervical adenocarcinoma], COAD[Colon adenocarcinoma], GBM[Glioblastoma multiforme], Glioma Low Grade, HNSC[Head and Neck squamous cell carcinoma], KICH[Kidney Chromophobe], KIRC[Kidney renal clear cell carcinoma], KIRP[Kidney renal papillary cell carcinoma], LAML[Acute Myeloid Leukemia], LUAD[Lung adenocarcinoma], LUSC[Lung squamous cell carcinoma], OV[Ovarian serous cystadenocarcinoma ], PAAD[Pancreatic adenocarcinoma], PRAD[Prostate adenocarcinoma], SKCM[Skin Cutaneous Melanoma], STAD[Stomach adenocarcinoma], THCA[Thyroid carcinoma], UCEC[Uterine Corpus Endometrial Carcinoma] |
| Top |
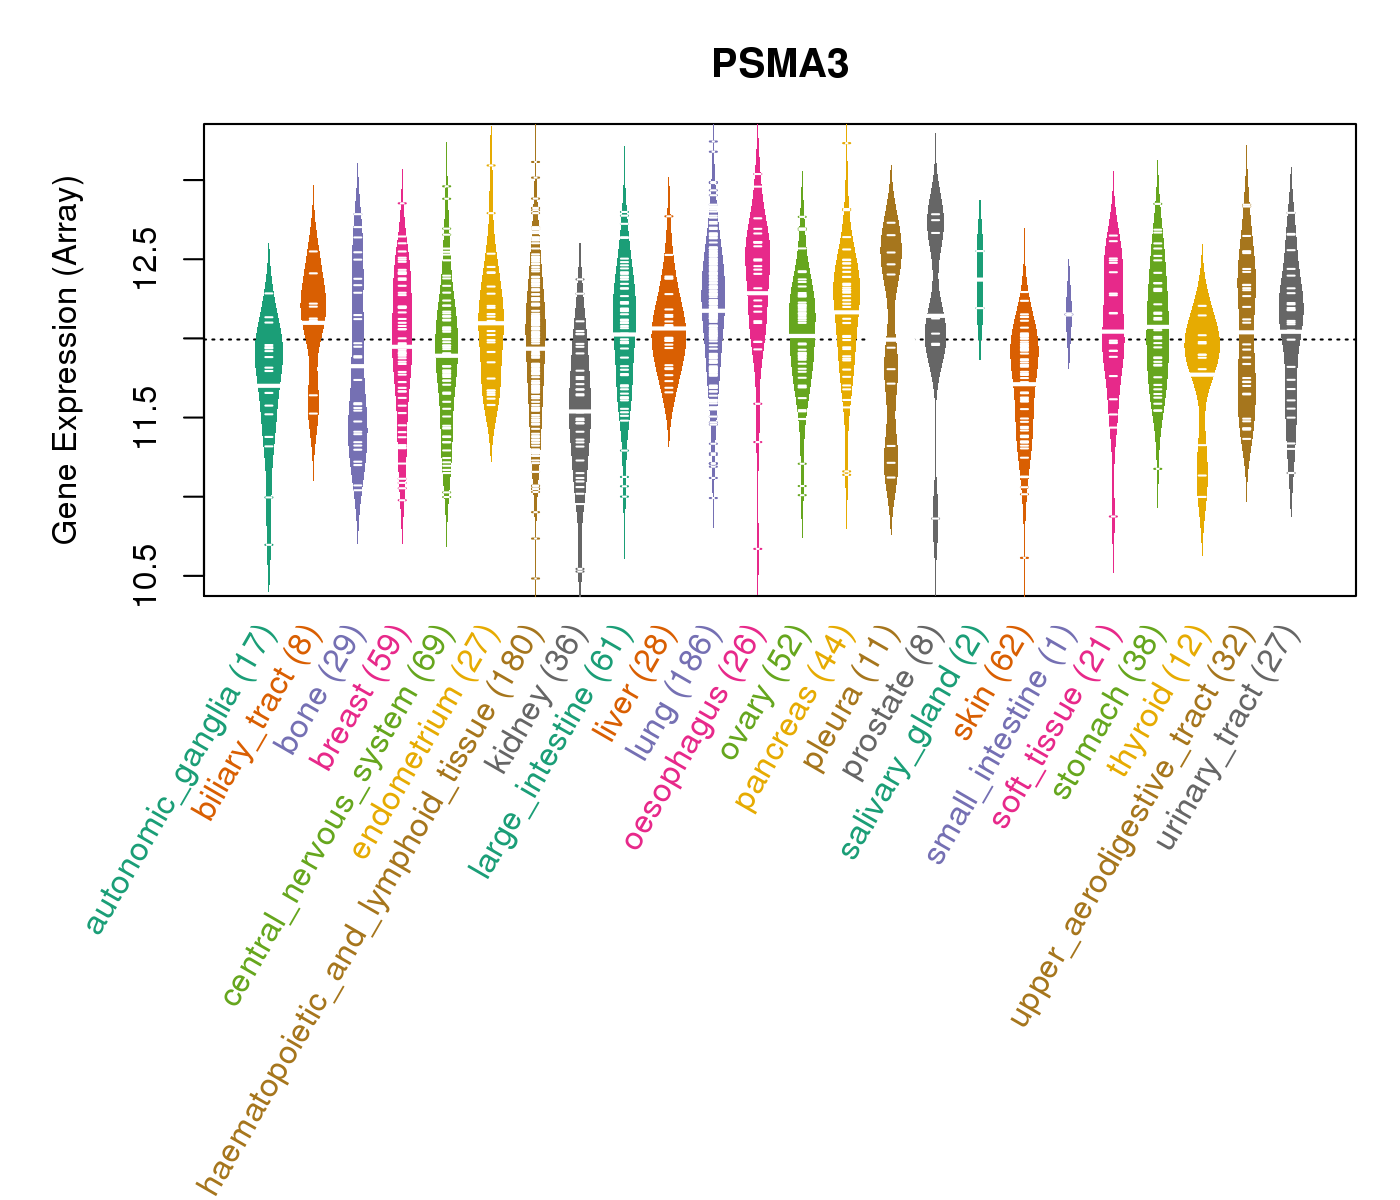
| Gene Expression for PSMA3 |
| * CCLE gene expression data were extracted from CCLE_Expression_Entrez_2012-10-18.res: Gene-centric RMA-normalized mRNA expression data. |
 |
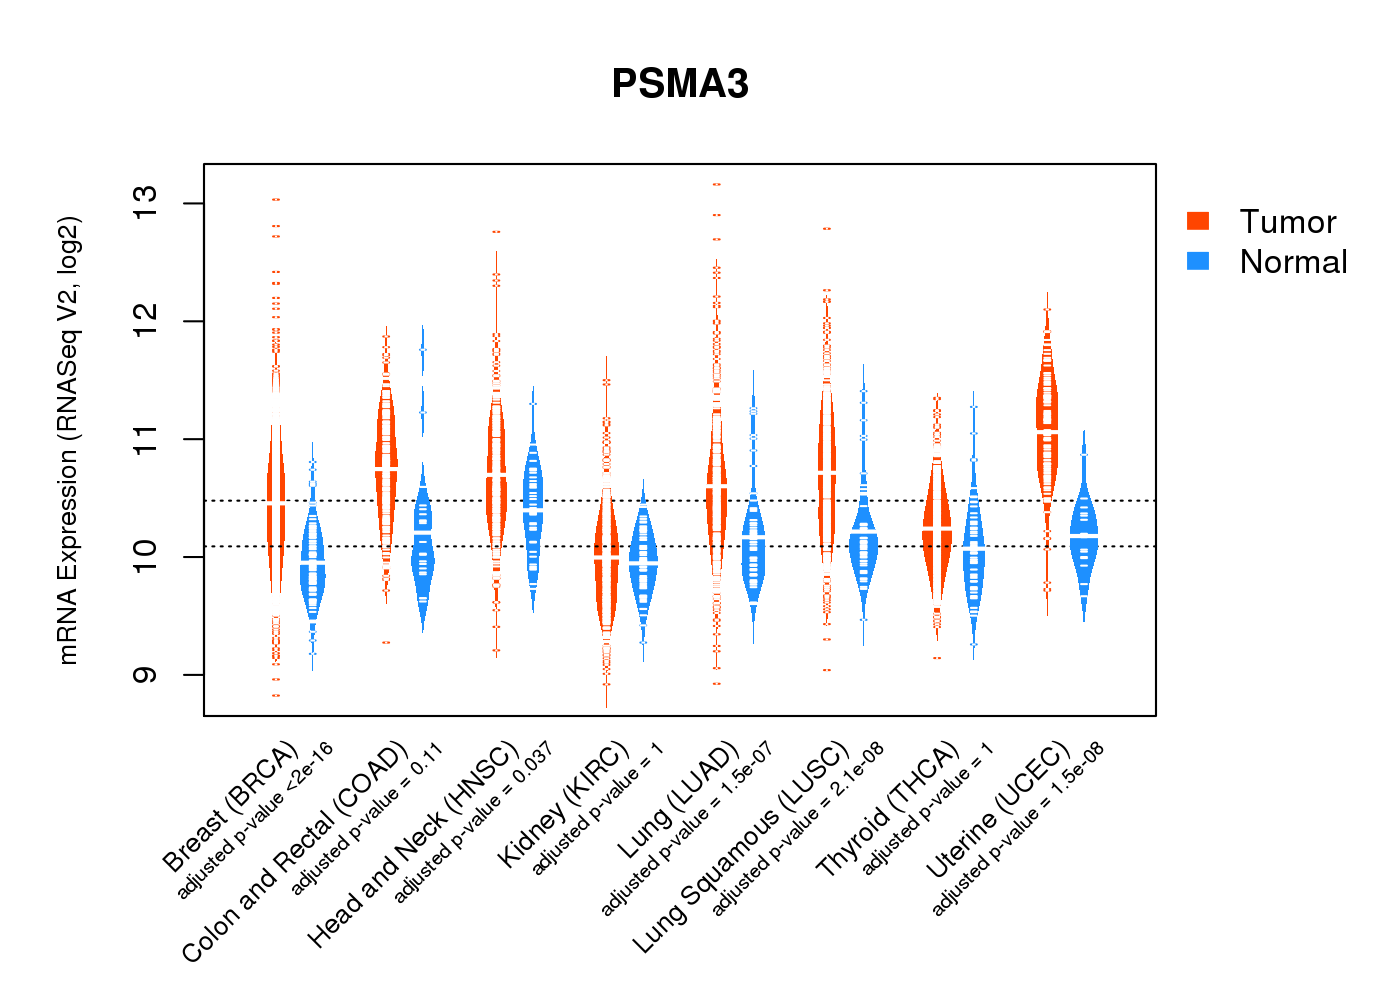
| * Normalized gene expression data of RNASeqV2 was extracted from TCGA using R package TCGA-Assembler. The URLs of all public data files on TCGA DCC data server were gathered at Jan-05-2015. Only eight cancer types have enough normal control samples for differential expression analysis. (t test, adjusted p<0.05 (using Benjamini-Hochberg FDR)) |
 |
| Top |
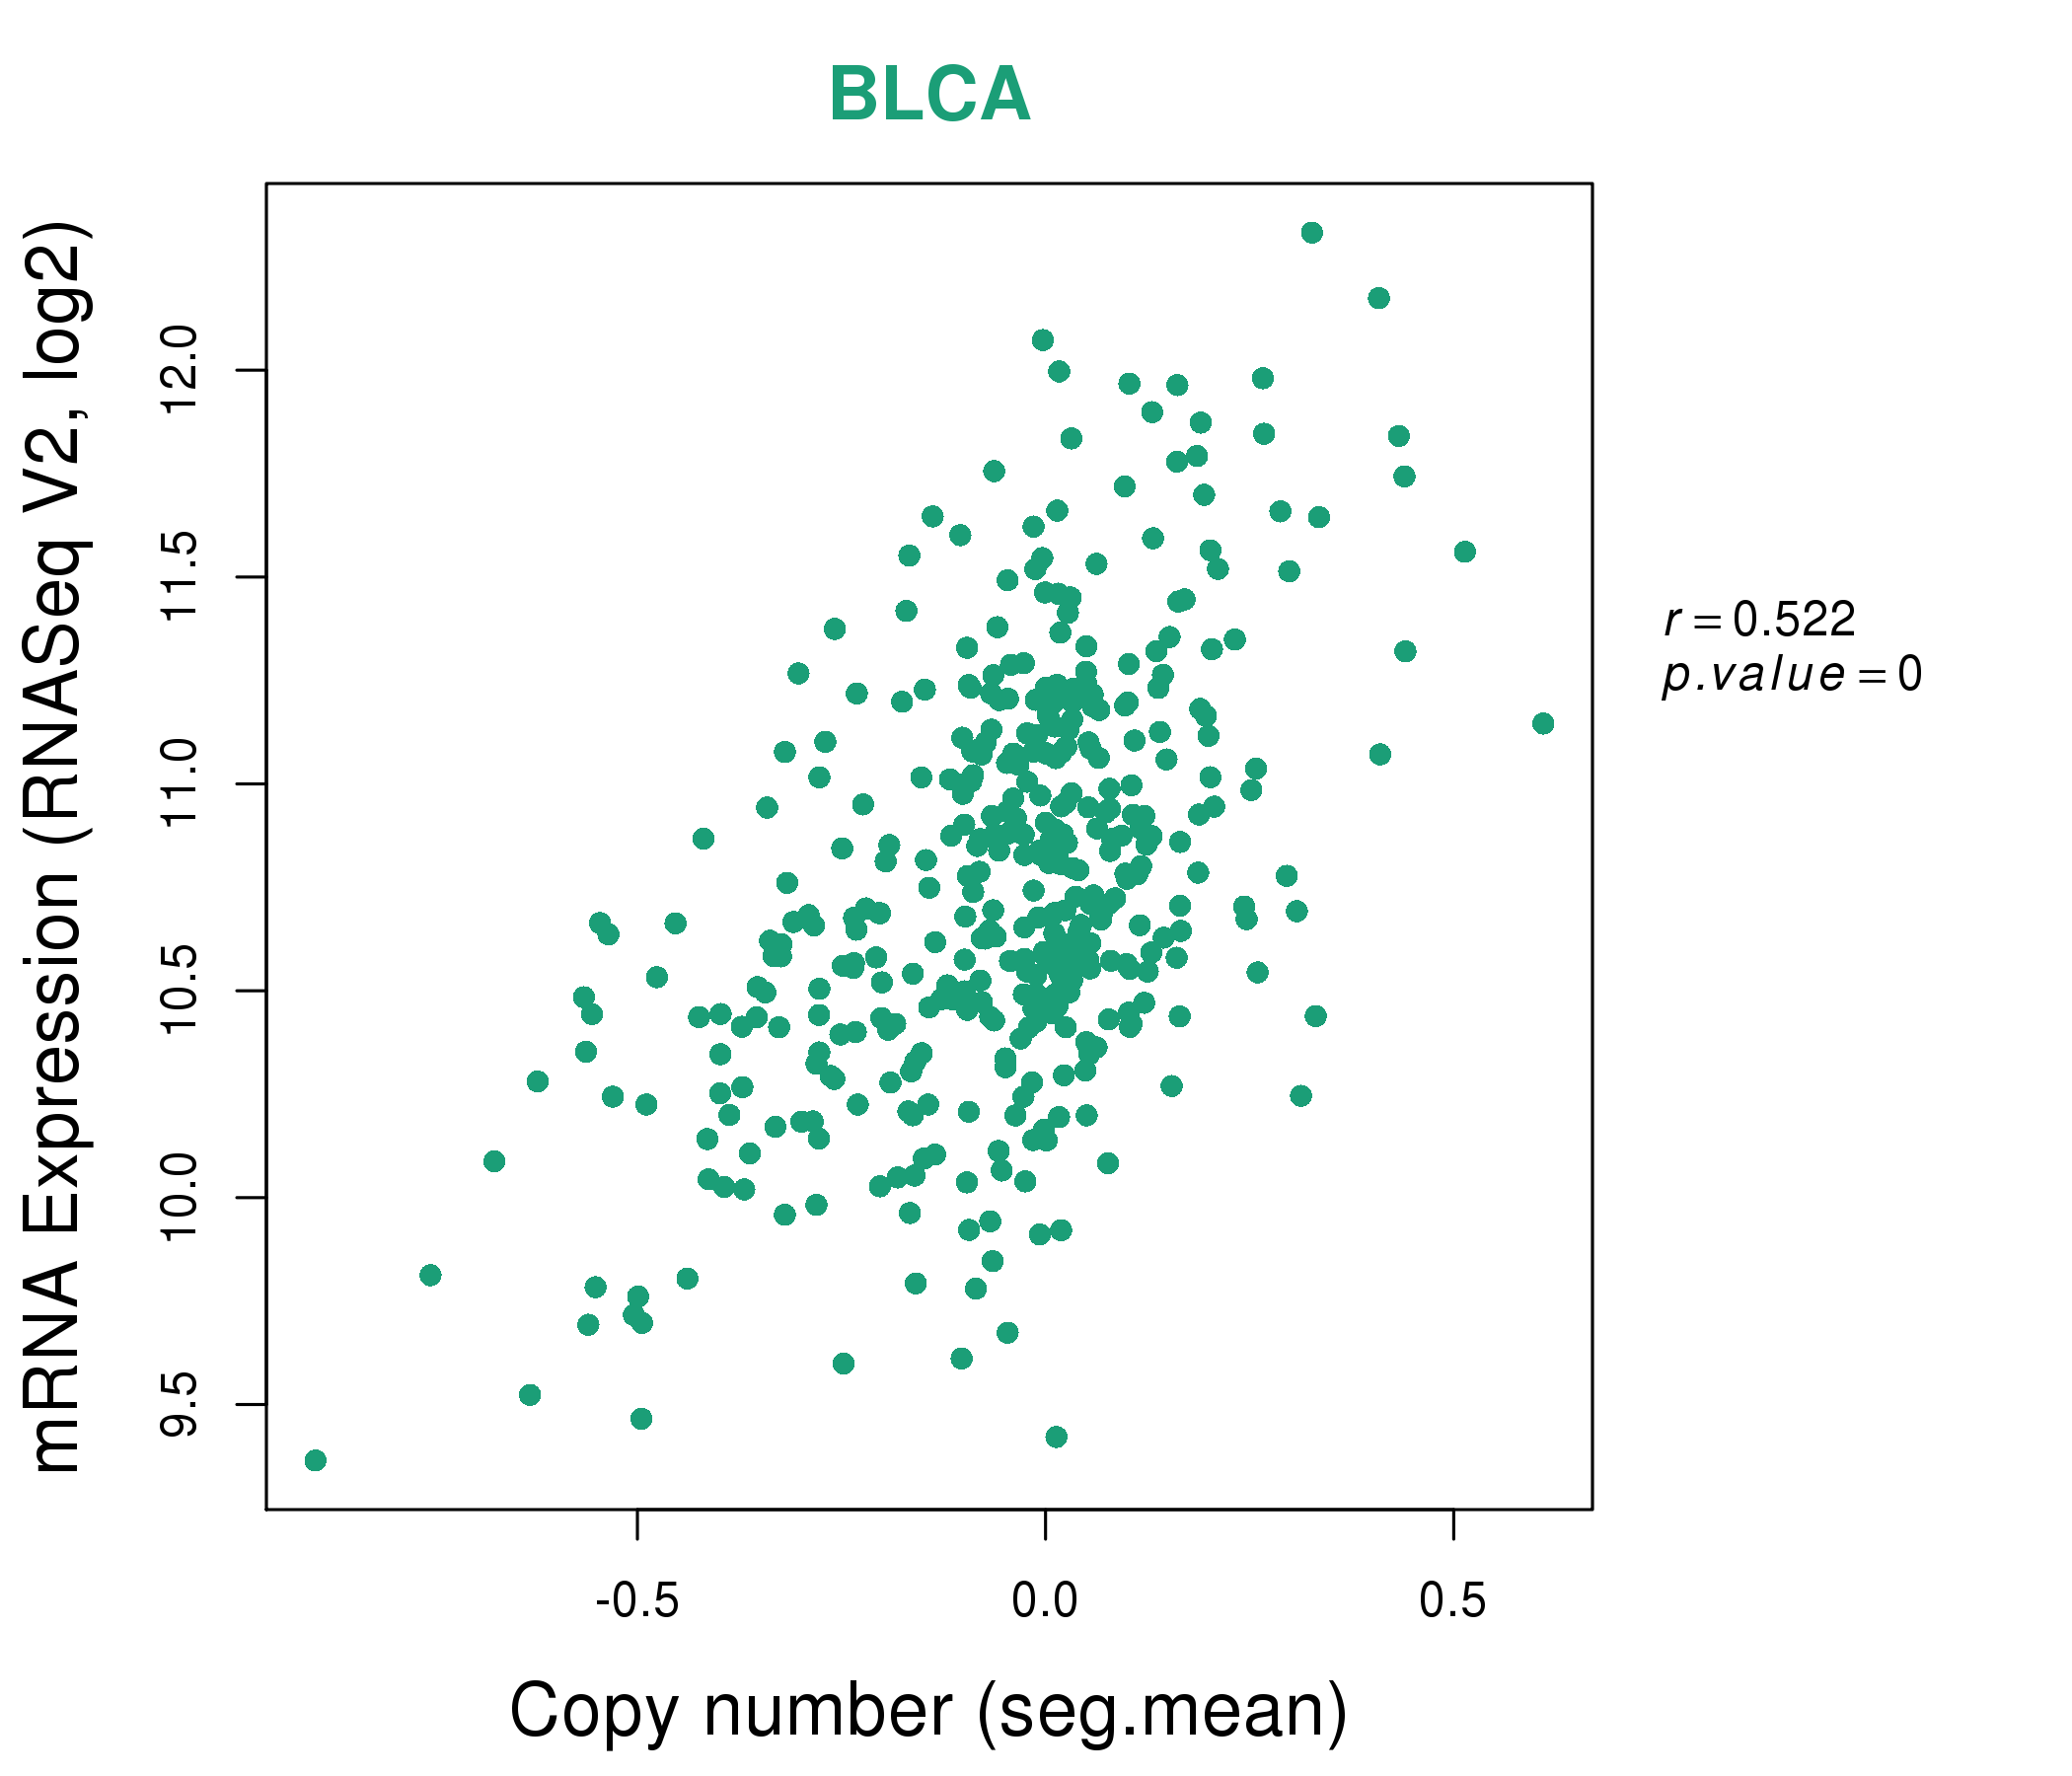
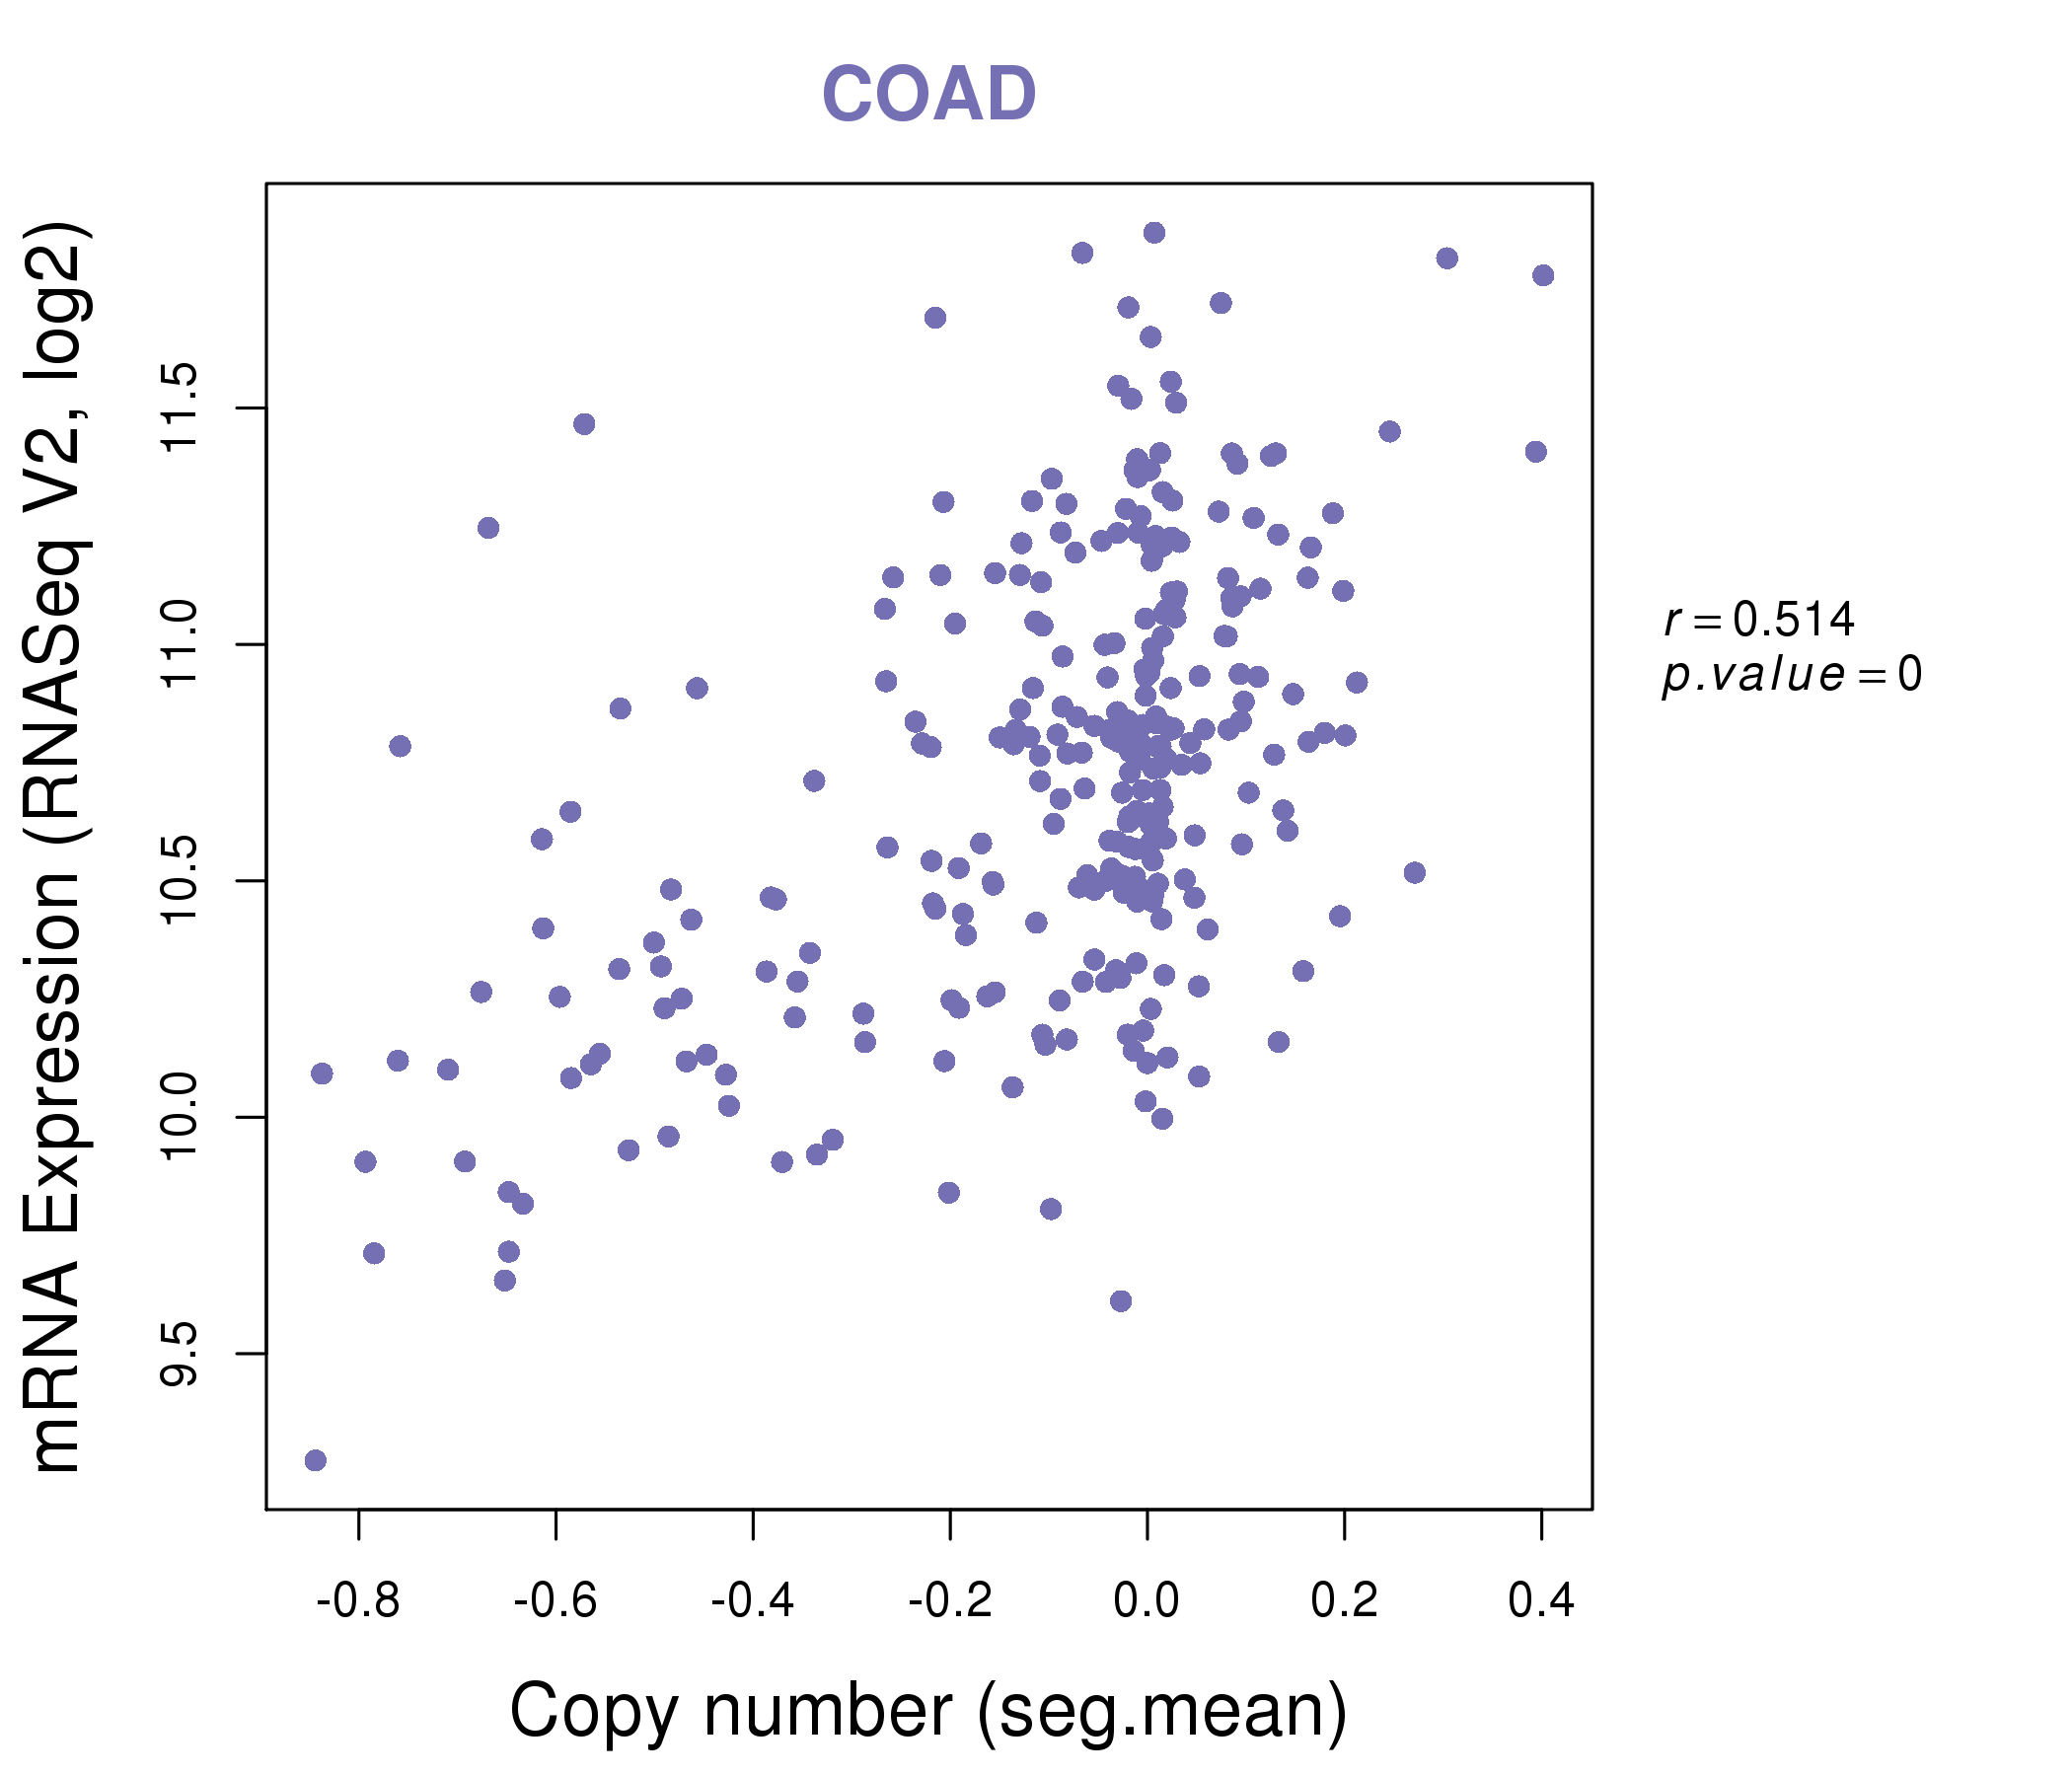
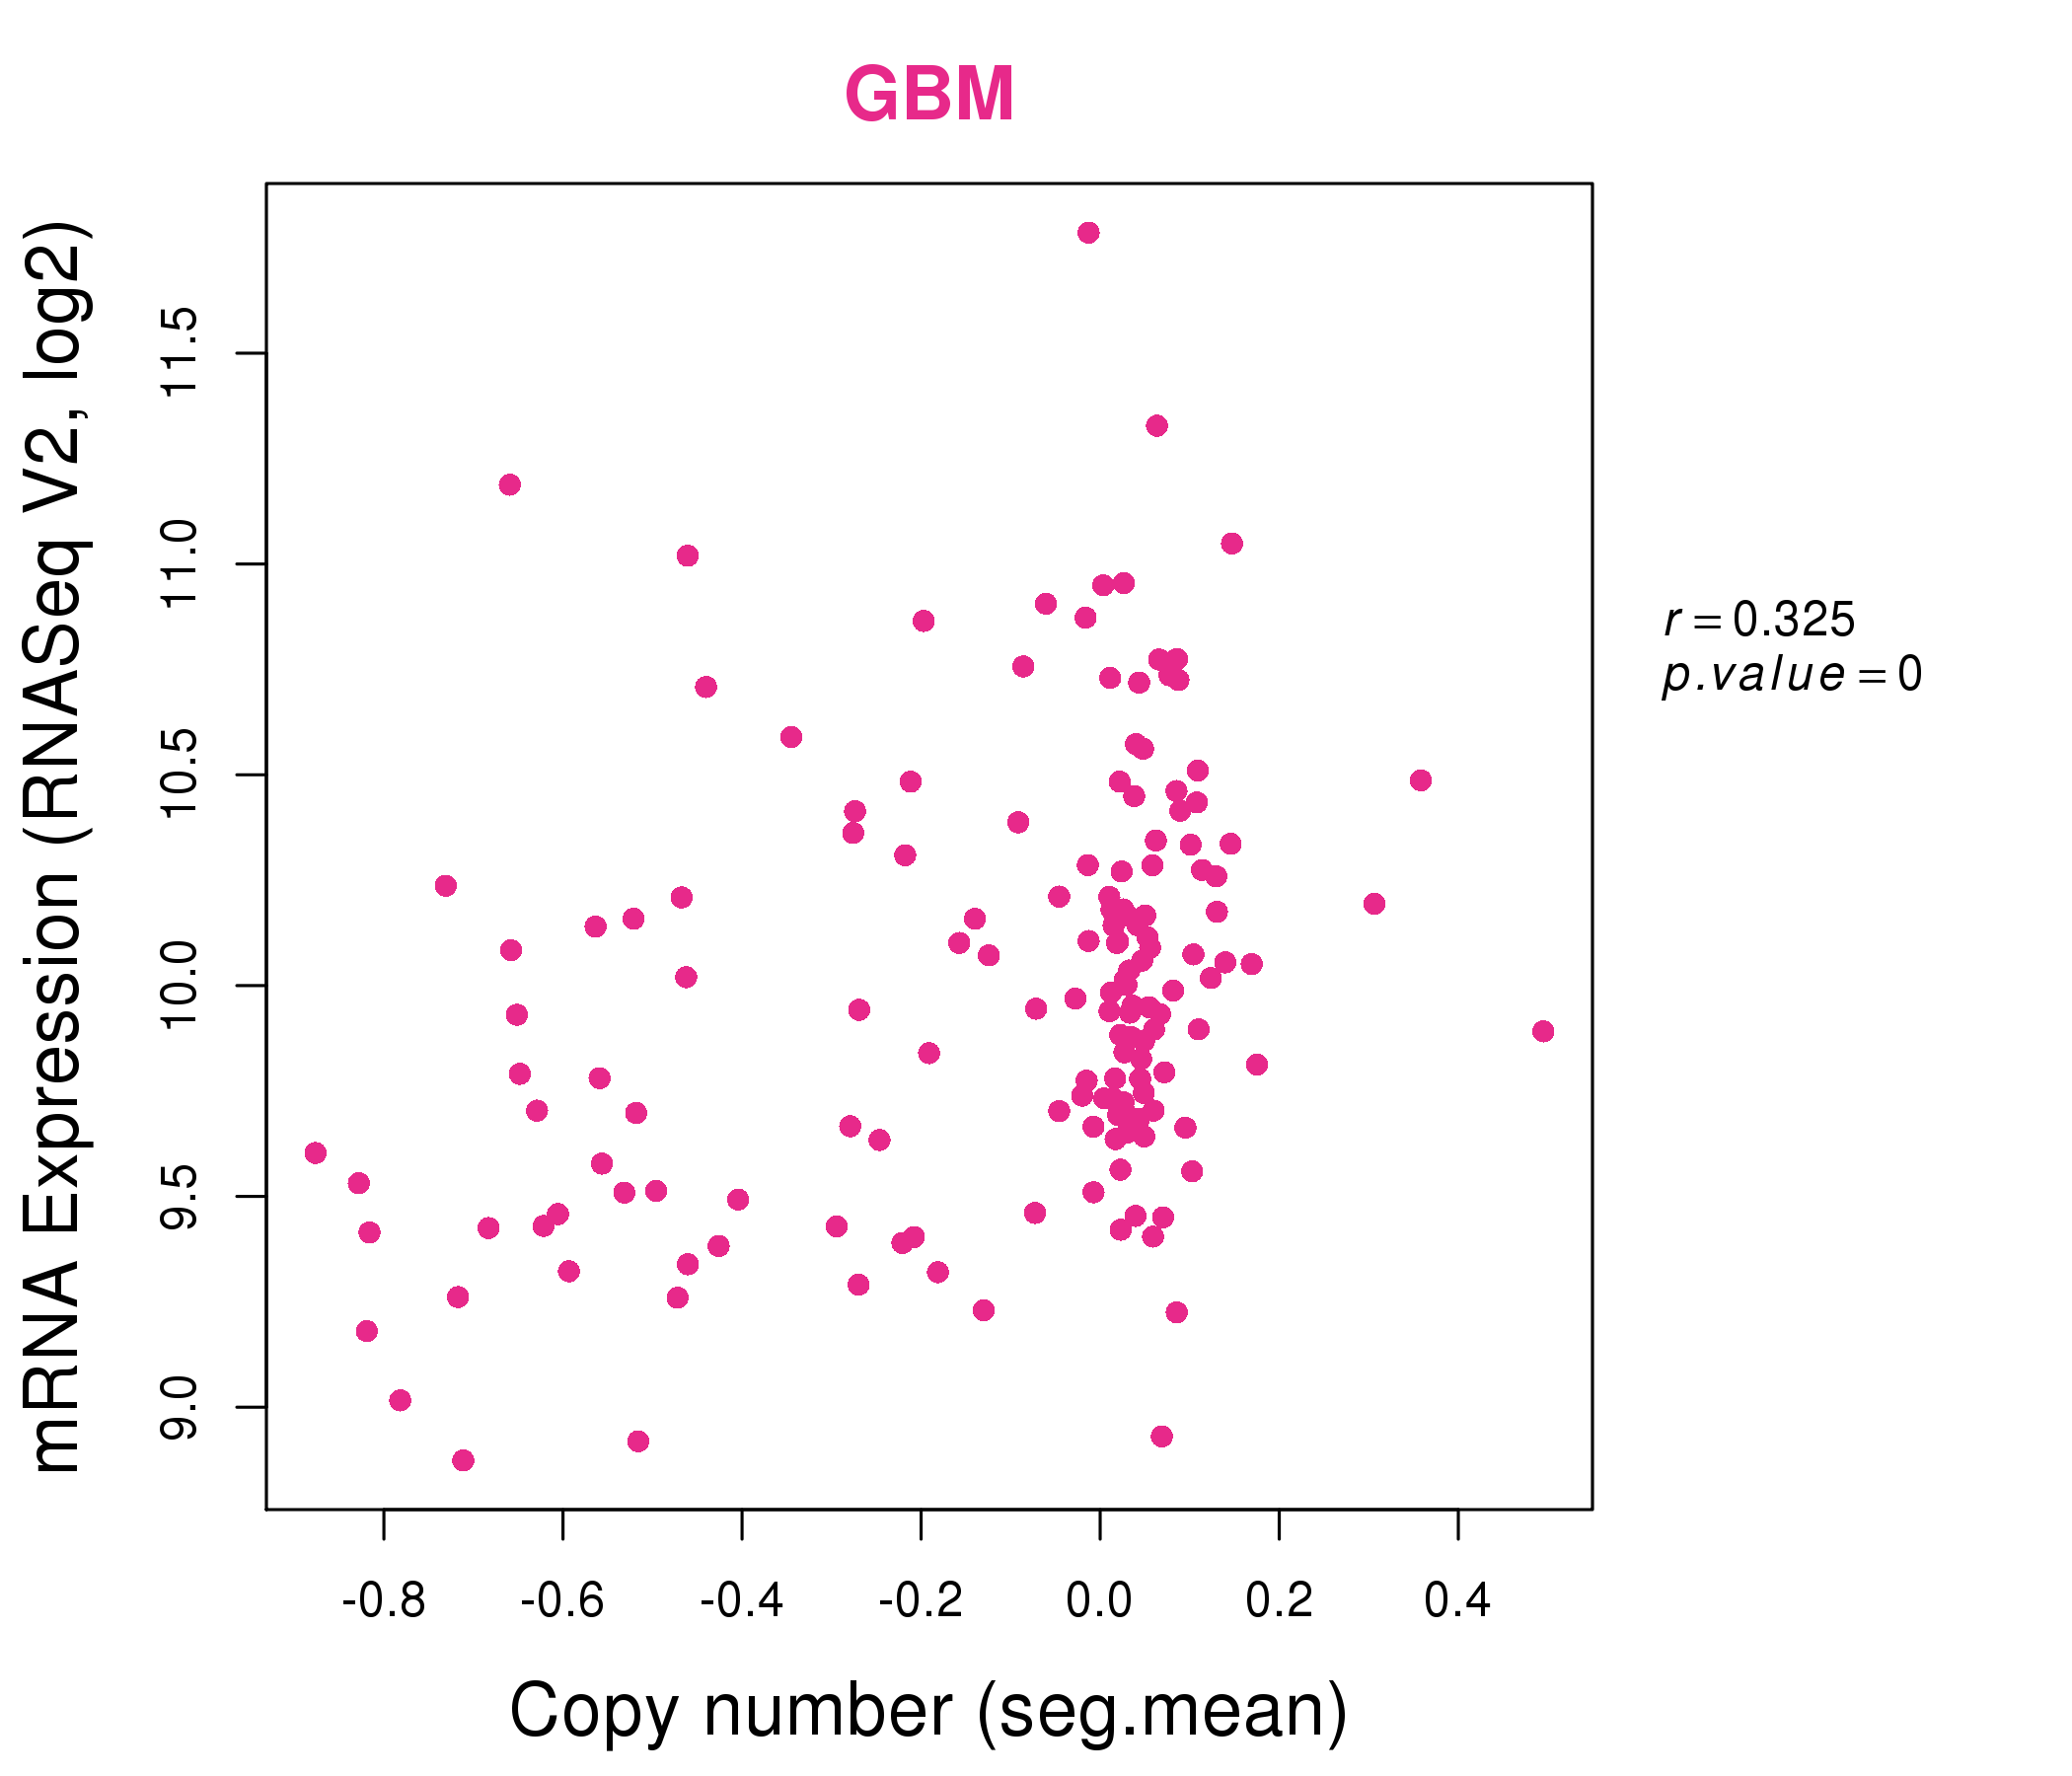
| * This plots show the correlation between CNV and gene expression. |
: Open all plots for all cancer types
 |
|
 |
|

| Top |
| Gene-Gene Network Information |
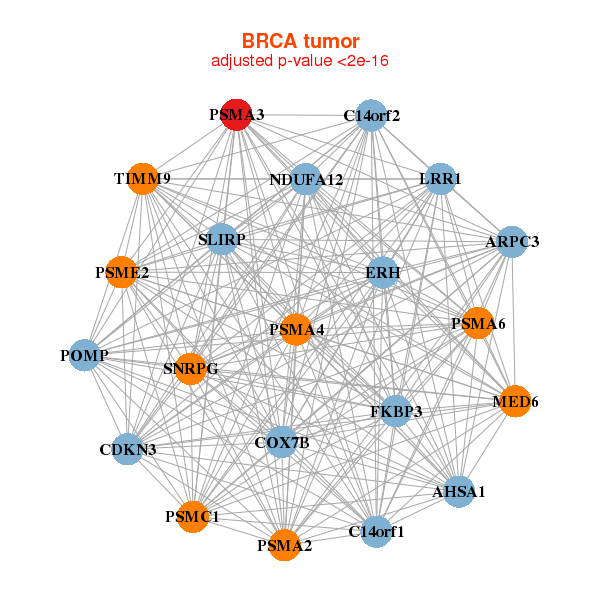
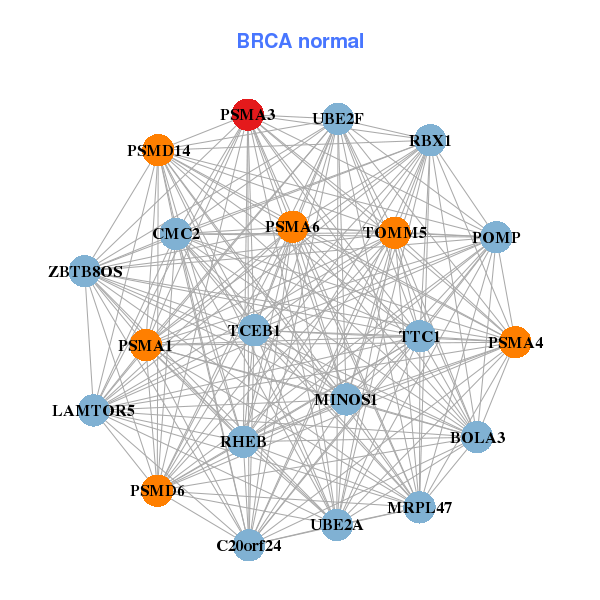
| * Co-Expression network figures were drawn using R package igraph. Only the top 20 genes with the highest correlations were shown. Red circle: input gene, orange circle: cell metabolism gene, sky circle: other gene |
: Open all plots for all cancer types
 |
| ||||
| AHSA1,ARPC3,C14orf1,SLIRP,C14orf2,CDKN3,COX7B, ERH,FKBP3,MED6,NDUFA12,POMP,LRR1,PSMA2, PSMA3,PSMA4,PSMA6,PSMC1,PSME2,SNRPG,TIMM9 | BOLA3,CMC2,MINOS1,C20orf24,LAMTOR5,MRPL47,POMP, PSMA1,PSMA3,PSMA4,PSMA6,PSMD14,PSMD6,RBX1, RHEB,TCEB1,TOMM5,TTC1,UBE2A,UBE2F,ZBTB8OS | ||||
 |
| ||||
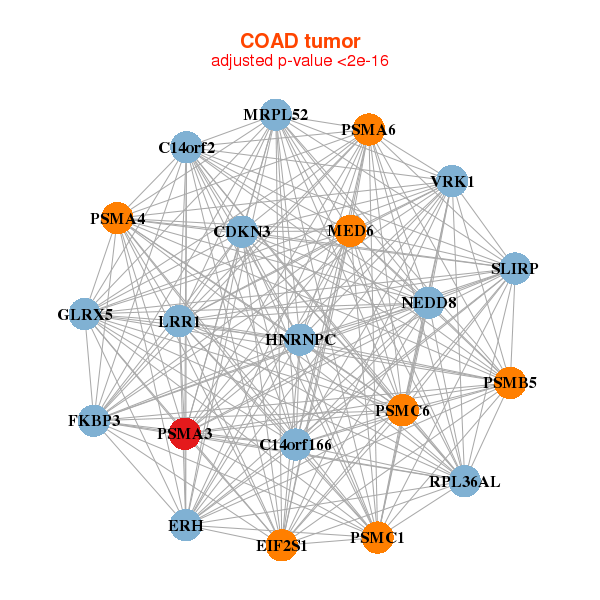
| SLIRP,C14orf166,C14orf2,CDKN3,EIF2S1,ERH,FKBP3, GLRX5,HNRNPC,MED6,MRPL52,NEDD8,LRR1,PSMA3, PSMA4,PSMA6,PSMB5,PSMC1,PSMC6,RPL36AL,VRK1 | DYNLT1,EIF5AL1,HAT1,NMI,POMP,PPA1,PSMA1, PSMA2,PSMA3,PSMA4,PSMA5,PSMA6,PSMA7,PSMB1, PSMC2,PSMD13,PSMD14,PSMD7,RPL22L1,SEC61B,SNRPG |
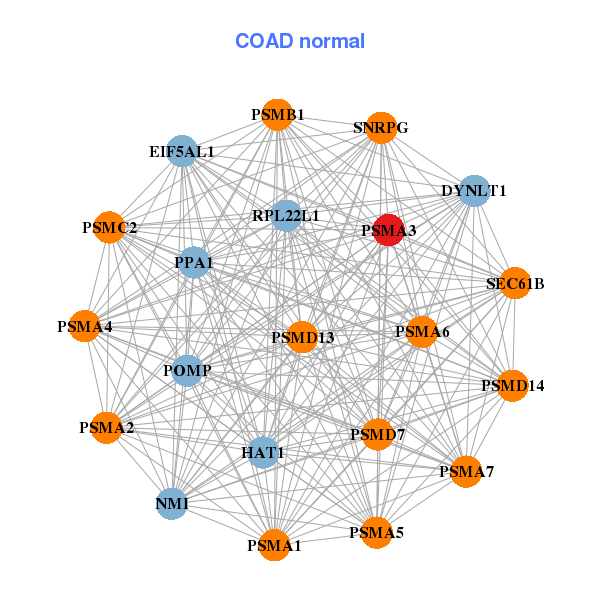
| * Co-Expression network figures were drawn using R package igraph. Only the top 20 genes with the highest correlations were shown. Red circle: input gene, orange circle: cell metabolism gene, sky circle: other gene |
: Open all plots for all cancer types
| Top |
: Open all interacting genes' information including KEGG pathway for all interacting genes from DAVID
| Top |
| Pharmacological Information for PSMA3 |
| DB Category | DB Name | DB's ID and Url link |
| * Gene Centered Interaction Network. |
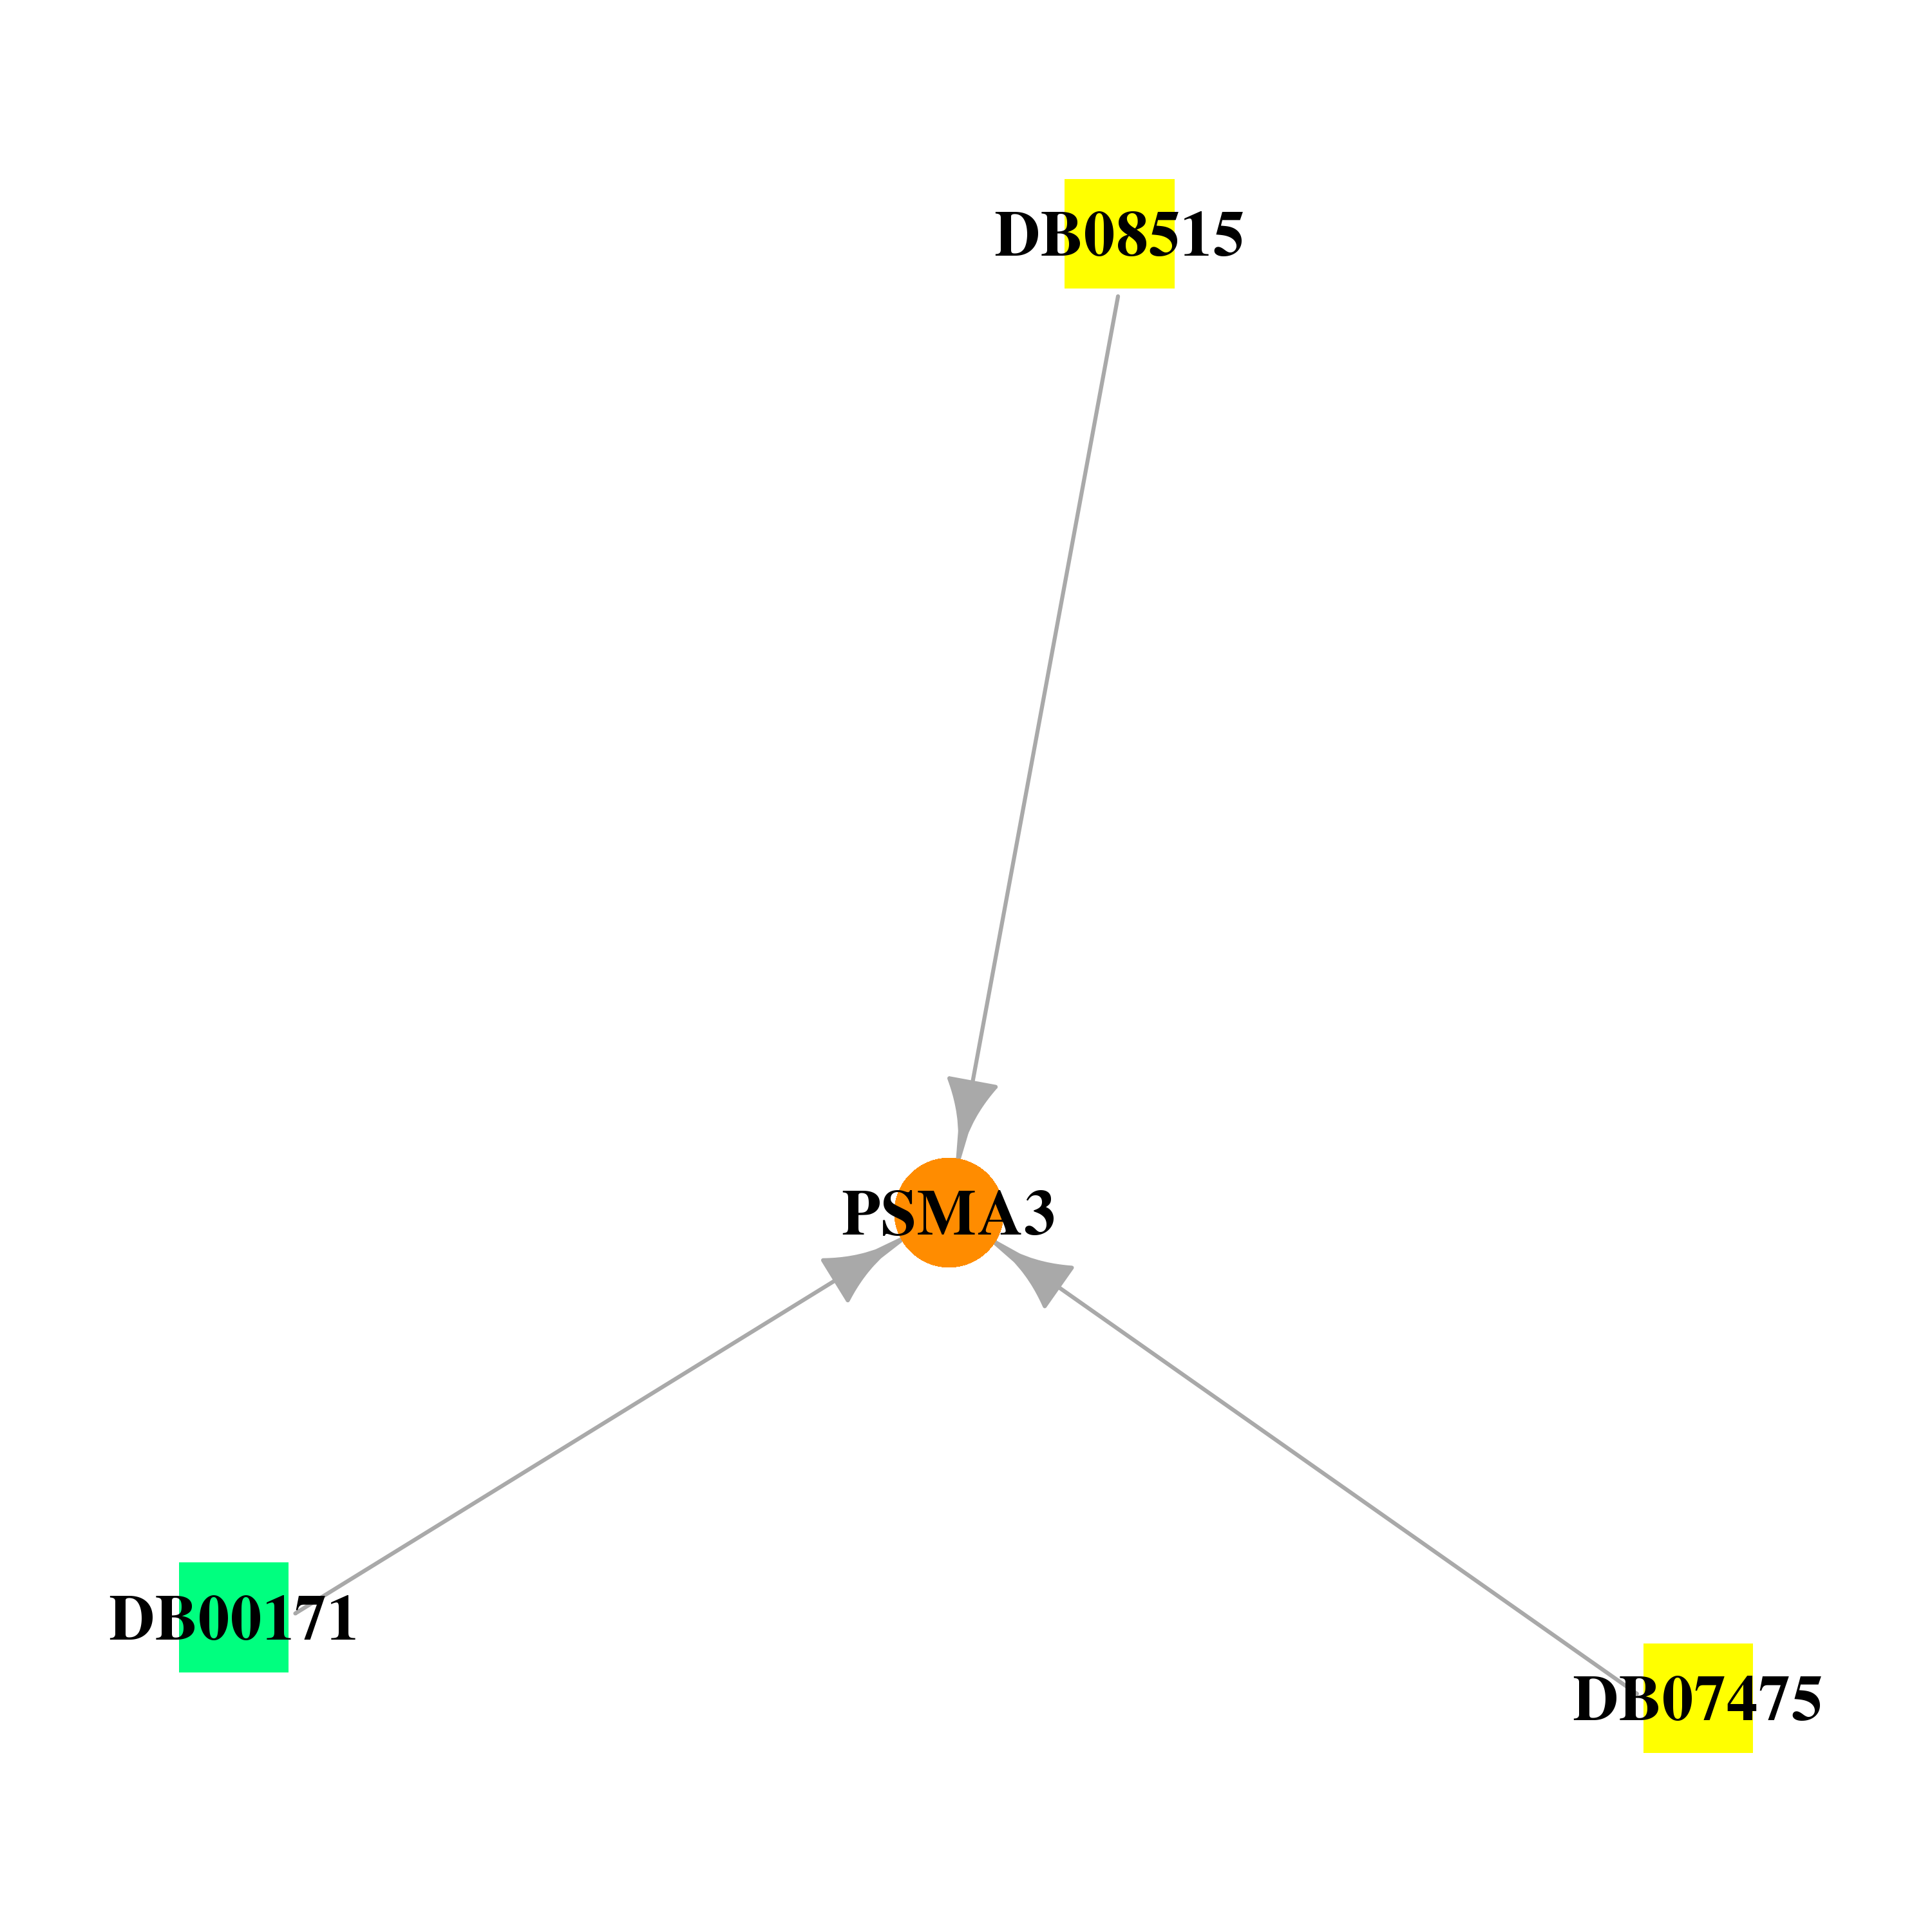 |
| * Drug Centered Interaction Network. |
| DrugBank ID | Target Name | Drug Groups | Generic Name | Drug Centered Network | Drug Structure |
| DB07475 | proteasome (prosome, macropain) subunit, alpha type, 3 | experimental | N-[(1R)-1-(DIHYDROXYBORYL)-3-METHYLBUTYL]-N-(PYRAZIN-2-YLCARBONYL)-L-PHENYLALANINAMIDE |  | 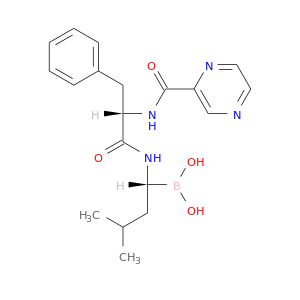 |
| DB08515 | proteasome (prosome, macropain) subunit, alpha type, 3 | experimental | (3AR,6R,6AS)-6-((S)-((S)-CYCLOHEX-2-ENYL)(HYDROXY)METHYL)-6A-METHYL-4-OXO-HEXAHYDRO-2H-FURO[3,2-C]PYRROLE-6-CARBALDEHYDE | 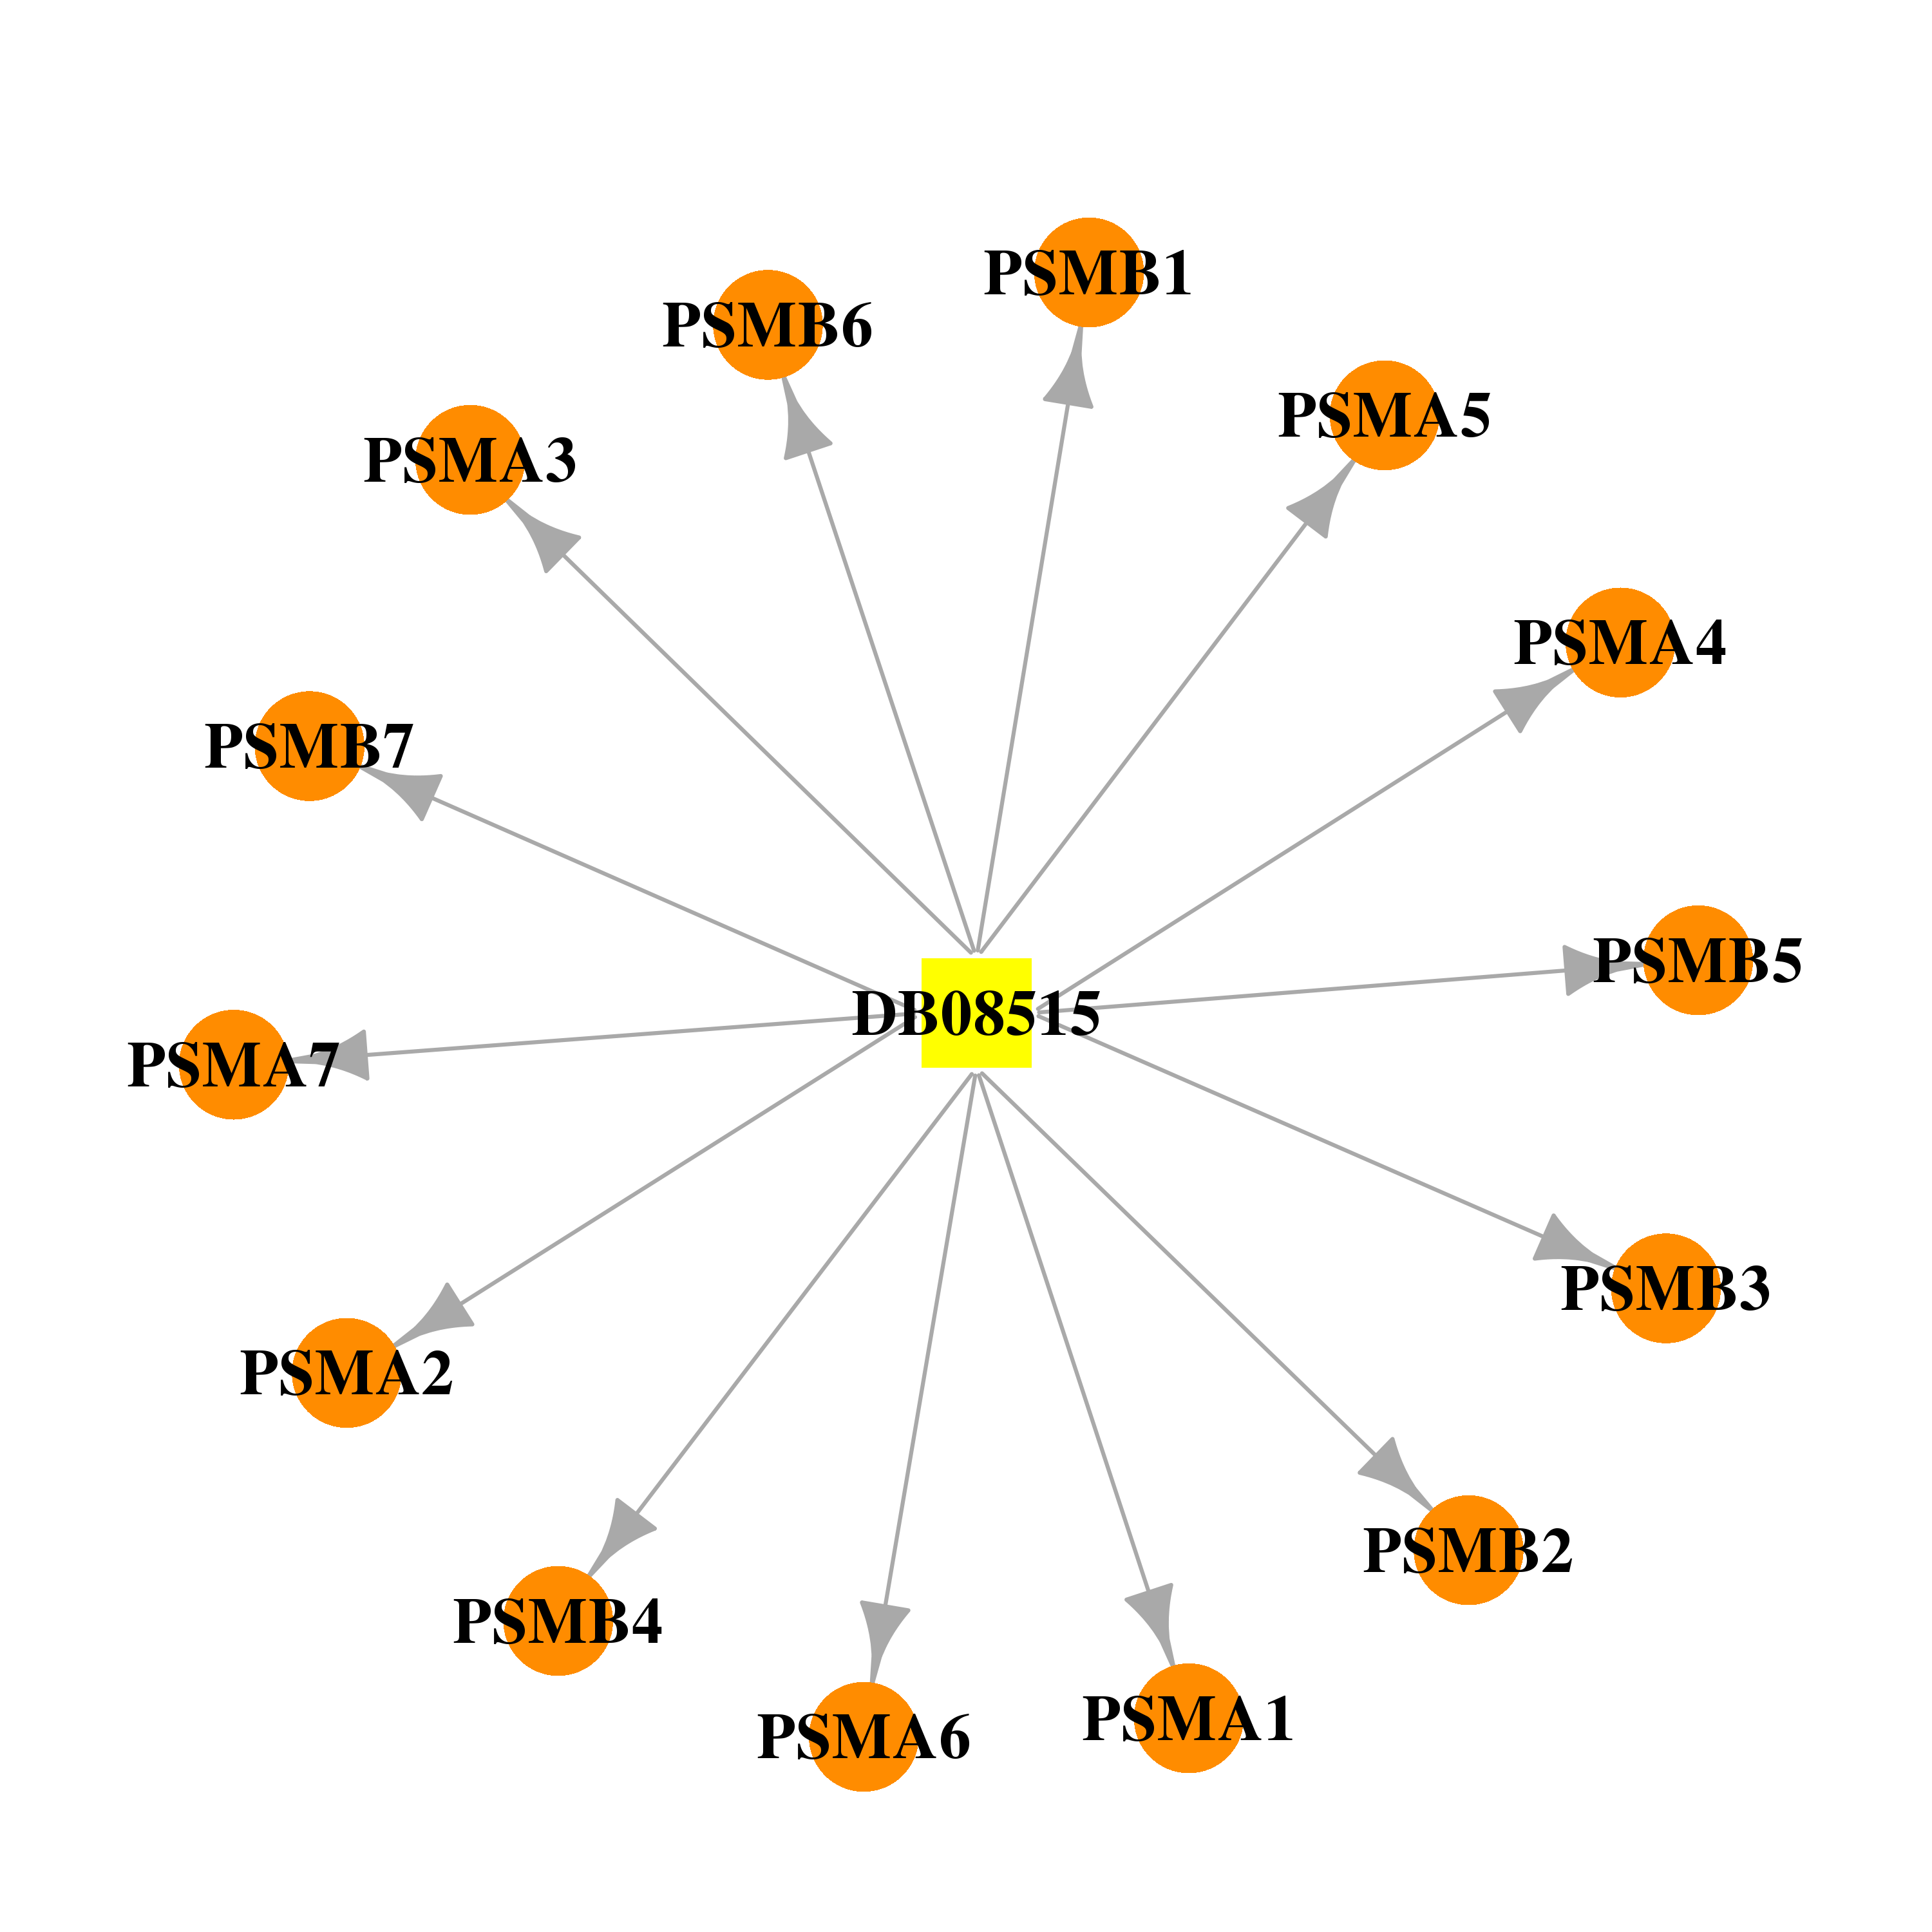 |  |
| DB00171 | proteasome (prosome, macropain) subunit, alpha type, 3 | approved; nutraceutical | Adenosine triphosphate |  |  |
| Top |
| Cross referenced IDs for PSMA3 |
| * We obtained these cross-references from Uniprot database. It covers 150 different DBs, 18 categories. http://www.uniprot.org/help/cross_references_section |
: Open all cross reference information
|
Copyright © 2016-Present - The Univsersity of Texas Health Science Center at Houston @ |