|
|||||||||||||||||||||||||||||||||||||||||||||||||||||||||||||||||||||||||||||||||||||||||||||||||||||||||||||||||||||||||||||||||||||||||||||||||||||||||||||||||||||||||||||||||||||||||||||||||||||||||||||||||||||||||||||||||||||||||||||||||||||||||||||||||||||||||||||||||||||||||||||||||||||||||||||||||||||||||||||||||||||||||||||||||||
| |
| Phenotypic Information (metabolism pathway, cancer, disease, phenome) |
| |
| |
| Gene-Gene Network Information: Co-Expression Network, Interacting Genes & KEGG |
| |
|


| Gene Summary for MCCC1 |
| Basic gene info. | Gene symbol | MCCC1 |
| Gene name | methylcrotonoyl-CoA carboxylase 1 (alpha) | |
| Synonyms | MCC-B|MCCA | |
| Cytomap | UCSC genome browser: 3q27 | |
| Genomic location | chr3 :182733005-182817365 | |
| Type of gene | protein-coding | |
| RefGenes | NM_001293273.1, NM_020166.4,NR_120639.1,NR_120640.1, | |
| Ensembl id | ENSG00000078070 | |
| Description | 3-methylcrotonyl-CoA carboxylase 13-methylcrotonyl-CoA carboxylase biotin-containing subunit3-methylcrotonyl-CoA:carbon dioxide ligase subunit alphaMCCase subunit alphamethylcrotonoyl-CoA carboxylase subunit alpha, mitochondrialmethylcrotonoyl-Coenzy | |
| Modification date | 20141211 | |
| dbXrefs | MIM : 609010 | |
| HGNC : HGNC | ||
| Ensembl : ENSG00000078070 | ||
| HPRD : 01951 | ||
| Vega : OTTHUMG00000158355 | ||
| Protein | UniProt: go to UniProt's Cross Reference DB Table | |
| Expression | CleanEX: HS_MCCC1 | |
| BioGPS: 56922 | ||
| Gene Expression Atlas: ENSG00000078070 | ||
| The Human Protein Atlas: ENSG00000078070 | ||
| Pathway | NCI Pathway Interaction Database: MCCC1 | |
| KEGG: MCCC1 | ||
| REACTOME: MCCC1 | ||
| ConsensusPathDB | ||
| Pathway Commons: MCCC1 | ||
| Metabolism | MetaCyc: MCCC1 | |
| HUMANCyc: MCCC1 | ||
| Regulation | Ensembl's Regulation: ENSG00000078070 | |
| miRBase: chr3 :182,733,005-182,817,365 | ||
| TargetScan: NM_001293273 | ||
| cisRED: ENSG00000078070 | ||
| Context | iHOP: MCCC1 | |
| cancer metabolism search in PubMed: MCCC1 | ||
| UCL Cancer Institute: MCCC1 | ||
| Assigned class in ccmGDB | C | |
| Top |
| Phenotypic Information for MCCC1(metabolism pathway, cancer, disease, phenome) |
| Cancer | CGAP: MCCC1 |
| Familial Cancer Database: MCCC1 | |
| * This gene is included in those cancer gene databases. |
|
|
|
|
|
|
| |||||||||||||||||||||||||||||||||||||||||||||||||||||||||||||||||||||||||||||||||||||||||||||||||||||||||||||||||||||||||||||||||||||||||||||||||||||||||||||||||||||||||||||||||||||||||||||||||||||||||||||||||||||||||||||||||||||||||||||||||||||||||||||||||||||||||||||||||||||||||||||||||||||||||||||||||||||||||||||||||||||||||||||
Oncogene 1 | Significant driver gene in | ||||||||||||||||||||||||||||||||||||||||||||||||||||||||||||||||||||||||||||||||||||||||||||||||||||||||||||||||||||||||||||||||||||||||||||||||||||||||||||||||||||||||||||||||||||||||||||||||||||||||||||||||||||||||||||||||||||||||||||||||||||||||||||||||||||||||||||||||||||||||||||||||||||||||||||||||||||||||||||||||||||||||||||||||||
| cf) number; DB name 1 Oncogene; http://nar.oxfordjournals.org/content/35/suppl_1/D721.long, 2 Tumor Suppressor gene; https://bioinfo.uth.edu/TSGene/, 3 Cancer Gene Census; http://www.nature.com/nrc/journal/v4/n3/abs/nrc1299.html, 4 CancerGenes; http://nar.oxfordjournals.org/content/35/suppl_1/D721.long, 5 Network of Cancer Gene; http://ncg.kcl.ac.uk/index.php, 1Therapeutic Vulnerabilities in Cancer; http://cbio.mskcc.org/cancergenomics/statius/ |
| REACTOME_METABOLISM_OF_AMINO_ACIDS_AND_DERIVATIVES | |
| OMIM | |
| Orphanet | |
| Disease | KEGG Disease: MCCC1 |
| MedGen: MCCC1 (Human Medical Genetics with Condition) | |
| ClinVar: MCCC1 | |
| Phenotype | MGI: MCCC1 (International Mouse Phenotyping Consortium) |
| PhenomicDB: MCCC1 | |
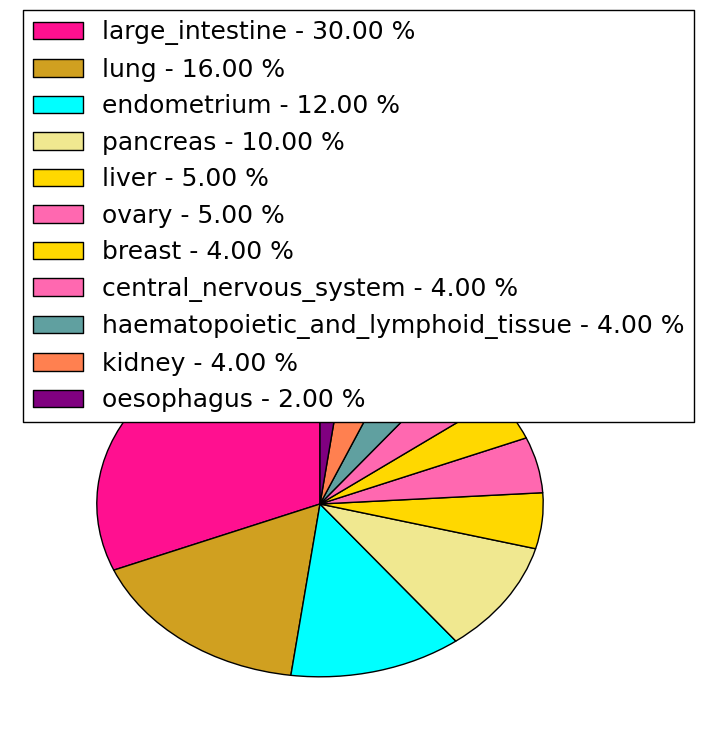
| Mutations for MCCC1 |
| * Under tables are showing count per each tissue to give us broad intuition about tissue specific mutation patterns.You can go to the detailed page for each mutation database's web site. |
| - Statistics for Tissue and Mutation type | Top |
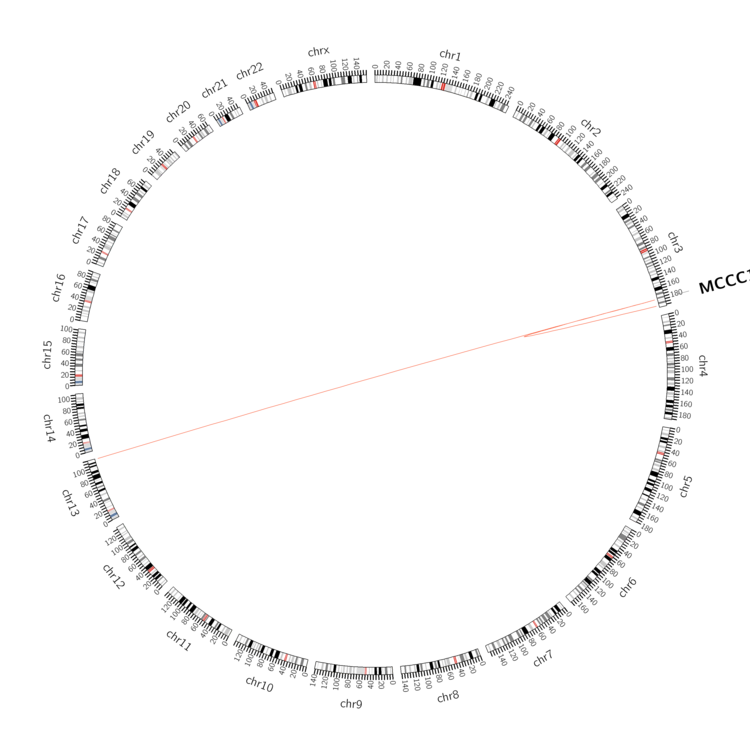 |
| - For Inter-chromosomal Variations |
| * Inter-chromosomal variantions includes 'interchromosomal amplicon to amplicon', 'interchromosomal amplicon to non-amplified dna', 'interchromosomal insertion', 'Interchromosomal unknown type'. |
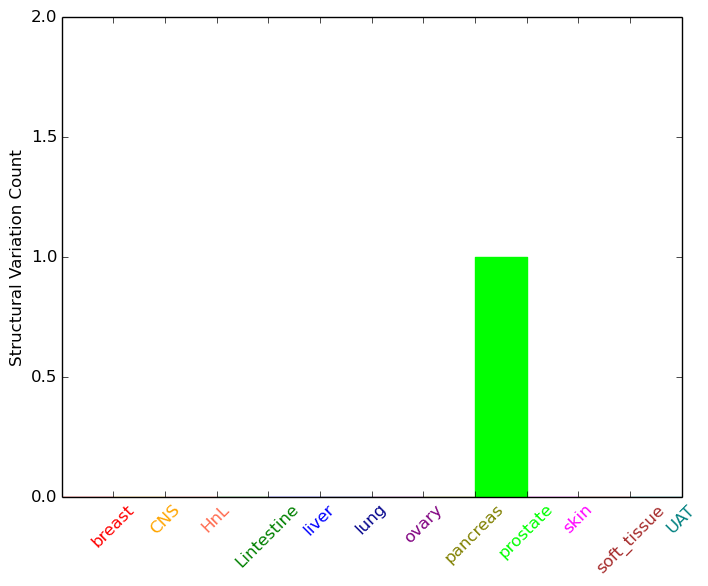 |
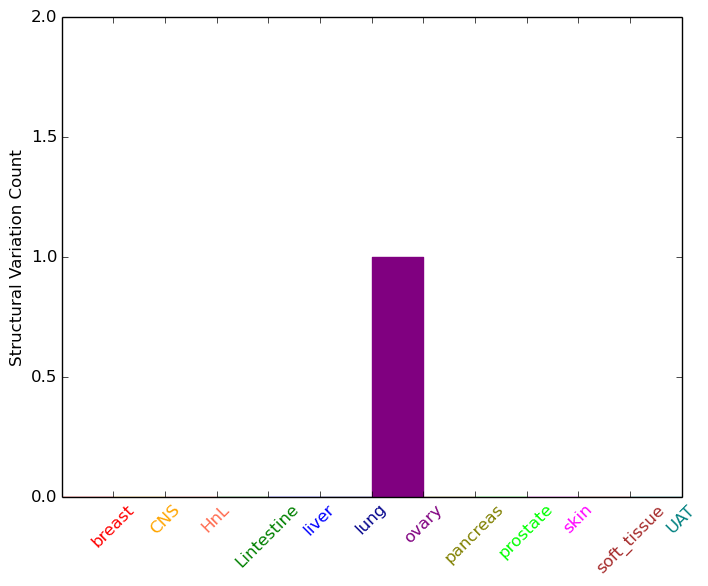
| - For Intra-chromosomal Variations |
| * Intra-chromosomal variantions includes 'intrachromosomal amplicon to amplicon', 'intrachromosomal amplicon to non-amplified dna', 'intrachromosomal deletion', 'intrachromosomal fold-back inversion', 'intrachromosomal inversion', 'intrachromosomal tandem duplication', 'Intrachromosomal unknown type', 'intrachromosomal with inverted orientation', 'intrachromosomal with non-inverted orientation'. |
 |
| Sample | Symbol_a | Chr_a | Start_a | End_a | Symbol_b | Chr_b | Start_b | End_b |
| ovary | MCCC1 | chr3 | 182781687 | 182781707 | chr3 | 194703983 | 194704003 | |
| prostate | MCCC1 | chr3 | 182780219 | 182782219 | chr13 | 114214556 | 114216556 |
| cf) Tissue number; Tissue name (1;Breast, 2;Central_nervous_system, 3;Haematopoietic_and_lymphoid_tissue, 4;Large_intestine, 5;Liver, 6;Lung, 7;Ovary, 8;Pancreas, 9;Prostate, 10;Skin, 11;Soft_tissue, 12;Upper_aerodigestive_tract) |
| * From mRNA Sanger sequences, Chitars2.0 arranged chimeric transcripts. This table shows MCCC1 related fusion information. |
| ID | Head Gene | Tail Gene | Accession | Gene_a | qStart_a | qEnd_a | Chromosome_a | tStart_a | tEnd_a | Gene_a | qStart_a | qEnd_a | Chromosome_a | tStart_a | tEnd_a |
| AW379082 | CAMSAP2 | 1 | 149 | 1 | 200730147 | 200776570 | MCCC1 | 139 | 208 | 3 | 182733257 | 182733326 | |
| AA505323 | MCCC1 | 1 | 365 | 3 | 182747496 | 182747860 | PTPN14 | 362 | 446 | 1 | 214598488 | 214598572 | |
| Top |
| Mutation type/ Tissue ID | brca | cns | cerv | endome | haematopo | kidn | Lintest | liver | lung | ns | ovary | pancre | prost | skin | stoma | thyro | urina | |||
| Total # sample | 1 | 1 | 3 | 1 | ||||||||||||||||
| GAIN (# sample) | 1 | 1 | 3 | 1 | ||||||||||||||||
| LOSS (# sample) |
| cf) Tissue ID; Tissue type (1; Breast, 2; Central_nervous_system, 3; Cervix, 4; Endometrium, 5; Haematopoietic_and_lymphoid_tissue, 6; Kidney, 7; Large_intestine, 8; Liver, 9; Lung, 10; NS, 11; Ovary, 12; Pancreas, 13; Prostate, 14; Skin, 15; Stomach, 16; Thyroid, 17; Urinary_tract) |
| Top |
|
 |
| Top |
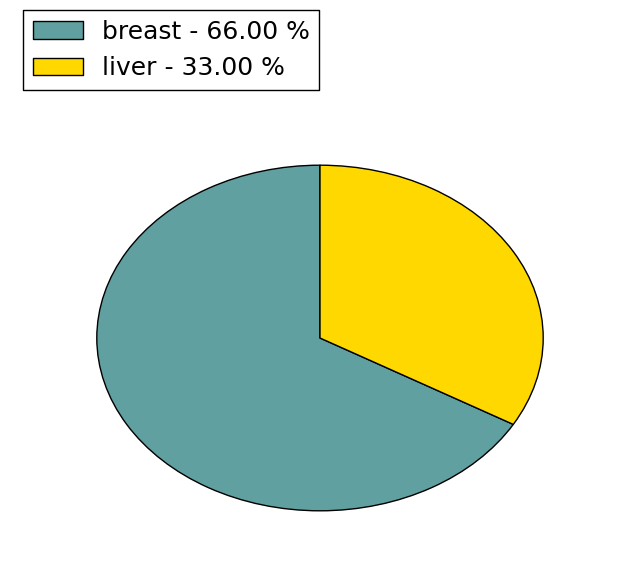
| Stat. for Non-Synonymous SNVs (# total SNVs=73) | (# total SNVs=15) |
 | 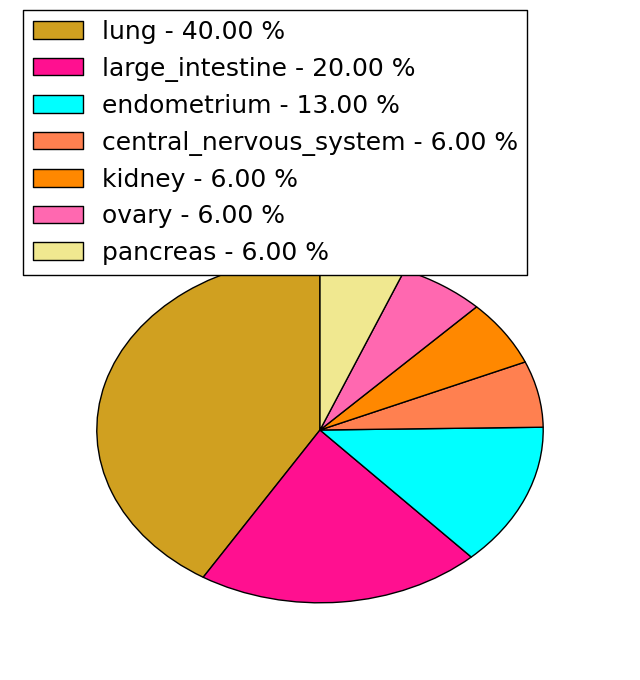 |
(# total SNVs=0) | (# total SNVs=3) |
 |
| Top |
| * When you move the cursor on each content, you can see more deailed mutation information on the Tooltip. Those are primary_site,primary_histology,mutation(aa),pubmedID. |
| GRCh37 position | Mutation(aa) | Unique sampleID count |
| chr3:182756825-182756825 | p.R456C | 4 |
| chr3:182733336-182733336 | p.K690E | 4 |
| chr3:182775159-182775159 | p.L271F | 4 |
| chr3:182740299-182740299 | p.E592G | 4 |
| chr3:182738007-182738007 | p.D630Y | 2 |
| chr3:182756857-182756857 | p.Q445R | 2 |
| chr3:182789054-182789054 | p.A195T | 2 |
| chr3:182740231-182740232 | p.E615K | 2 |
| chr3:182756918-182756918 | p.E425K | 2 |
| chr3:182789077-182789077 | p.S187L | 2 |
| Top |
|
 |
| Point Mutation/ Tissue ID | 1 | 2 | 3 | 4 | 5 | 6 | 7 | 8 | 9 | 10 | 11 | 12 | 13 | 14 | 15 | 16 | 17 | 18 | 19 | 20 |
| # sample | 5 | 2 | 16 | 1 | 2 | 3 | 1 | 10 | 8 | 1 | 5 | 6 | 9 | |||||||
| # mutation | 7 | 2 | 13 | 1 | 2 | 3 | 1 | 10 | 9 | 1 | 6 | 6 | 11 | |||||||
| nonsynonymous SNV | 5 | 2 | 11 | 1 | 1 | 2 | 1 | 6 | 8 | 5 | 5 | 9 | ||||||||
| synonymous SNV | 2 | 2 | 1 | 1 | 4 | 1 | 1 | 1 | 1 | 2 |
| cf) Tissue ID; Tissue type (1; BLCA[Bladder Urothelial Carcinoma], 2; BRCA[Breast invasive carcinoma], 3; CESC[Cervical squamous cell carcinoma and endocervical adenocarcinoma], 4; COAD[Colon adenocarcinoma], 5; GBM[Glioblastoma multiforme], 6; Glioma Low Grade, 7; HNSC[Head and Neck squamous cell carcinoma], 8; KICH[Kidney Chromophobe], 9; KIRC[Kidney renal clear cell carcinoma], 10; KIRP[Kidney renal papillary cell carcinoma], 11; LAML[Acute Myeloid Leukemia], 12; LUAD[Lung adenocarcinoma], 13; LUSC[Lung squamous cell carcinoma], 14; OV[Ovarian serous cystadenocarcinoma ], 15; PAAD[Pancreatic adenocarcinoma], 16; PRAD[Prostate adenocarcinoma], 17; SKCM[Skin Cutaneous Melanoma], 18:STAD[Stomach adenocarcinoma], 19:THCA[Thyroid carcinoma], 20:UCEC[Uterine Corpus Endometrial Carcinoma]) |
| Top |
| * We represented just top 10 SNVs. When you move the cursor on each content, you can see more deailed mutation information on the Tooltip. Those are primary_site, primary_histology, mutation(aa), pubmedID. |
| Genomic Position | Mutation(aa) | Unique sampleID count |
| chr3:182740299 | p.E475G,MCCC1 | 4 |
| chr3:182759359 | p.R66H | 2 |
| chr3:182810273 | p.R304R,MCCC1 | 2 |
| chr3:182751858 | p.M459I,MCCC1 | 1 |
| chr3:182789018 | p.R292Q,MCCC1 | 1 |
| chr3:182756919 | p.R137S,MCCC1 | 1 |
| chr3:182790247 | p.M17I,MCCC1 | 1 |
| chr3:182733285 | p.T568T,MCCC1 | 1 |
| chr3:182738013 | p.Y457Y,MCCC1 | 1 |
| chr3:182763328 | p.P284P,MCCC1 | 1 |
| * Copy number data were extracted from TCGA using R package TCGA-Assembler. The URLs of all public data files on TCGA DCC data server were gathered on Jan-05-2015. Function ProcessCNAData in TCGA-Assembler package was used to obtain gene-level copy number value which is calculated as the average copy number of the genomic region of a gene. |
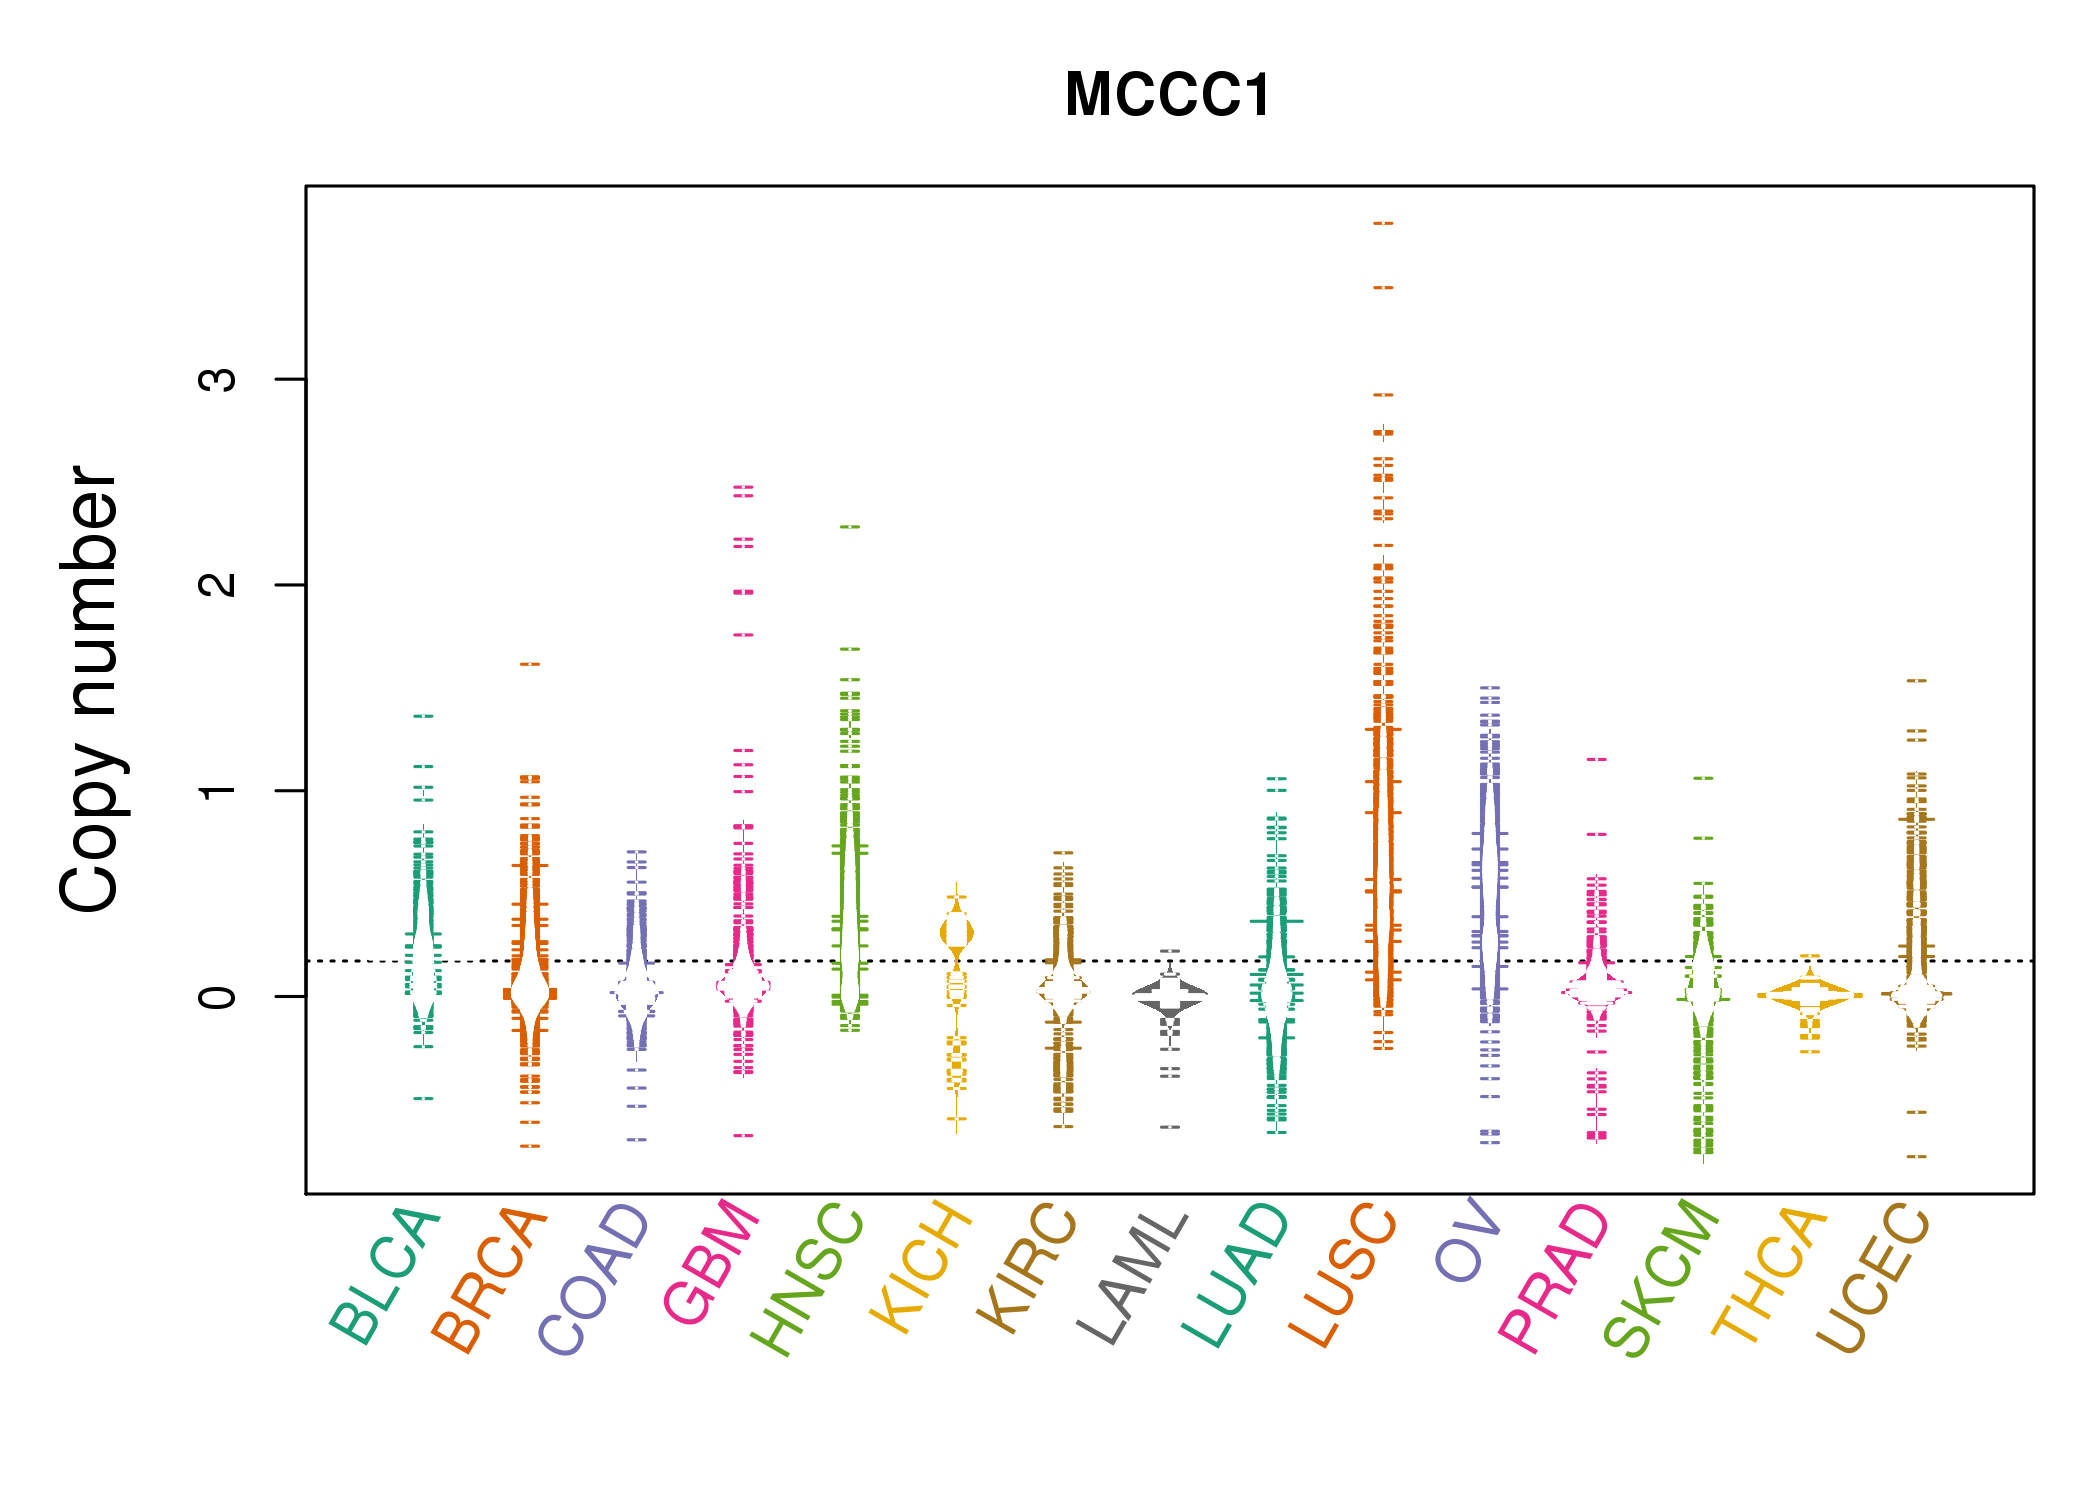 |
| cf) Tissue ID[Tissue type]: BLCA[Bladder Urothelial Carcinoma], BRCA[Breast invasive carcinoma], CESC[Cervical squamous cell carcinoma and endocervical adenocarcinoma], COAD[Colon adenocarcinoma], GBM[Glioblastoma multiforme], Glioma Low Grade, HNSC[Head and Neck squamous cell carcinoma], KICH[Kidney Chromophobe], KIRC[Kidney renal clear cell carcinoma], KIRP[Kidney renal papillary cell carcinoma], LAML[Acute Myeloid Leukemia], LUAD[Lung adenocarcinoma], LUSC[Lung squamous cell carcinoma], OV[Ovarian serous cystadenocarcinoma ], PAAD[Pancreatic adenocarcinoma], PRAD[Prostate adenocarcinoma], SKCM[Skin Cutaneous Melanoma], STAD[Stomach adenocarcinoma], THCA[Thyroid carcinoma], UCEC[Uterine Corpus Endometrial Carcinoma] |
| Top |
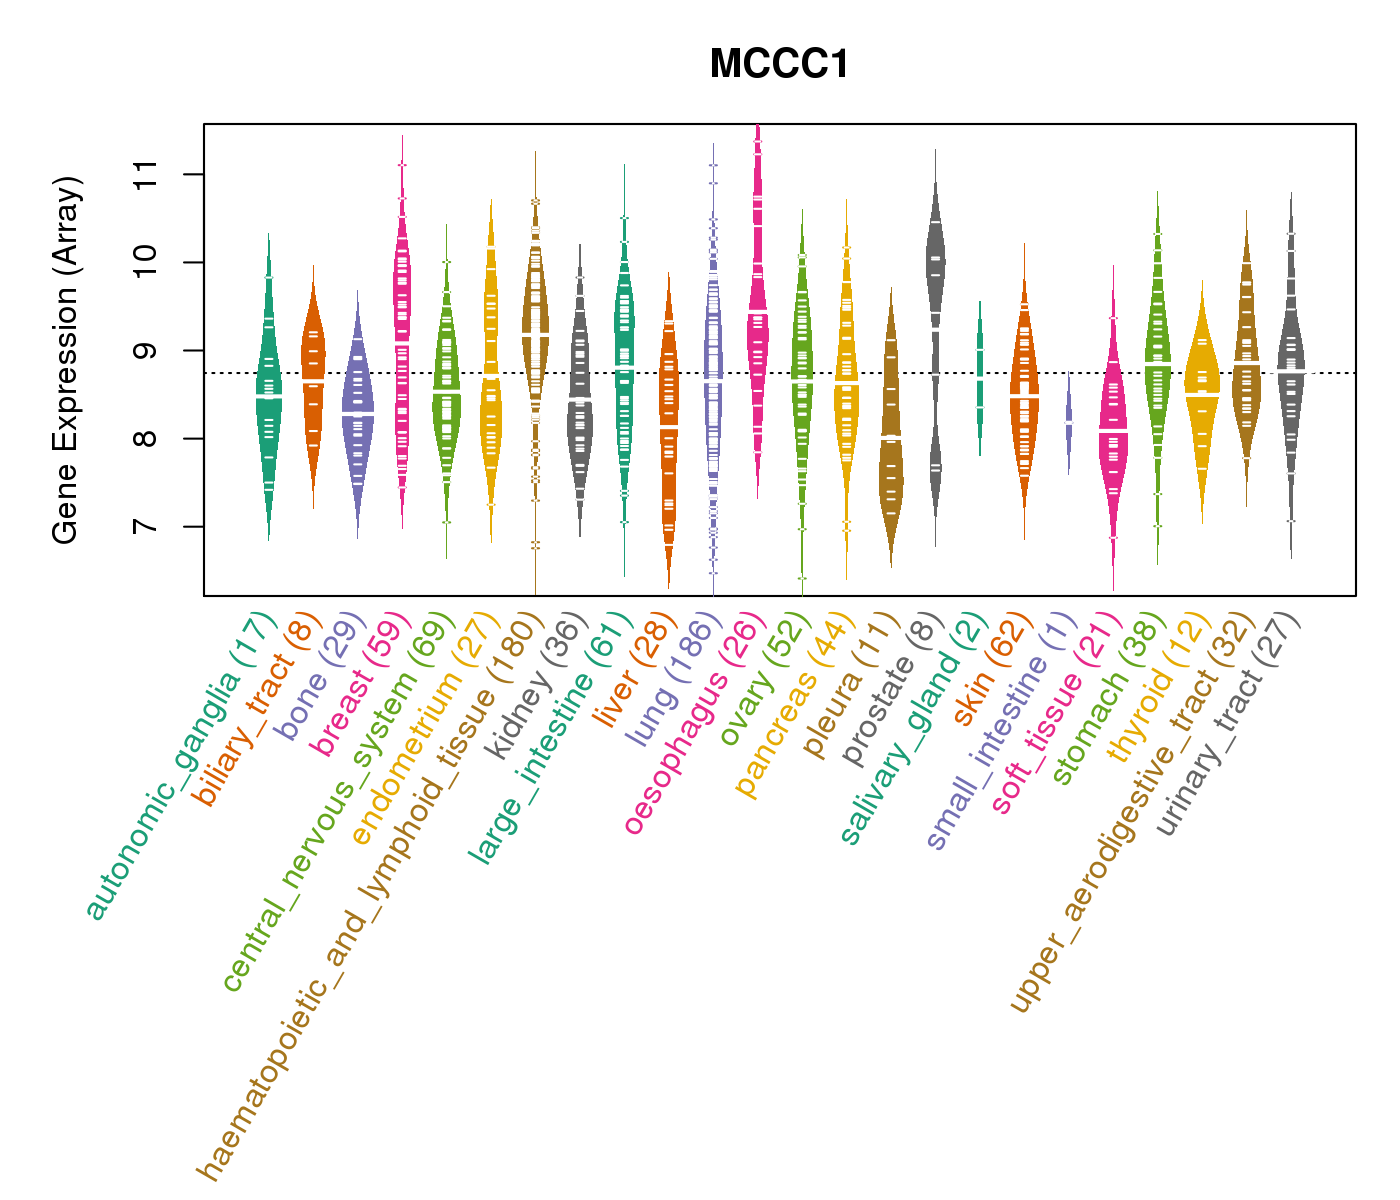
| Gene Expression for MCCC1 |
| * CCLE gene expression data were extracted from CCLE_Expression_Entrez_2012-10-18.res: Gene-centric RMA-normalized mRNA expression data. |
 |
| * Normalized gene expression data of RNASeqV2 was extracted from TCGA using R package TCGA-Assembler. The URLs of all public data files on TCGA DCC data server were gathered at Jan-05-2015. Only eight cancer types have enough normal control samples for differential expression analysis. (t test, adjusted p<0.05 (using Benjamini-Hochberg FDR)) |
 |
| Top |
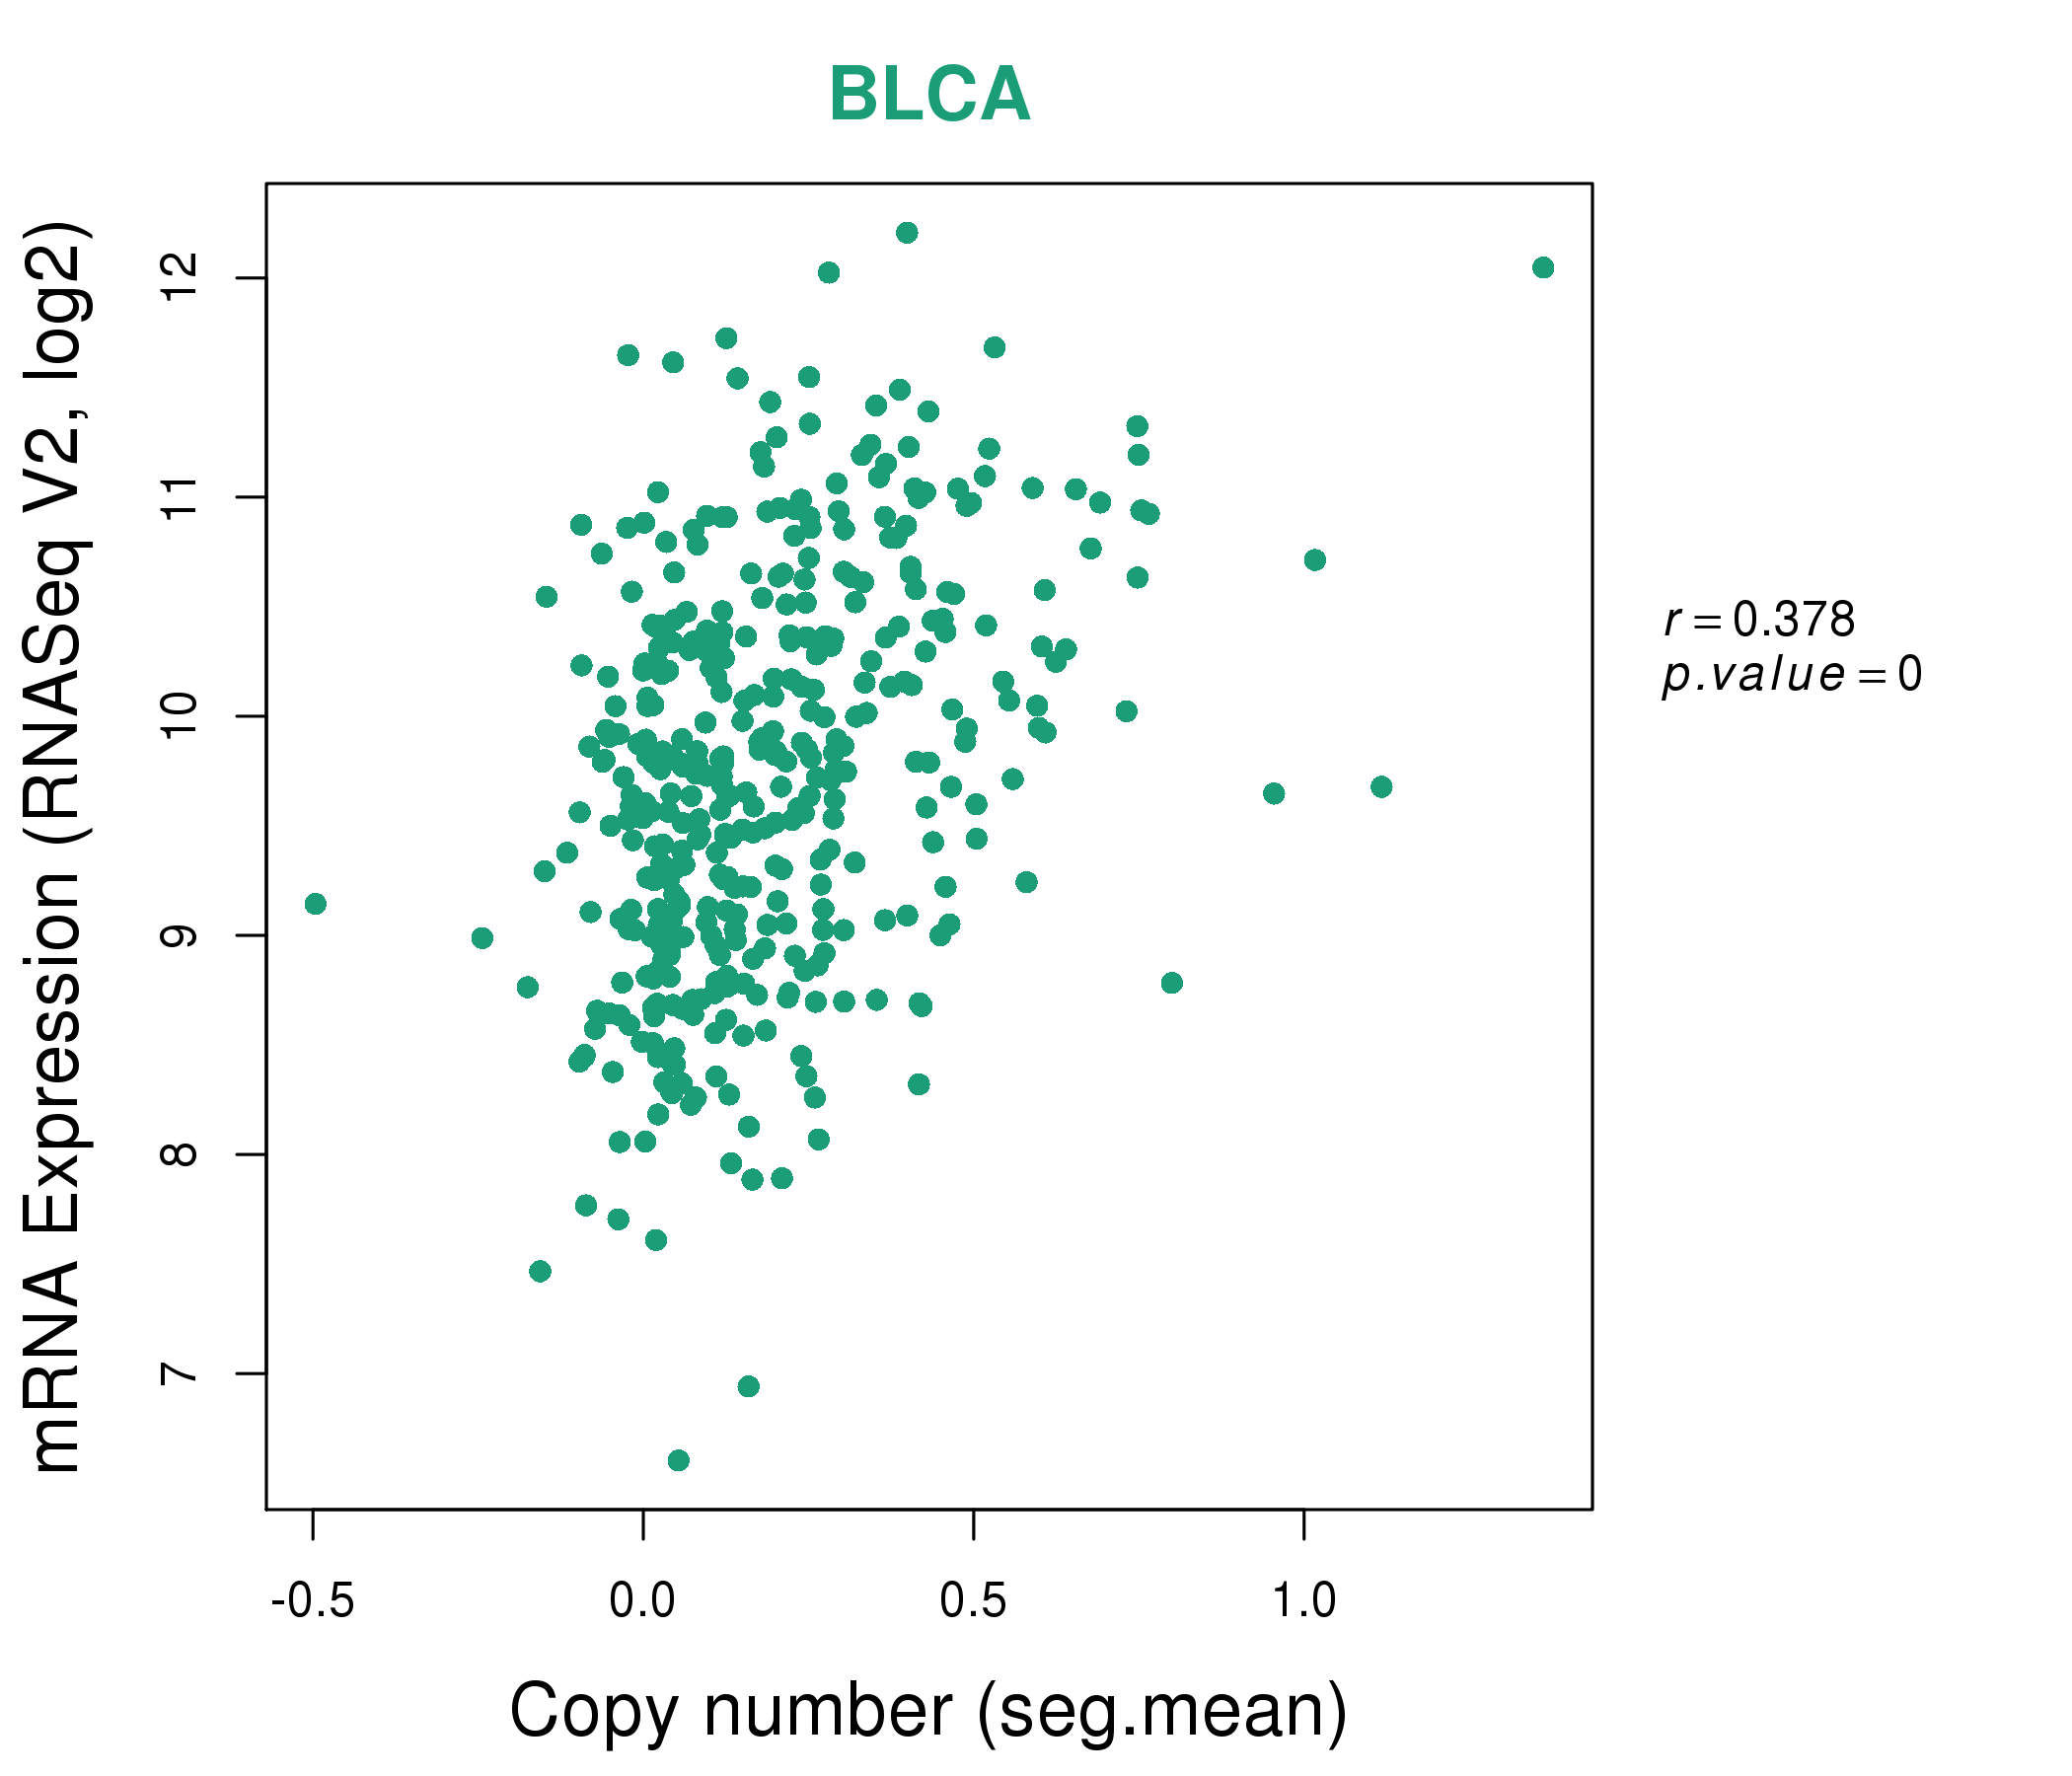
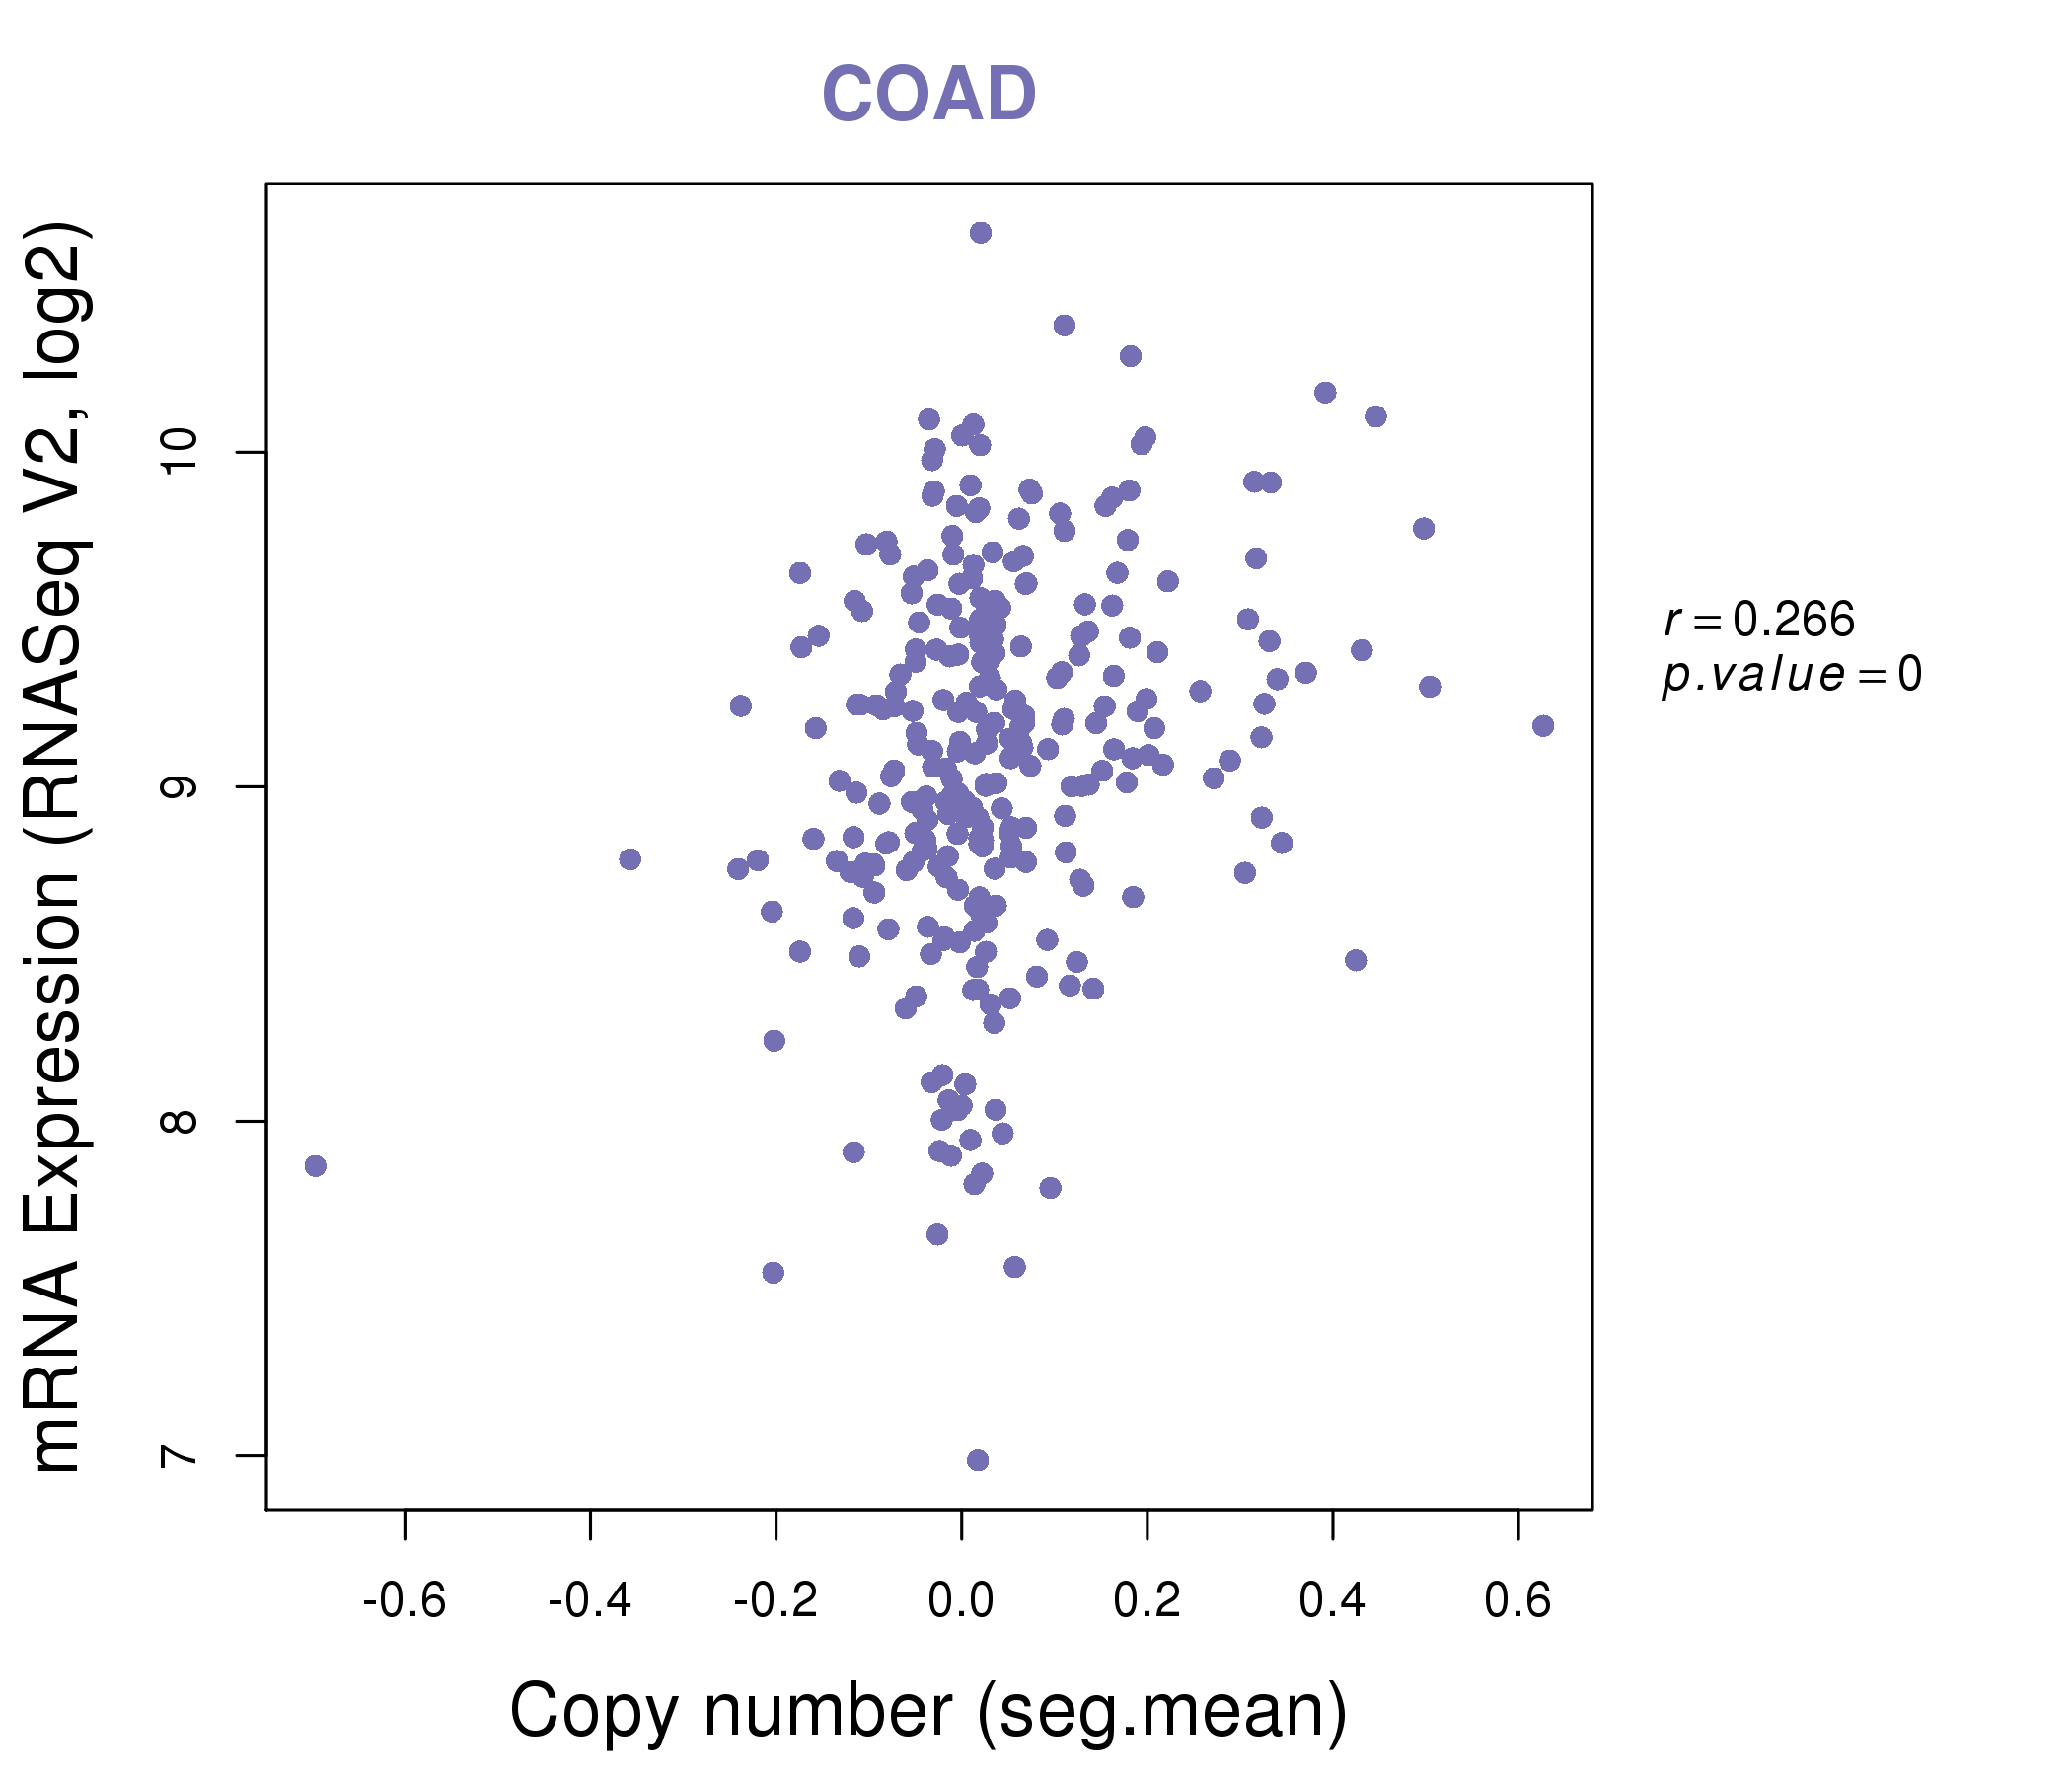
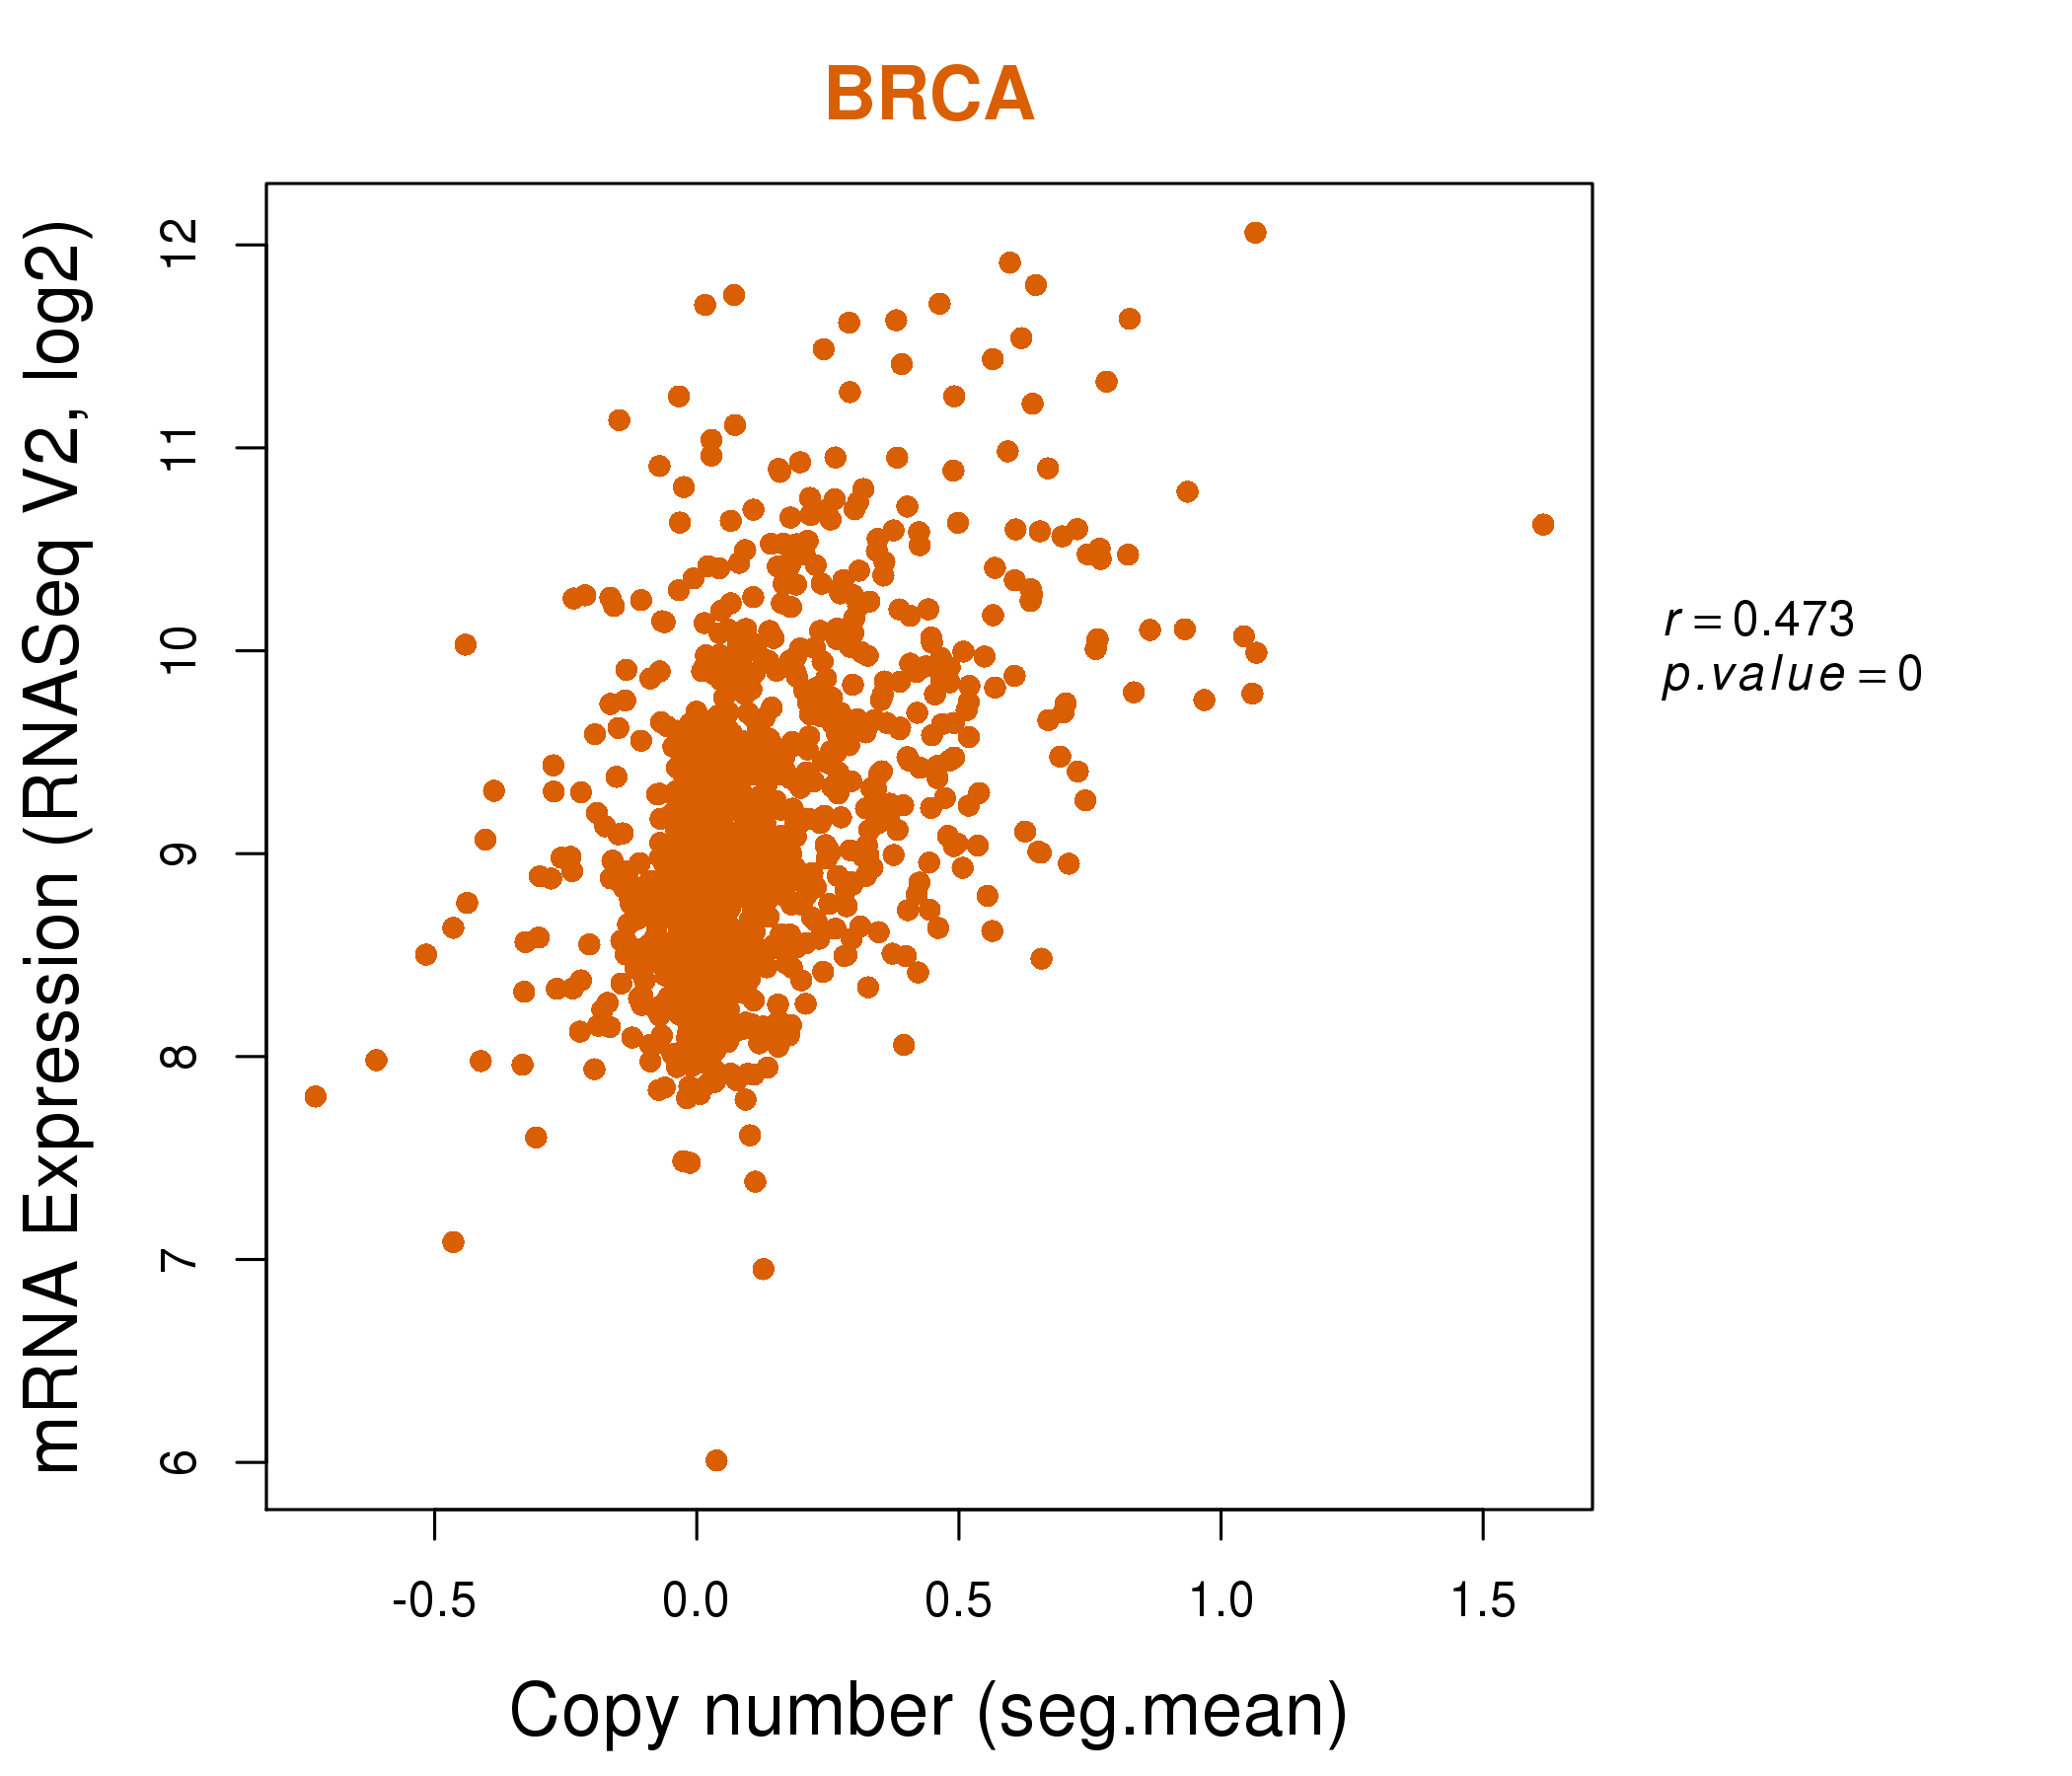
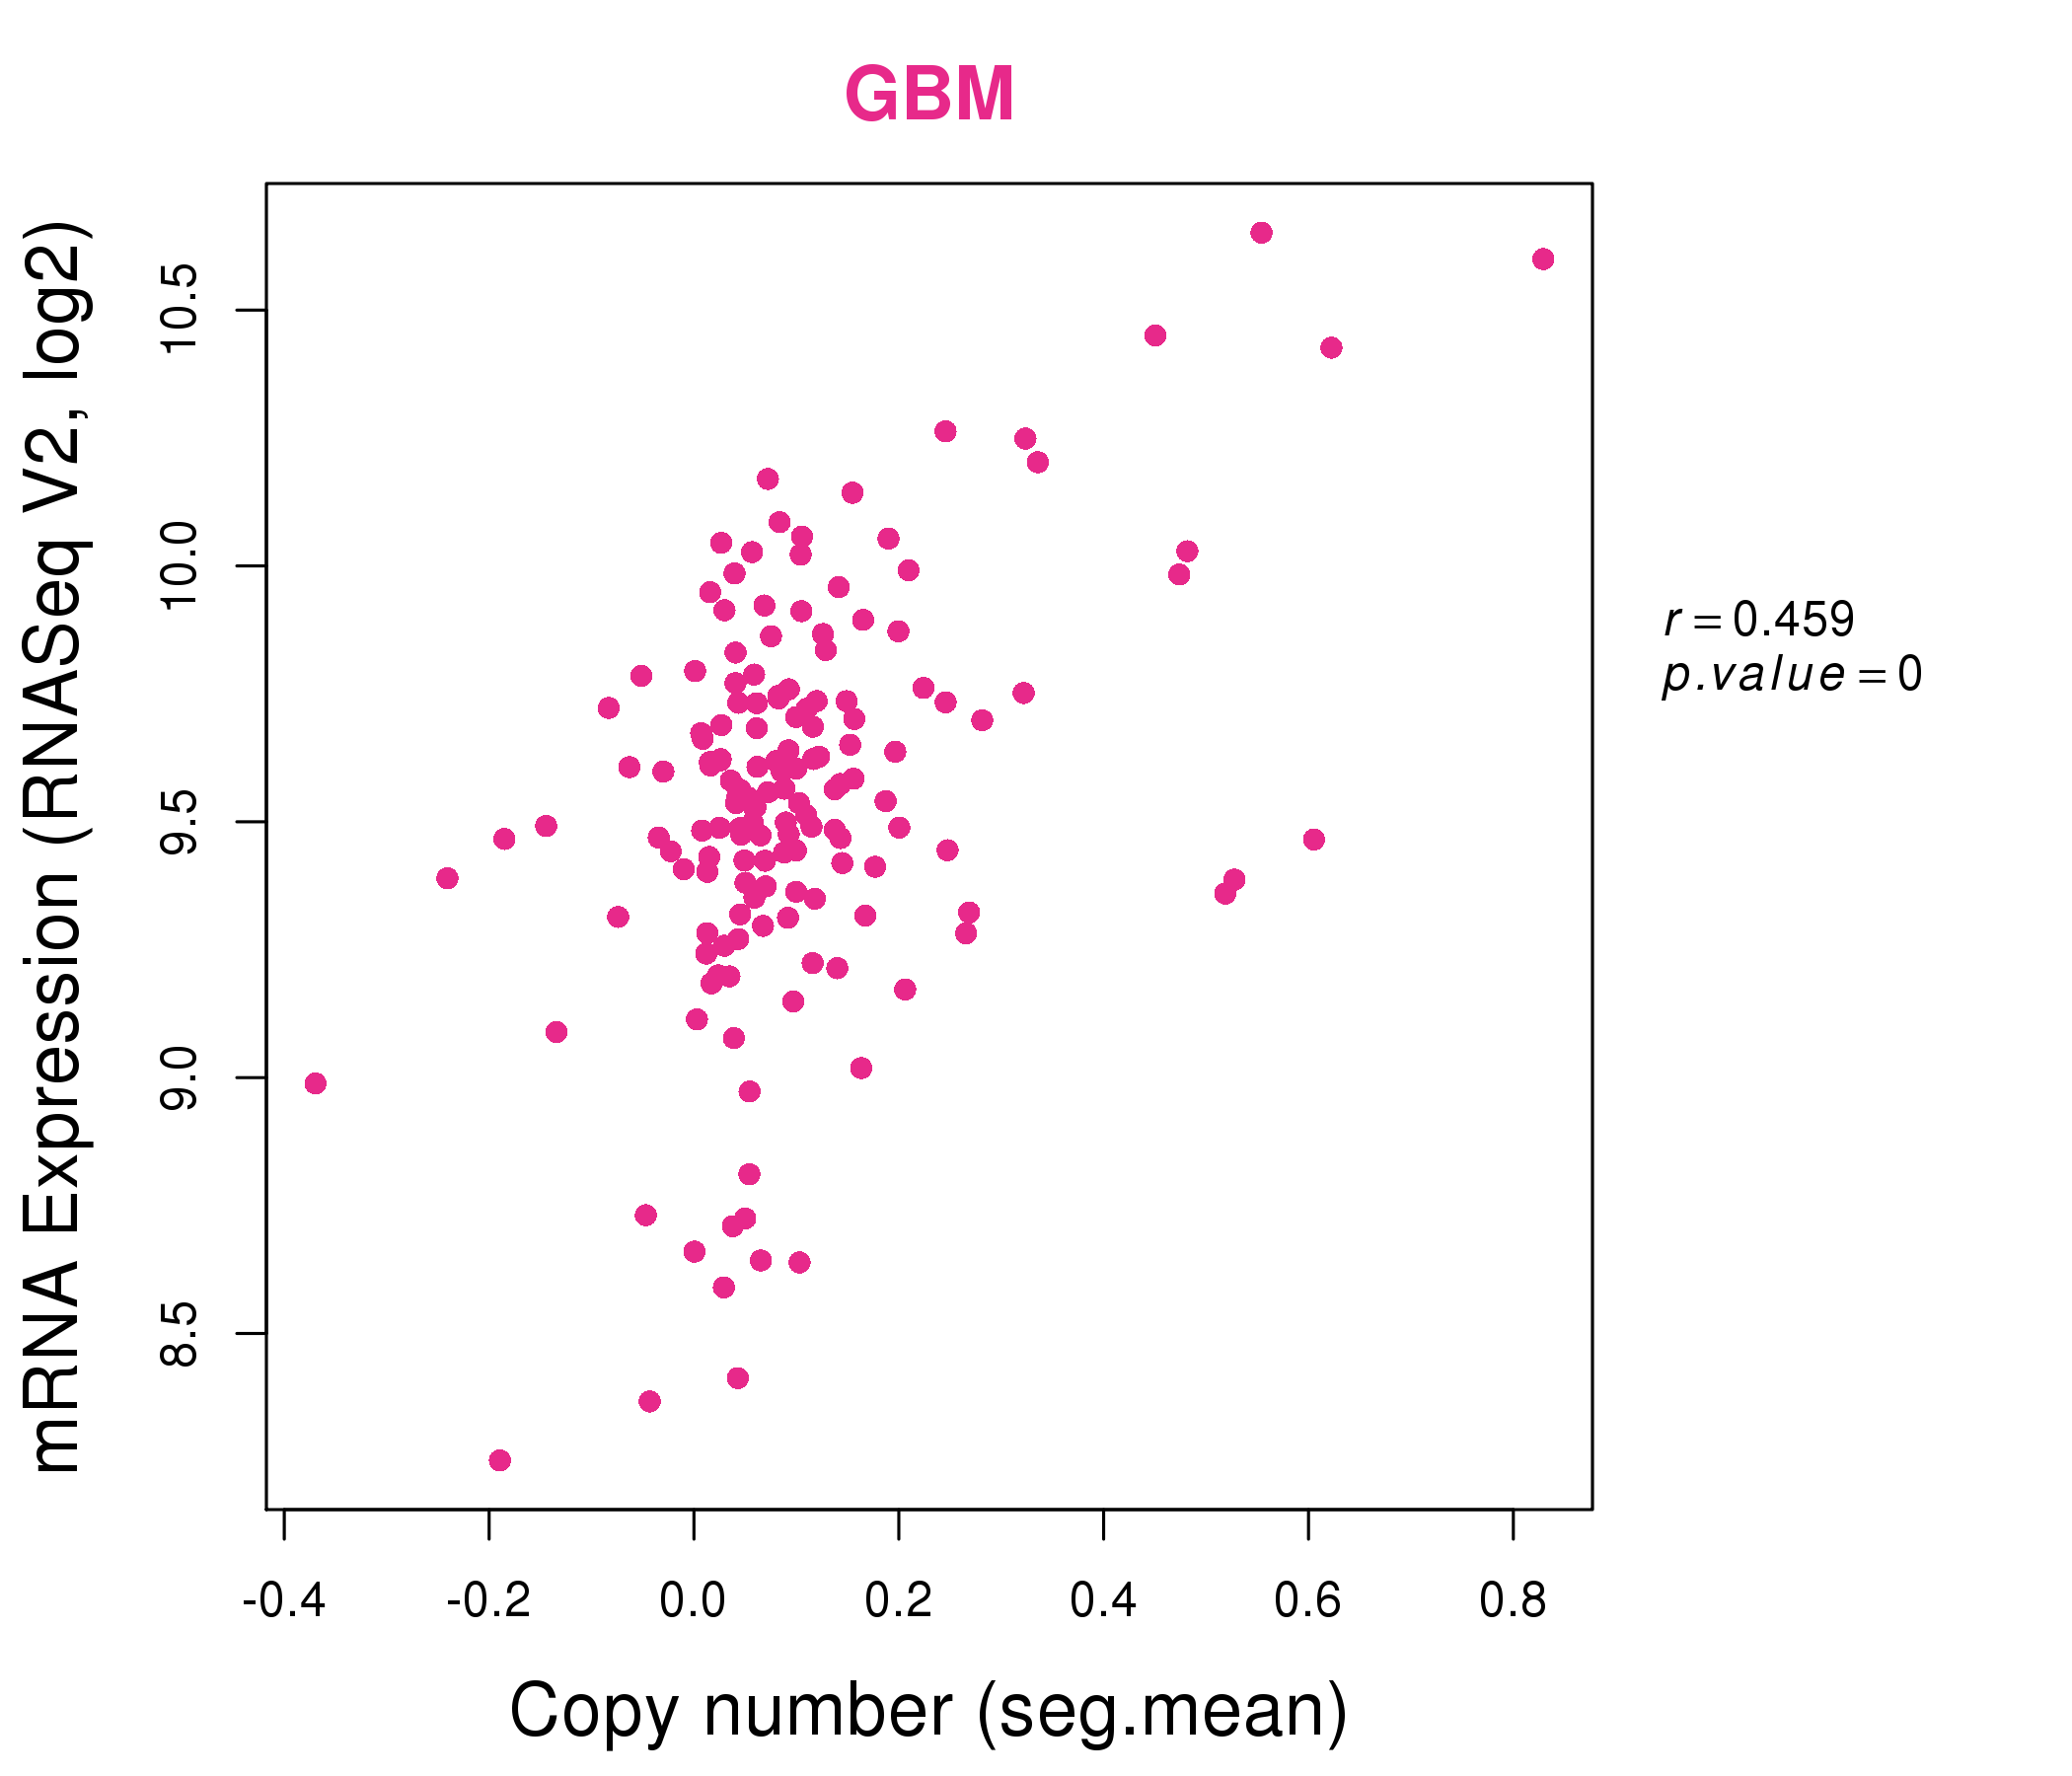
| * This plots show the correlation between CNV and gene expression. |
: Open all plots for all cancer types
 |
|
 |
|
| Top |
| Gene-Gene Network Information |
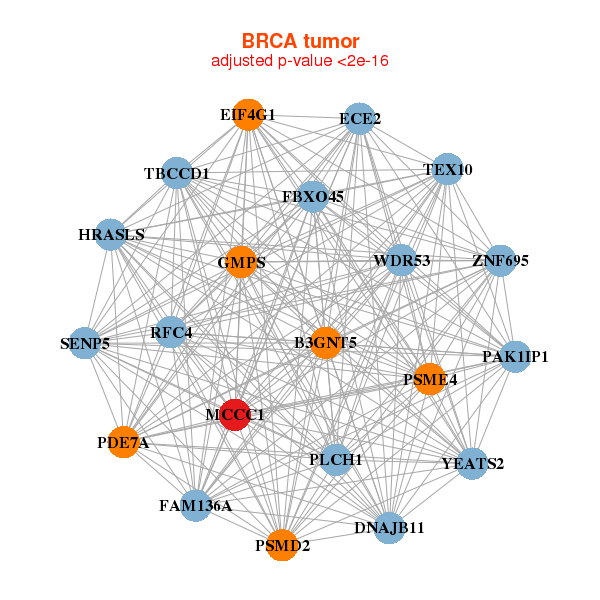
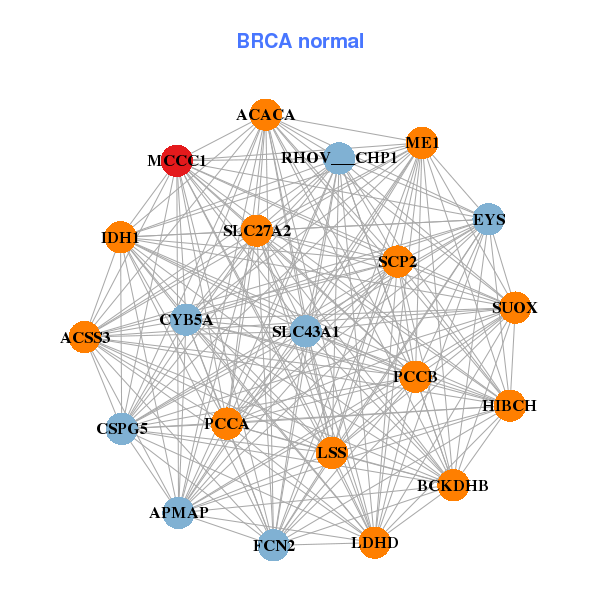
| * Co-Expression network figures were drawn using R package igraph. Only the top 20 genes with the highest correlations were shown. Red circle: input gene, orange circle: cell metabolism gene, sky circle: other gene |
: Open all plots for all cancer types
 |
| ||||
| B3GNT5,DNAJB11,ECE2,EIF4G1,FAM136A,FBXO45,GMPS, HRASLS,MCCC1,PAK1IP1,PDE7A,PLCH1,PSMD2,PSME4, RFC4,SENP5,TBCCD1,TEX10,WDR53,YEATS2,ZNF695 | ACACA,ACSS3,BCKDHB,APMAP,RHOV___CHP1,CSPG5,CYB5A, EYS,FCN2,HIBCH,IDH1,LDHD,LSS,MCCC1, ME1,PCCA,PCCB,SCP2,SLC27A2,SLC43A1,SUOX | ||||
 |
| ||||
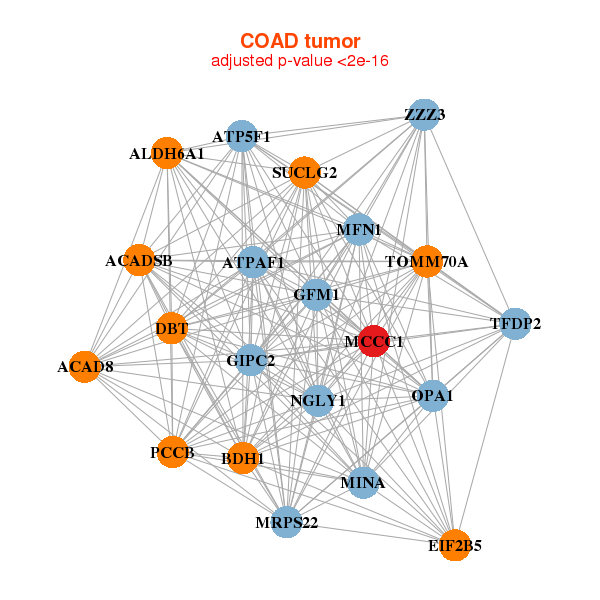
| ACAD8,ACADSB,ALDH6A1,ATP5F1,ATPAF1,BDH1,DBT, EIF2B5,GFM1,GIPC2,MCCC1,MFN1,MINA,MRPS22, NGLY1,OPA1,PCCB,SUCLG2,TFDP2,TOMM70A,ZZZ3 | ADAMDEC1,C21orf33,CDCA7,DCAF12,FERMT1,FOXA1,KREMEN1, LRPPRC,MCCC1,MLYCD,MTIF2,NGLY1,NUDT16P1,NUDT6, QARS,RPIA,STARD7,SUCLG2,THNSL1,UNG,ZCCHC8 |
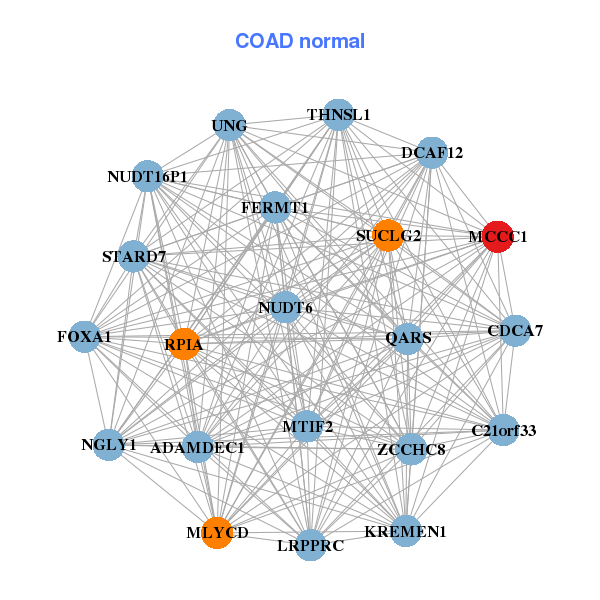
| * Co-Expression network figures were drawn using R package igraph. Only the top 20 genes with the highest correlations were shown. Red circle: input gene, orange circle: cell metabolism gene, sky circle: other gene |
: Open all plots for all cancer types
| Top |
: Open all interacting genes' information including KEGG pathway for all interacting genes from DAVID
| Top |
| Pharmacological Information for MCCC1 |
| DB Category | DB Name | DB's ID and Url link |
| * Gene Centered Interaction Network. |
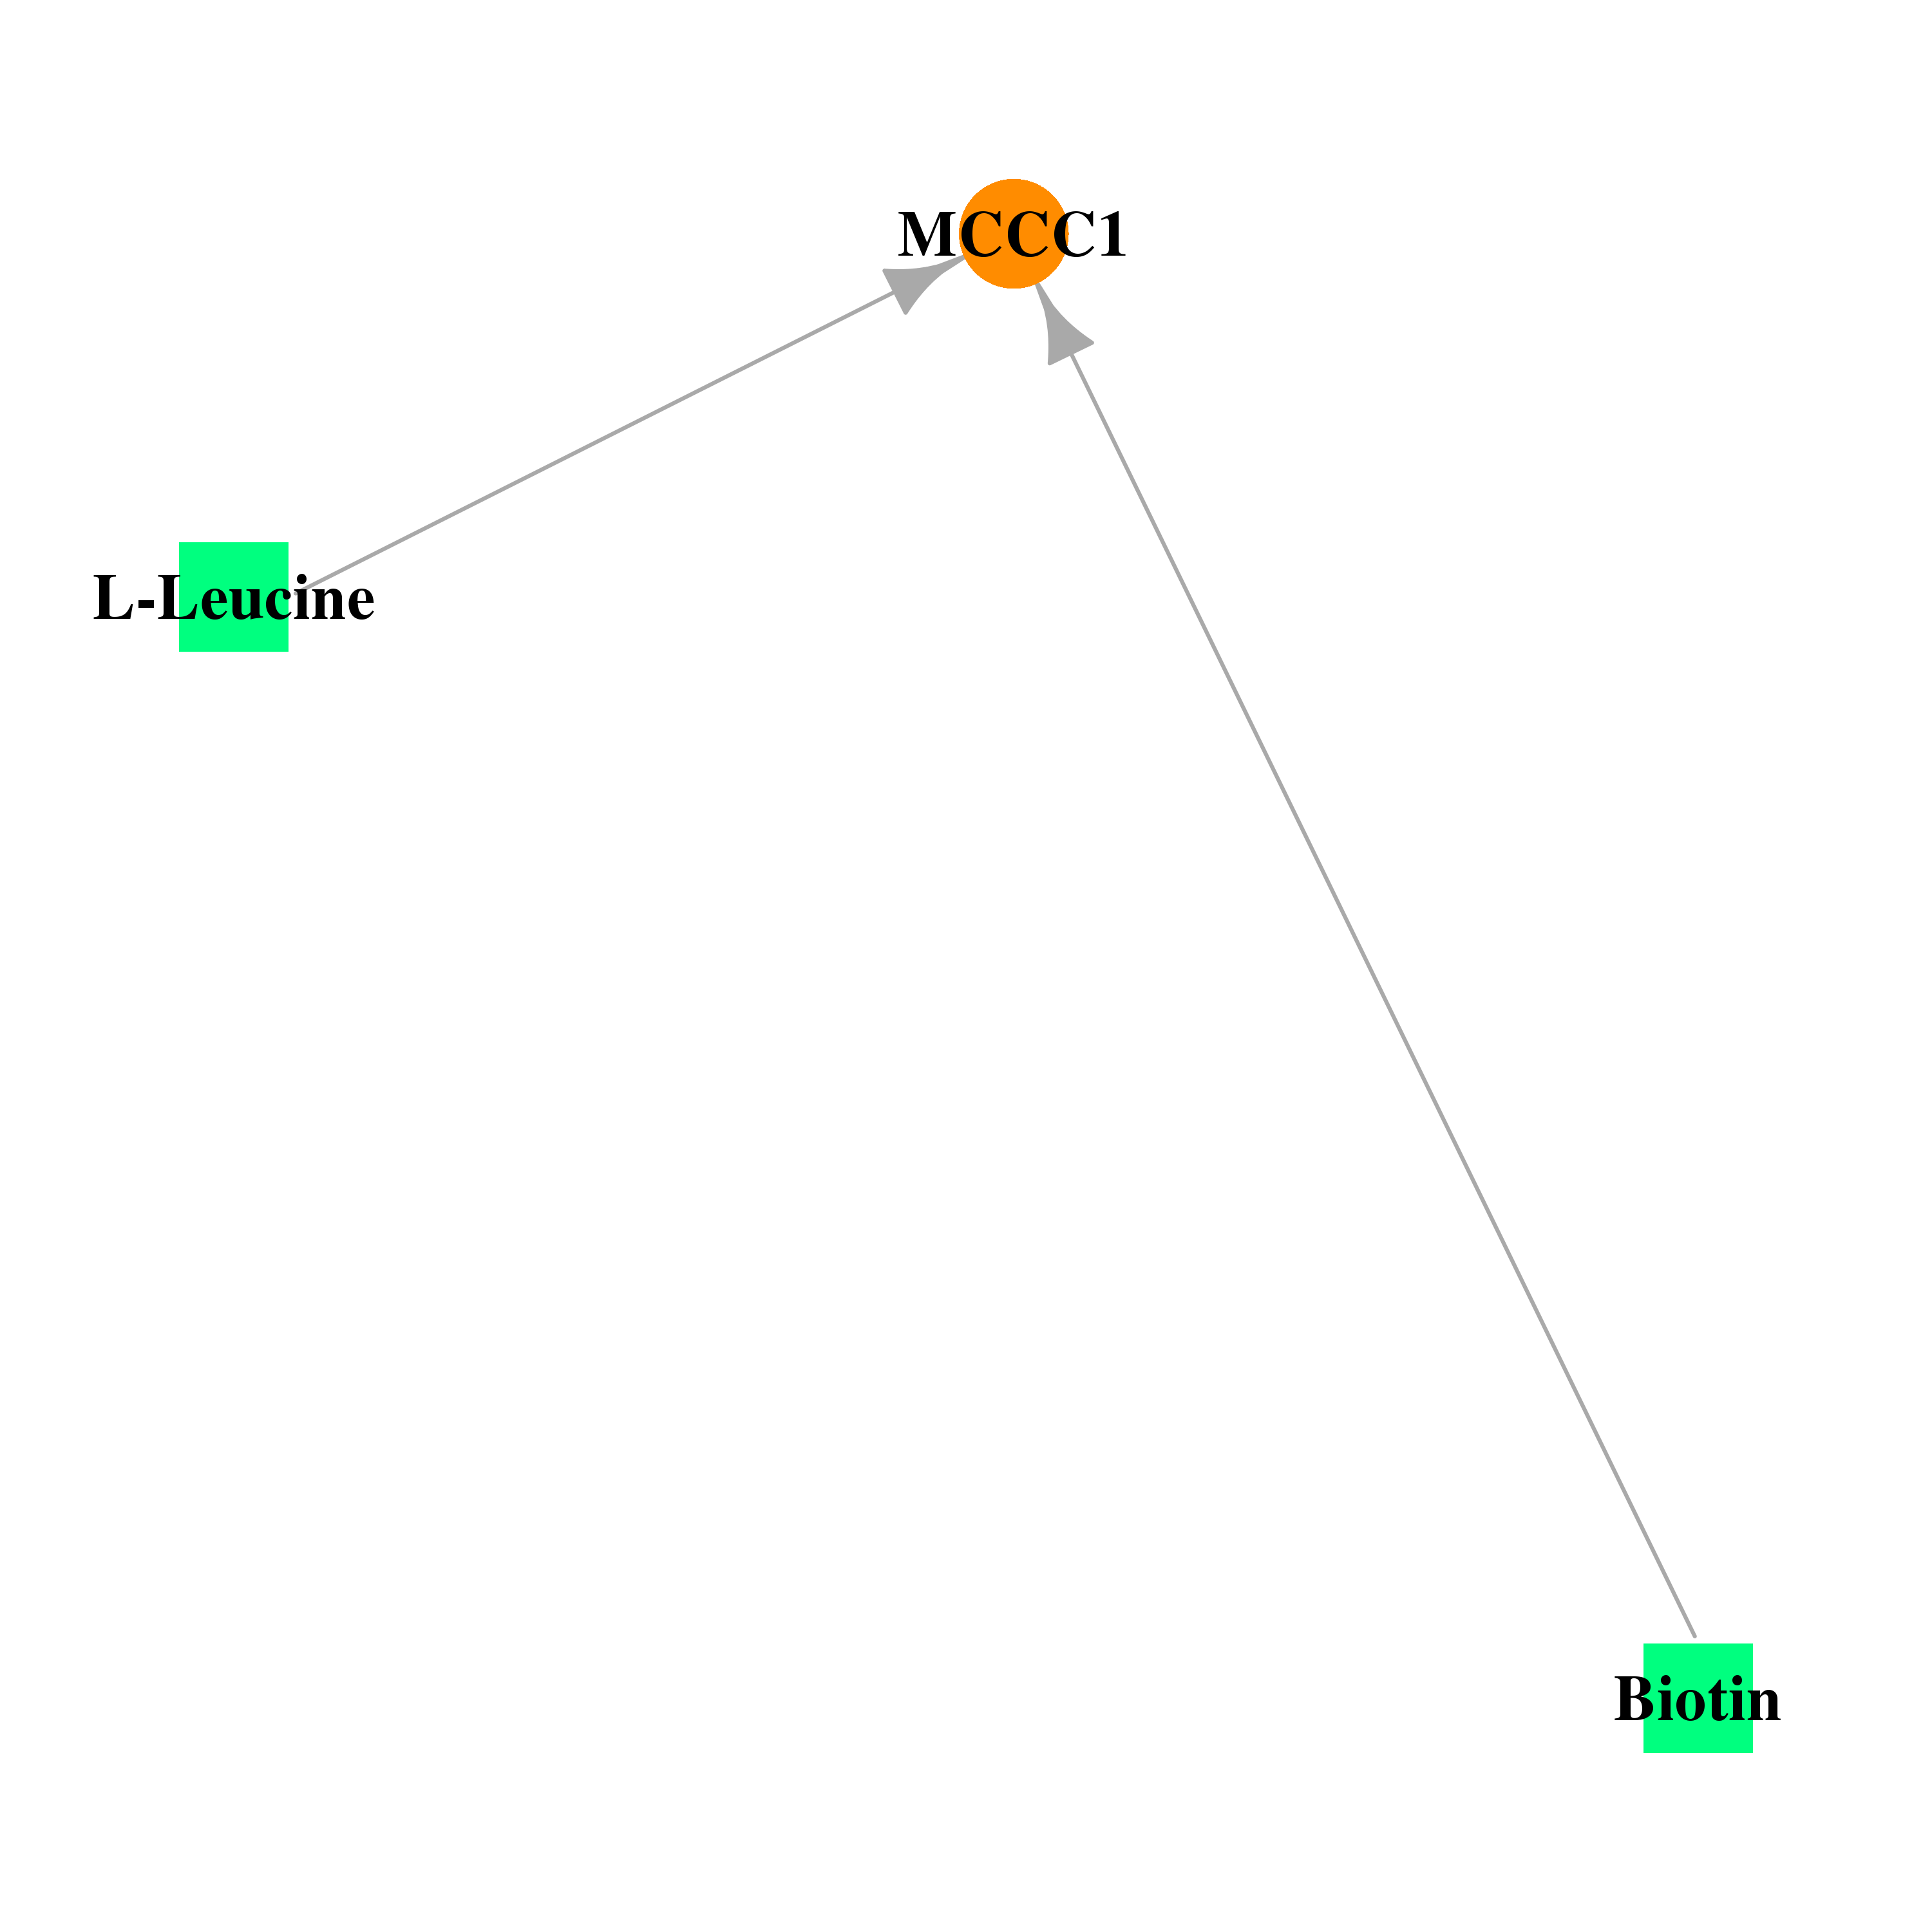 |
| * Drug Centered Interaction Network. |
| DrugBank ID | Target Name | Drug Groups | Generic Name | Drug Centered Network | Drug Structure |
| DB00121 | methylcrotonoyl-CoA carboxylase 1 (alpha) | approved; nutraceutical | Biotin | 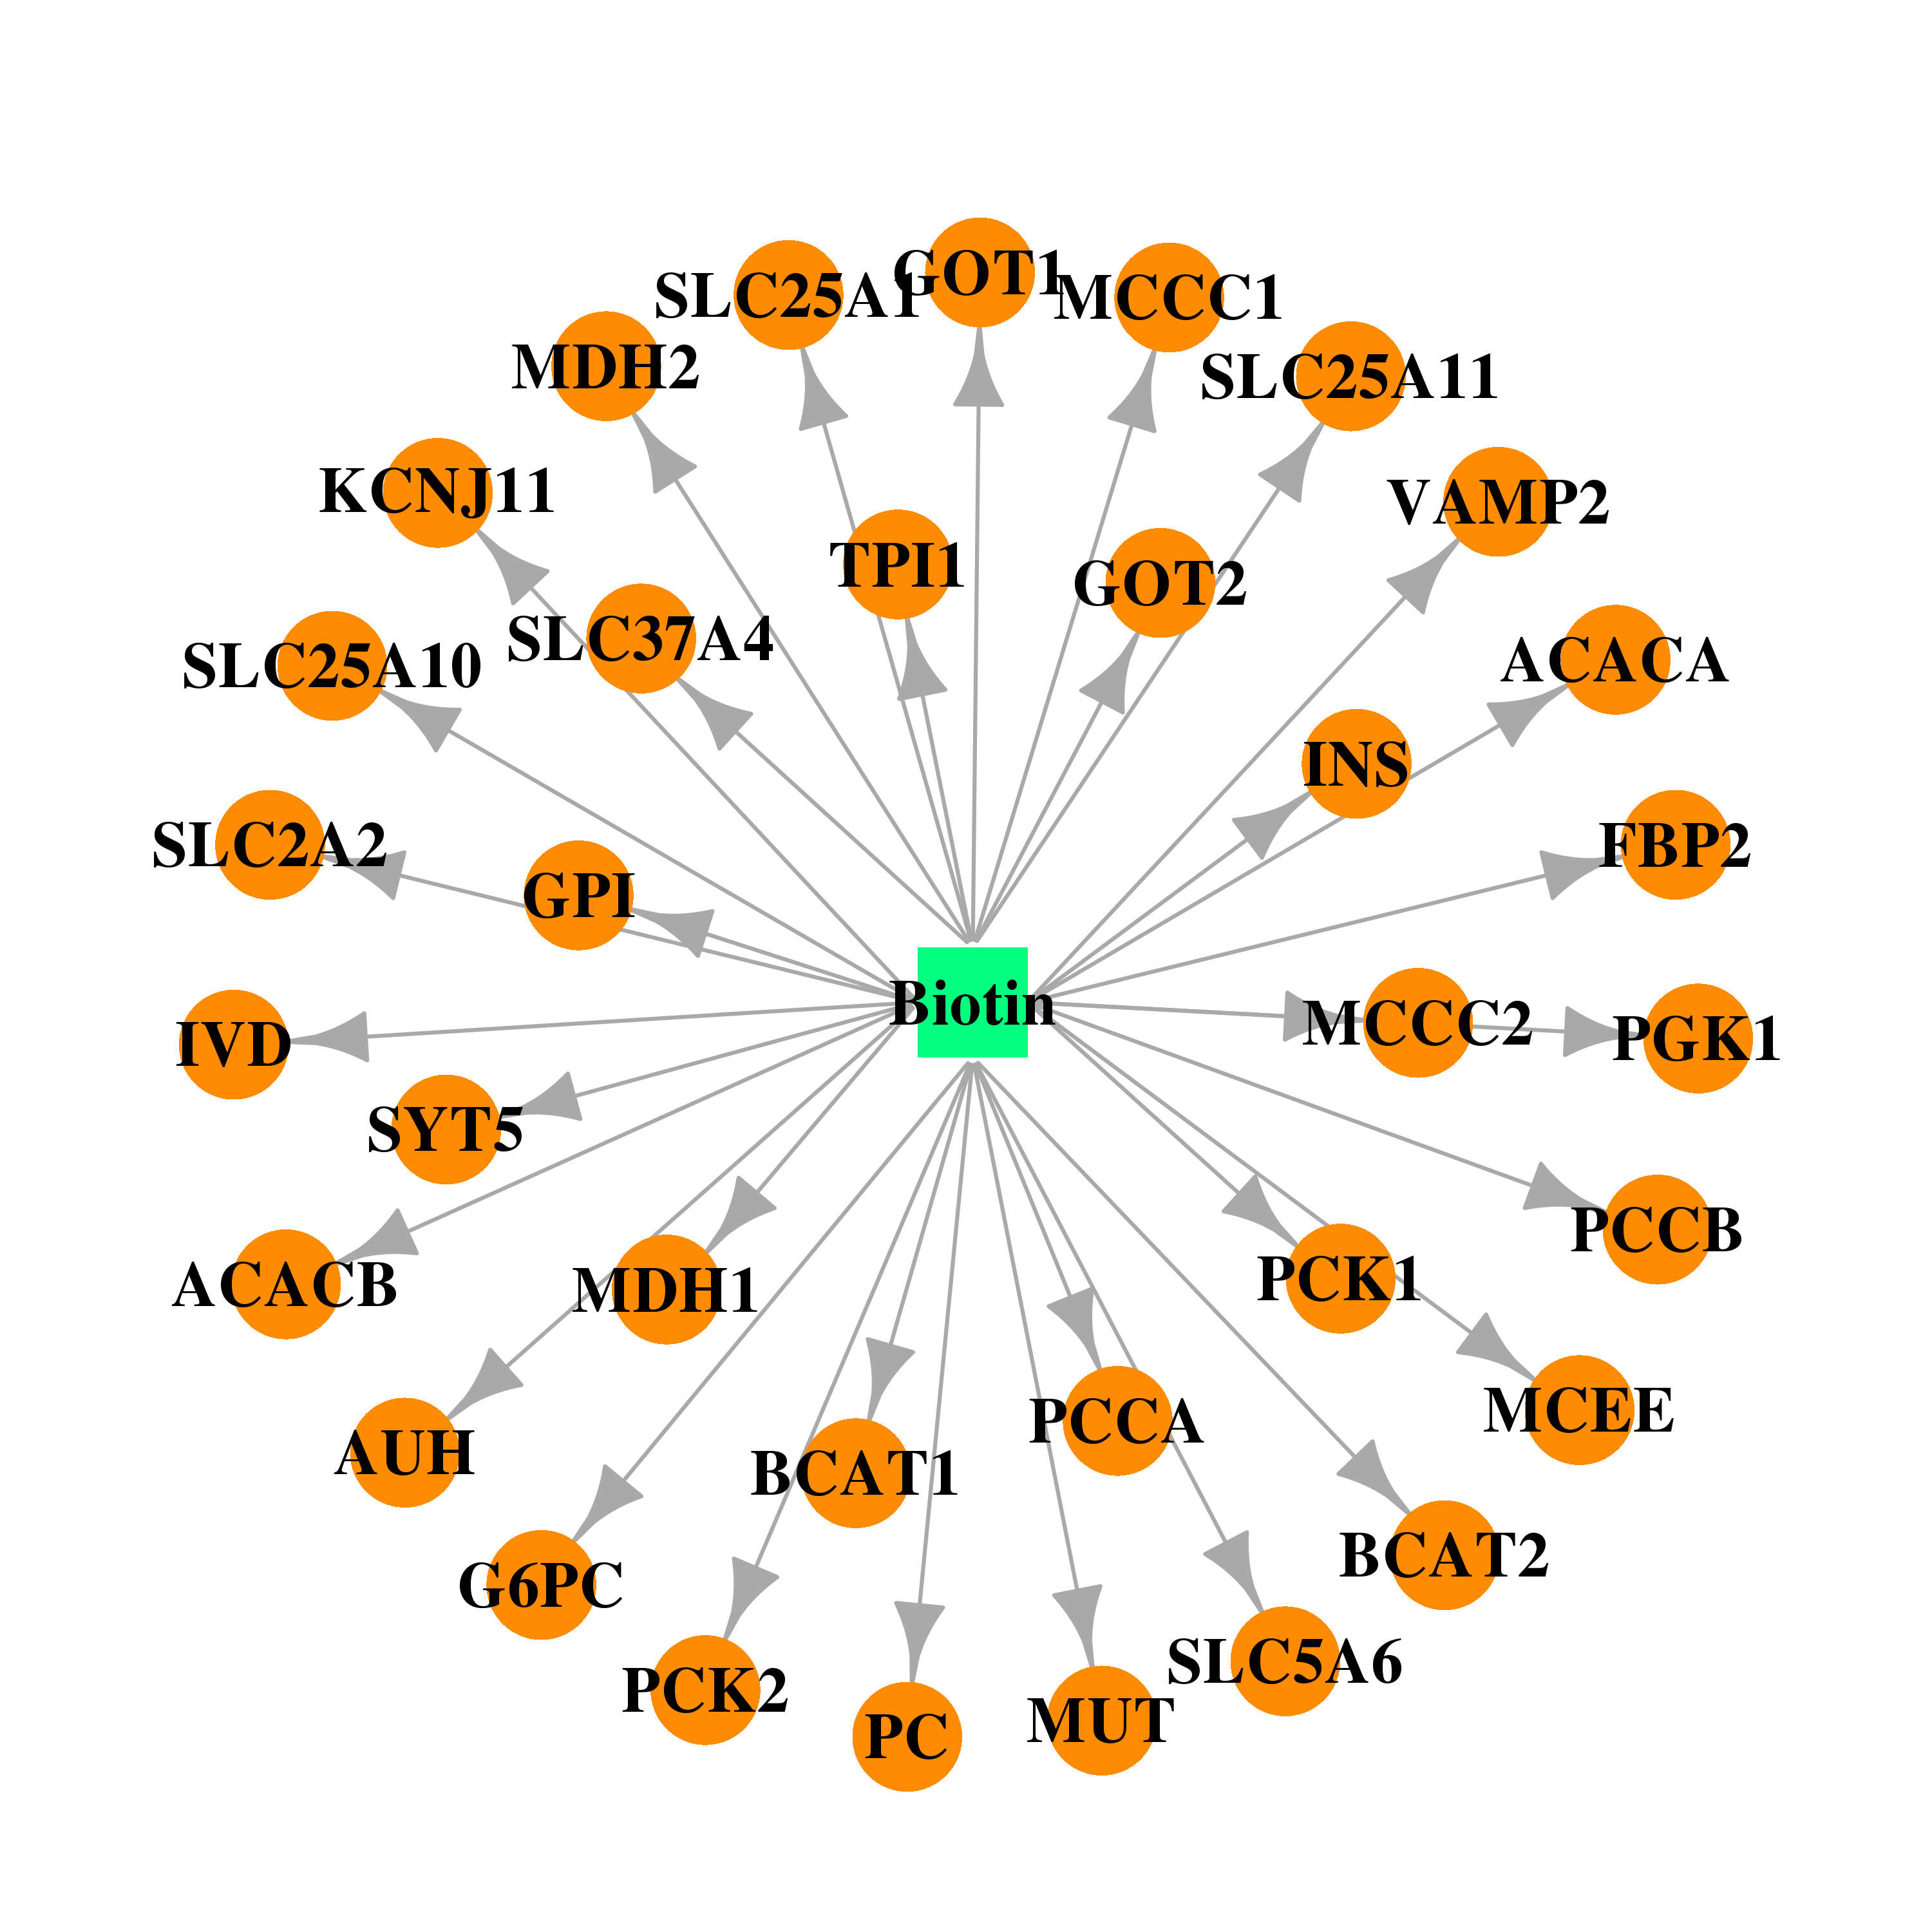 | 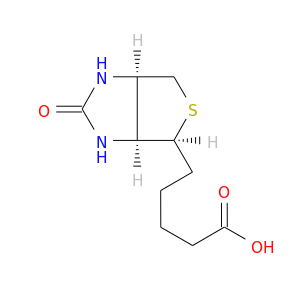 |
| DB00149 | methylcrotonoyl-CoA carboxylase 1 (alpha) | approved; nutraceutical | L-Leucine | 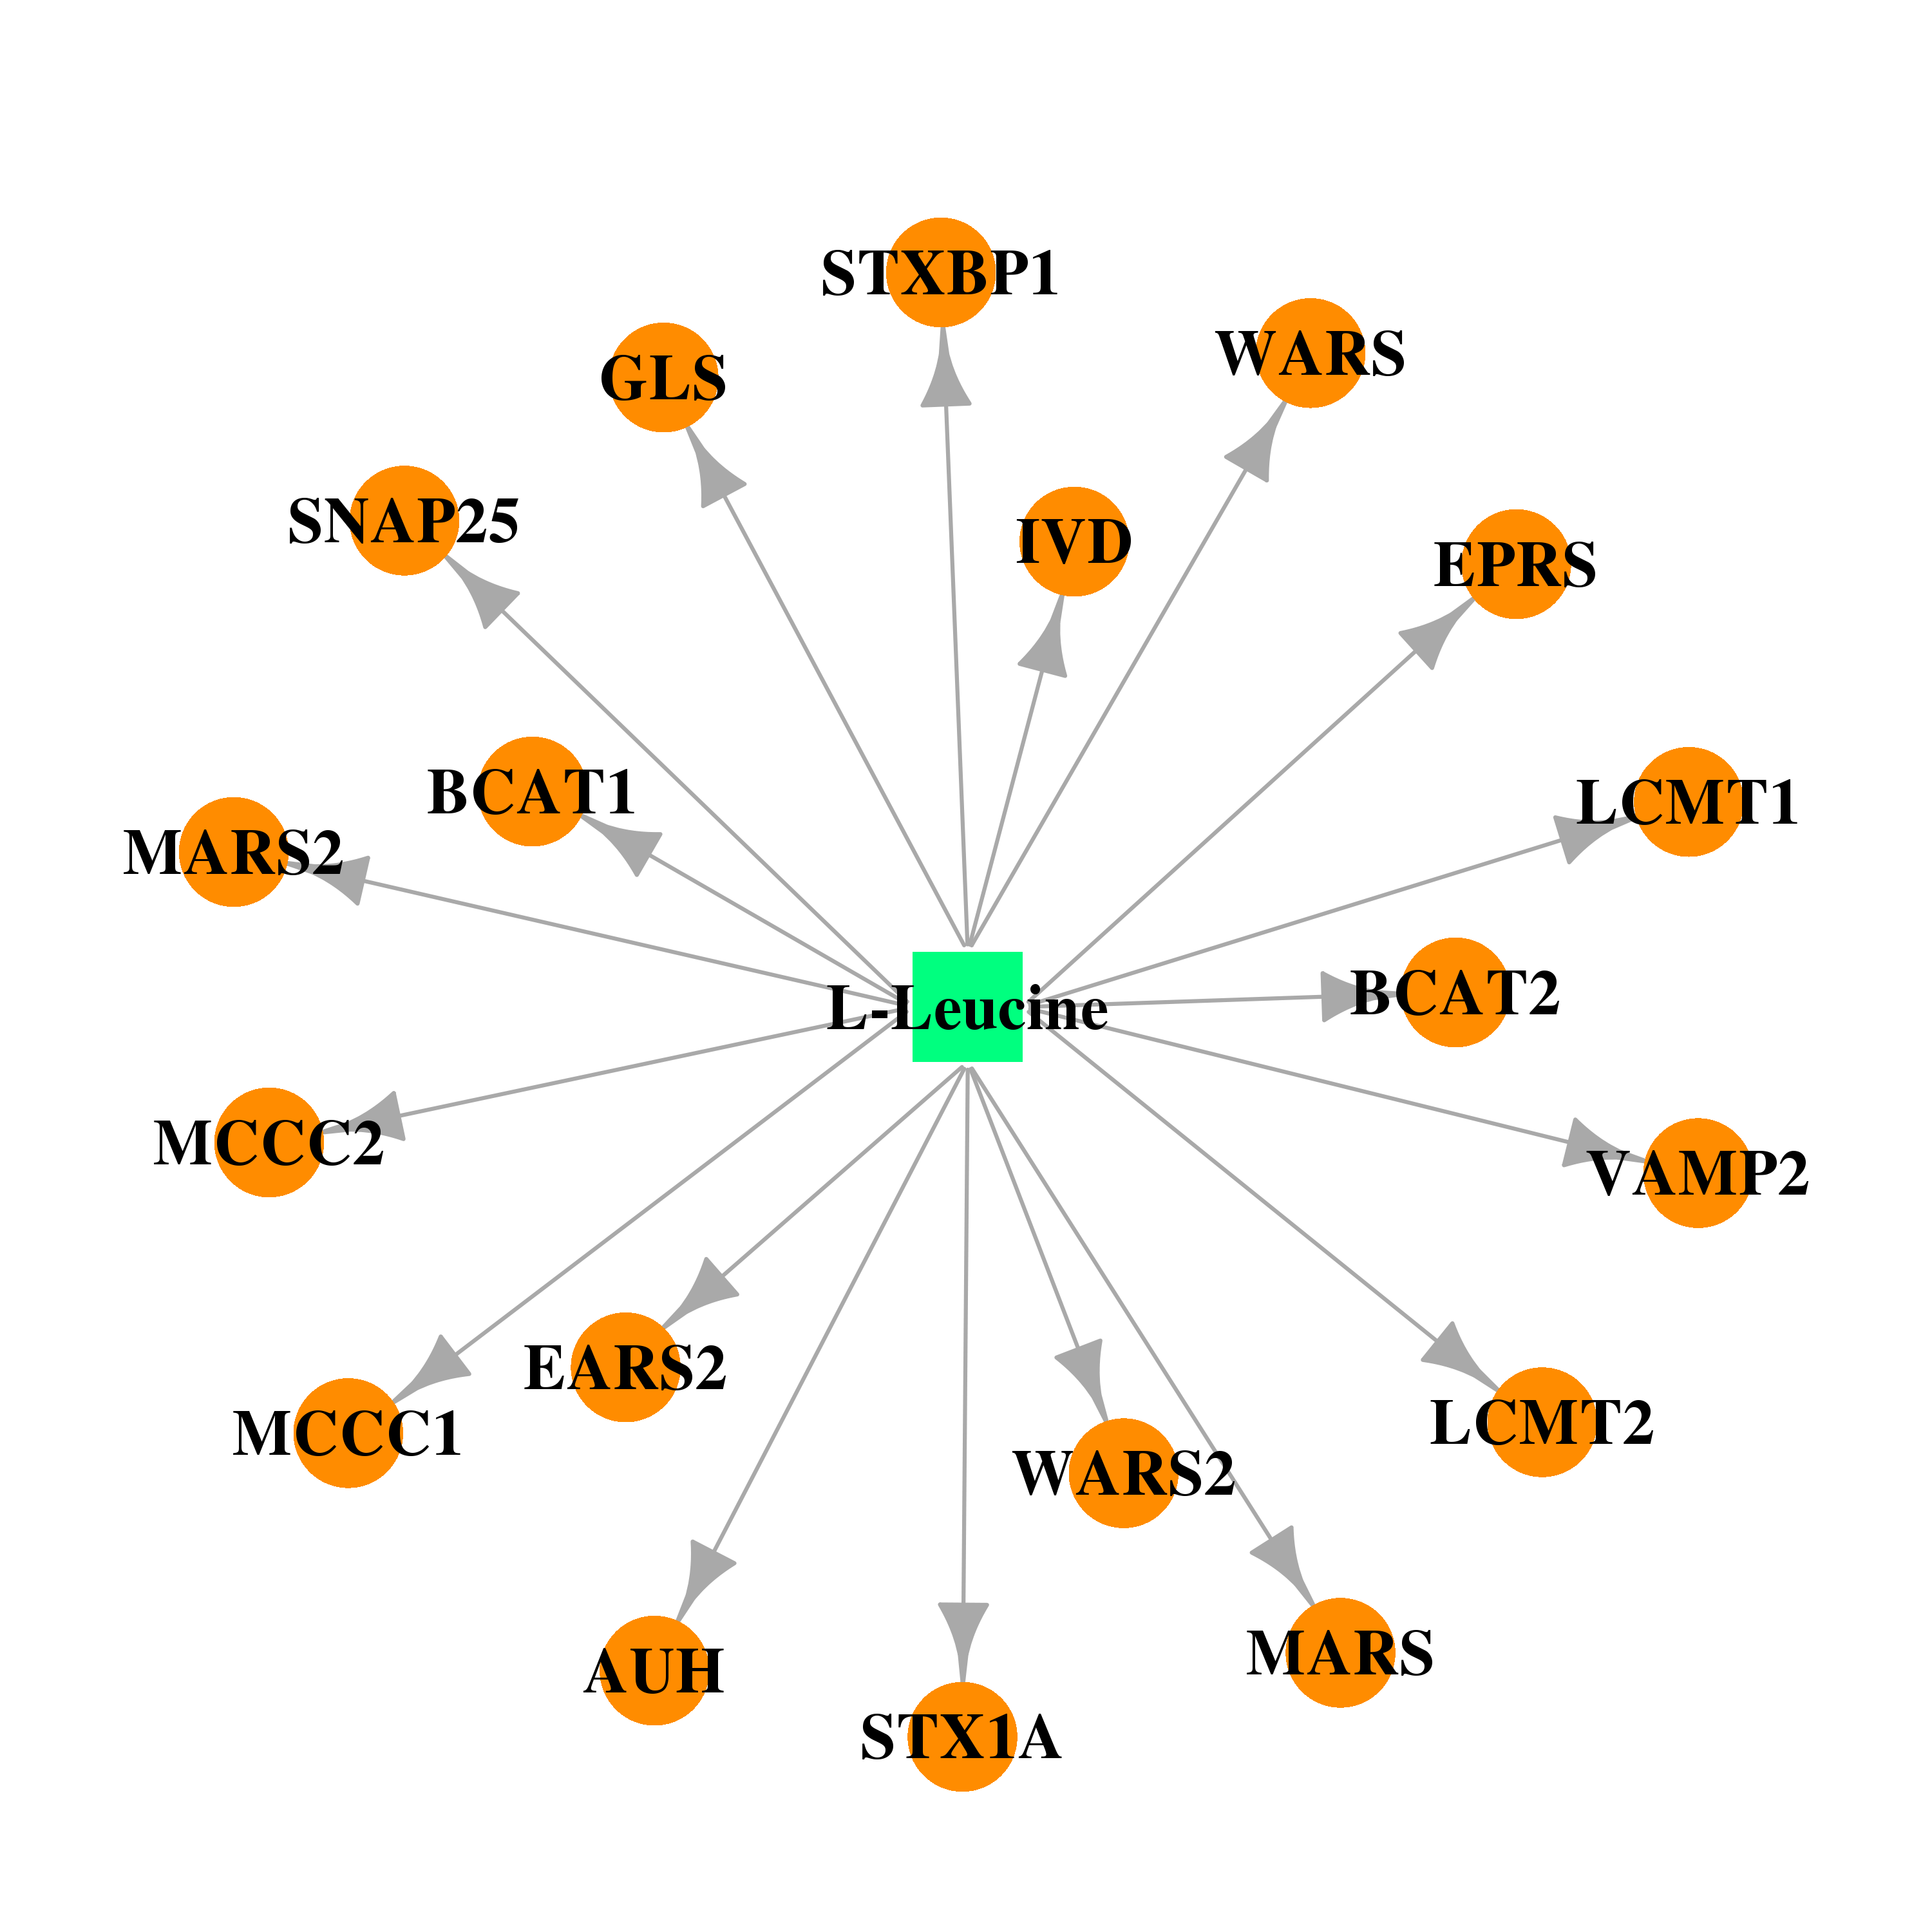 |  |
| Top |
| Cross referenced IDs for MCCC1 |
| * We obtained these cross-references from Uniprot database. It covers 150 different DBs, 18 categories. http://www.uniprot.org/help/cross_references_section |
: Open all cross reference information
|
Copyright © 2016-Present - The Univsersity of Texas Health Science Center at Houston @ |