|
||||||||||||||||||||||||||||||||||||||||||||||||||||||||||||||||||||||||||||||||||||||||||||||||||||||||||||||||||||||||||||||||||||||||||||||||||||||||||||||||||||||||||||||||||||||||||||||||||||||||||||||||||||||||||||||||||||||||||||||||||||||||||||||||||||||||||||||||||||||||||||||||||||||||||||||||||||||||||
| |
| Phenotypic Information (metabolism pathway, cancer, disease, phenome) |
| |
| |
| Gene-Gene Network Information: Co-Expression Network, Interacting Genes & KEGG |
| |
|


| Gene Summary for NIT2 |
| Basic gene info. | Gene symbol | NIT2 |
| Gene name | nitrilase family, member 2 | |
| Synonyms | HEL-S-8a | |
| Cytomap | UCSC genome browser: 3q12.2 | |
| Genomic location | chr3 :100053561-100074478 | |
| Type of gene | protein-coding | |
| RefGenes | NM_020202.4, | |
| Ensembl id | ENSG00000114021 | |
| Description | Nit protein 2epididymis secretory sperm binding protein Li 8anitrilase homolog 2omega-amidase NIT2 | |
| Modification date | 20141207 | |
| dbXrefs | HGNC : HGNC | |
| HPRD : 17634 | ||
| Protein | UniProt: Q9NQR4 go to UniProt's Cross Reference DB Table | |
| Expression | CleanEX: HS_NIT2 | |
| BioGPS: 56954 | ||
| Gene Expression Atlas: ENSG00000114021 | ||
| The Human Protein Atlas: ENSG00000114021 | ||
| Pathway | NCI Pathway Interaction Database: NIT2 | |
| KEGG: NIT2 | ||
| REACTOME: NIT2 | ||
| ConsensusPathDB | ||
| Pathway Commons: NIT2 | ||
| Metabolism | MetaCyc: NIT2 | |
| HUMANCyc: NIT2 | ||
| Regulation | Ensembl's Regulation: ENSG00000114021 | |
| miRBase: chr3 :100,053,561-100,074,478 | ||
| TargetScan: NM_020202 | ||
| cisRED: ENSG00000114021 | ||
| Context | iHOP: NIT2 | |
| cancer metabolism search in PubMed: NIT2 | ||
| UCL Cancer Institute: NIT2 | ||
| Assigned class in ccmGDB | A - This gene has a literature evidence and it belongs to cancer gene. | |
| References showing role of NIT2 in cancer cell metabolism | 1. Krasnikov BF, Chien C-H, Nostramo R, Pinto JT, Nieves E, et al. (2009) Identification of the putative tumor suppressor Nit2 as ω-amidase, an enzyme metabolically linked to glutamine and asparagine transamination. Biochimie 91: 1072-1080. go to article 2. Chien C-H, Gao Q-Z, Cooper AJ, Lyu J-H, Sheu S-Y (2012) Structural Insights into the Catalytic Active Site and Activity of Human Nit2/ω-Amidase KINETIC ASSAY AND MOLECULAR DYNAMICS SIMULATION. Journal of Biological Chemistry 287: 25715-25726. go to article | |
| Top |
| Phenotypic Information for NIT2(metabolism pathway, cancer, disease, phenome) |
| Cancer | CGAP: NIT2 |
| Familial Cancer Database: NIT2 | |
| * This gene is included in those cancer gene databases. |
|
|
|
|
|
| . | ||||||||||||||||||||||||||||||||||||||||||||||||||||||||||||||||||||||||||||||||||||||||||||||||||||||||||||||||||||||||||||||||||||||||||||||||||||||||||||||||||||||||||||||||||||||||||||||||||||||||||||||||||||||||||||||||||||||||||||||||||||||||||||||||||||||||||||||||||||||||||||||||||||||||||||||||||||
Oncogene 1 | Significant driver gene in | |||||||||||||||||||||||||||||||||||||||||||||||||||||||||||||||||||||||||||||||||||||||||||||||||||||||||||||||||||||||||||||||||||||||||||||||||||||||||||||||||||||||||||||||||||||||||||||||||||||||||||||||||||||||||||||||||||||||||||||||||||||||||||||||||||||||||||||||||||||||||||||||||||||||||||||||||||||||||
| cf) number; DB name 1 Oncogene; http://nar.oxfordjournals.org/content/35/suppl_1/D721.long, 2 Tumor Suppressor gene; https://bioinfo.uth.edu/TSGene/, 3 Cancer Gene Census; http://www.nature.com/nrc/journal/v4/n3/abs/nrc1299.html, 4 CancerGenes; http://nar.oxfordjournals.org/content/35/suppl_1/D721.long, 5 Network of Cancer Gene; http://ncg.kcl.ac.uk/index.php, 1Therapeutic Vulnerabilities in Cancer; http://cbio.mskcc.org/cancergenomics/statius/ |
| KEGG_ALANINE_ASPARTATE_AND_GLUTAMATE_METABOLISM | |
| OMIM | |
| Orphanet | |
| Disease | KEGG Disease: NIT2 |
| MedGen: NIT2 (Human Medical Genetics with Condition) | |
| ClinVar: NIT2 | |
| Phenotype | MGI: NIT2 (International Mouse Phenotyping Consortium) |
| PhenomicDB: NIT2 | |
| Mutations for NIT2 |
| * Under tables are showing count per each tissue to give us broad intuition about tissue specific mutation patterns.You can go to the detailed page for each mutation database's web site. |
| There's no structural variation information in COSMIC data for this gene. |
| * From mRNA Sanger sequences, Chitars2.0 arranged chimeric transcripts. This table shows NIT2 related fusion information. |
| ID | Head Gene | Tail Gene | Accession | Gene_a | qStart_a | qEnd_a | Chromosome_a | tStart_a | tEnd_a | Gene_a | qStart_a | qEnd_a | Chromosome_a | tStart_a | tEnd_a |
| Top |
| Mutation type/ Tissue ID | brca | cns | cerv | endome | haematopo | kidn | Lintest | liver | lung | ns | ovary | pancre | prost | skin | stoma | thyro | urina | |||
| Total # sample | 2 | |||||||||||||||||||
| GAIN (# sample) | 2 | |||||||||||||||||||
| LOSS (# sample) |
| cf) Tissue ID; Tissue type (1; Breast, 2; Central_nervous_system, 3; Cervix, 4; Endometrium, 5; Haematopoietic_and_lymphoid_tissue, 6; Kidney, 7; Large_intestine, 8; Liver, 9; Lung, 10; NS, 11; Ovary, 12; Pancreas, 13; Prostate, 14; Skin, 15; Stomach, 16; Thyroid, 17; Urinary_tract) |
| Top |
|
 |
| Top |
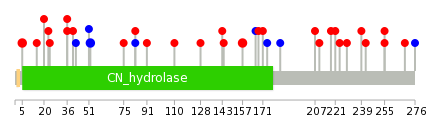
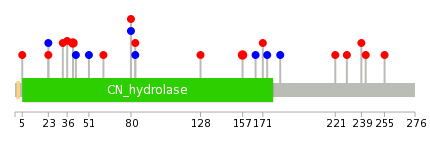
| Stat. for Non-Synonymous SNVs (# total SNVs=23) | (# total SNVs=6) |
 |  |
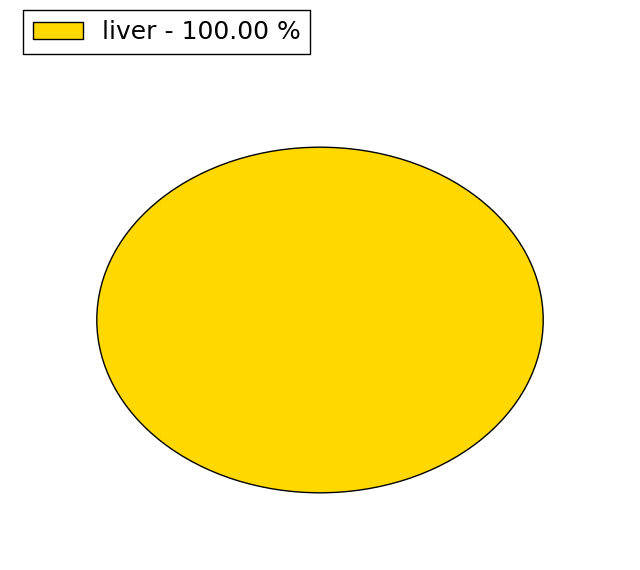
(# total SNVs=1) | (# total SNVs=0) |
 |
| Top |
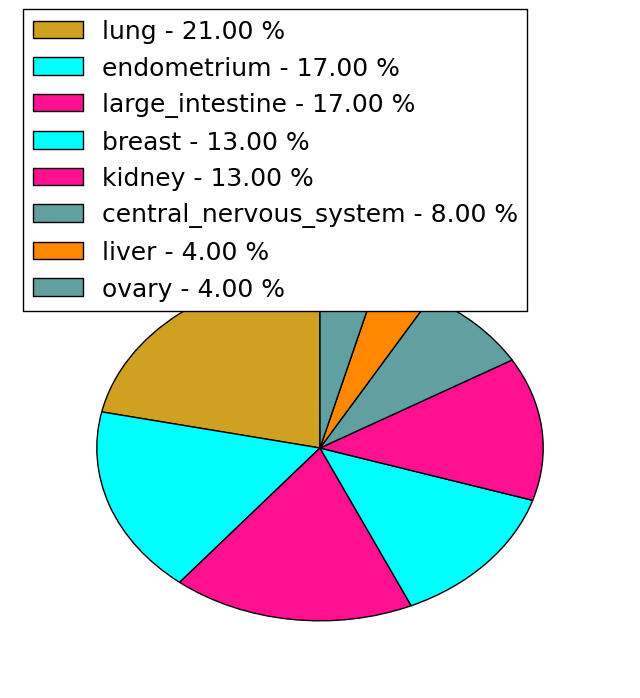
| * When you move the cursor on each content, you can see more deailed mutation information on the Tooltip. Those are primary_site,primary_histology,mutation(aa),pubmedID. |
| GRCh37 position | Mutation(aa) | Unique sampleID count |
| chr3:100064474-100064474 | p.E128* | 3 |
| chr3:100057936-100057936 | p.R5C | 2 |
| chr3:100058688-100058688 | p.K52K | 2 |
| chr3:100065064-100065064 | p.R157Q | 2 |
| chr3:100058029-100058029 | p.A36T | 1 |
| chr3:100073618-100073618 | p.G229E | 1 |
| chr3:100059917-100059917 | p.G83V | 1 |
| chr3:100065097-100065097 | p.R168K | 1 |
| chr3:100058030-100058030 | p.A36V | 1 |
| chr3:100073648-100073648 | p.E239A | 1 |
| Top |
|
 |
| Point Mutation/ Tissue ID | 1 | 2 | 3 | 4 | 5 | 6 | 7 | 8 | 9 | 10 | 11 | 12 | 13 | 14 | 15 | 16 | 17 | 18 | 19 | 20 |
| # sample | 1 | 3 | 1 | 3 | 2 | 2 | 2 | 1 | 3 | 4 | ||||||||||
| # mutation | 1 | 3 | 1 | 4 | 2 | 2 | 2 | 1 | 3 | 4 | ||||||||||
| nonsynonymous SNV | 3 | 1 | 3 | 1 | 2 | 1 | 2 | 3 | ||||||||||||
| synonymous SNV | 1 | 1 | 2 | 1 | 1 | 1 |
| cf) Tissue ID; Tissue type (1; BLCA[Bladder Urothelial Carcinoma], 2; BRCA[Breast invasive carcinoma], 3; CESC[Cervical squamous cell carcinoma and endocervical adenocarcinoma], 4; COAD[Colon adenocarcinoma], 5; GBM[Glioblastoma multiforme], 6; Glioma Low Grade, 7; HNSC[Head and Neck squamous cell carcinoma], 8; KICH[Kidney Chromophobe], 9; KIRC[Kidney renal clear cell carcinoma], 10; KIRP[Kidney renal papillary cell carcinoma], 11; LAML[Acute Myeloid Leukemia], 12; LUAD[Lung adenocarcinoma], 13; LUSC[Lung squamous cell carcinoma], 14; OV[Ovarian serous cystadenocarcinoma ], 15; PAAD[Pancreatic adenocarcinoma], 16; PRAD[Prostate adenocarcinoma], 17; SKCM[Skin Cutaneous Melanoma], 18:STAD[Stomach adenocarcinoma], 19:THCA[Thyroid carcinoma], 20:UCEC[Uterine Corpus Endometrial Carcinoma]) |
| Top |
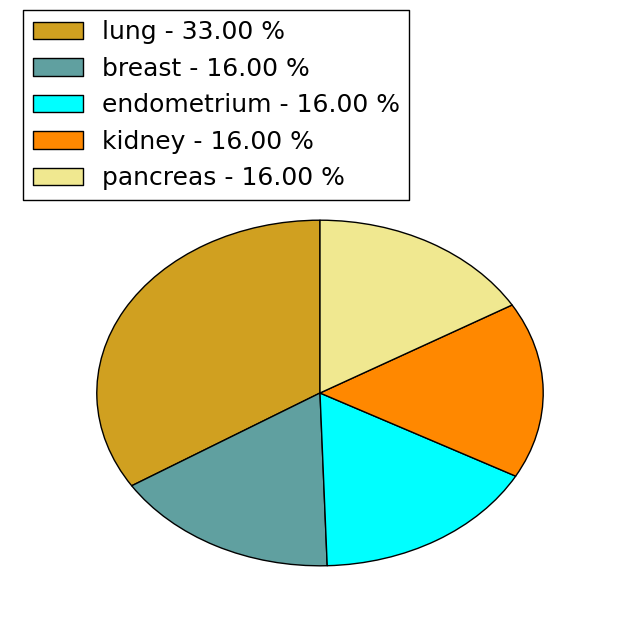
| * We represented just top 10 SNVs. When you move the cursor on each content, you can see more deailed mutation information on the Tooltip. Those are primary_site, primary_histology, mutation(aa), pubmedID. |
| Genomic Position | Mutation(aa) | Unique sampleID count |
| chr3:100065064 | p.S40Y | 2 |
| chr3:100058042 | p.R157Q | 2 |
| chr3:100058049 | p.R23R | 1 |
| chr3:100067663 | p.T183T | 1 |
| chr3:100058685 | p.T33M | 1 |
| chr3:100067690 | p.H221Y | 1 |
| chr3:100058713 | p.A36T | 1 |
| chr3:100071324 | p.G229E | 1 |
| chr3:100058770 | p.E239A | 1 |
| chr3:100073618 | p.P42P | 1 |
| * Copy number data were extracted from TCGA using R package TCGA-Assembler. The URLs of all public data files on TCGA DCC data server were gathered on Jan-05-2015. Function ProcessCNAData in TCGA-Assembler package was used to obtain gene-level copy number value which is calculated as the average copy number of the genomic region of a gene. |
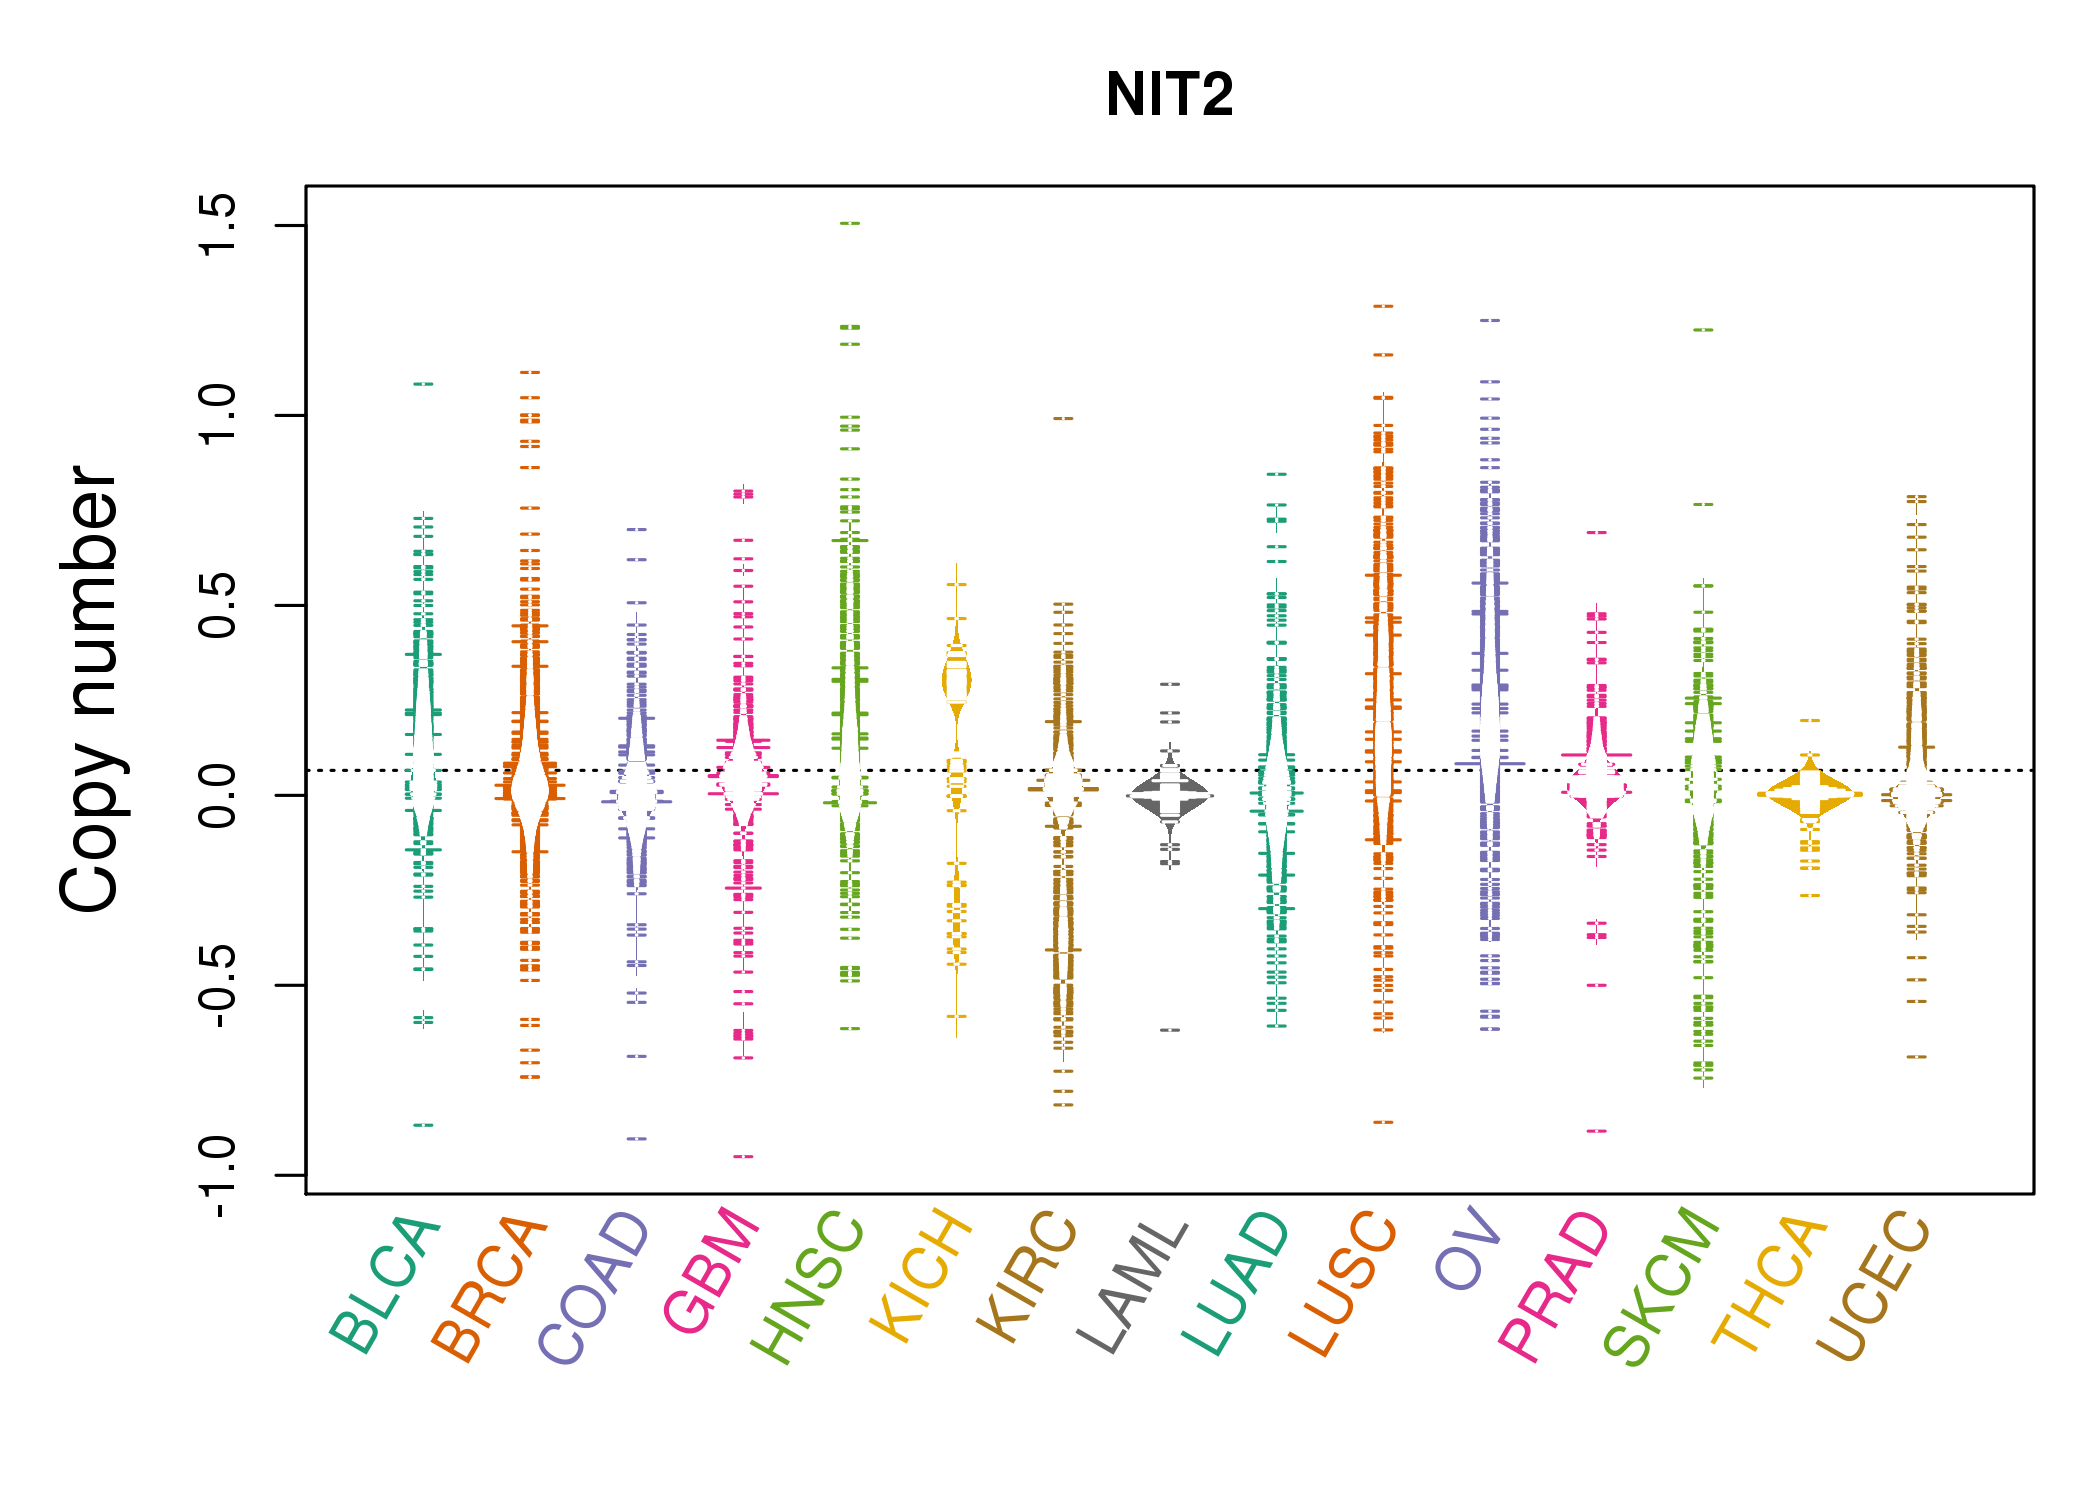 |
| cf) Tissue ID[Tissue type]: BLCA[Bladder Urothelial Carcinoma], BRCA[Breast invasive carcinoma], CESC[Cervical squamous cell carcinoma and endocervical adenocarcinoma], COAD[Colon adenocarcinoma], GBM[Glioblastoma multiforme], Glioma Low Grade, HNSC[Head and Neck squamous cell carcinoma], KICH[Kidney Chromophobe], KIRC[Kidney renal clear cell carcinoma], KIRP[Kidney renal papillary cell carcinoma], LAML[Acute Myeloid Leukemia], LUAD[Lung adenocarcinoma], LUSC[Lung squamous cell carcinoma], OV[Ovarian serous cystadenocarcinoma ], PAAD[Pancreatic adenocarcinoma], PRAD[Prostate adenocarcinoma], SKCM[Skin Cutaneous Melanoma], STAD[Stomach adenocarcinoma], THCA[Thyroid carcinoma], UCEC[Uterine Corpus Endometrial Carcinoma] |
| Top |
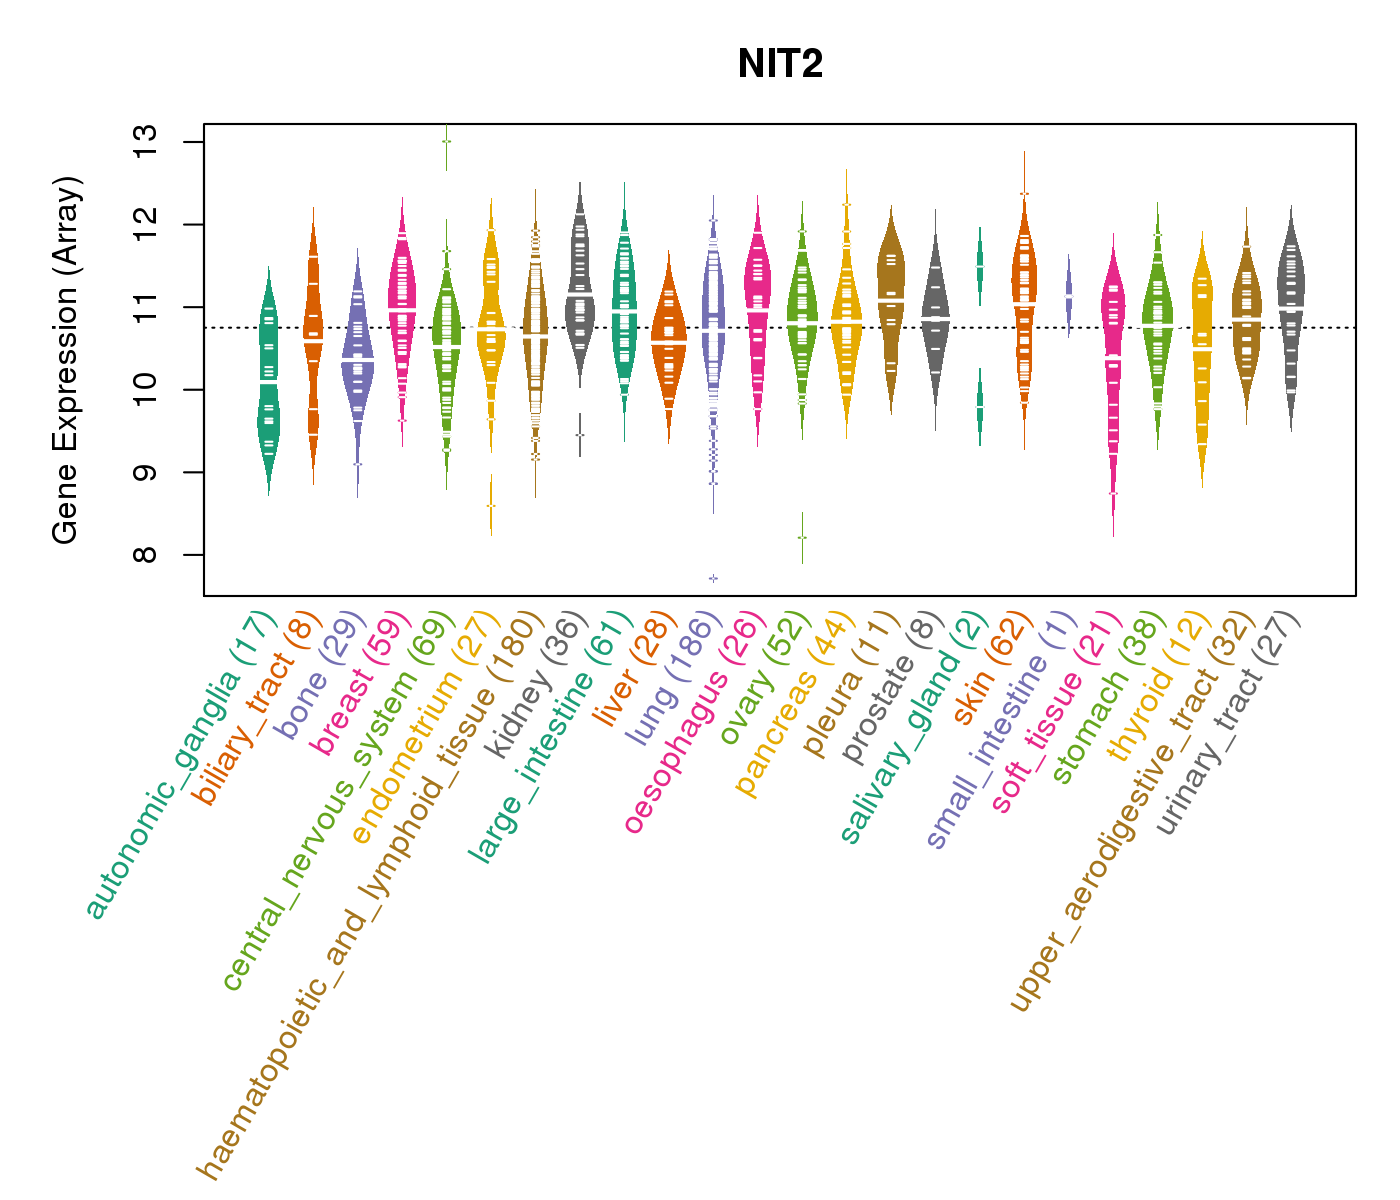
| Gene Expression for NIT2 |
| * CCLE gene expression data were extracted from CCLE_Expression_Entrez_2012-10-18.res: Gene-centric RMA-normalized mRNA expression data. |
 |
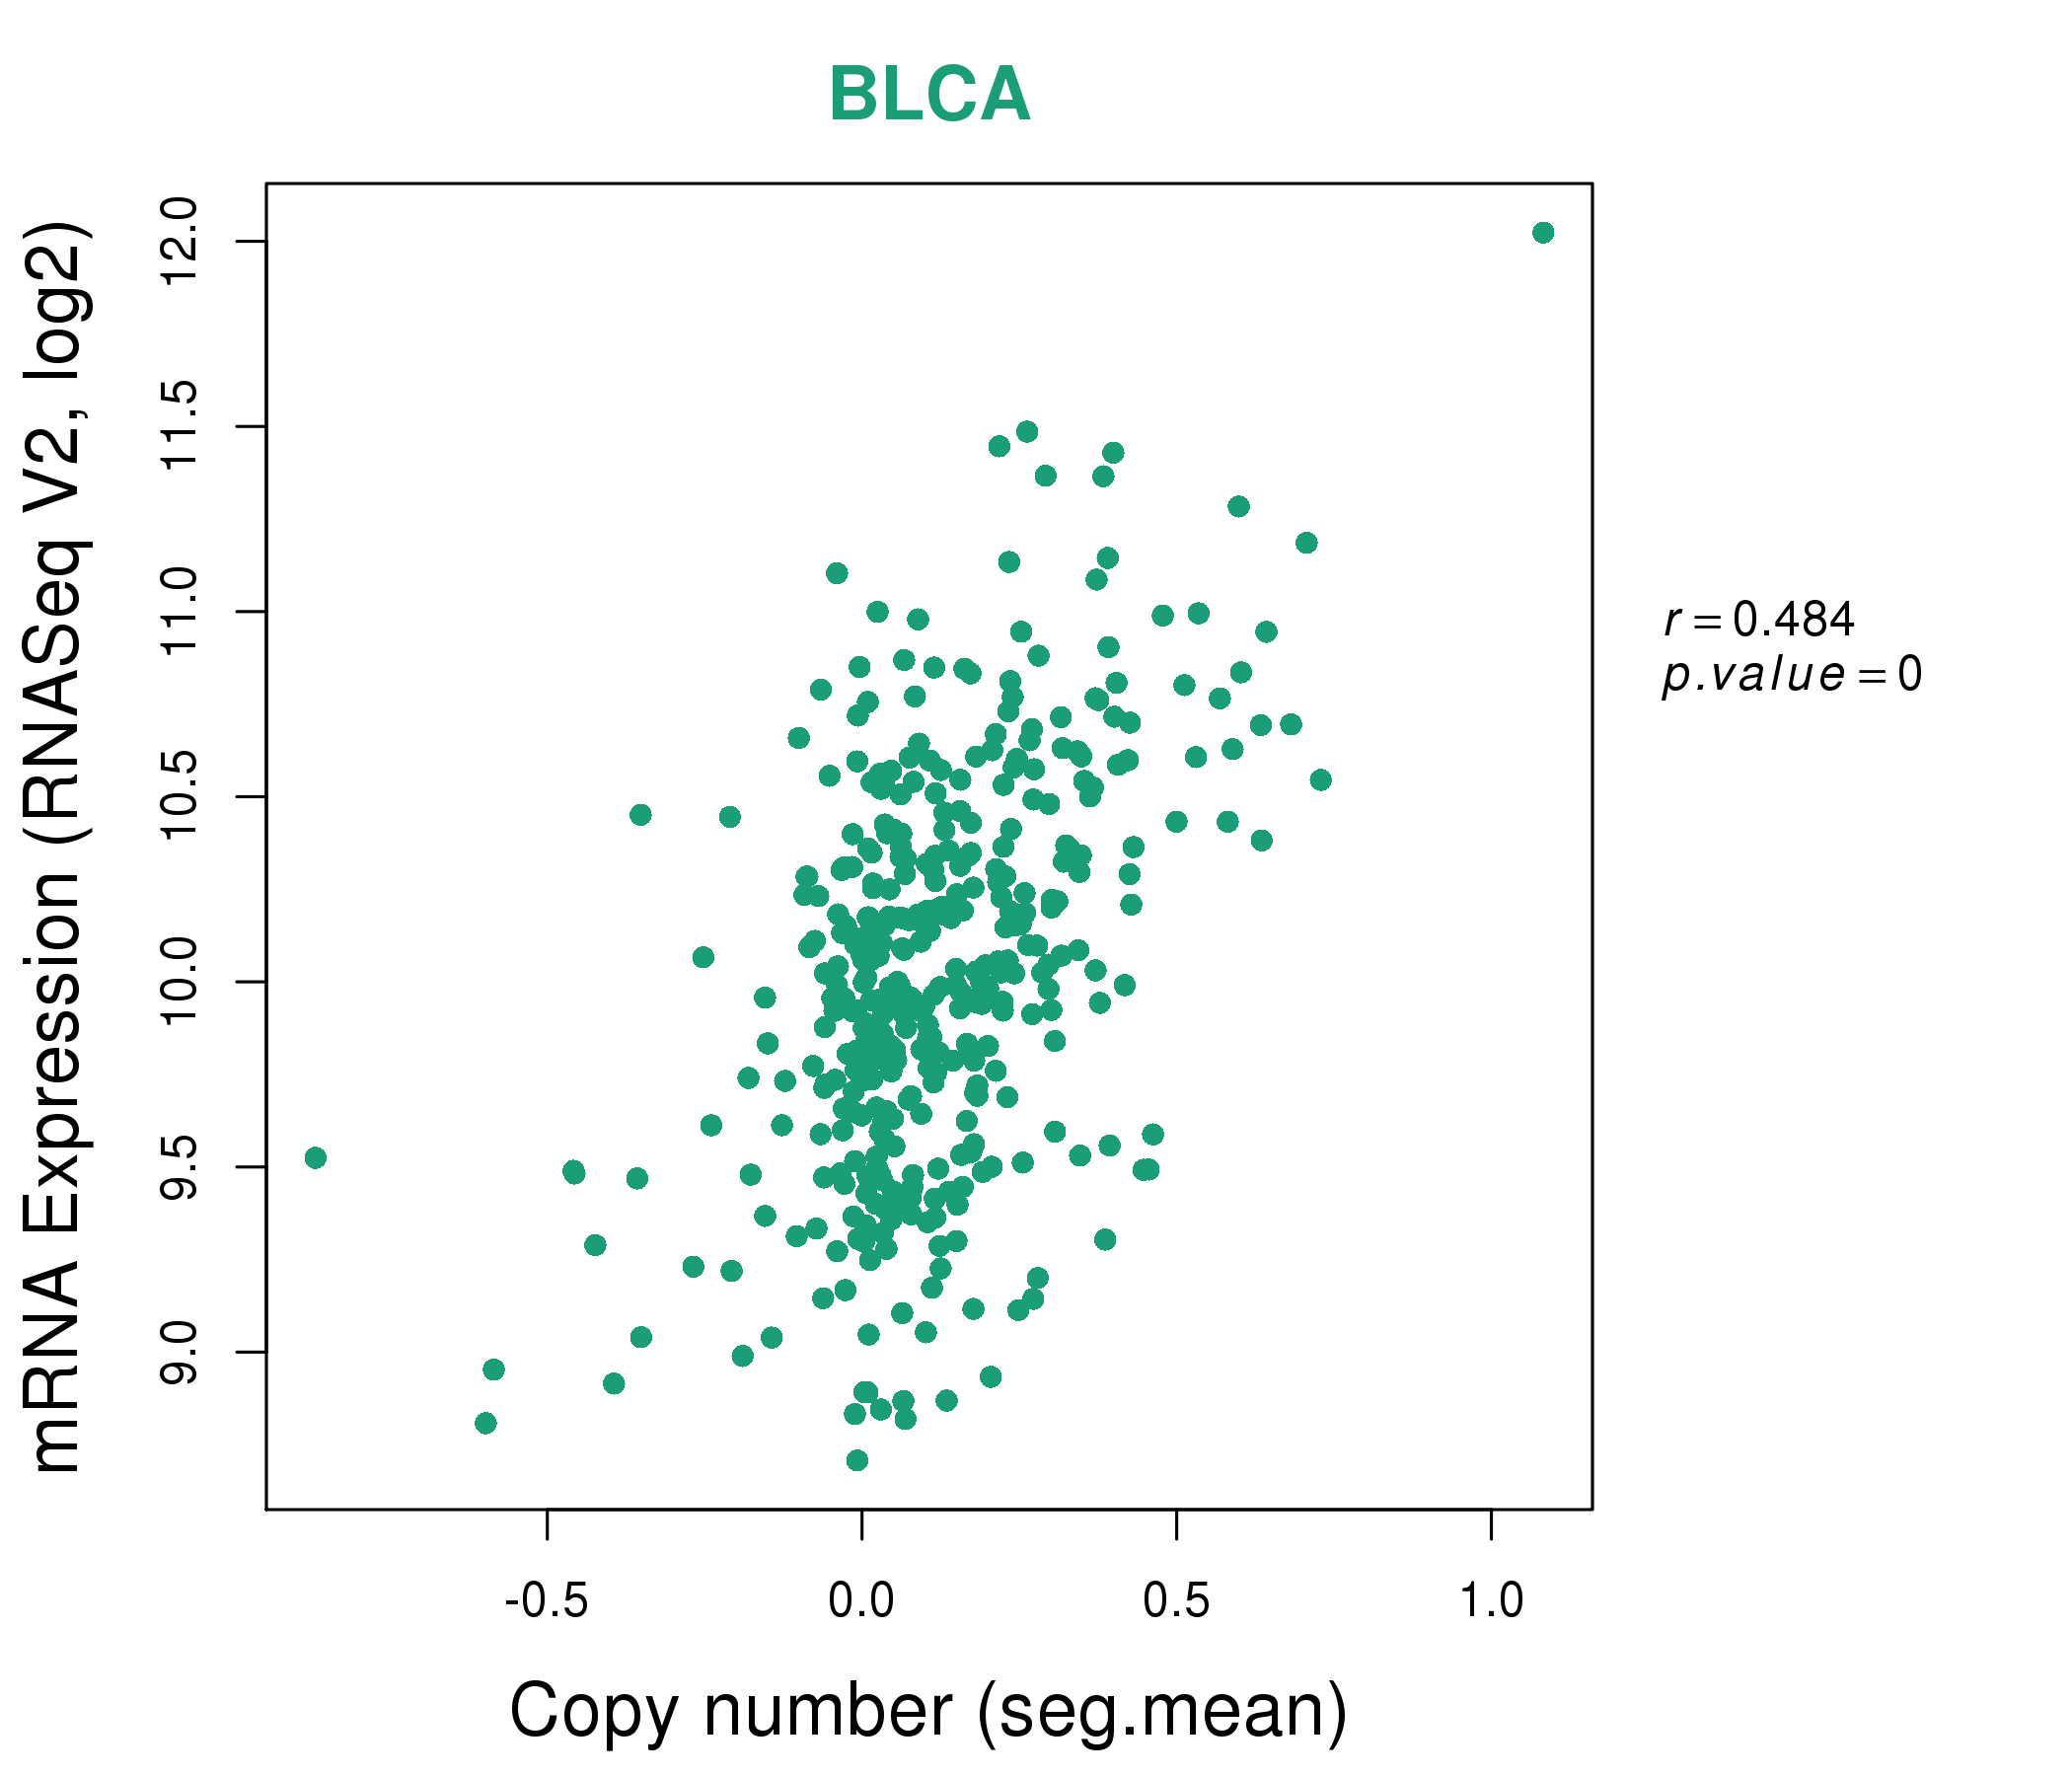
| * Normalized gene expression data of RNASeqV2 was extracted from TCGA using R package TCGA-Assembler. The URLs of all public data files on TCGA DCC data server were gathered at Jan-05-2015. Only eight cancer types have enough normal control samples for differential expression analysis. (t test, adjusted p<0.05 (using Benjamini-Hochberg FDR)) |
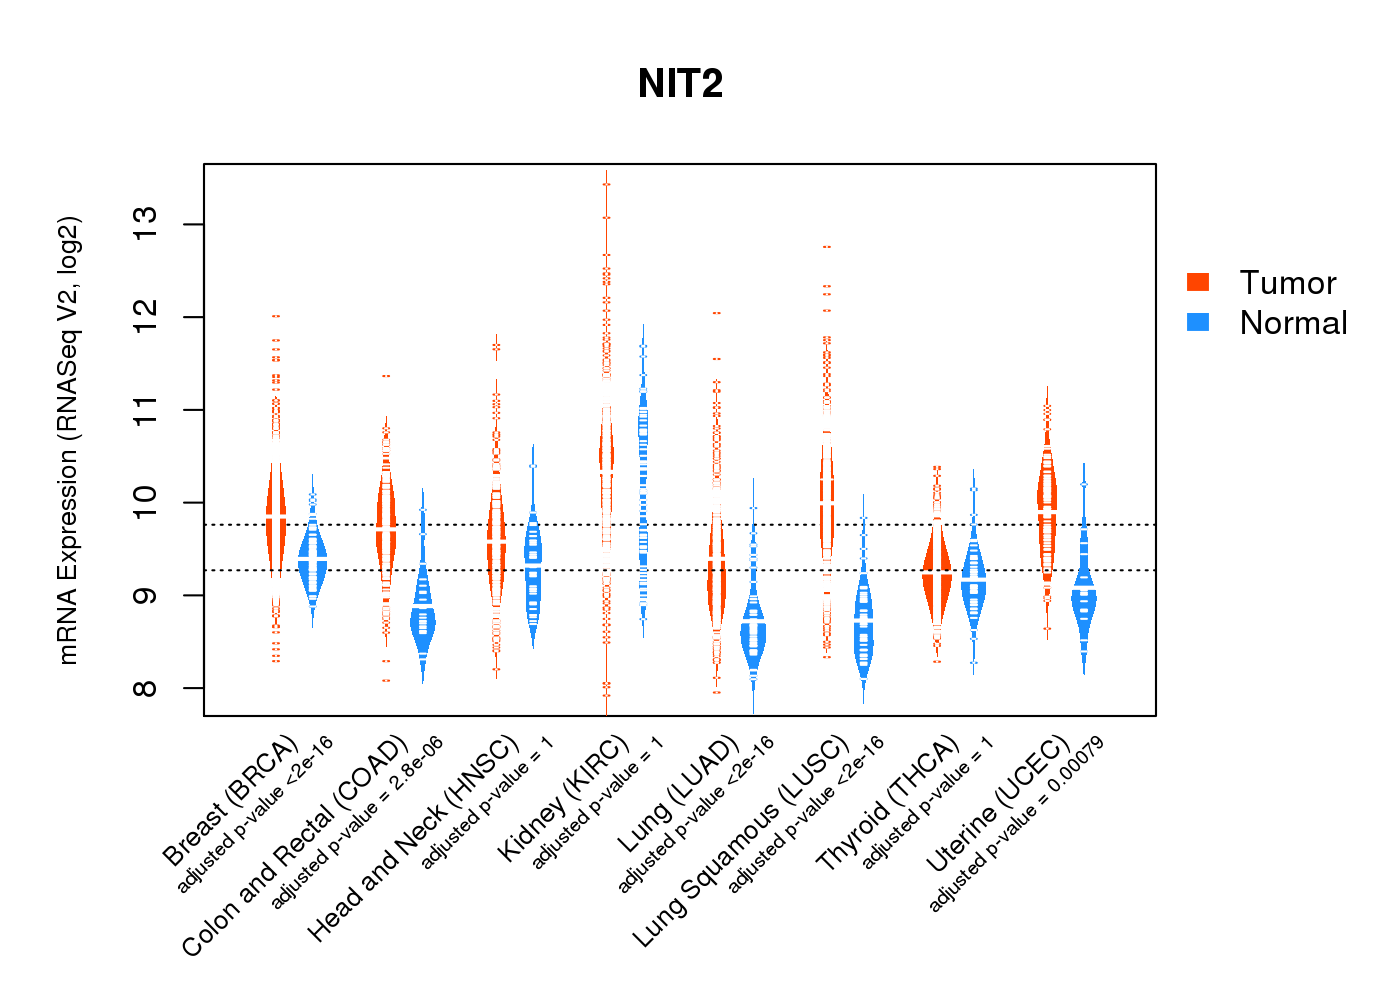 |
| Top |
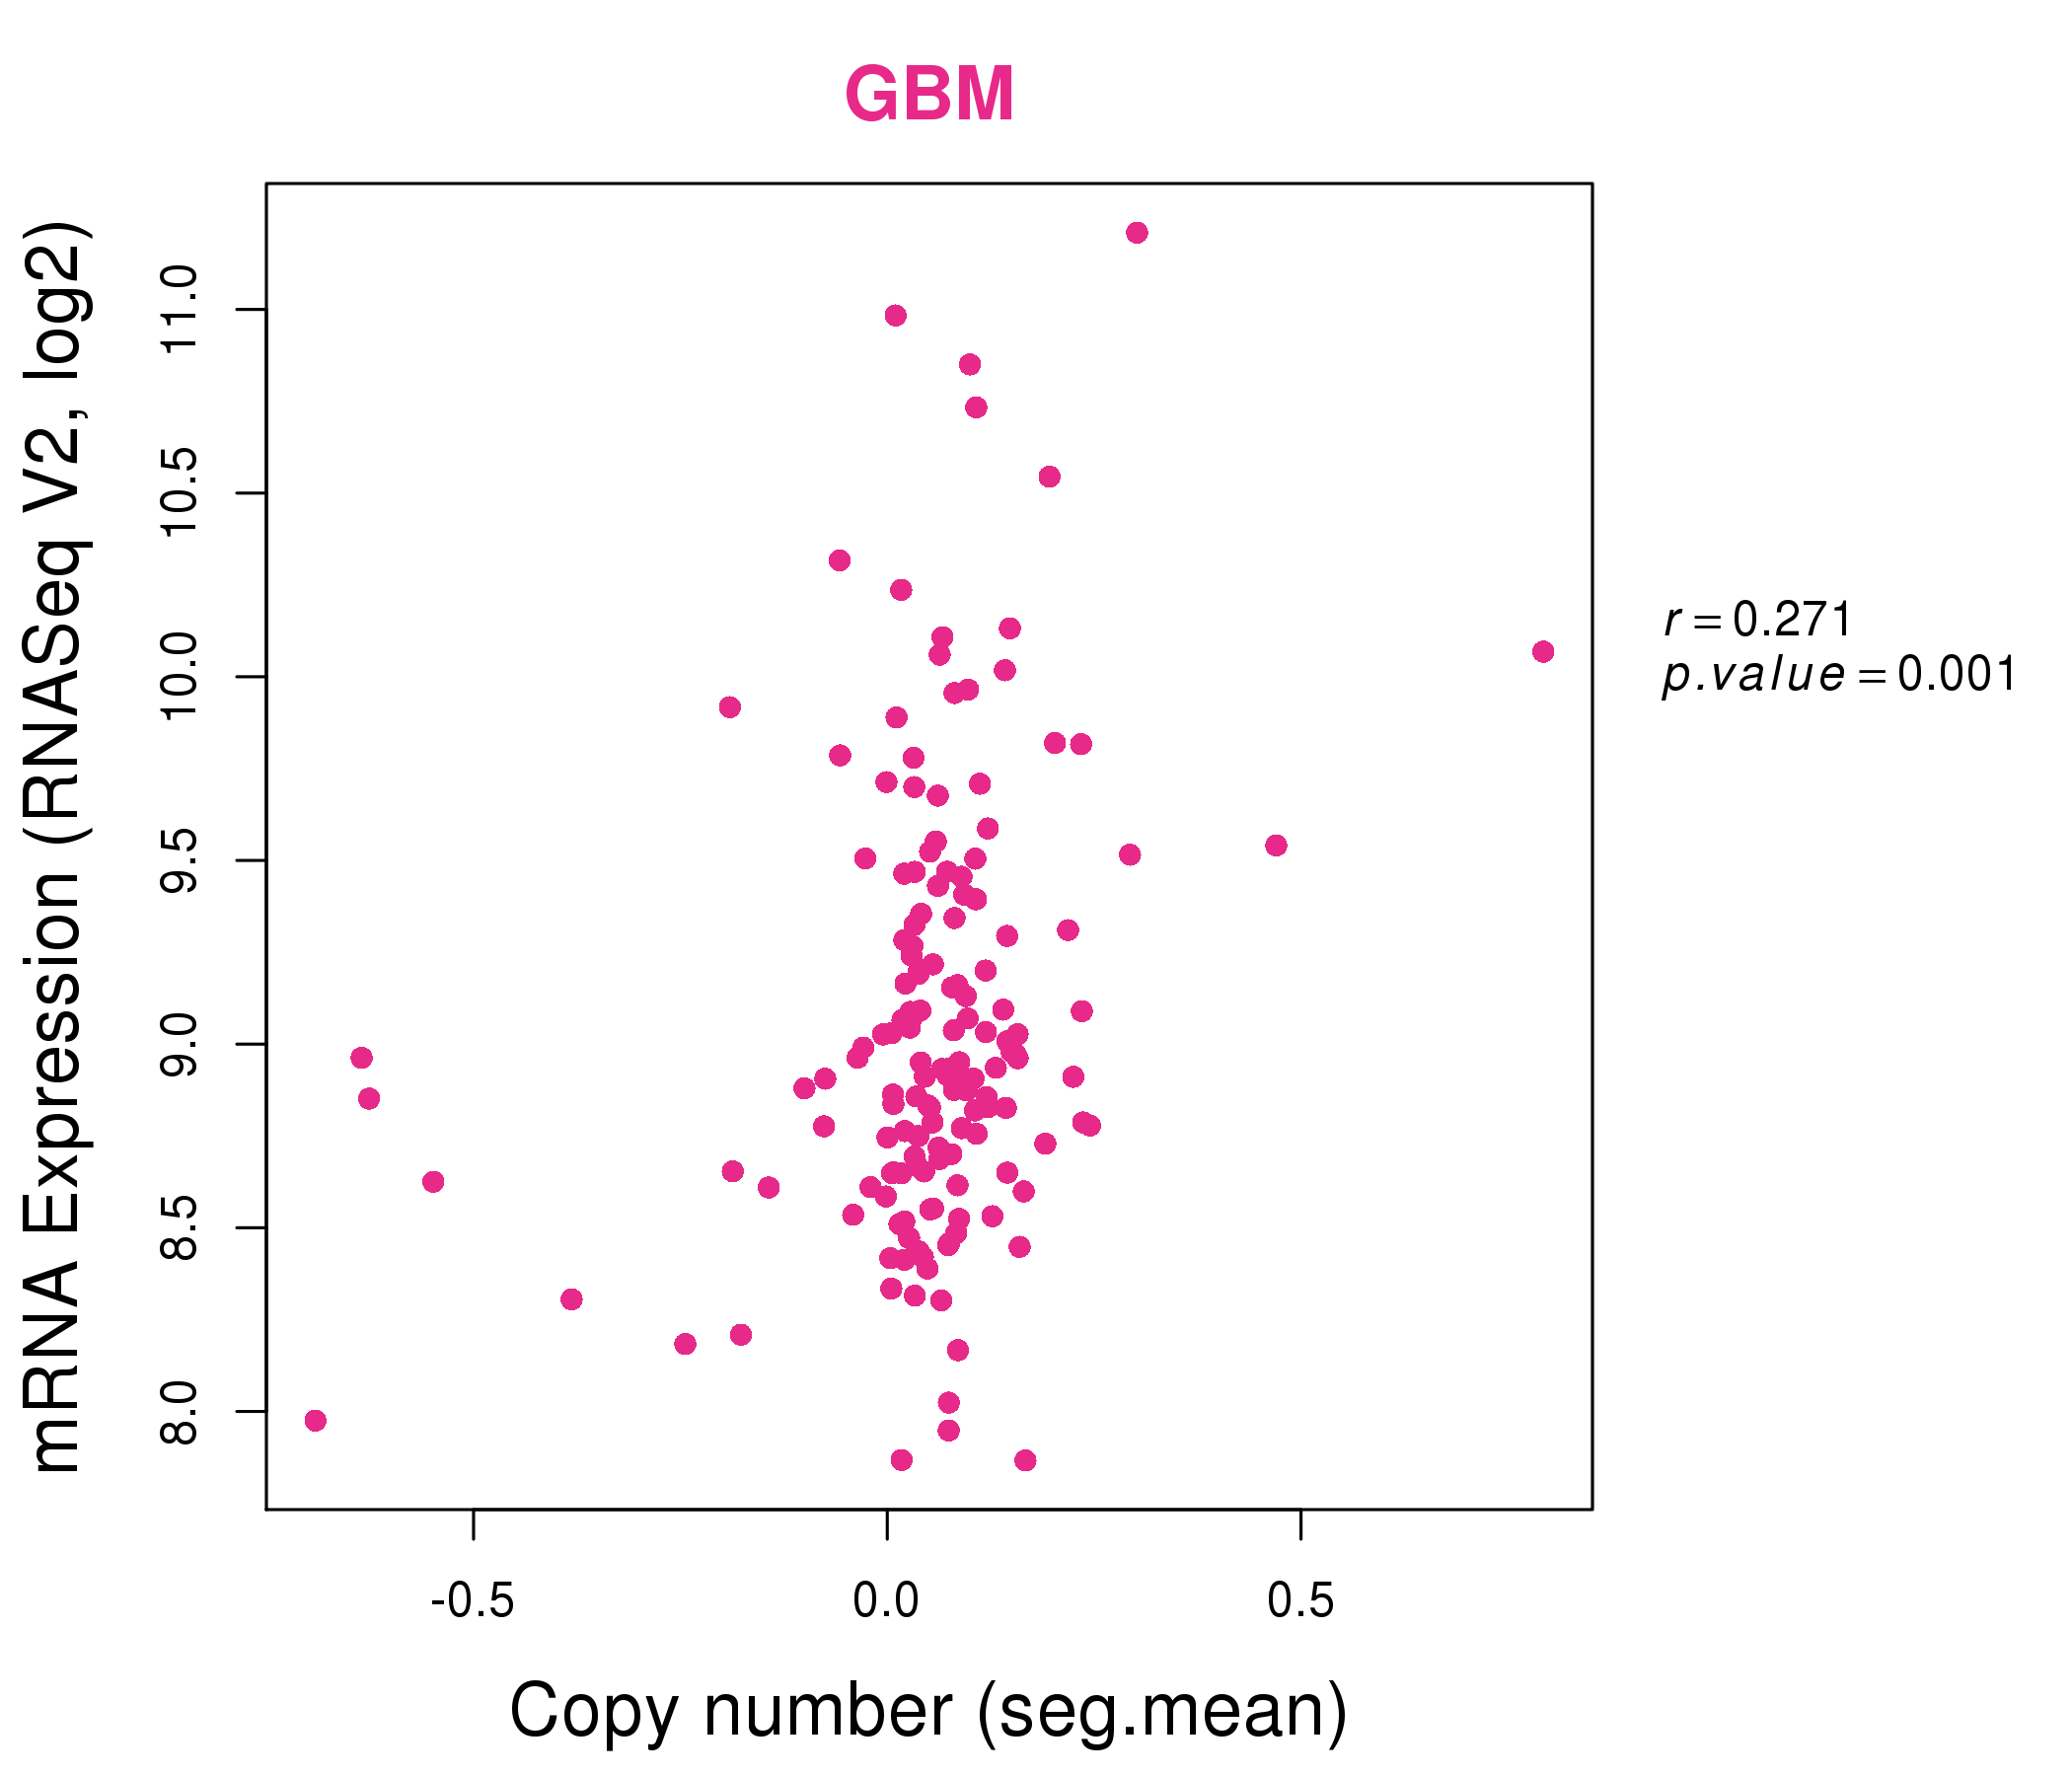
| * This plots show the correlation between CNV and gene expression. |
: Open all plots for all cancer types
 |
|
 |
|

| Top |
| Gene-Gene Network Information |
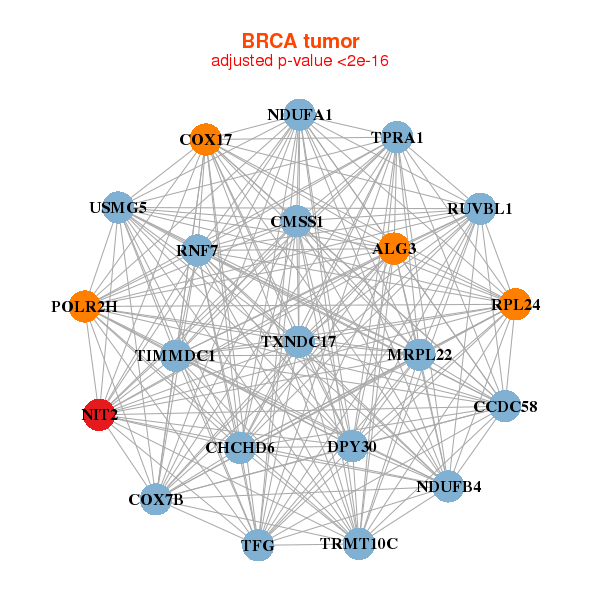
| * Co-Expression network figures were drawn using R package igraph. Only the top 20 genes with the highest correlations were shown. Red circle: input gene, orange circle: cell metabolism gene, sky circle: other gene |
: Open all plots for all cancer types
 |
|
| ALG3,TIMMDC1,CMSS1,CCDC58,CHCHD6,COX17,COX7B, DPY30,MRPL22,NDUFA1,NDUFB4,NIT2,POLR2H,TRMT10C, RNF7,RPL24,RUVBL1,TFG,TPRA1,TXNDC17,USMG5 | ACSM2B,AMN,APOC3,BMP3,TBATA,IZUMO4,DCXR, EIF4EBP1,GCDH,MPST,NIT2,PCBD1,PCYT2,PDZD7, PMM1,PXMP2,SNORA14A,ST8SIA3,TH,TMEM120A,TTC36 |
 |
|
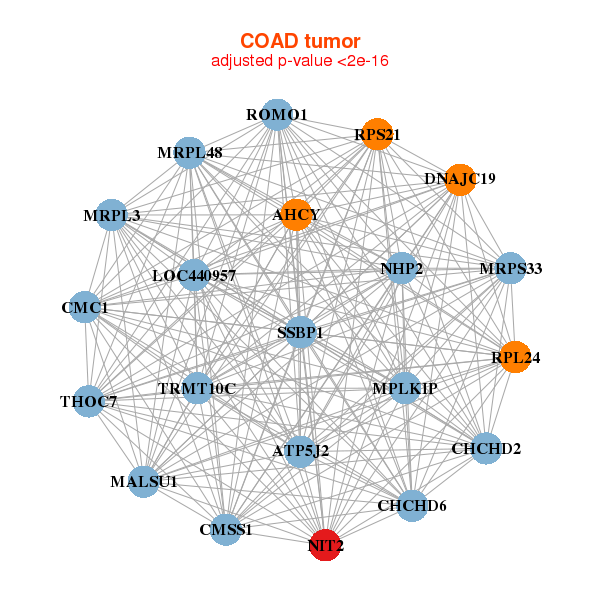
| AHCY,ATP5J2,CMSS1,MPLKIP,MALSU1,CHCHD2,CHCHD6, CMC1,DNAJC19,LOC440957,MRPL3,MRPL48,MRPS33,NHP2, NIT2,TRMT10C,ROMO1,RPL24,RPS21,SSBP1,THOC7 | ACN9,DTD2,C1QBP,TMEM261,CCNC,DCTPP1,MRPL11, MRPL32,MRPS22,MRPS28,MRPS35,NIT2,NME2,RPS18, RPS6,TAF9,TMEM14B,TOMM22,TOMM6,UQCRH,WDR61 |
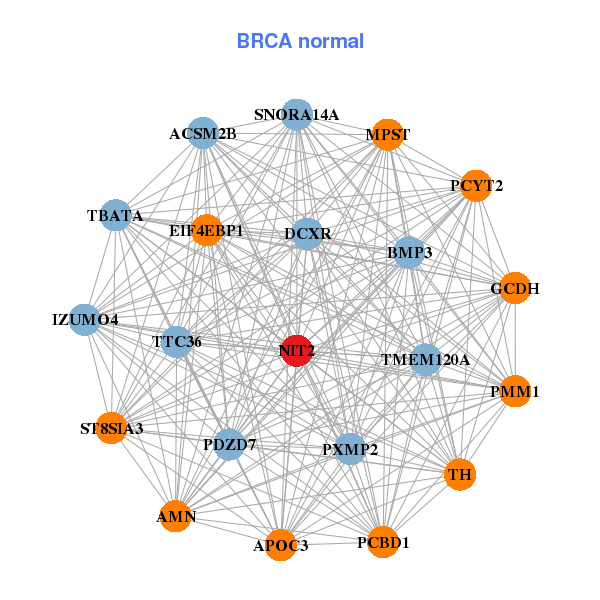
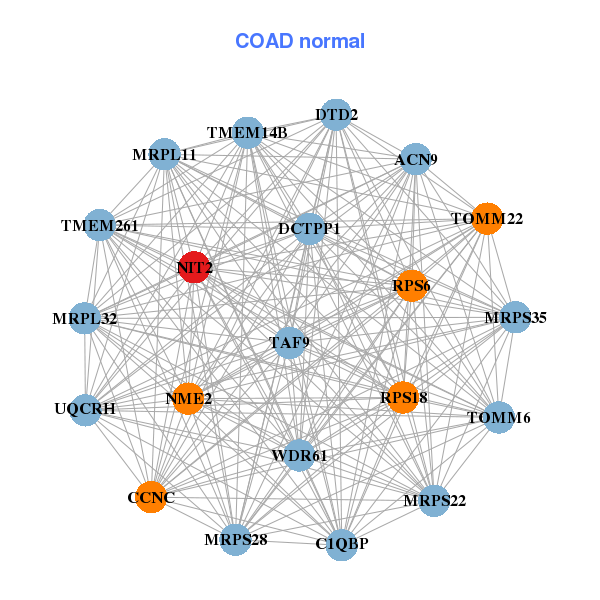
| * Co-Expression network figures were drawn using R package igraph. Only the top 20 genes with the highest correlations were shown. Red circle: input gene, orange circle: cell metabolism gene, sky circle: other gene |
: Open all plots for all cancer types
| Top |
: Open all interacting genes' information including KEGG pathway for all interacting genes from DAVID
| Top |
| Pharmacological Information for NIT2 |
| There's no related Drug. |
| Top |
| Cross referenced IDs for NIT2 |
| * We obtained these cross-references from Uniprot database. It covers 150 different DBs, 18 categories. http://www.uniprot.org/help/cross_references_section |
: Open all cross reference information
|
Copyright © 2016-Present - The Univsersity of Texas Health Science Center at Houston @ |