|
||||||||||||||||||||||||||||||||||||||||||||||||||||||||||||||||||||||||||||||||||||||||||||||||||||||||||||||||||||||||||||||||||||||||||||||||||||||||||||||||||||||||||||||||||||||||||||||||||||||||||||||||||||||||||||||||||||||||||||||||||||||||||||||||||||||||||||||||||||||||||||||||||||||||||||||||||||||||||
| |
| Phenotypic Information (metabolism pathway, cancer, disease, phenome) |
| |
| |
| Gene-Gene Network Information: Co-Expression Network, Interacting Genes & KEGG |
| |
|


| Gene Summary for PSMC1 |
| Basic gene info. | Gene symbol | PSMC1 |
| Gene name | proteasome (prosome, macropain) 26S subunit, ATPase, 1 | |
| Synonyms | P26S4|S4|p56 | |
| Cytomap | UCSC genome browser: 14q32.11 | |
| Genomic location | chr14 :90722893-90738966 | |
| Type of gene | protein-coding | |
| RefGenes | NM_002802.2, | |
| Ensembl id | ENSG00000100764 | |
| Description | 26S protease regulatory subunit 426S proteasome AAA-ATPase subunit RPT2proteasome 26S ATPase subunit 1proteasome 26S subunit ATPase 1proteasome 26S subunit, ATPase, 1 | |
| Modification date | 20141207 | |
| dbXrefs | MIM : 602706 | |
| HGNC : HGNC | ||
| Ensembl : ENSG00000100764 | ||
| HPRD : 04084 | ||
| Vega : OTTHUMG00000171019 | ||
| Protein | UniProt: P62191 go to UniProt's Cross Reference DB Table | |
| Expression | CleanEX: HS_PSMC1 | |
| BioGPS: 5700 | ||
| Gene Expression Atlas: ENSG00000100764 | ||
| The Human Protein Atlas: ENSG00000100764 | ||
| Pathway | NCI Pathway Interaction Database: PSMC1 | |
| KEGG: PSMC1 | ||
| REACTOME: PSMC1 | ||
| ConsensusPathDB | ||
| Pathway Commons: PSMC1 | ||
| Metabolism | MetaCyc: PSMC1 | |
| HUMANCyc: PSMC1 | ||
| Regulation | Ensembl's Regulation: ENSG00000100764 | |
| miRBase: chr14 :90,722,893-90,738,966 | ||
| TargetScan: NM_002802 | ||
| cisRED: ENSG00000100764 | ||
| Context | iHOP: PSMC1 | |
| cancer metabolism search in PubMed: PSMC1 | ||
| UCL Cancer Institute: PSMC1 | ||
| Assigned class in ccmGDB | B - This gene belongs to cancer gene. | |
| Top |
| Phenotypic Information for PSMC1(metabolism pathway, cancer, disease, phenome) |
| Cancer | CGAP: PSMC1 |
| Familial Cancer Database: PSMC1 | |
| * This gene is included in those cancer gene databases. |
|
|
|
|
|
| . | ||||||||||||||||||||||||||||||||||||||||||||||||||||||||||||||||||||||||||||||||||||||||||||||||||||||||||||||||||||||||||||||||||||||||||||||||||||||||||||||||||||||||||||||||||||||||||||||||||||||||||||||||||||||||||||||||||||||||||||||||||||||||||||||||||||||||||||||||||||||||||||||||||||||||||||||||||||
Oncogene 1 | Significant driver gene in | |||||||||||||||||||||||||||||||||||||||||||||||||||||||||||||||||||||||||||||||||||||||||||||||||||||||||||||||||||||||||||||||||||||||||||||||||||||||||||||||||||||||||||||||||||||||||||||||||||||||||||||||||||||||||||||||||||||||||||||||||||||||||||||||||||||||||||||||||||||||||||||||||||||||||||||||||||||||||
| cf) number; DB name 1 Oncogene; http://nar.oxfordjournals.org/content/35/suppl_1/D721.long, 2 Tumor Suppressor gene; https://bioinfo.uth.edu/TSGene/, 3 Cancer Gene Census; http://www.nature.com/nrc/journal/v4/n3/abs/nrc1299.html, 4 CancerGenes; http://nar.oxfordjournals.org/content/35/suppl_1/D721.long, 5 Network of Cancer Gene; http://ncg.kcl.ac.uk/index.php, 1Therapeutic Vulnerabilities in Cancer; http://cbio.mskcc.org/cancergenomics/statius/ |
| REACTOME_METABOLISM_OF_AMINO_ACIDS_AND_DERIVATIVES REACTOME_METABOLISM_OF_MRNA REACTOME_METABOLISM_OF_RNA | |
| OMIM | 602706; gene. |
| Orphanet | |
| Disease | KEGG Disease: PSMC1 |
| MedGen: PSMC1 (Human Medical Genetics with Condition) | |
| ClinVar: PSMC1 | |
| Phenotype | MGI: PSMC1 (International Mouse Phenotyping Consortium) |
| PhenomicDB: PSMC1 | |
| Mutations for PSMC1 |
| * Under tables are showing count per each tissue to give us broad intuition about tissue specific mutation patterns.You can go to the detailed page for each mutation database's web site. |
| - Statistics for Tissue and Mutation type | Top |
 |
| - For Inter-chromosomal Variations |
| There's no inter-chromosomal structural variation. |
| - For Intra-chromosomal Variations |
| * Intra-chromosomal variantions includes 'intrachromosomal amplicon to amplicon', 'intrachromosomal amplicon to non-amplified dna', 'intrachromosomal deletion', 'intrachromosomal fold-back inversion', 'intrachromosomal inversion', 'intrachromosomal tandem duplication', 'Intrachromosomal unknown type', 'intrachromosomal with inverted orientation', 'intrachromosomal with non-inverted orientation'. |
 |
| Sample | Symbol_a | Chr_a | Start_a | End_a | Symbol_b | Chr_b | Start_b | End_b |
| pancreas | PSMC1 | chr14 | 90732307 | 90732327 | PSMC1 | chr14 | 90734677 | 90734697 |
| cf) Tissue number; Tissue name (1;Breast, 2;Central_nervous_system, 3;Haematopoietic_and_lymphoid_tissue, 4;Large_intestine, 5;Liver, 6;Lung, 7;Ovary, 8;Pancreas, 9;Prostate, 10;Skin, 11;Soft_tissue, 12;Upper_aerodigestive_tract) |
| * From mRNA Sanger sequences, Chitars2.0 arranged chimeric transcripts. This table shows PSMC1 related fusion information. |
| ID | Head Gene | Tail Gene | Accession | Gene_a | qStart_a | qEnd_a | Chromosome_a | tStart_a | tEnd_a | Gene_a | qStart_a | qEnd_a | Chromosome_a | tStart_a | tEnd_a |
| DB102097 | PSMC1 | 1 | 469 | 14 | 90722906 | 90730159 | SYTL1 | 470 | 551 | 1 | 27673966 | 27674047 | |
| Top |
| Mutation type/ Tissue ID | brca | cns | cerv | endome | haematopo | kidn | Lintest | liver | lung | ns | ovary | pancre | prost | skin | stoma | thyro | urina | |||
| Total # sample | 1 | 1 | ||||||||||||||||||
| GAIN (# sample) | ||||||||||||||||||||
| LOSS (# sample) | 1 | 1 |
| cf) Tissue ID; Tissue type (1; Breast, 2; Central_nervous_system, 3; Cervix, 4; Endometrium, 5; Haematopoietic_and_lymphoid_tissue, 6; Kidney, 7; Large_intestine, 8; Liver, 9; Lung, 10; NS, 11; Ovary, 12; Pancreas, 13; Prostate, 14; Skin, 15; Stomach, 16; Thyroid, 17; Urinary_tract) |
| Top |
|
 |
| Top |
| Stat. for Non-Synonymous SNVs (# total SNVs=19) | (# total SNVs=6) |
 |  |
(# total SNVs=1) | (# total SNVs=0) |
 |
| Top |
| * When you move the cursor on each content, you can see more deailed mutation information on the Tooltip. Those are primary_site,primary_histology,mutation(aa),pubmedID. |
| GRCh37 position | Mutation(aa) | Unique sampleID count |
| chr14:90735826-90735826 | p.G323R | 2 |
| chr14:90735856-90735856 | p.R333R | 2 |
| chr14:90731418-90731418 | p.S200F | 1 |
| chr14:90735763-90735763 | p.E302Q | 1 |
| chr14:90730089-90730089 | p.A121A | 1 |
| chr14:90731460-90731460 | p.M214fs*3 | 1 |
| chr14:90735804-90735804 | p.Q315H | 1 |
| chr14:90725506-90725506 | p.G2G | 1 |
| chr14:90730104-90730104 | p.S126S | 1 |
| chr14:90731462-90731462 | p.G215S | 1 |
| Top |
|
 |
| Point Mutation/ Tissue ID | 1 | 2 | 3 | 4 | 5 | 6 | 7 | 8 | 9 | 10 | 11 | 12 | 13 | 14 | 15 | 16 | 17 | 18 | 19 | 20 |
| # sample | 1 | 4 | 1 | 1 | 2 | 1 | 2 | 6 | 7 | |||||||||||
| # mutation | 1 | 4 | 1 | 1 | 2 | 1 | 2 | 6 | 8 | |||||||||||
| nonsynonymous SNV | 1 | 4 | 1 | 1 | 1 | 1 | 6 | 7 | ||||||||||||
| synonymous SNV | 1 | 1 | 1 | 1 |
| cf) Tissue ID; Tissue type (1; BLCA[Bladder Urothelial Carcinoma], 2; BRCA[Breast invasive carcinoma], 3; CESC[Cervical squamous cell carcinoma and endocervical adenocarcinoma], 4; COAD[Colon adenocarcinoma], 5; GBM[Glioblastoma multiforme], 6; Glioma Low Grade, 7; HNSC[Head and Neck squamous cell carcinoma], 8; KICH[Kidney Chromophobe], 9; KIRC[Kidney renal clear cell carcinoma], 10; KIRP[Kidney renal papillary cell carcinoma], 11; LAML[Acute Myeloid Leukemia], 12; LUAD[Lung adenocarcinoma], 13; LUSC[Lung squamous cell carcinoma], 14; OV[Ovarian serous cystadenocarcinoma ], 15; PAAD[Pancreatic adenocarcinoma], 16; PRAD[Prostate adenocarcinoma], 17; SKCM[Skin Cutaneous Melanoma], 18:STAD[Stomach adenocarcinoma], 19:THCA[Thyroid carcinoma], 20:UCEC[Uterine Corpus Endometrial Carcinoma]) |
| Top |
| * We represented just top 10 SNVs. When you move the cursor on each content, you can see more deailed mutation information on the Tooltip. Those are primary_site, primary_histology, mutation(aa), pubmedID. |
| Genomic Position | Mutation(aa) | Unique sampleID count |
| chr14:90735763 | p.G263V | 1 |
| chr14:90731418 | p.R268Q | 1 |
| chr14:90735804 | p.H277Y | 1 |
| chr14:90725526 | p.H9R | 1 |
| chr14:90731462 | p.P279L | 1 |
| chr14:90735888 | p.L65S | 1 |
| chr14:90729701 | p.G291W | 1 |
| chr14:90731474 | p.L102L | 1 |
| chr14:90736591 | p.G300S | 1 |
| chr14:90730032 | p.E113E | 1 |
| * Copy number data were extracted from TCGA using R package TCGA-Assembler. The URLs of all public data files on TCGA DCC data server were gathered on Jan-05-2015. Function ProcessCNAData in TCGA-Assembler package was used to obtain gene-level copy number value which is calculated as the average copy number of the genomic region of a gene. |
 |
| cf) Tissue ID[Tissue type]: BLCA[Bladder Urothelial Carcinoma], BRCA[Breast invasive carcinoma], CESC[Cervical squamous cell carcinoma and endocervical adenocarcinoma], COAD[Colon adenocarcinoma], GBM[Glioblastoma multiforme], Glioma Low Grade, HNSC[Head and Neck squamous cell carcinoma], KICH[Kidney Chromophobe], KIRC[Kidney renal clear cell carcinoma], KIRP[Kidney renal papillary cell carcinoma], LAML[Acute Myeloid Leukemia], LUAD[Lung adenocarcinoma], LUSC[Lung squamous cell carcinoma], OV[Ovarian serous cystadenocarcinoma ], PAAD[Pancreatic adenocarcinoma], PRAD[Prostate adenocarcinoma], SKCM[Skin Cutaneous Melanoma], STAD[Stomach adenocarcinoma], THCA[Thyroid carcinoma], UCEC[Uterine Corpus Endometrial Carcinoma] |
| Top |
| Gene Expression for PSMC1 |
| * CCLE gene expression data were extracted from CCLE_Expression_Entrez_2012-10-18.res: Gene-centric RMA-normalized mRNA expression data. |
 |
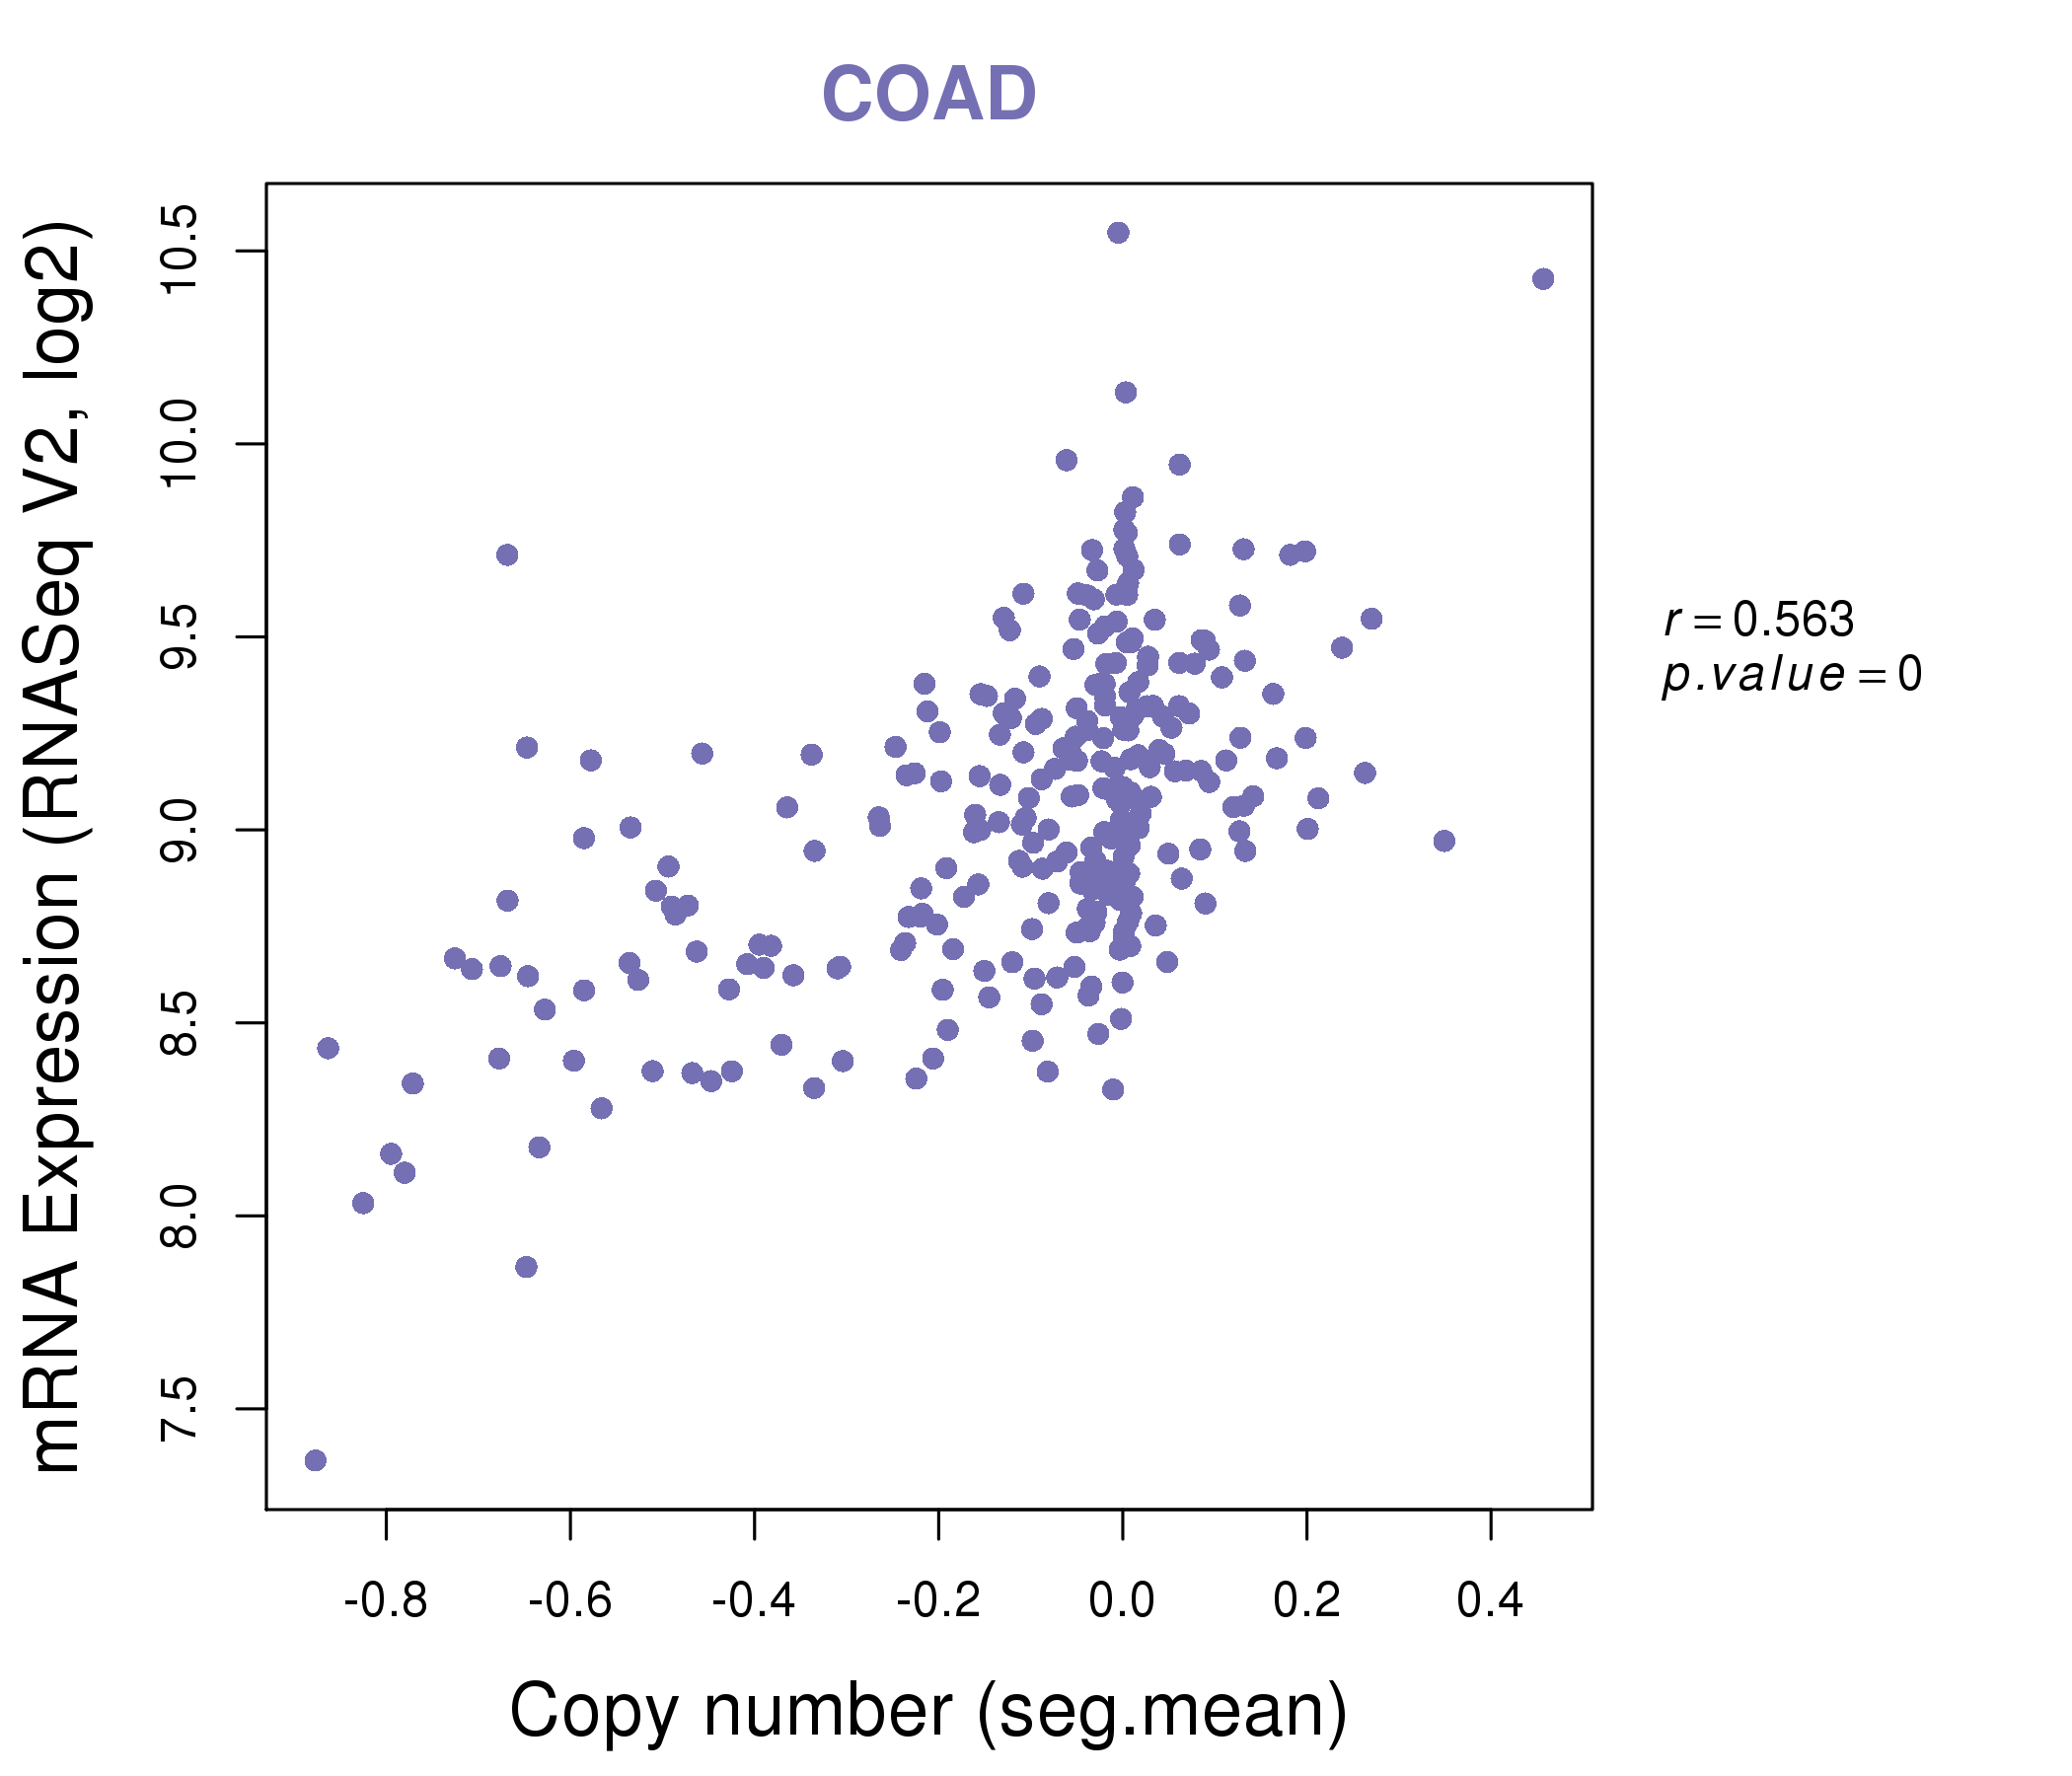
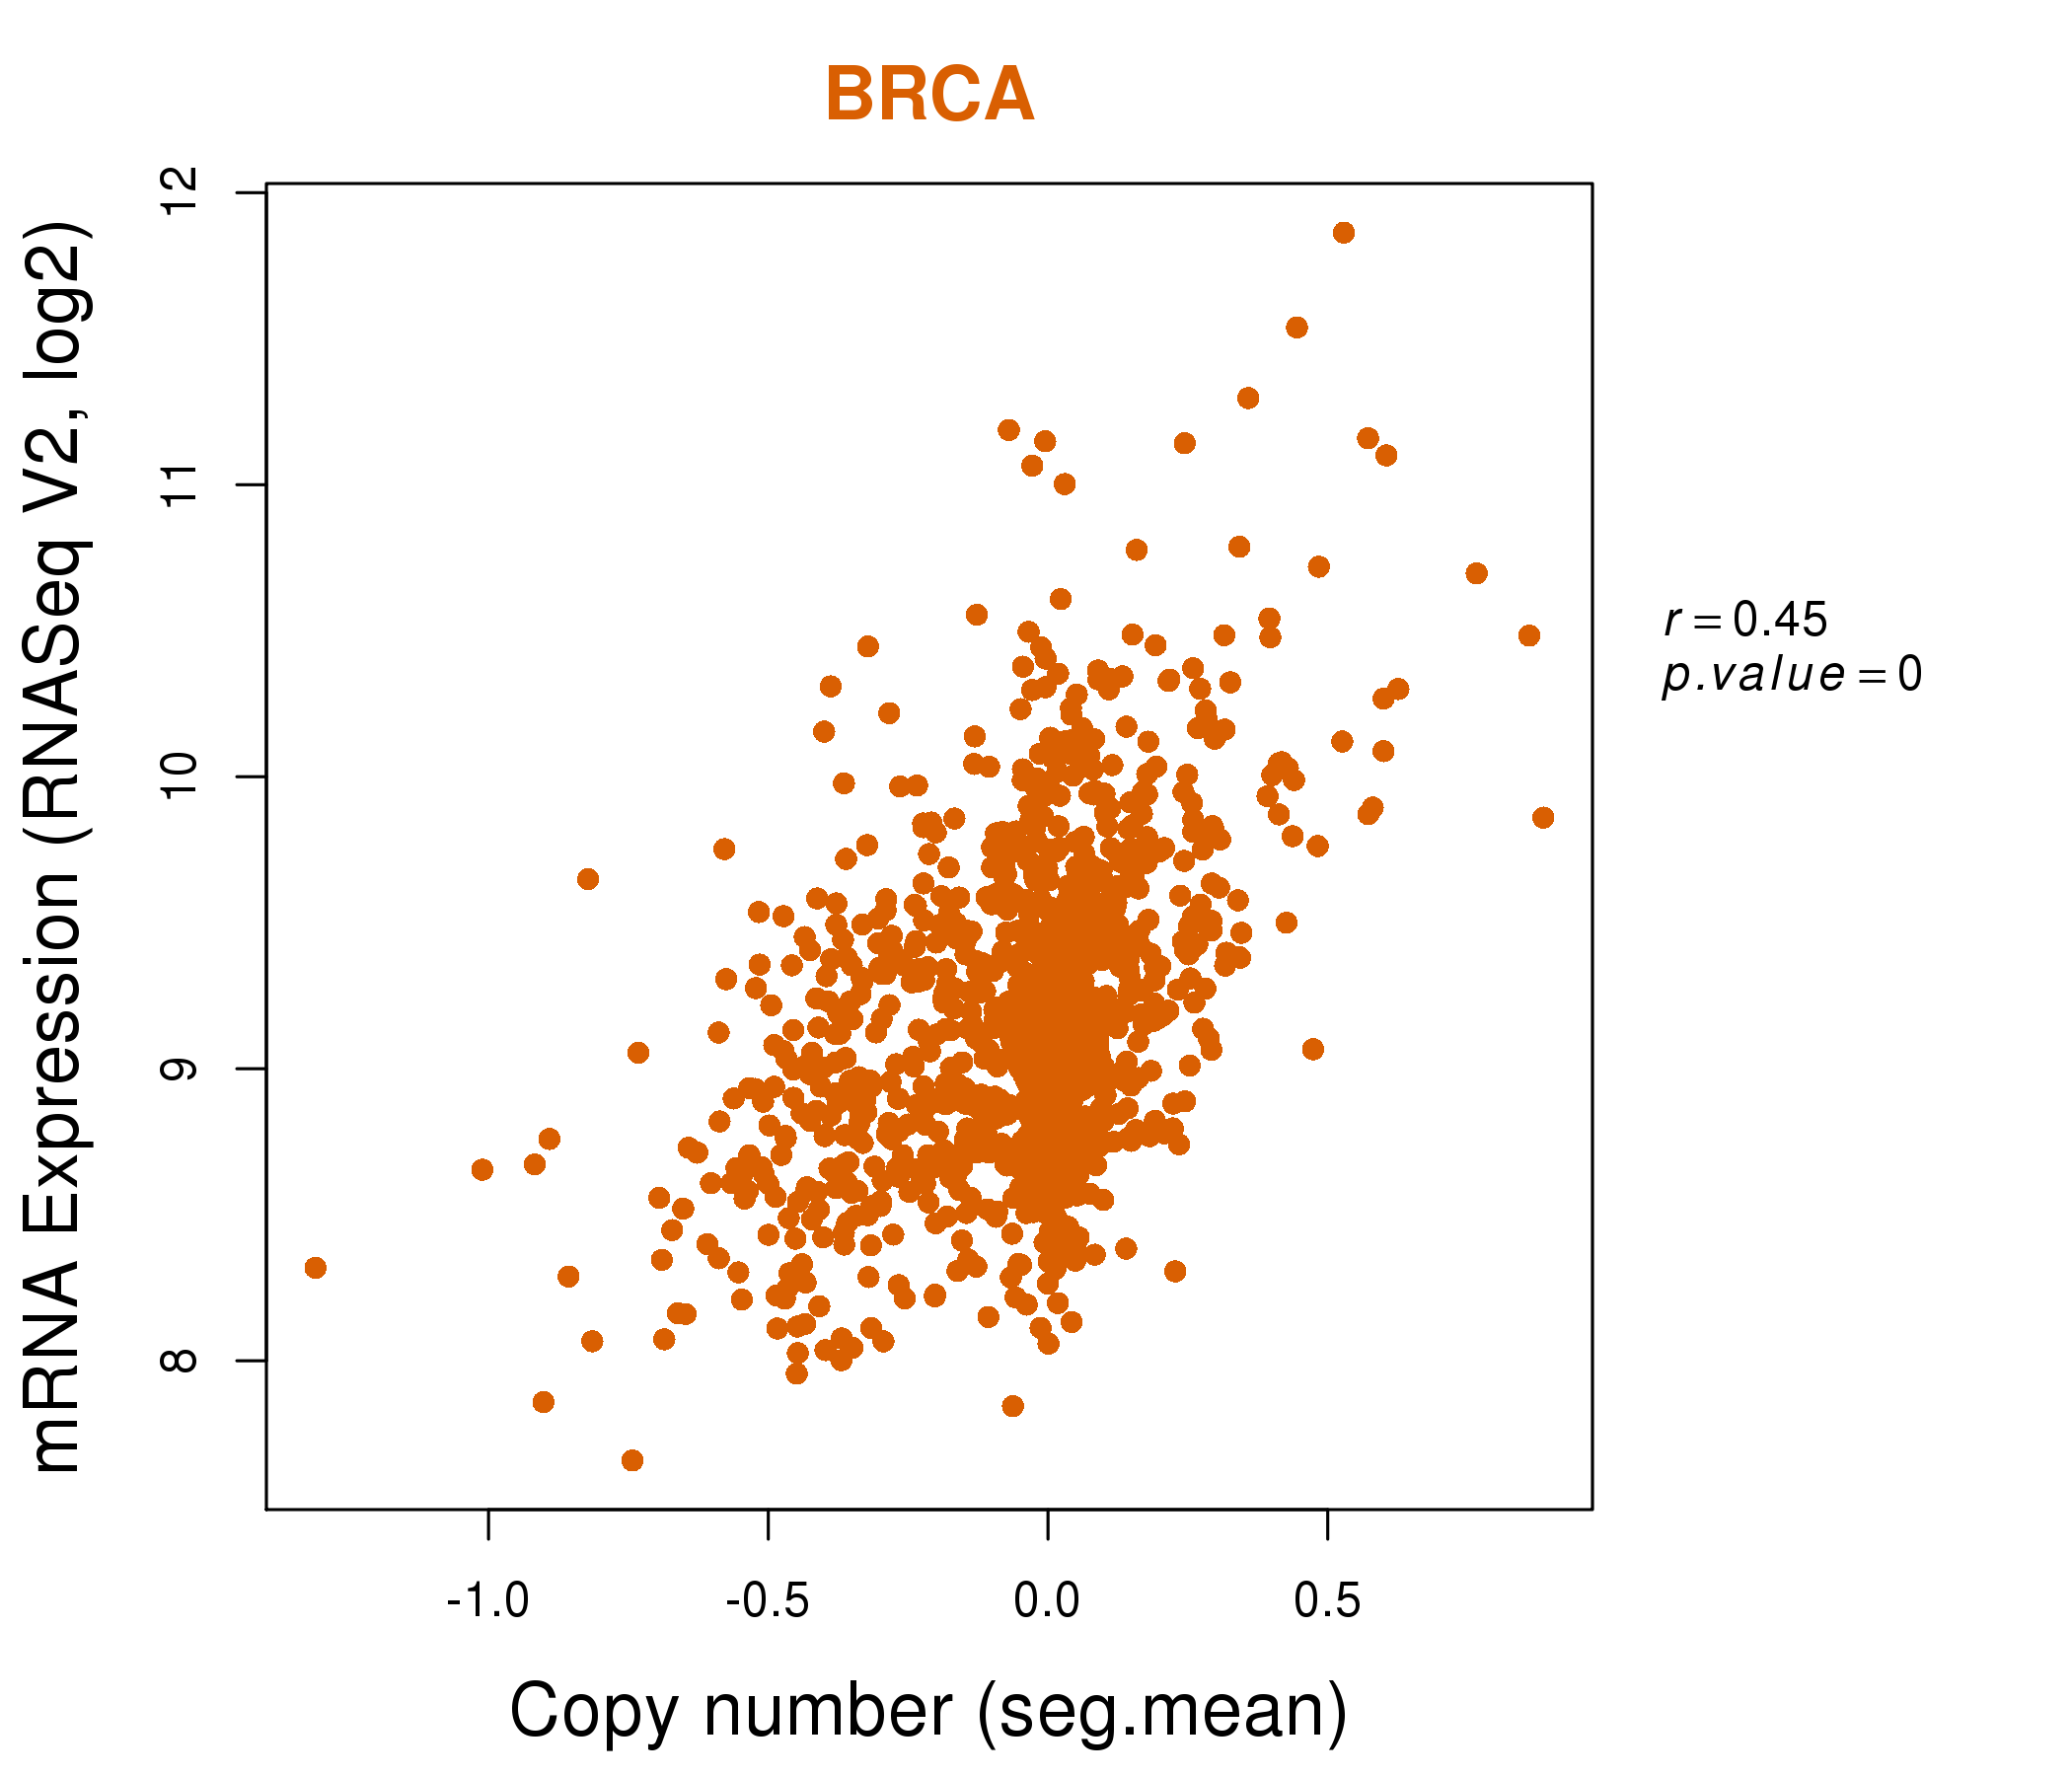
| * Normalized gene expression data of RNASeqV2 was extracted from TCGA using R package TCGA-Assembler. The URLs of all public data files on TCGA DCC data server were gathered at Jan-05-2015. Only eight cancer types have enough normal control samples for differential expression analysis. (t test, adjusted p<0.05 (using Benjamini-Hochberg FDR)) |
 |
| Top |
| * This plots show the correlation between CNV and gene expression. |
: Open all plots for all cancer types
 |
|
 |
|

| Top |
| Gene-Gene Network Information |
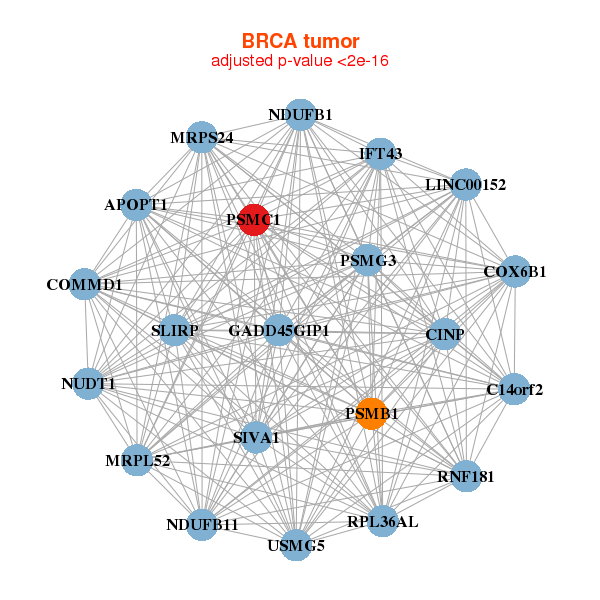
| * Co-Expression network figures were drawn using R package igraph. Only the top 20 genes with the highest correlations were shown. Red circle: input gene, orange circle: cell metabolism gene, sky circle: other gene |
: Open all plots for all cancer types
 |
|
| APOPT1,SLIRP,IFT43,C14orf2,CINP,COMMD1,COX6B1, GADD45GIP1,MRPL52,MRPS24,LINC00152,NDUFB11,NDUFB1,NUDT1, PSMB1,PSMC1,PSMG3,RNF181,RPL36AL,SIVA1,USMG5 | ATP5H,ATP5J,ATP6V1E1,COX14,APOPT1,MINOS1,SMIM20, FUNDC2,GTF3A,LOC150381,MRPL40,MSRB2,NDUFA12,NDUFA6, NDUFB1,PFDN1,PSMB1,PSMC1,SNAPIN,TTC1,YBX1 |
 |
|
| AHSA1,SLIRP,IFT43,C14orf2,CHMP4A,CINP,DHRS4L2, ERH,FKBP3,GLRX5,GSTZ1,MED6,NEDD8,NGDN, OSGEP,PSMA3,PSMA6,PSMB5,PSMC1,RPL36AL,SIVA1 | ANXA4,ARPC2,ATP5E,COX17,DERL2,GDI2,IL7, MRPS18C,PGAM1,PGAM4,POMP,PPP1R7,PRDX1,PSMC1, SEC61G,SF3B14,SHFM1,SOD1,SUGT1,SUMO1P3,TSPAN8 |
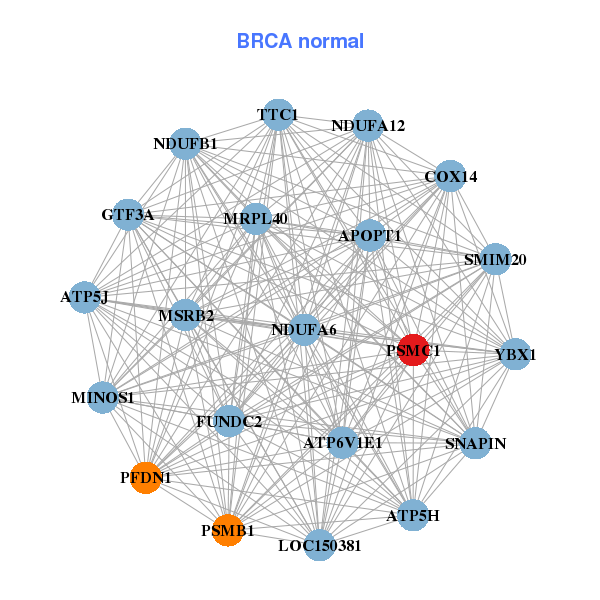
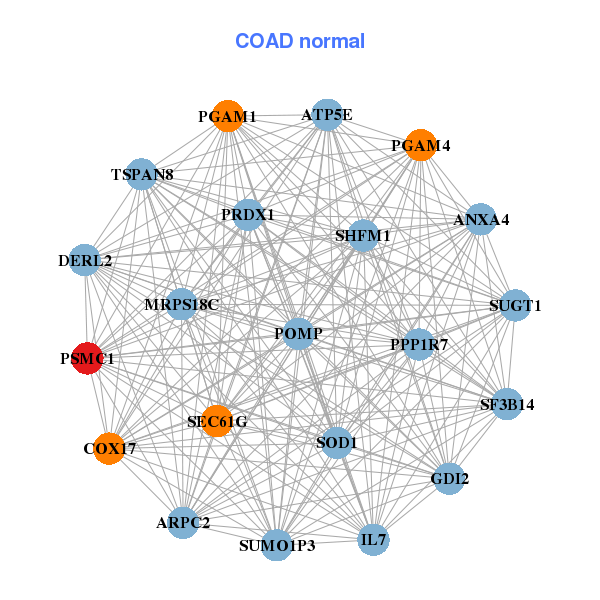
| * Co-Expression network figures were drawn using R package igraph. Only the top 20 genes with the highest correlations were shown. Red circle: input gene, orange circle: cell metabolism gene, sky circle: other gene |
: Open all plots for all cancer types
| Top |
: Open all interacting genes' information including KEGG pathway for all interacting genes from DAVID
| Top |
| Pharmacological Information for PSMC1 |
| There's no related Drug. |
| Top |
| Cross referenced IDs for PSMC1 |
| * We obtained these cross-references from Uniprot database. It covers 150 different DBs, 18 categories. http://www.uniprot.org/help/cross_references_section |
: Open all cross reference information
|
Copyright © 2016-Present - The Univsersity of Texas Health Science Center at Houston @ |