|
||||||||||||||||||||
| |
| Phenotypic Information (metabolism pathway, cancer, disease, phenome) |
| |
| |
| Gene-Gene Network Information: Co-Expression Network, Interacting Genes & KEGG |
| |
|


| Gene Summary for PSMC2 |
| Basic gene info. | Gene symbol | PSMC2 |
| Gene name | proteasome (prosome, macropain) 26S subunit, ATPase, 2 | |
| Synonyms | MSS1|Nbla10058|S7 | |
| Cytomap | UCSC genome browser: 7q22.1-q22.3 | |
| Genomic location | chr7 :102987970-103002914 | |
| Type of gene | protein-coding | |
| RefGenes | NM_001204453.1, NM_002803.3, | |
| Ensembl id | ENSG00000161057 | |
| Description | 26S protease regulatory subunit 726S proteasome AAA-ATPase subunit RPT1mammalian suppressor of sgv-1 of yeastprotease 26S subunit 7proteasome 26S subunit ATPase 2proteasome 26S subunit, ATPase, 2putative protein product of Nbla10058 | |
| Modification date | 20141207 | |
| dbXrefs | MIM : 154365 | |
| HGNC : HGNC | ||
| Ensembl : ENSG00000161057 | ||
| HPRD : 01105 | ||
| Vega : OTTHUMG00000157206 | ||
| Protein | UniProt: P35998 go to UniProt's Cross Reference DB Table | |
| Expression | CleanEX: HS_PSMC2 | |
| BioGPS: 5701 | ||
| Gene Expression Atlas: ENSG00000161057 | ||
| The Human Protein Atlas: ENSG00000161057 | ||
| Pathway | NCI Pathway Interaction Database: PSMC2 | |
| KEGG: PSMC2 | ||
| REACTOME: PSMC2 | ||
| ConsensusPathDB | ||
| Pathway Commons: PSMC2 | ||
| Metabolism | MetaCyc: PSMC2 | |
| HUMANCyc: PSMC2 | ||
| Regulation | Ensembl's Regulation: ENSG00000161057 | |
| miRBase: chr7 :102,987,970-103,002,914 | ||
| TargetScan: NM_001204453 | ||
| cisRED: ENSG00000161057 | ||
| Context | iHOP: PSMC2 | |
| cancer metabolism search in PubMed: PSMC2 | ||
| UCL Cancer Institute: PSMC2 | ||
| Assigned class in ccmGDB | B - This gene belongs to cancer gene. | |
| Top |
| Phenotypic Information for PSMC2(metabolism pathway, cancer, disease, phenome) |
| Cancer | CGAP: PSMC2 |
| Familial Cancer Database: PSMC2 | |
| * This gene is included in those cancer gene databases. |
|
|
|
|
|
| . | ||||||||||||||
Oncogene 1 | Significant driver gene in | |||||||||||||||||||
| cf) number; DB name 1 Oncogene; http://nar.oxfordjournals.org/content/35/suppl_1/D721.long, 2 Tumor Suppressor gene; https://bioinfo.uth.edu/TSGene/, 3 Cancer Gene Census; http://www.nature.com/nrc/journal/v4/n3/abs/nrc1299.html, 4 CancerGenes; http://nar.oxfordjournals.org/content/35/suppl_1/D721.long, 5 Network of Cancer Gene; http://ncg.kcl.ac.uk/index.php, 1Therapeutic Vulnerabilities in Cancer; http://cbio.mskcc.org/cancergenomics/statius/ |
| REACTOME_METABOLISM_OF_AMINO_ACIDS_AND_DERIVATIVES REACTOME_METABOLISM_OF_MRNA REACTOME_METABOLISM_OF_RNA | |
| OMIM | 154365; gene. |
| Orphanet | |
| Disease | KEGG Disease: PSMC2 |
| MedGen: PSMC2 (Human Medical Genetics with Condition) | |
| ClinVar: PSMC2 | |
| Phenotype | MGI: PSMC2 (International Mouse Phenotyping Consortium) |
| PhenomicDB: PSMC2 | |
| Mutations for PSMC2 |
| * Under tables are showing count per each tissue to give us broad intuition about tissue specific mutation patterns.You can go to the detailed page for each mutation database's web site. |
| There's no structural variation information in COSMIC data for this gene. |
| * From mRNA Sanger sequences, Chitars2.0 arranged chimeric transcripts. This table shows PSMC2 related fusion information. |
| ID | Head Gene | Tail Gene | Accession | Gene_a | qStart_a | qEnd_a | Chromosome_a | tStart_a | tEnd_a | Gene_a | qStart_a | qEnd_a | Chromosome_a | tStart_a | tEnd_a |
| BM983260 | PSMC2 | 18 | 75 | 7 | 103008545 | 103008602 | PSMC2 | 73 | 229 | 7 | 103008158 | 103008401 | |
| DA326202 | PSMC2 | 2 | 223 | 7 | 102988112 | 102995381 | APC | 218 | 549 | 5 | 112177806 | 112178137 | |
| BF985831 | CGA | 17 | 290 | 6 | 87795224 | 87795497 | PSMC2 | 283 | 415 | 7 | 103008430 | 103008562 | |
| AU118024 | GTF3C4 | 2 | 323 | 9 | 135559279 | 135559600 | PSMC2 | 323 | 754 | 7 | 102988089 | 103002475 | |
| BQ315283 | PSMC2 | 7 | 379 | 7 | 103004625 | 103008013 | PTPRF | 374 | 428 | 1 | 44010784 | 44010838 | |
| Top |
| There's no copy number variation information in COSMIC data for this gene. |
| Top |
|
 |
| Top |
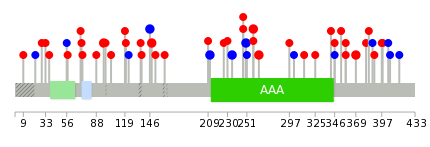
| Stat. for Non-Synonymous SNVs (# total SNVs=30) | (# total SNVs=13) |
 |  |
(# total SNVs=0) | (# total SNVs=0) |
| Top |
| * When you move the cursor on each content, you can see more deailed mutation information on the Tooltip. Those are primary_site,primary_histology,mutation(aa),pubmedID. |
| GRCh37 position | Mutation(aa) | Unique sampleID count |
| chr7:103004631-103004631 | p.G211G | 2 |
| chr7:103008218-103008218 | p.R369K | 2 |
| chr7:103004703-103004703 | p.A235A | 2 |
| chr7:103003148-103003148 | p.K146K | 2 |
| chr7:103004748-103004748 | p.V250V | 2 |
| chr7:103003152-103003152 | p.Q148E | 2 |
| chr7:102996218-102996218 | p.E90* | 2 |
| chr7:103006538-103006538 | p.R258C | 2 |
| chr7:102996237-102996237 | p.A96V | 2 |
| chr7:103006556-103006556 | p.A264P | 2 |
| Top |
|
 |
| Point Mutation/ Tissue ID | 1 | 2 | 3 | 4 | 5 | 6 | 7 | 8 | 9 | 10 | 11 | 12 | 13 | 14 | 15 | 16 | 17 | 18 | 19 | 20 |
| # sample | 5 | 1 | 2 | 5 | 4 | 4 | 1 | 2 | 4 | 2 | 7 | 4 | ||||||||
| # mutation | 11 | 1 | 2 | 5 | 4 | 4 | 1 | 2 | 4 | 2 | 7 | 4 | ||||||||
| nonsynonymous SNV | 8 | 1 | 3 | 3 | 2 | 2 | 4 | 2 | 5 | 3 | ||||||||||
| synonymous SNV | 3 | 1 | 1 | 2 | 1 | 2 | 1 | 2 | 1 |
| cf) Tissue ID; Tissue type (1; BLCA[Bladder Urothelial Carcinoma], 2; BRCA[Breast invasive carcinoma], 3; CESC[Cervical squamous cell carcinoma and endocervical adenocarcinoma], 4; COAD[Colon adenocarcinoma], 5; GBM[Glioblastoma multiforme], 6; Glioma Low Grade, 7; HNSC[Head and Neck squamous cell carcinoma], 8; KICH[Kidney Chromophobe], 9; KIRC[Kidney renal clear cell carcinoma], 10; KIRP[Kidney renal papillary cell carcinoma], 11; LAML[Acute Myeloid Leukemia], 12; LUAD[Lung adenocarcinoma], 13; LUSC[Lung squamous cell carcinoma], 14; OV[Ovarian serous cystadenocarcinoma ], 15; PAAD[Pancreatic adenocarcinoma], 16; PRAD[Prostate adenocarcinoma], 17; SKCM[Skin Cutaneous Melanoma], 18:STAD[Stomach adenocarcinoma], 19:THCA[Thyroid carcinoma], 20:UCEC[Uterine Corpus Endometrial Carcinoma]) |
| Top |
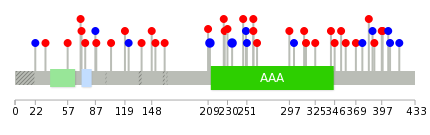
| * We represented just top 10 SNVs. When you move the cursor on each content, you can see more deailed mutation information on the Tooltip. Those are primary_site, primary_histology, mutation(aa), pubmedID. |
| Genomic Position | Mutation(aa) | Unique sampleID count |
| chr7:103004631 | p.A235A | 2 |
| chr7:103004703 | p.G211G | 2 |
| chr7:103003194 | p.A230P | 1 |
| chr7:103006539 | p.H358Y | 1 |
| chr7:103008218 | p.G71D,PSMC2 | 1 |
| chr7:102996164 | p.R369K | 1 |
| chr7:103004624 | p.L72M,PSMC2 | 1 |
| chr7:103006550 | p.Q247P | 1 |
| chr7:103008238 | p.L376L | 1 |
| chr7:102996176 | p.A76P,PSMC2 | 1 |
| * Copy number data were extracted from TCGA using R package TCGA-Assembler. The URLs of all public data files on TCGA DCC data server were gathered on Jan-05-2015. Function ProcessCNAData in TCGA-Assembler package was used to obtain gene-level copy number value which is calculated as the average copy number of the genomic region of a gene. |
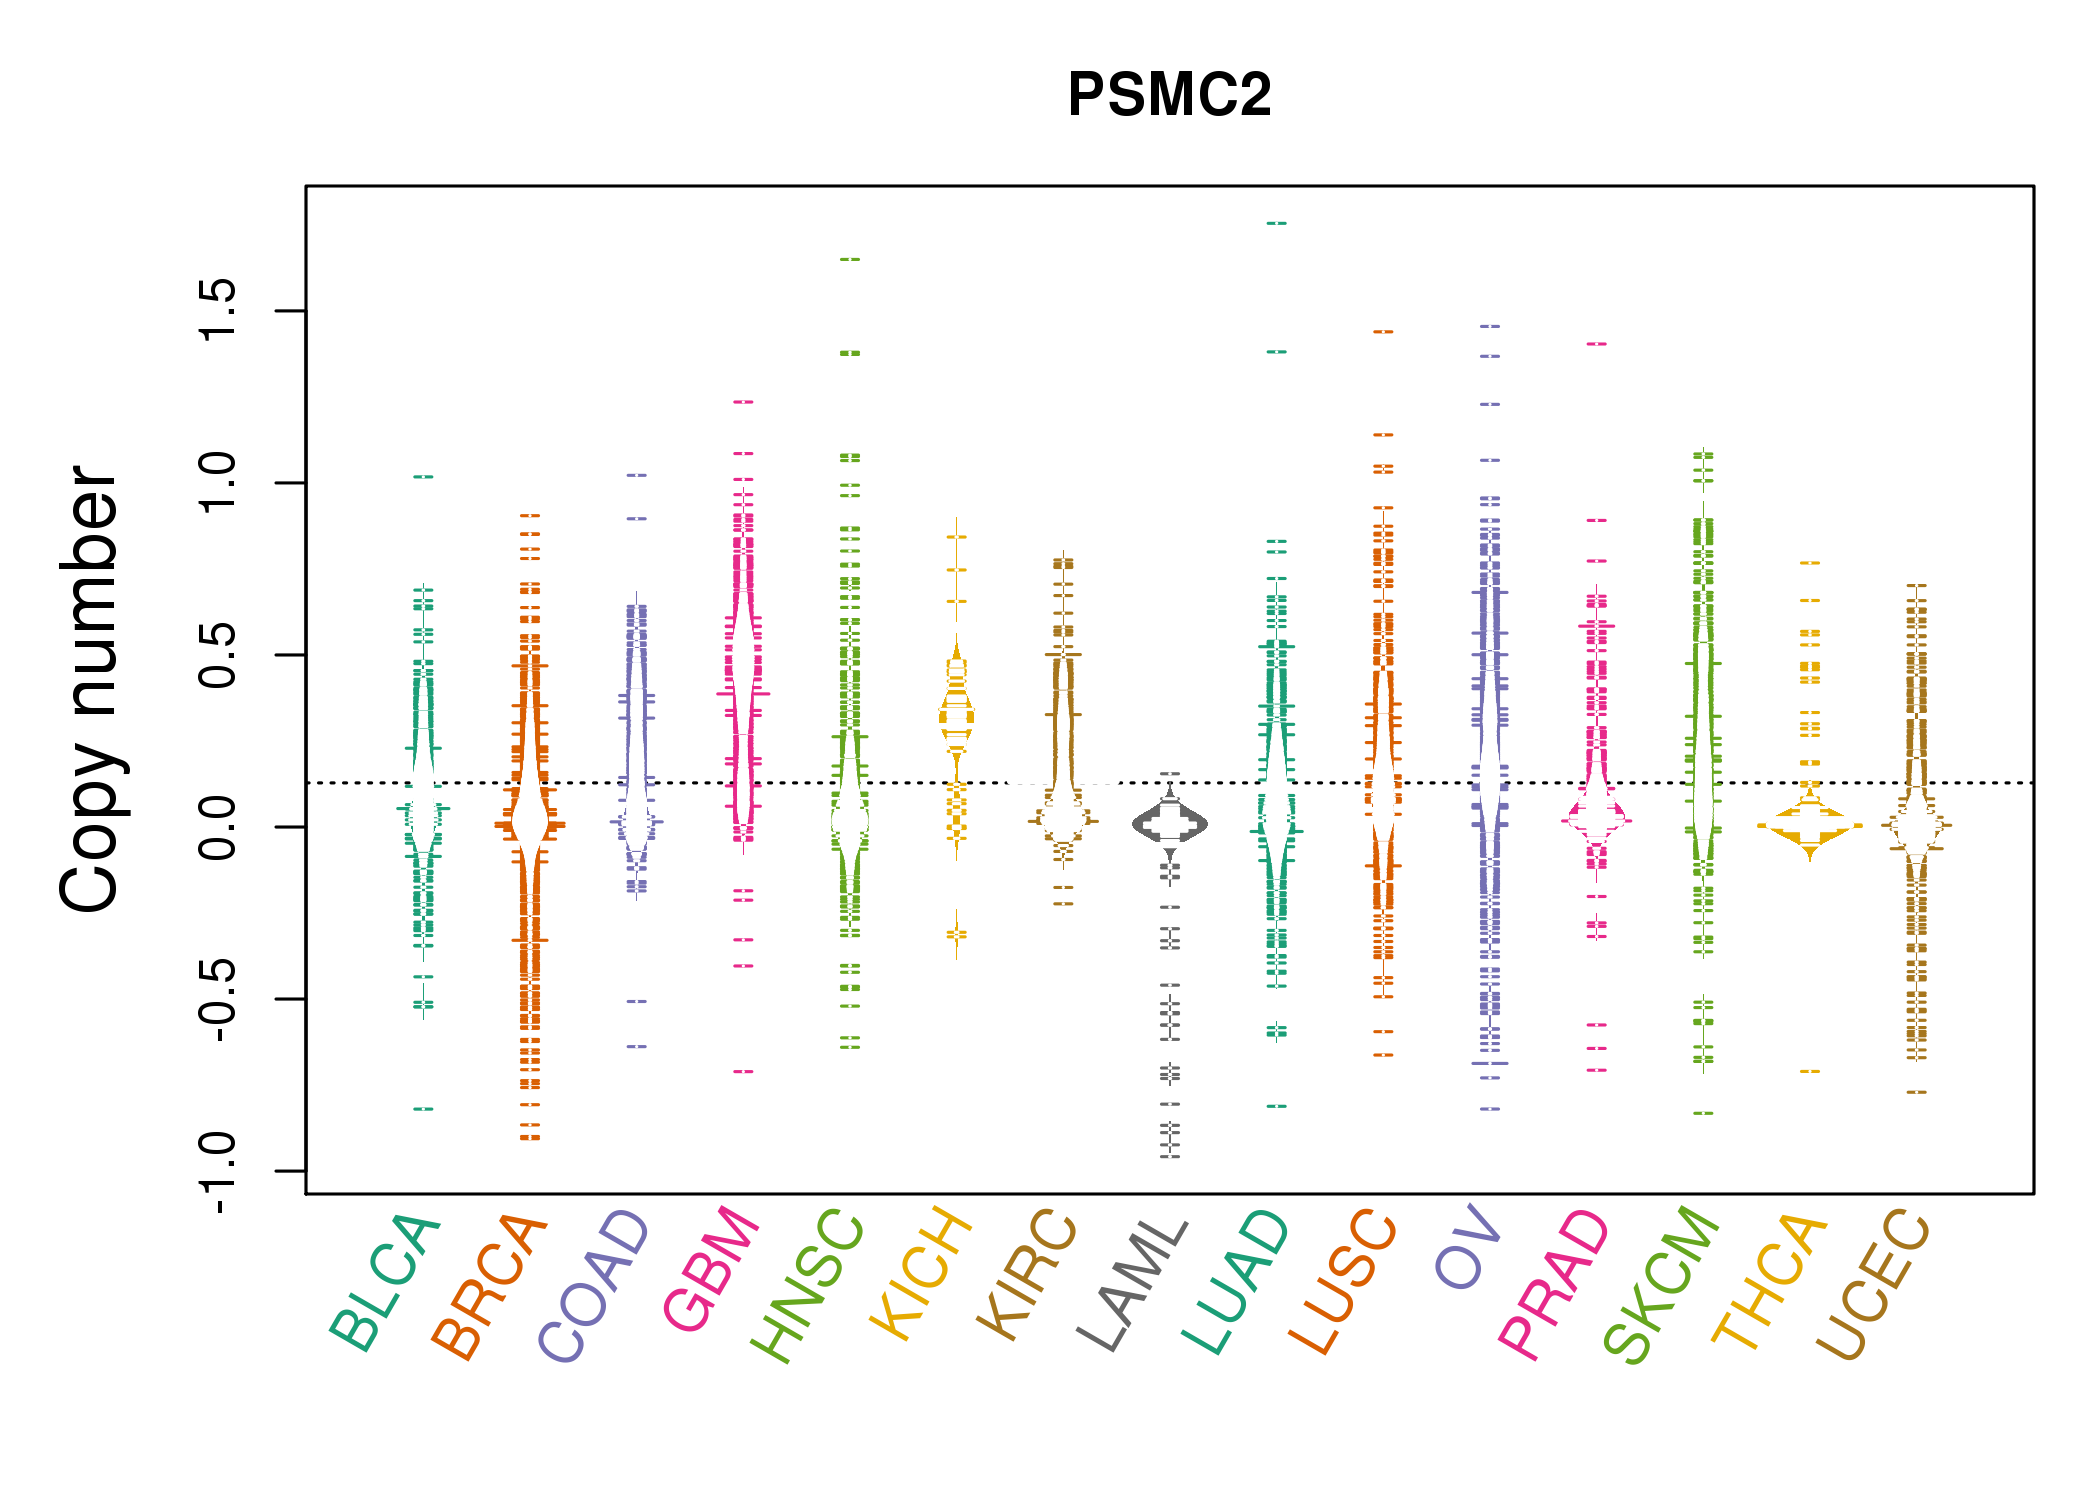 |
| cf) Tissue ID[Tissue type]: BLCA[Bladder Urothelial Carcinoma], BRCA[Breast invasive carcinoma], CESC[Cervical squamous cell carcinoma and endocervical adenocarcinoma], COAD[Colon adenocarcinoma], GBM[Glioblastoma multiforme], Glioma Low Grade, HNSC[Head and Neck squamous cell carcinoma], KICH[Kidney Chromophobe], KIRC[Kidney renal clear cell carcinoma], KIRP[Kidney renal papillary cell carcinoma], LAML[Acute Myeloid Leukemia], LUAD[Lung adenocarcinoma], LUSC[Lung squamous cell carcinoma], OV[Ovarian serous cystadenocarcinoma ], PAAD[Pancreatic adenocarcinoma], PRAD[Prostate adenocarcinoma], SKCM[Skin Cutaneous Melanoma], STAD[Stomach adenocarcinoma], THCA[Thyroid carcinoma], UCEC[Uterine Corpus Endometrial Carcinoma] |
| Top |
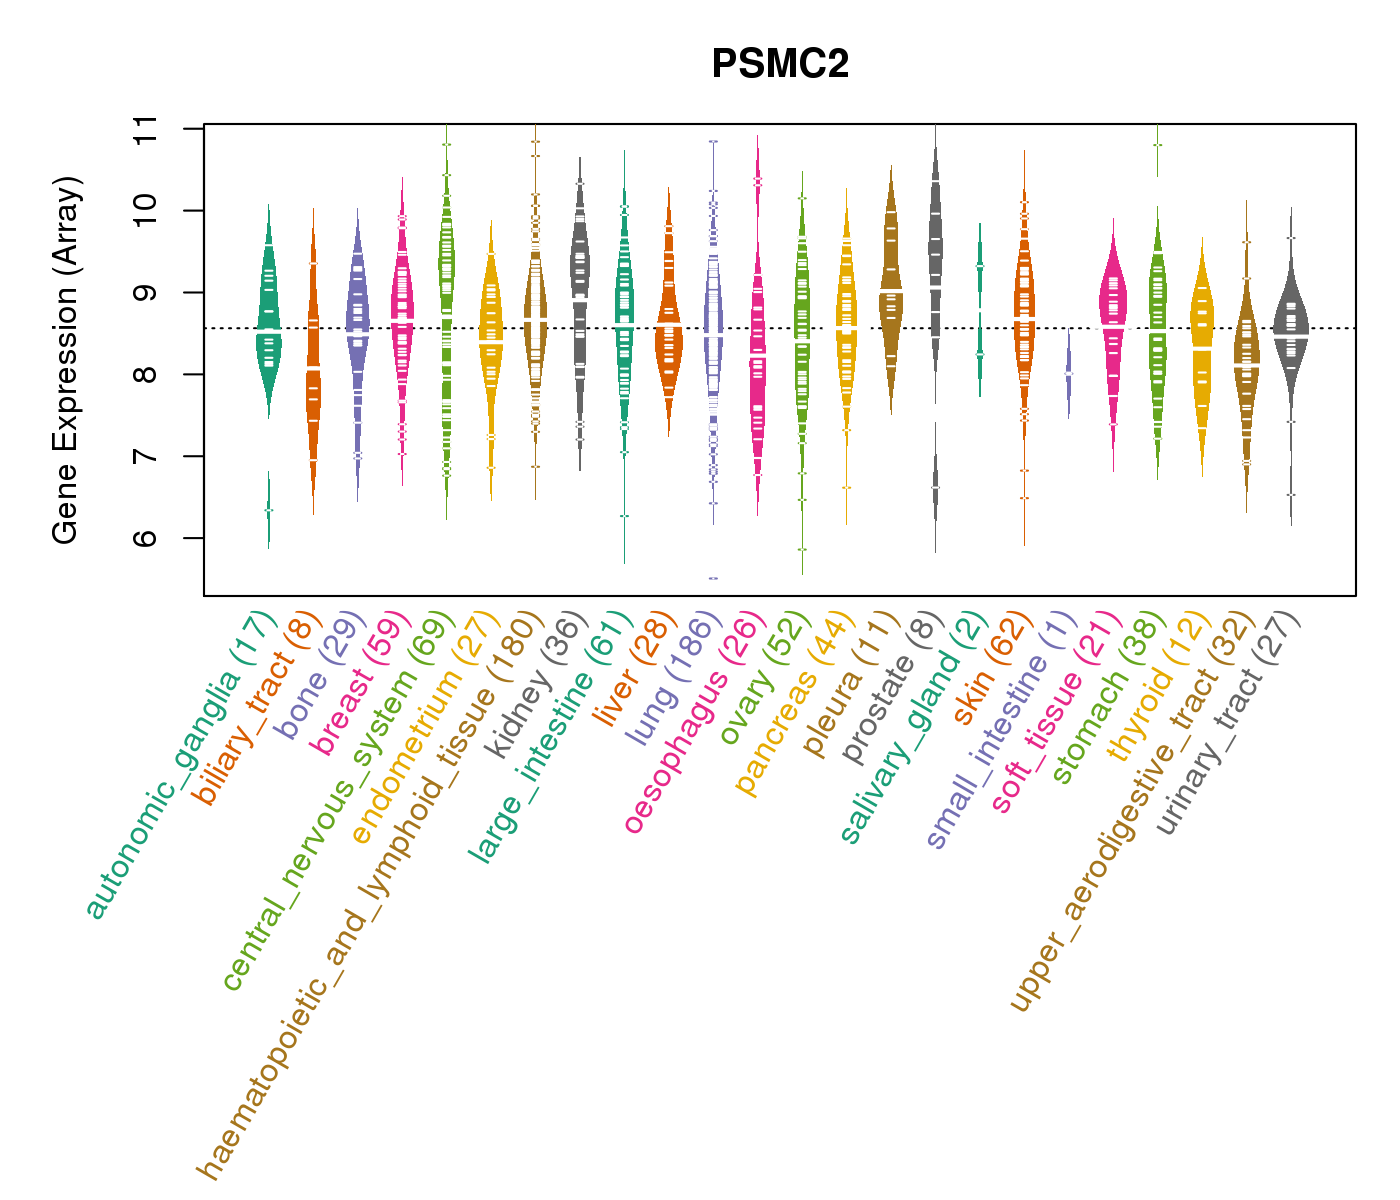
| Gene Expression for PSMC2 |
| * CCLE gene expression data were extracted from CCLE_Expression_Entrez_2012-10-18.res: Gene-centric RMA-normalized mRNA expression data. |
 |
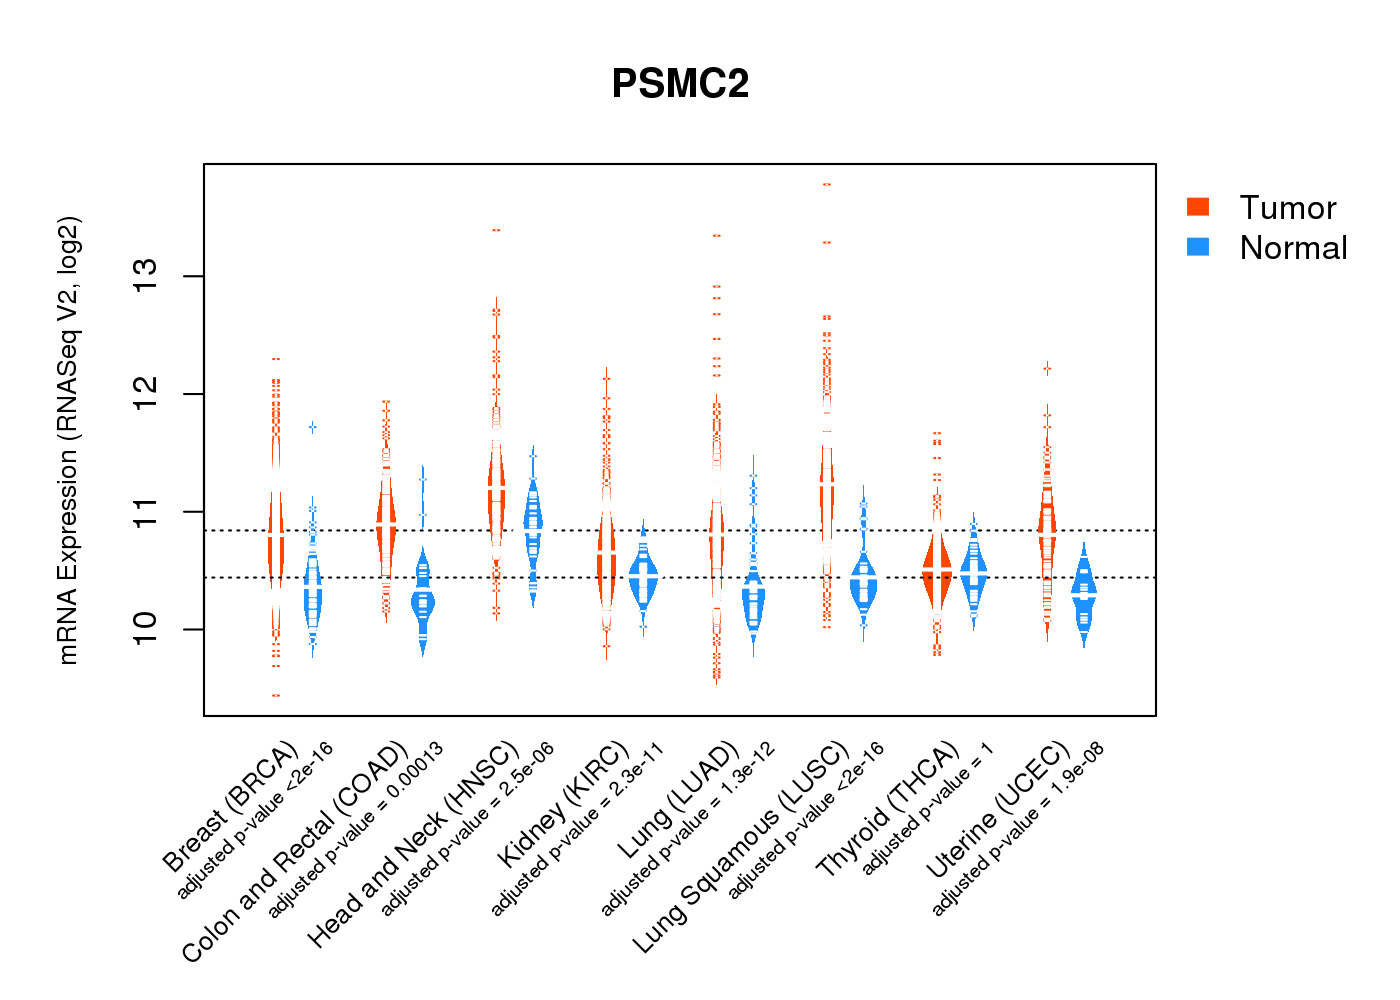
| * Normalized gene expression data of RNASeqV2 was extracted from TCGA using R package TCGA-Assembler. The URLs of all public data files on TCGA DCC data server were gathered at Jan-05-2015. Only eight cancer types have enough normal control samples for differential expression analysis. (t test, adjusted p<0.05 (using Benjamini-Hochberg FDR)) |
 |
| Top |
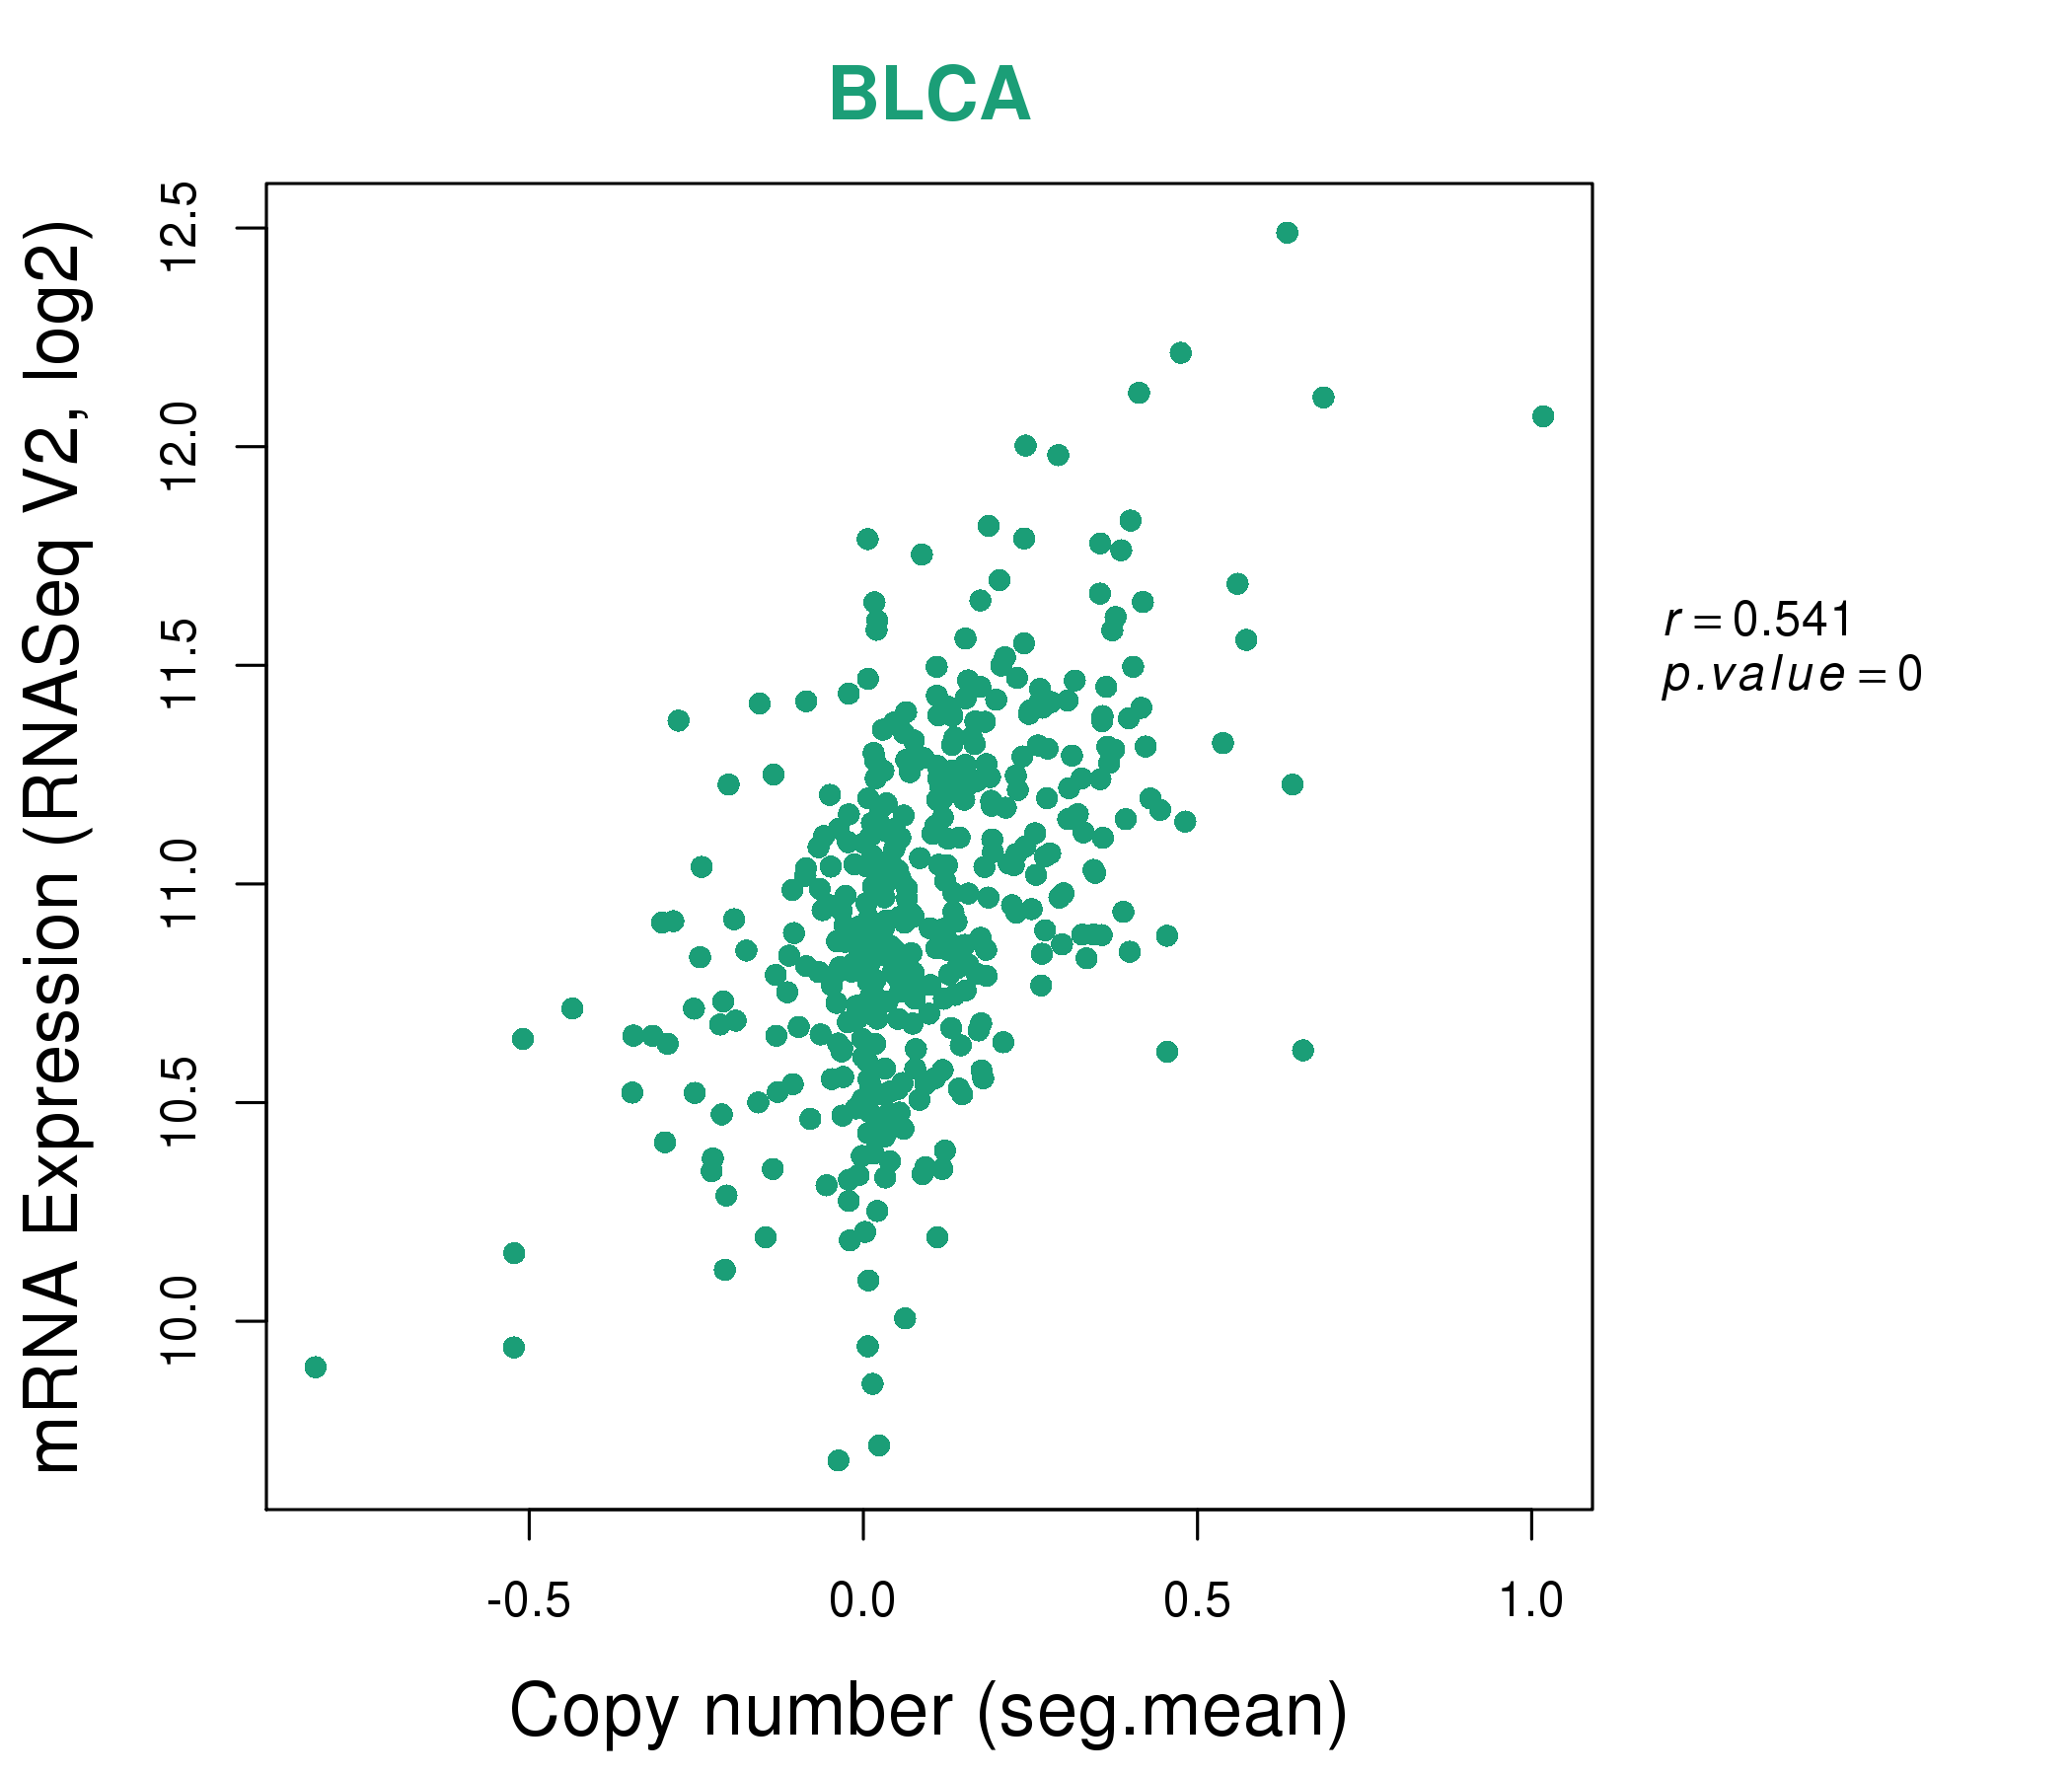
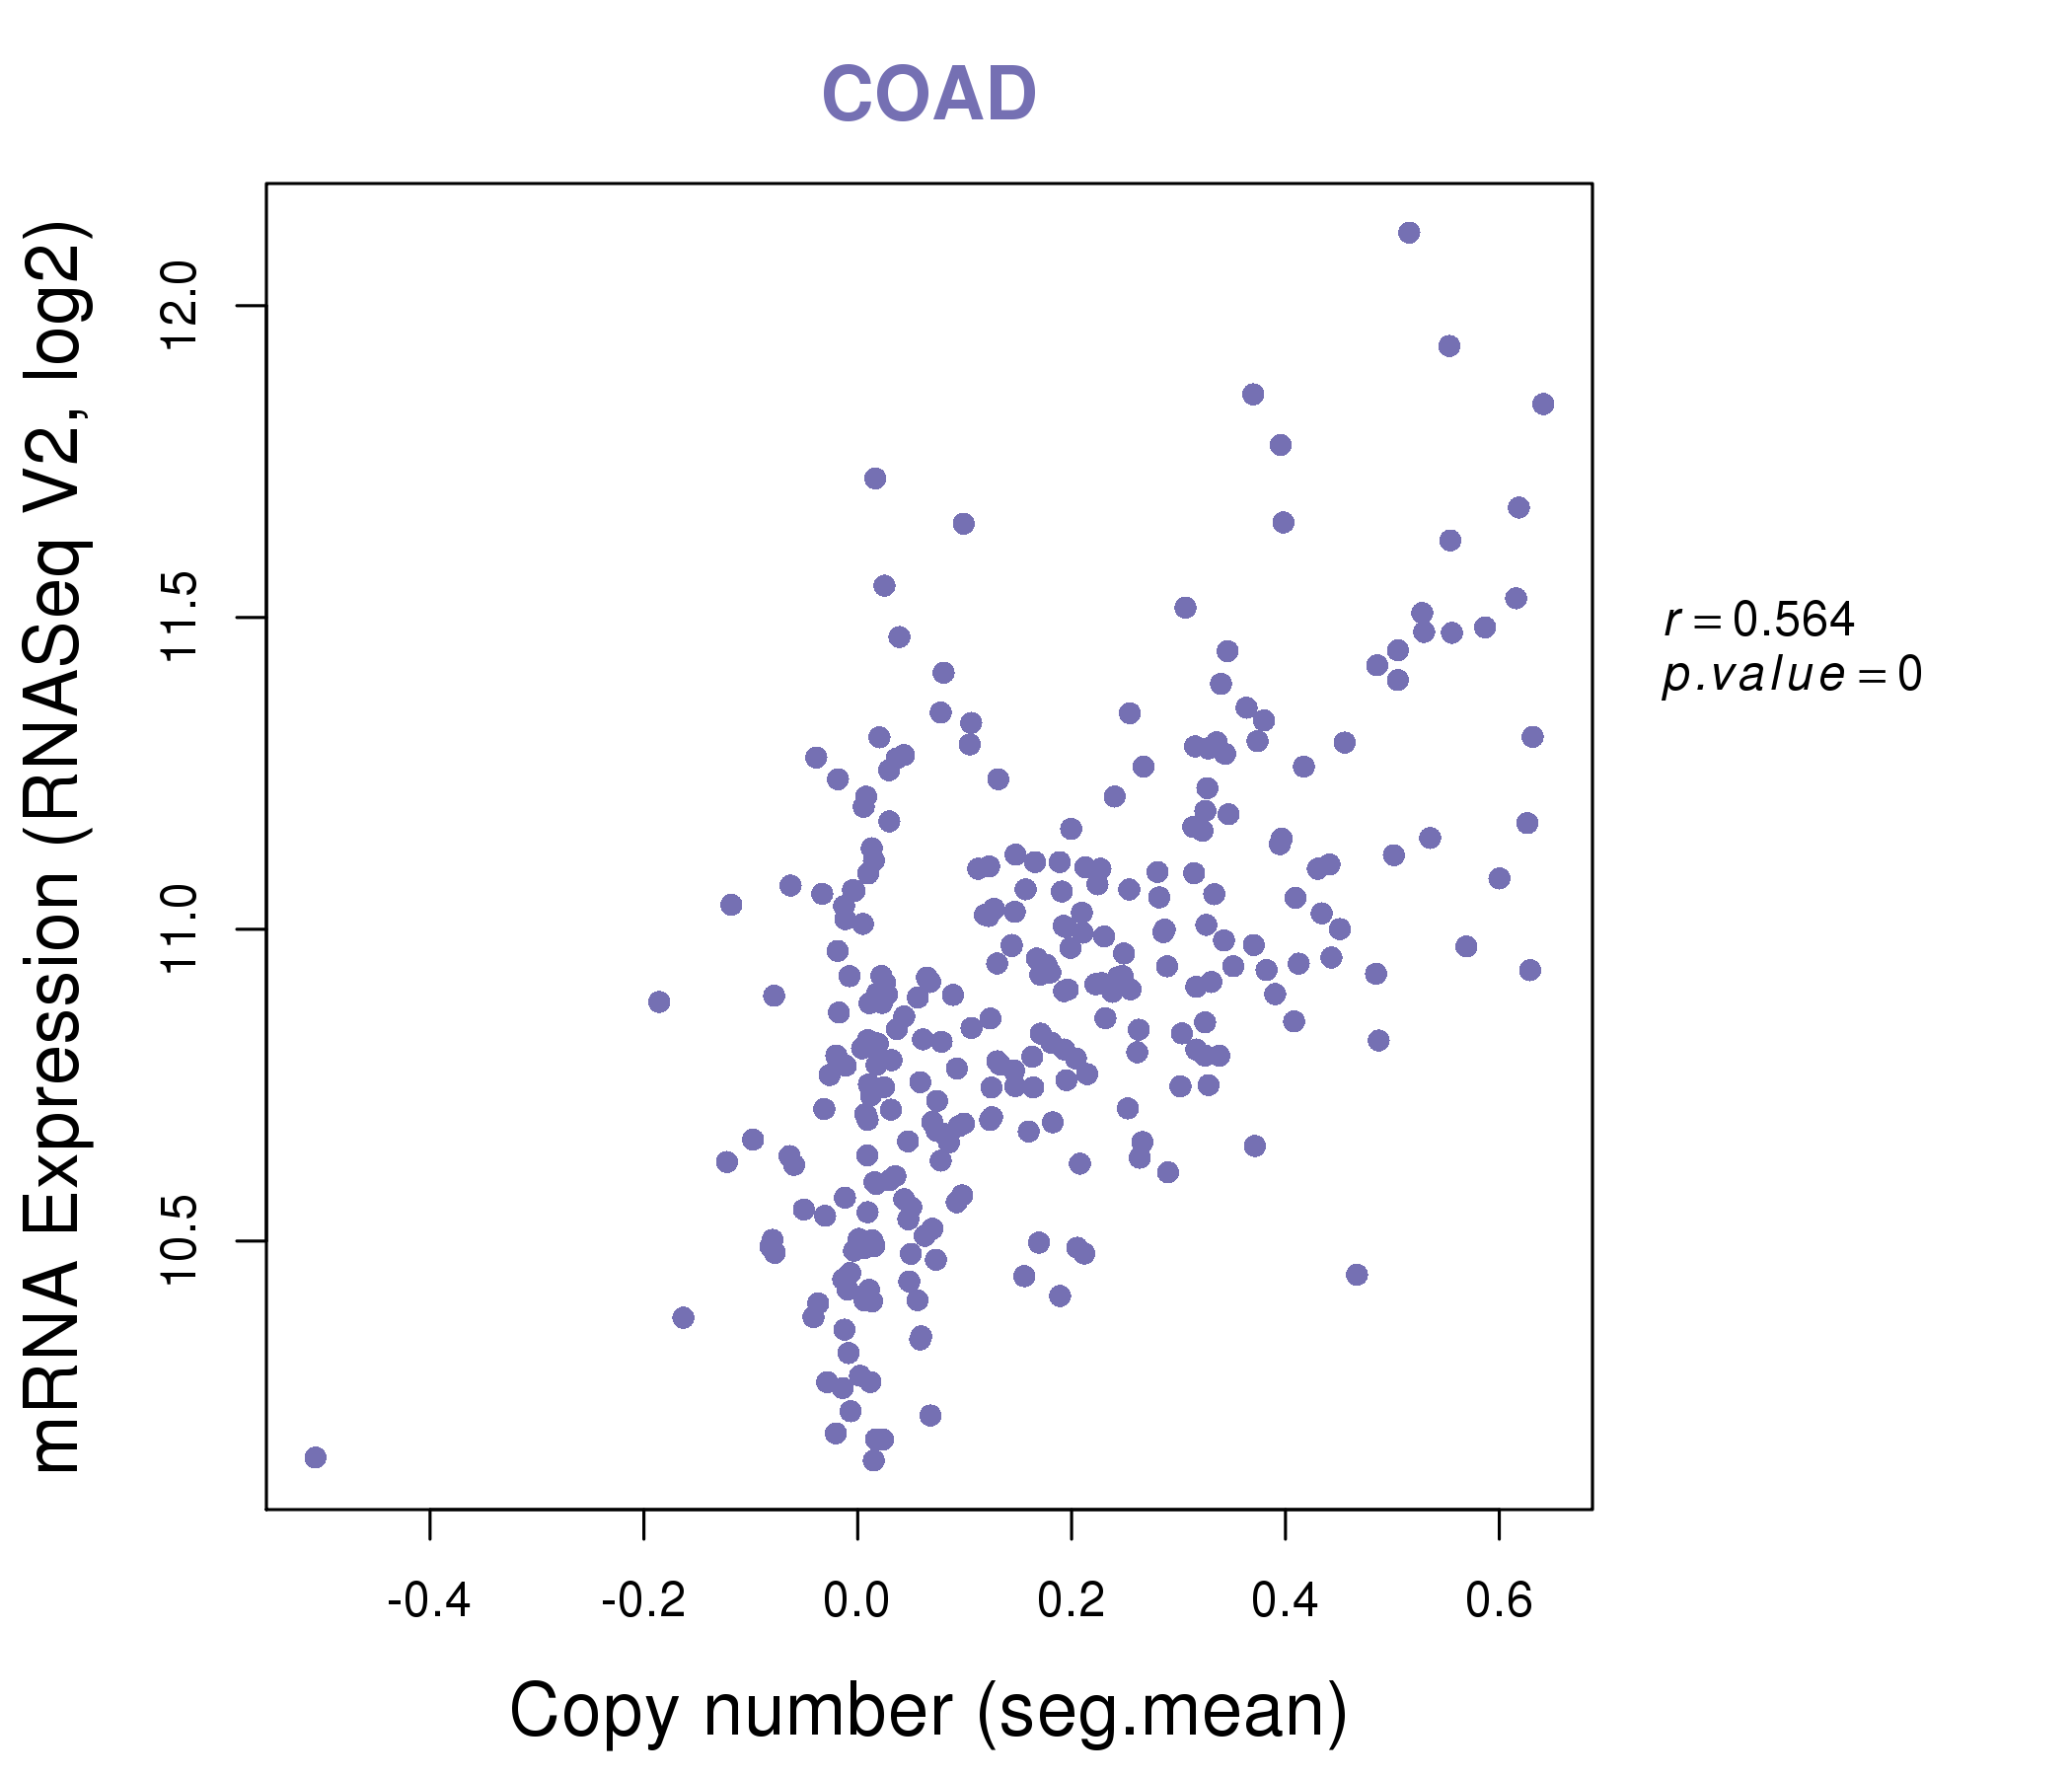
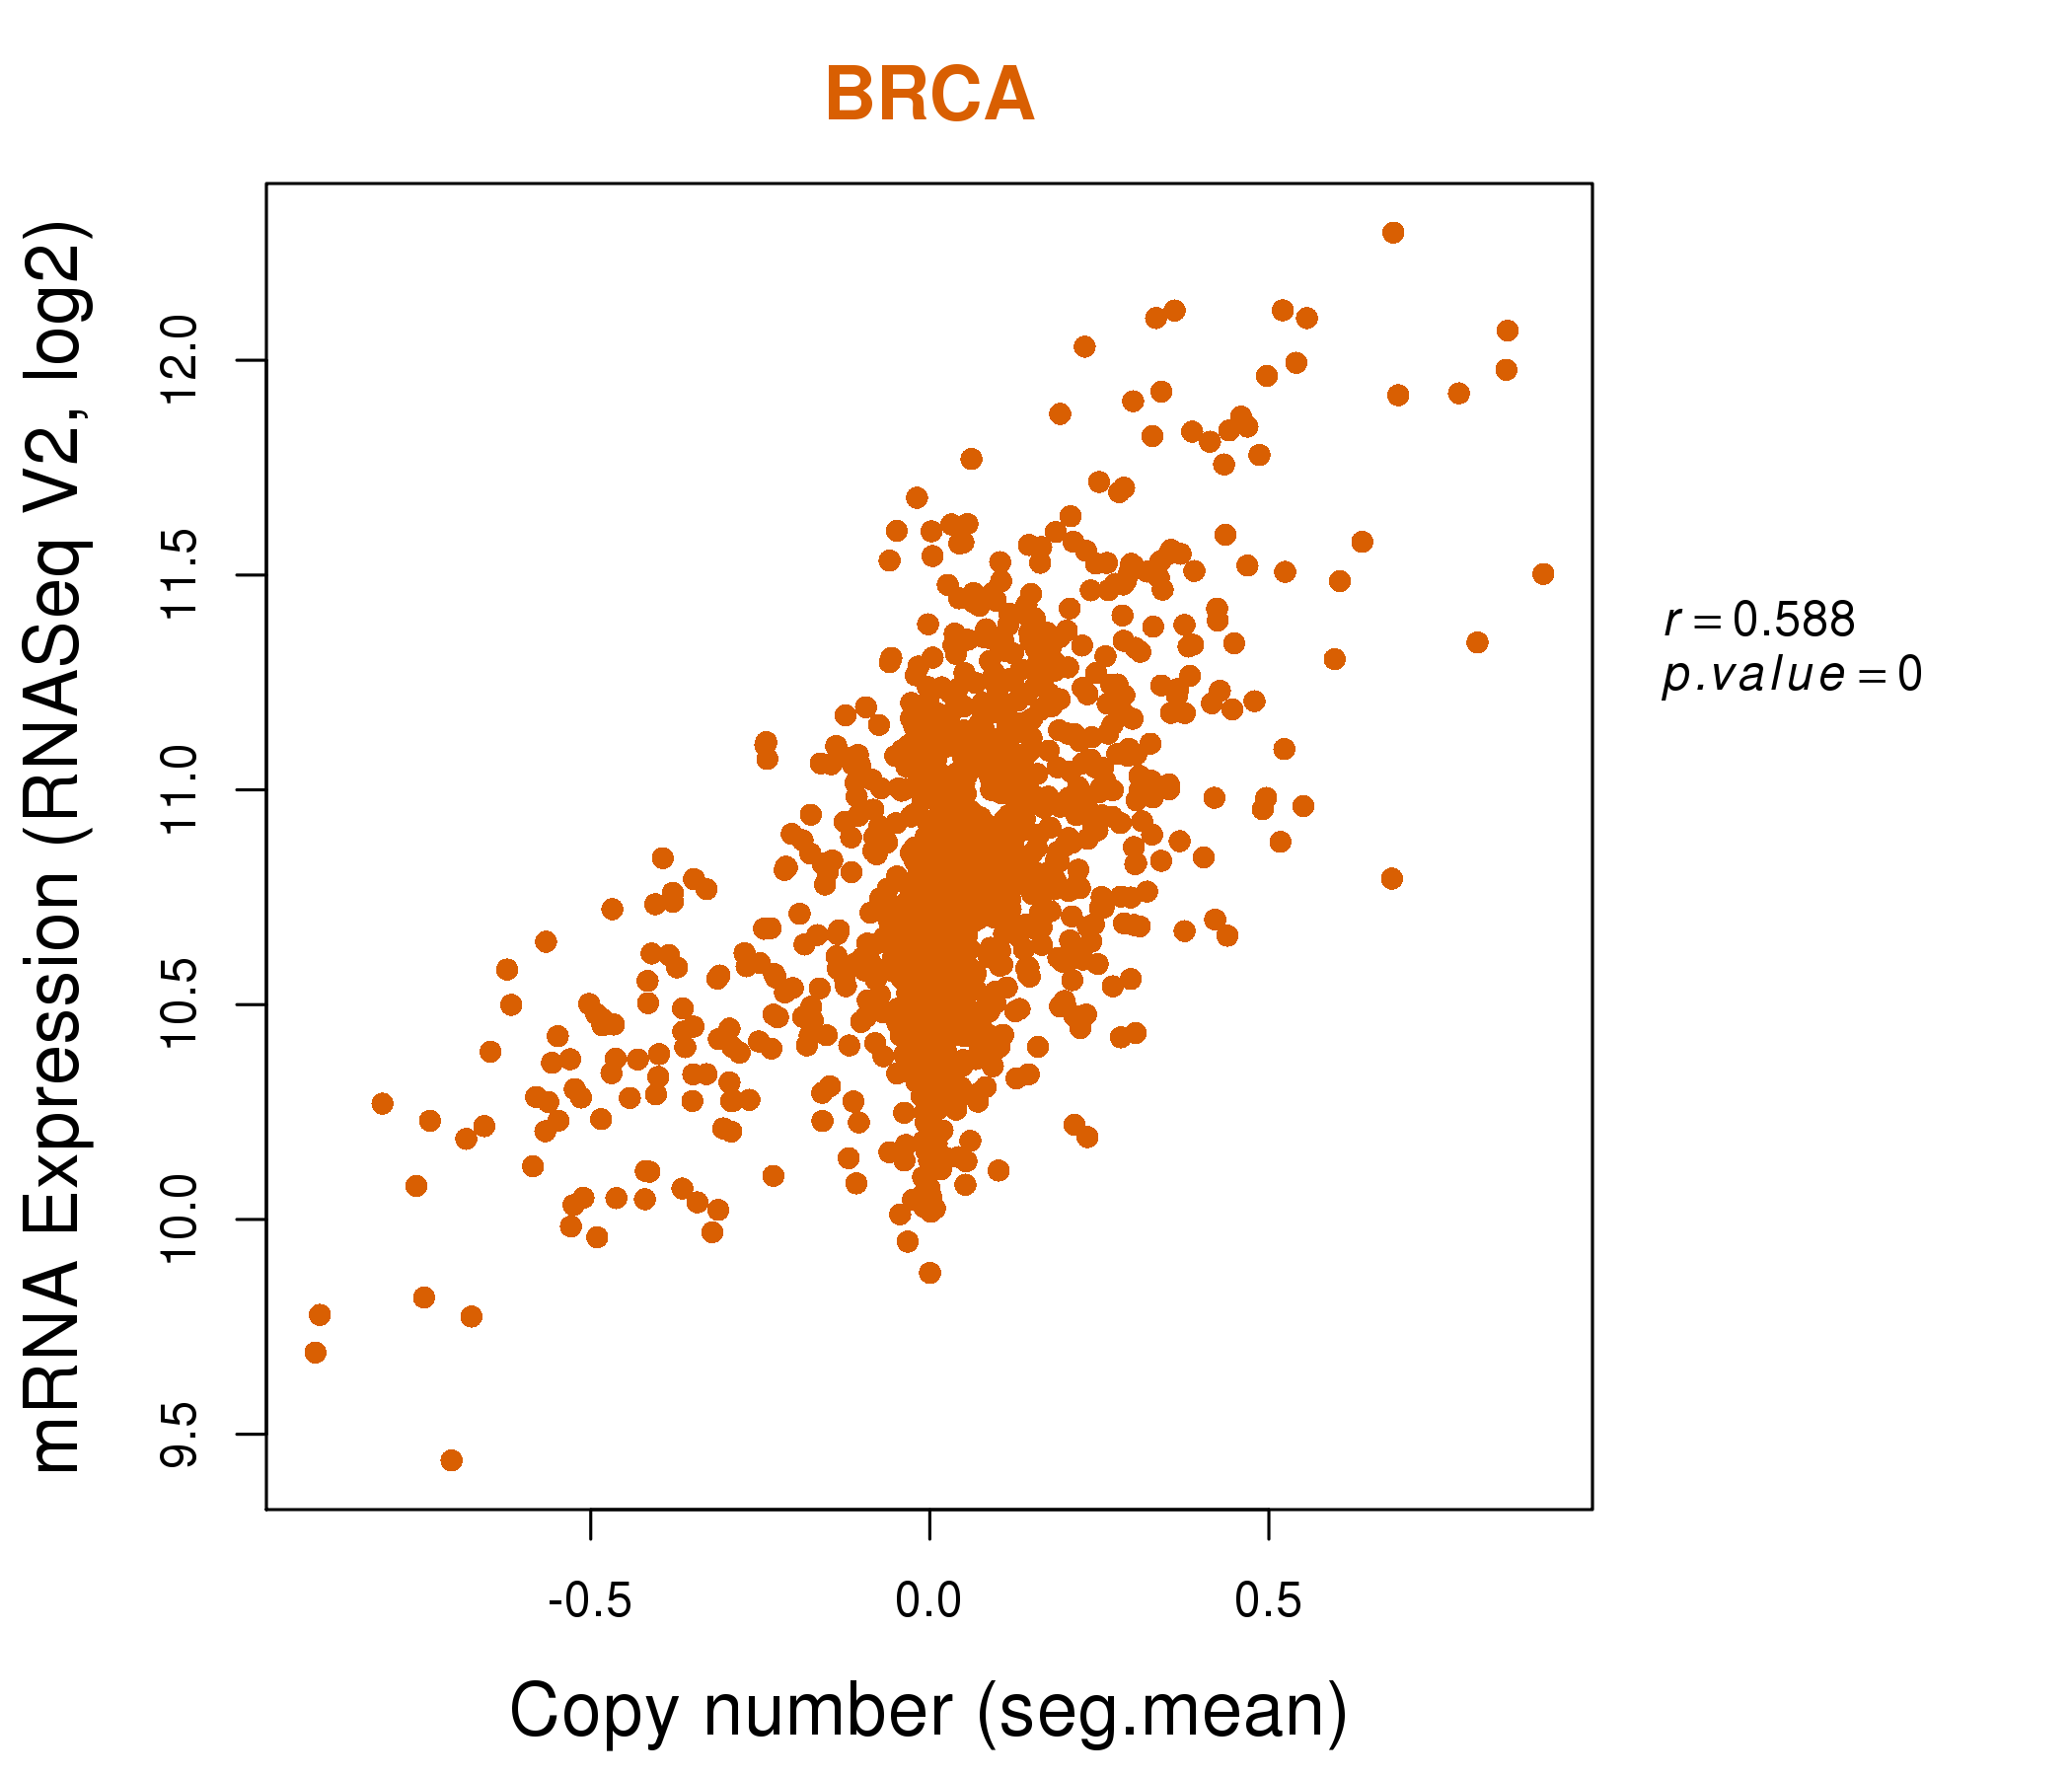
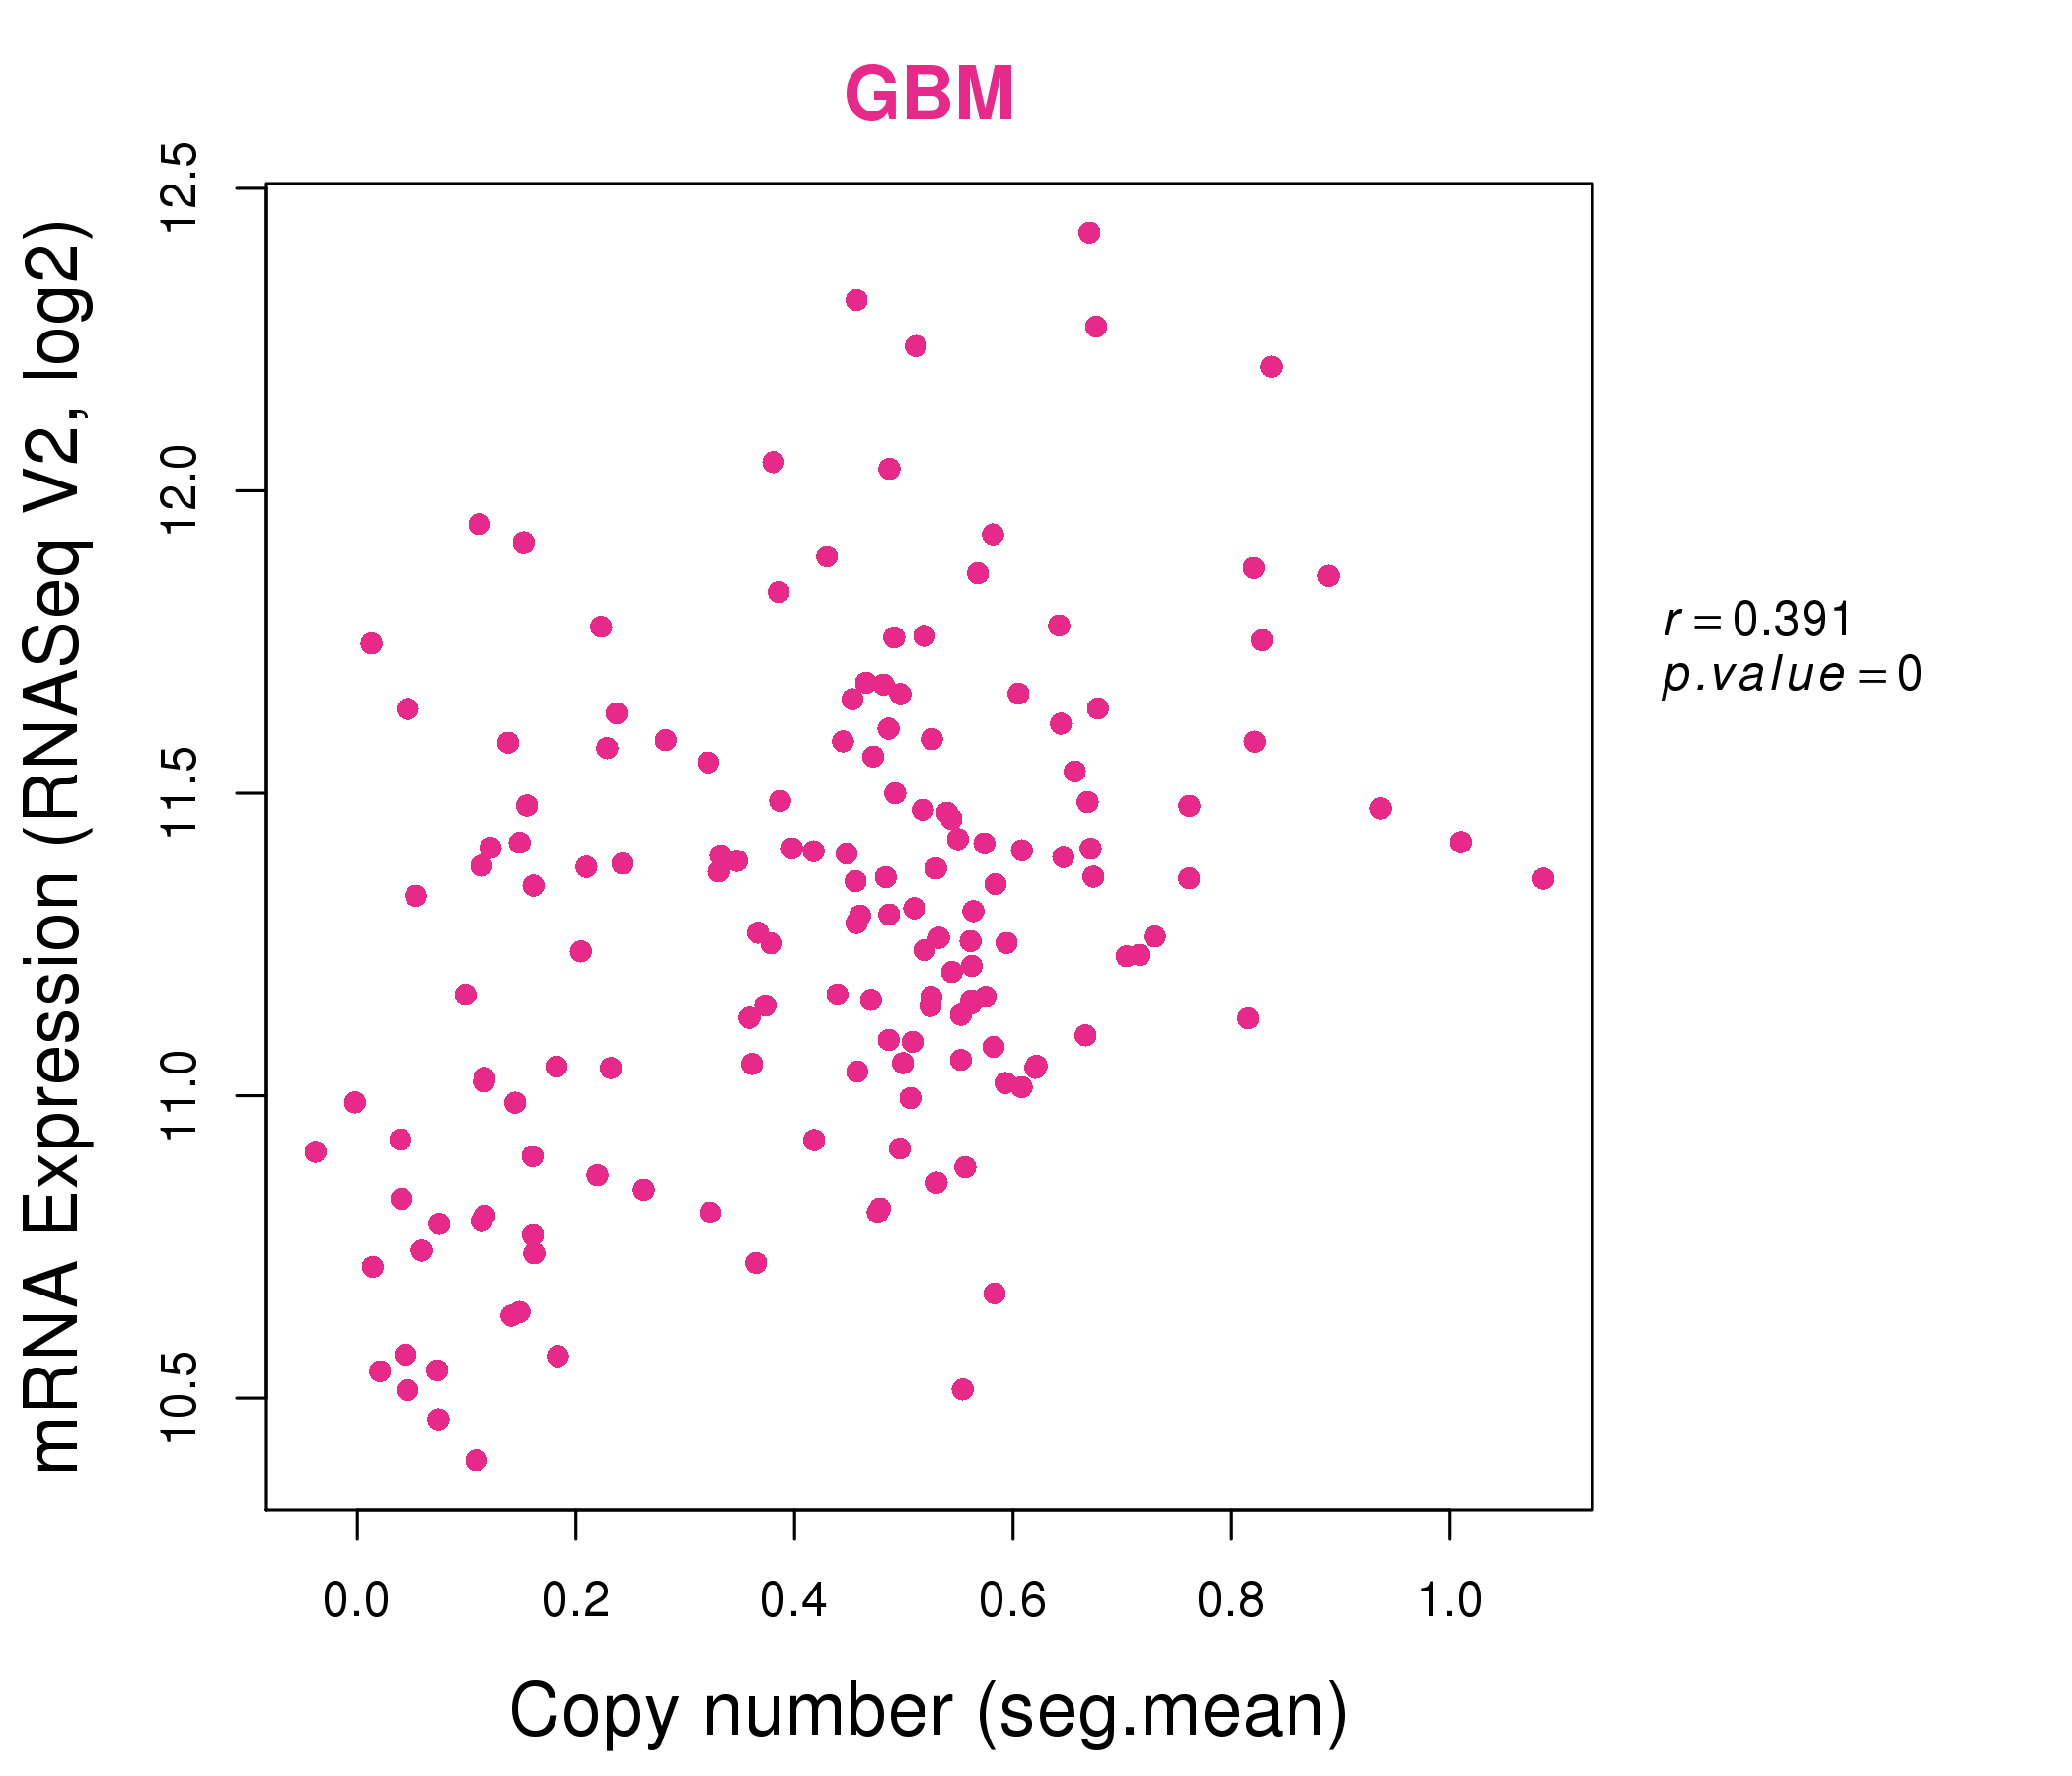
| * This plots show the correlation between CNV and gene expression. |
: Open all plots for all cancer types
 |
|
 |
|
| Top |
| Gene-Gene Network Information |
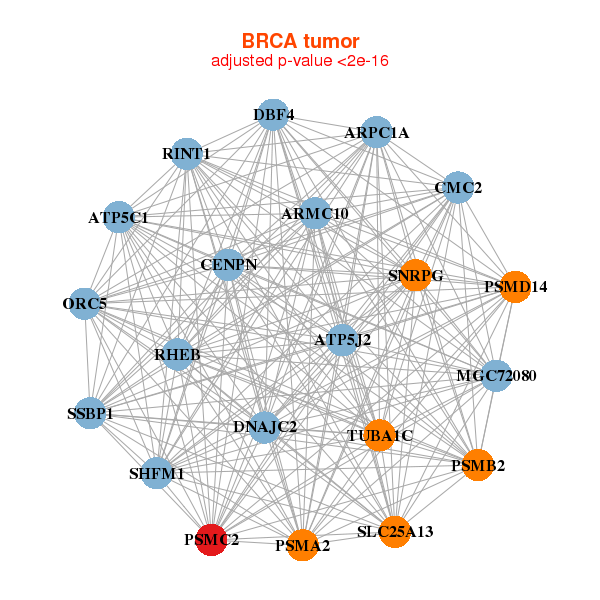
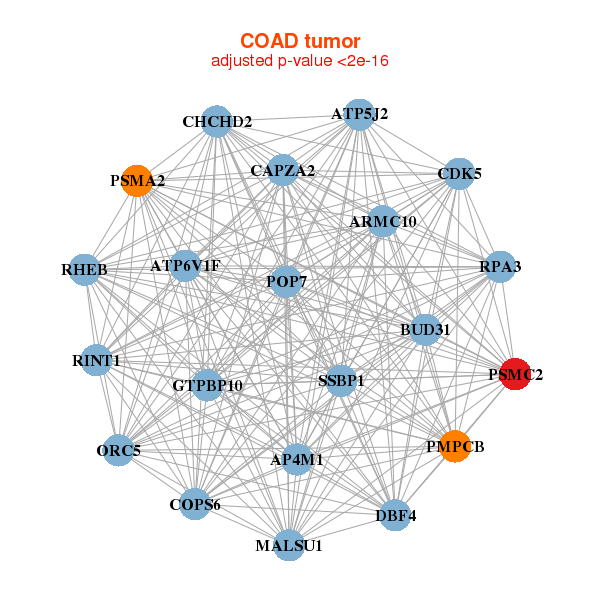
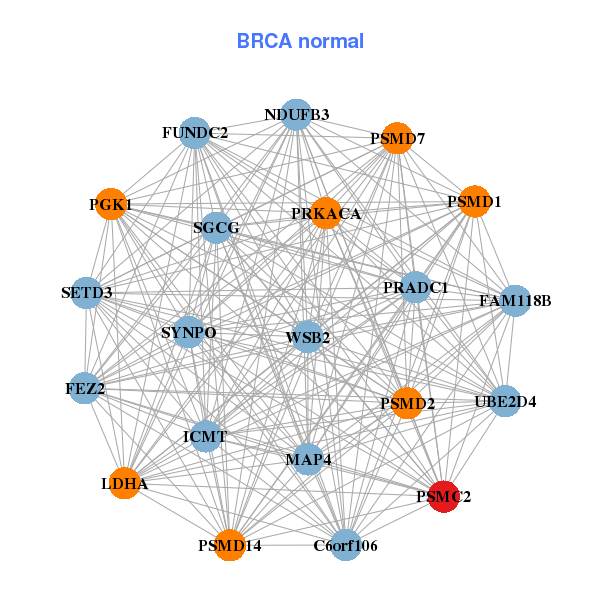
| * Co-Expression network figures were drawn using R package igraph. Only the top 20 genes with the highest correlations were shown. Red circle: input gene, orange circle: cell metabolism gene, sky circle: other gene |
: Open all plots for all cancer types
 |
|
| ARMC10,ARPC1A,ATP5C1,ATP5J2,CMC2,CENPN,DBF4, DNAJC2,MGC72080,ORC5,PSMA2,PSMB2,PSMC2,PSMD14, RHEB,RINT1,SHFM1,SLC25A13,SNRPG,SSBP1,TUBA1C | PRADC1,C6orf106,FAM118B,FEZ2,FUNDC2,ICMT,LDHA, MAP4,NDUFB3,PGK1,PRKACA,PSMC2,PSMD14,PSMD1, PSMD2,PSMD7,SETD3,SGCG,SYNPO,UBE2D4,WSB2 |
 |
|
| AP4M1,ARMC10,ATP5J2,ATP6V1F,BUD31,MALSU1,CAPZA2, CDK5,CHCHD2,COPS6,DBF4,GTPBP10,ORC5,PMPCB, POP7,PSMA2,PSMC2,RHEB,RINT1,RPA3,SSBP1 | CCDC167,COPS4,EIF2S2,HAT1,MORF4L2,MRPL20,PSMA1, PSMA2,PSMA3,PSMA7,PSMB1,PSMB5,PSMB6,PSMC2, PSMC3,PSMD14,PSMD6,PSMD7,RPL22L1,SSBP1,TCEB1 |
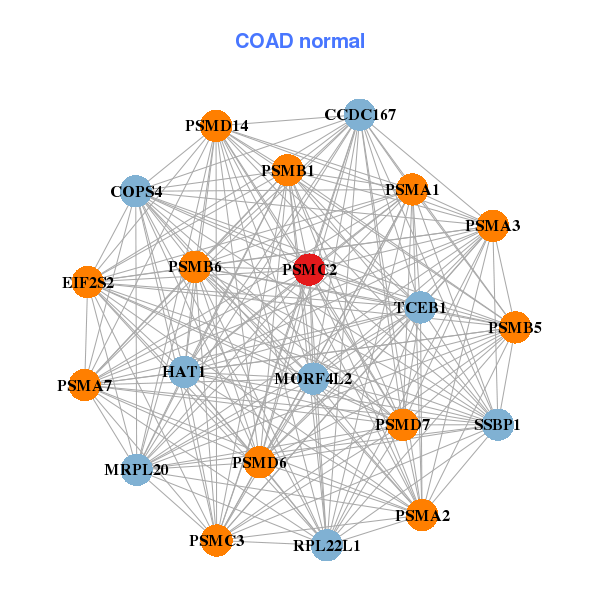
| * Co-Expression network figures were drawn using R package igraph. Only the top 20 genes with the highest correlations were shown. Red circle: input gene, orange circle: cell metabolism gene, sky circle: other gene |
: Open all plots for all cancer types
| Top |
: Open all interacting genes' information including KEGG pathway for all interacting genes from DAVID
| Top |
| Pharmacological Information for PSMC2 |
| There's no related Drug. |
| Top |
| Cross referenced IDs for PSMC2 |
| * We obtained these cross-references from Uniprot database. It covers 150 different DBs, 18 categories. http://www.uniprot.org/help/cross_references_section |
: Open all cross reference information
|
Copyright © 2016-Present - The Univsersity of Texas Health Science Center at Houston @ |