|
||||||||||||||||||||
| |
| Phenotypic Information (metabolism pathway, cancer, disease, phenome) |
| |
| |
| Gene-Gene Network Information: Co-Expression Network, Interacting Genes & KEGG |
| |
|


| Gene Summary for PSMC5 |
| Basic gene info. | Gene symbol | PSMC5 |
| Gene name | proteasome (prosome, macropain) 26S subunit, ATPase, 5 | |
| Synonyms | S8|SUG-1|SUG1|TBP10|TRIP1|p45|p45/SUG | |
| Cytomap | UCSC genome browser: 17q23.3 | |
| Genomic location | chr17 :61904769-61909387 | |
| Type of gene | protein-coding | |
| RefGenes | NM_001199163.1, NM_002805.5, | |
| Ensembl id | ENSG00000087191 | |
| Description | 26S protease regulatory subunit 826S proteasome AAA-ATPase subunit RPT6MSUG1 proteinTat-binding protein homolog 10proteasome 26S ATPase subunit 5proteasome 26S subunit ATPase 5proteasome subunit p45thyroid hormone receptor-interacting protein 1thy | |
| Modification date | 20141207 | |
| dbXrefs | MIM : 601681 | |
| HGNC : HGNC | ||
| Ensembl : ENSG00000087191 | ||
| HPRD : 03400 | ||
| Vega : OTTHUMG00000179013 | ||
| Protein | UniProt: go to UniProt's Cross Reference DB Table | |
| Expression | CleanEX: HS_PSMC5 | |
| BioGPS: 5705 | ||
| Gene Expression Atlas: ENSG00000087191 | ||
| The Human Protein Atlas: ENSG00000087191 | ||
| Pathway | NCI Pathway Interaction Database: PSMC5 | |
| KEGG: PSMC5 | ||
| REACTOME: PSMC5 | ||
| ConsensusPathDB | ||
| Pathway Commons: PSMC5 | ||
| Metabolism | MetaCyc: PSMC5 | |
| HUMANCyc: PSMC5 | ||
| Regulation | Ensembl's Regulation: ENSG00000087191 | |
| miRBase: chr17 :61,904,769-61,909,387 | ||
| TargetScan: NM_001199163 | ||
| cisRED: ENSG00000087191 | ||
| Context | iHOP: PSMC5 | |
| cancer metabolism search in PubMed: PSMC5 | ||
| UCL Cancer Institute: PSMC5 | ||
| Assigned class in ccmGDB | C | |
| Top |
| Phenotypic Information for PSMC5(metabolism pathway, cancer, disease, phenome) |
| Cancer | CGAP: PSMC5 |
| Familial Cancer Database: PSMC5 | |
| * This gene is included in those cancer gene databases. |
|
|
|
|
|
| . | ||||||||||||||
Oncogene 1 | Significant driver gene in | |||||||||||||||||||
| cf) number; DB name 1 Oncogene; http://nar.oxfordjournals.org/content/35/suppl_1/D721.long, 2 Tumor Suppressor gene; https://bioinfo.uth.edu/TSGene/, 3 Cancer Gene Census; http://www.nature.com/nrc/journal/v4/n3/abs/nrc1299.html, 4 CancerGenes; http://nar.oxfordjournals.org/content/35/suppl_1/D721.long, 5 Network of Cancer Gene; http://ncg.kcl.ac.uk/index.php, 1Therapeutic Vulnerabilities in Cancer; http://cbio.mskcc.org/cancergenomics/statius/ |
| REACTOME_METABOLISM_OF_AMINO_ACIDS_AND_DERIVATIVES REACTOME_METABOLISM_OF_MRNA REACTOME_METABOLISM_OF_RNA | |
| OMIM | |
| Orphanet | |
| Disease | KEGG Disease: PSMC5 |
| MedGen: PSMC5 (Human Medical Genetics with Condition) | |
| ClinVar: PSMC5 | |
| Phenotype | MGI: PSMC5 (International Mouse Phenotyping Consortium) |
| PhenomicDB: PSMC5 | |
| Mutations for PSMC5 |
| * Under tables are showing count per each tissue to give us broad intuition about tissue specific mutation patterns.You can go to the detailed page for each mutation database's web site. |
| There's no structural variation information in COSMIC data for this gene. |
| * From mRNA Sanger sequences, Chitars2.0 arranged chimeric transcripts. This table shows PSMC5 related fusion information. |
| ID | Head Gene | Tail Gene | Accession | Gene_a | qStart_a | qEnd_a | Chromosome_a | tStart_a | tEnd_a | Gene_a | qStart_a | qEnd_a | Chromosome_a | tStart_a | tEnd_a |
| CV422250 | PSMC5 | 6 | 199 | 17 | 61908210 | 61908502 | PSMC5 | 193 | 347 | 17 | 61908522 | 61908776 | |
| BF948995 | PSMC5 | 2 | 110 | 17 | 61908718 | 61908827 | PER1 | 95 | 186 | 17 | 8043855 | 8043945 | |
| CN413033 | PSMC5 | 21 | 359 | 17 | 61905495 | 61907669 | SLC4A5 | 355 | 551 | 2 | 74588368 | 74588563 | |
| AU143199 | PSMC5 | 1 | 210 | 17 | 61908875 | 61909296 | ATP5A1 | 210 | 695 | 18 | 43669875 | 43678287 | |
| CK725100 | PSMC5 | 17 | 161 | 17 | 61909127 | 61909376 | PSD3 | 156 | 687 | 8 | 18725438 | 18729525 | |
| BI002868 | PSMC5 | 9 | 124 | 17 | 61908916 | 61909140 | PSMC5 | 110 | 160 | 17 | 61909289 | 61909339 | |
| DB320226 | PSMC5 | 1 | 181 | 17 | 61909094 | 61909379 | ALDH4A1 | 174 | 510 | 1 | 19198500 | 19198836 | |
| AB209036 | PSMC5 | 1 | 1056 | 17 | 61905185 | 61908877 | PNPO | 1052 | 5749 | 17 | 46026318 | 46031022 | |
| Top |
| There's no copy number variation information in COSMIC data for this gene. |
| Top |
|
 |
| Top |
| Stat. for Non-Synonymous SNVs (# total SNVs=29) | (# total SNVs=16) |
 |  |
(# total SNVs=1) | (# total SNVs=0) |
 |
| Top |
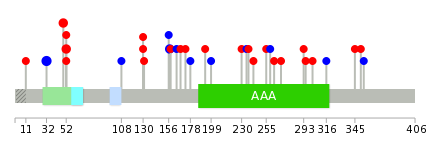
| * When you move the cursor on each content, you can see more deailed mutation information on the Tooltip. Those are primary_site,primary_histology,mutation(aa),pubmedID. |
| GRCh37 position | Mutation(aa) | Unique sampleID count |
| chr17:61907831-61907831 | p.L174L | 4 |
| chr17:61906877-61906877 | p.Q40Q | 3 |
| chr17:61908745-61908745 | p.R310H | 2 |
| chr17:61907214-61907214 | p.R57C | 2 |
| chr17:61907764-61907764 | p.G152V | 2 |
| chr17:61907223-61907223 | p.R60W | 2 |
| chr17:61907224-61907224 | p.R60L | 2 |
| chr17:61907804-61907804 | p.I165I | 2 |
| chr17:61907805-61907805 | p.E166K | 1 |
| chr17:61909118-61909118 | p.R372Q | 1 |
| Top |
|
 |
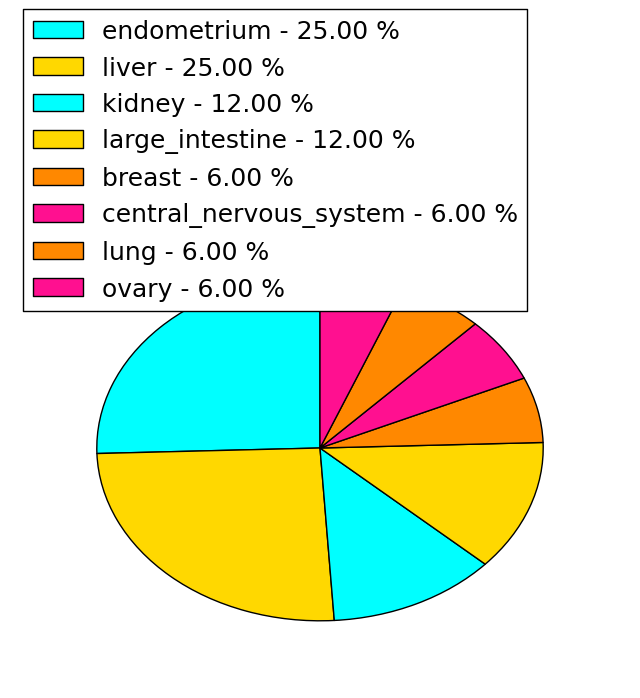
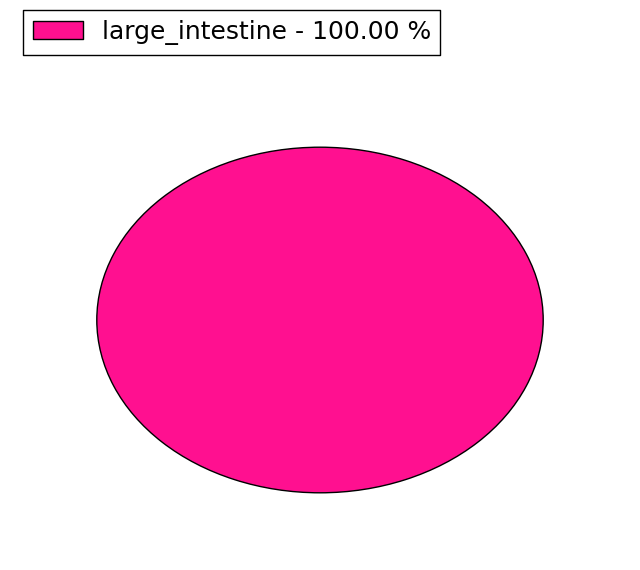
| Point Mutation/ Tissue ID | 1 | 2 | 3 | 4 | 5 | 6 | 7 | 8 | 9 | 10 | 11 | 12 | 13 | 14 | 15 | 16 | 17 | 18 | 19 | 20 |
| # sample | 9 | 1 | 1 | 2 | 3 | 2 | 4 | 4 | 8 | |||||||||||
| # mutation | 11 | 1 | 1 | 1 | 3 | 2 | 4 | 5 | 9 | |||||||||||
| nonsynonymous SNV | 9 | 1 | 3 | 1 | 1 | 4 | 6 | |||||||||||||
| synonymous SNV | 2 | 1 | 1 | 1 | 3 | 1 | 3 |
| cf) Tissue ID; Tissue type (1; BLCA[Bladder Urothelial Carcinoma], 2; BRCA[Breast invasive carcinoma], 3; CESC[Cervical squamous cell carcinoma and endocervical adenocarcinoma], 4; COAD[Colon adenocarcinoma], 5; GBM[Glioblastoma multiforme], 6; Glioma Low Grade, 7; HNSC[Head and Neck squamous cell carcinoma], 8; KICH[Kidney Chromophobe], 9; KIRC[Kidney renal clear cell carcinoma], 10; KIRP[Kidney renal papillary cell carcinoma], 11; LAML[Acute Myeloid Leukemia], 12; LUAD[Lung adenocarcinoma], 13; LUSC[Lung squamous cell carcinoma], 14; OV[Ovarian serous cystadenocarcinoma ], 15; PAAD[Pancreatic adenocarcinoma], 16; PRAD[Prostate adenocarcinoma], 17; SKCM[Skin Cutaneous Melanoma], 18:STAD[Stomach adenocarcinoma], 19:THCA[Thyroid carcinoma], 20:UCEC[Uterine Corpus Endometrial Carcinoma]) |
| Top |
| * We represented just top 10 SNVs. When you move the cursor on each content, you can see more deailed mutation information on the Tooltip. Those are primary_site, primary_histology, mutation(aa), pubmedID. |
| Genomic Position | Mutation(aa) | Unique sampleID count |
| chr17:61906877 | p.Q32Q,PSMC5 | 3 |
| chr17:61907804 | p.R49C,PSMC5 | 2 |
| chr17:61907214 | p.R52W,PSMC5 | 2 |
| chr17:61907223 | p.R52L,PSMC5 | 2 |
| chr17:61907224 | p.I157I,PSMC5 | 2 |
| chr17:61908429 | p.E158K,PSMC5 | 1 |
| chr17:61908868 | p.S295L,PSMC5 | 1 |
| chr17:61907726 | p.P164P,PSMC5 | 1 |
| chr17:61908445 | p.R302H,PSMC5 | 1 |
| chr17:61908953 | p.E168K,PSMC5 | 1 |
| * Copy number data were extracted from TCGA using R package TCGA-Assembler. The URLs of all public data files on TCGA DCC data server were gathered on Jan-05-2015. Function ProcessCNAData in TCGA-Assembler package was used to obtain gene-level copy number value which is calculated as the average copy number of the genomic region of a gene. |
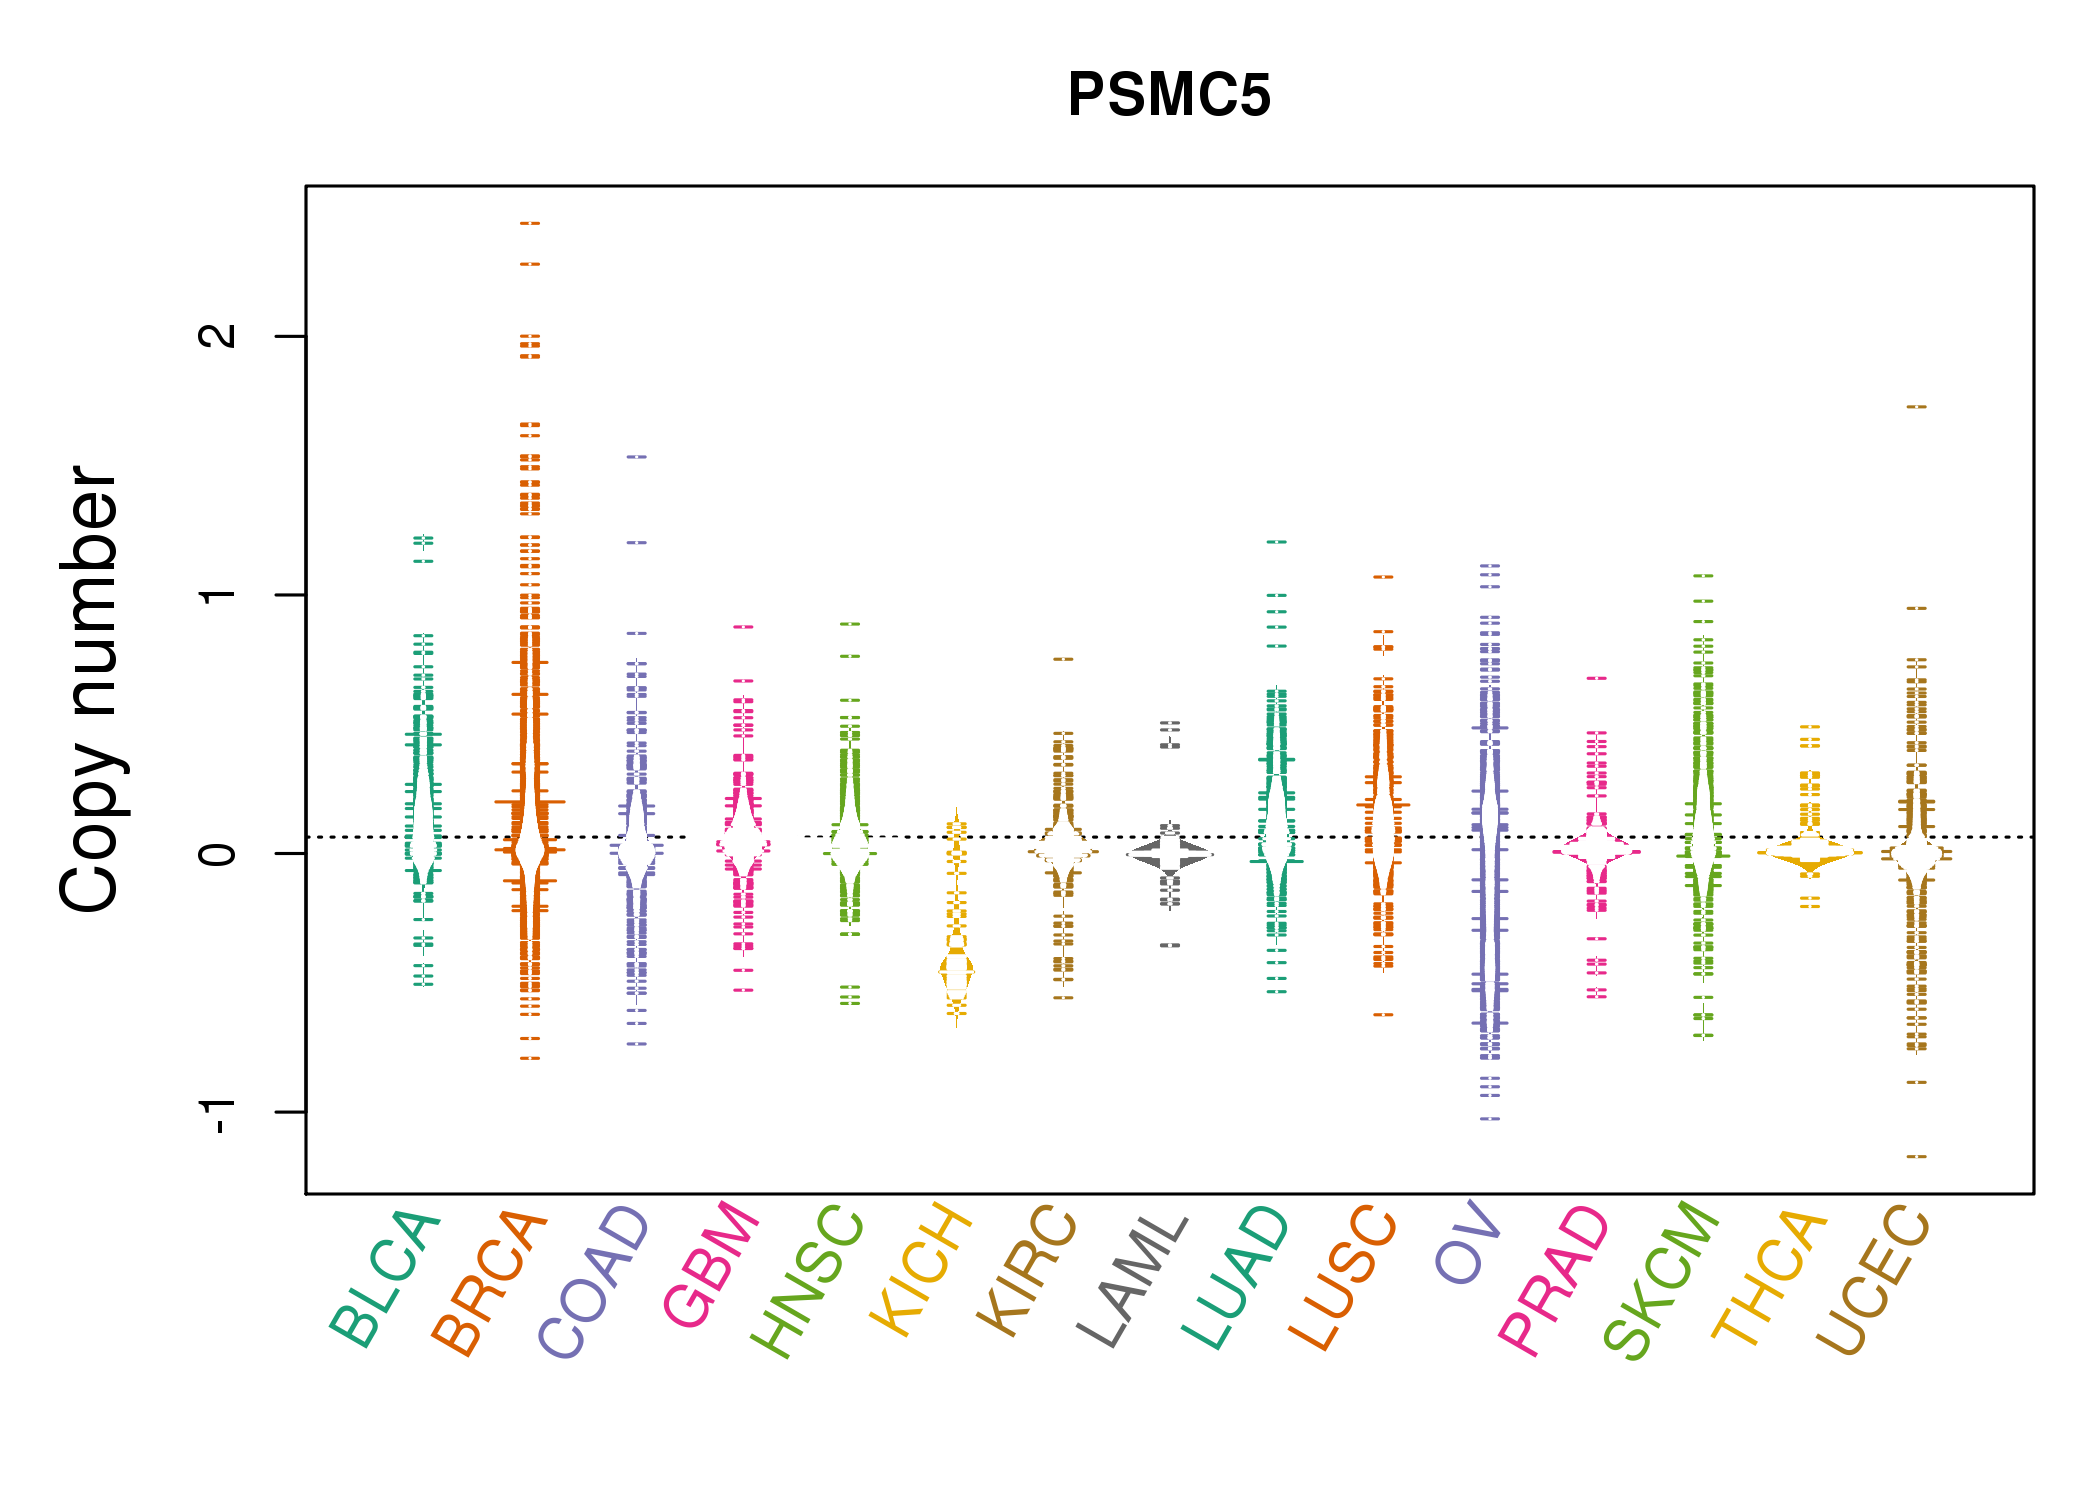 |
| cf) Tissue ID[Tissue type]: BLCA[Bladder Urothelial Carcinoma], BRCA[Breast invasive carcinoma], CESC[Cervical squamous cell carcinoma and endocervical adenocarcinoma], COAD[Colon adenocarcinoma], GBM[Glioblastoma multiforme], Glioma Low Grade, HNSC[Head and Neck squamous cell carcinoma], KICH[Kidney Chromophobe], KIRC[Kidney renal clear cell carcinoma], KIRP[Kidney renal papillary cell carcinoma], LAML[Acute Myeloid Leukemia], LUAD[Lung adenocarcinoma], LUSC[Lung squamous cell carcinoma], OV[Ovarian serous cystadenocarcinoma ], PAAD[Pancreatic adenocarcinoma], PRAD[Prostate adenocarcinoma], SKCM[Skin Cutaneous Melanoma], STAD[Stomach adenocarcinoma], THCA[Thyroid carcinoma], UCEC[Uterine Corpus Endometrial Carcinoma] |
| Top |
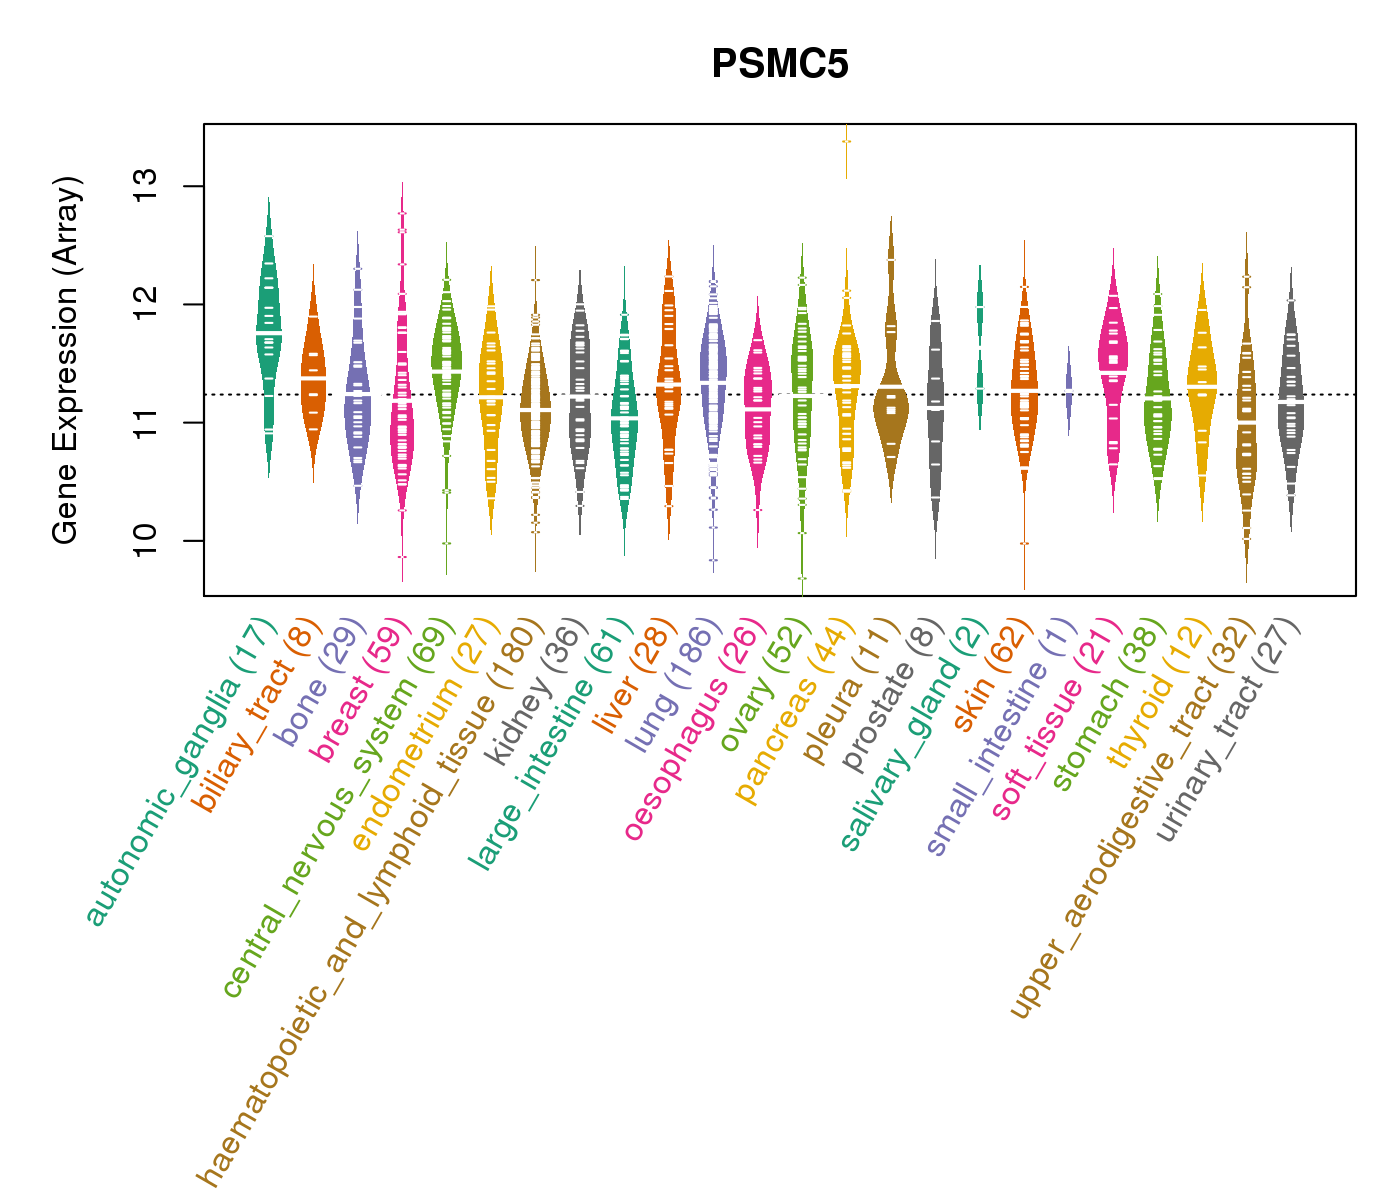
| Gene Expression for PSMC5 |
| * CCLE gene expression data were extracted from CCLE_Expression_Entrez_2012-10-18.res: Gene-centric RMA-normalized mRNA expression data. |
 |
| * Normalized gene expression data of RNASeqV2 was extracted from TCGA using R package TCGA-Assembler. The URLs of all public data files on TCGA DCC data server were gathered at Jan-05-2015. Only eight cancer types have enough normal control samples for differential expression analysis. (t test, adjusted p<0.05 (using Benjamini-Hochberg FDR)) |
 |
| Top |
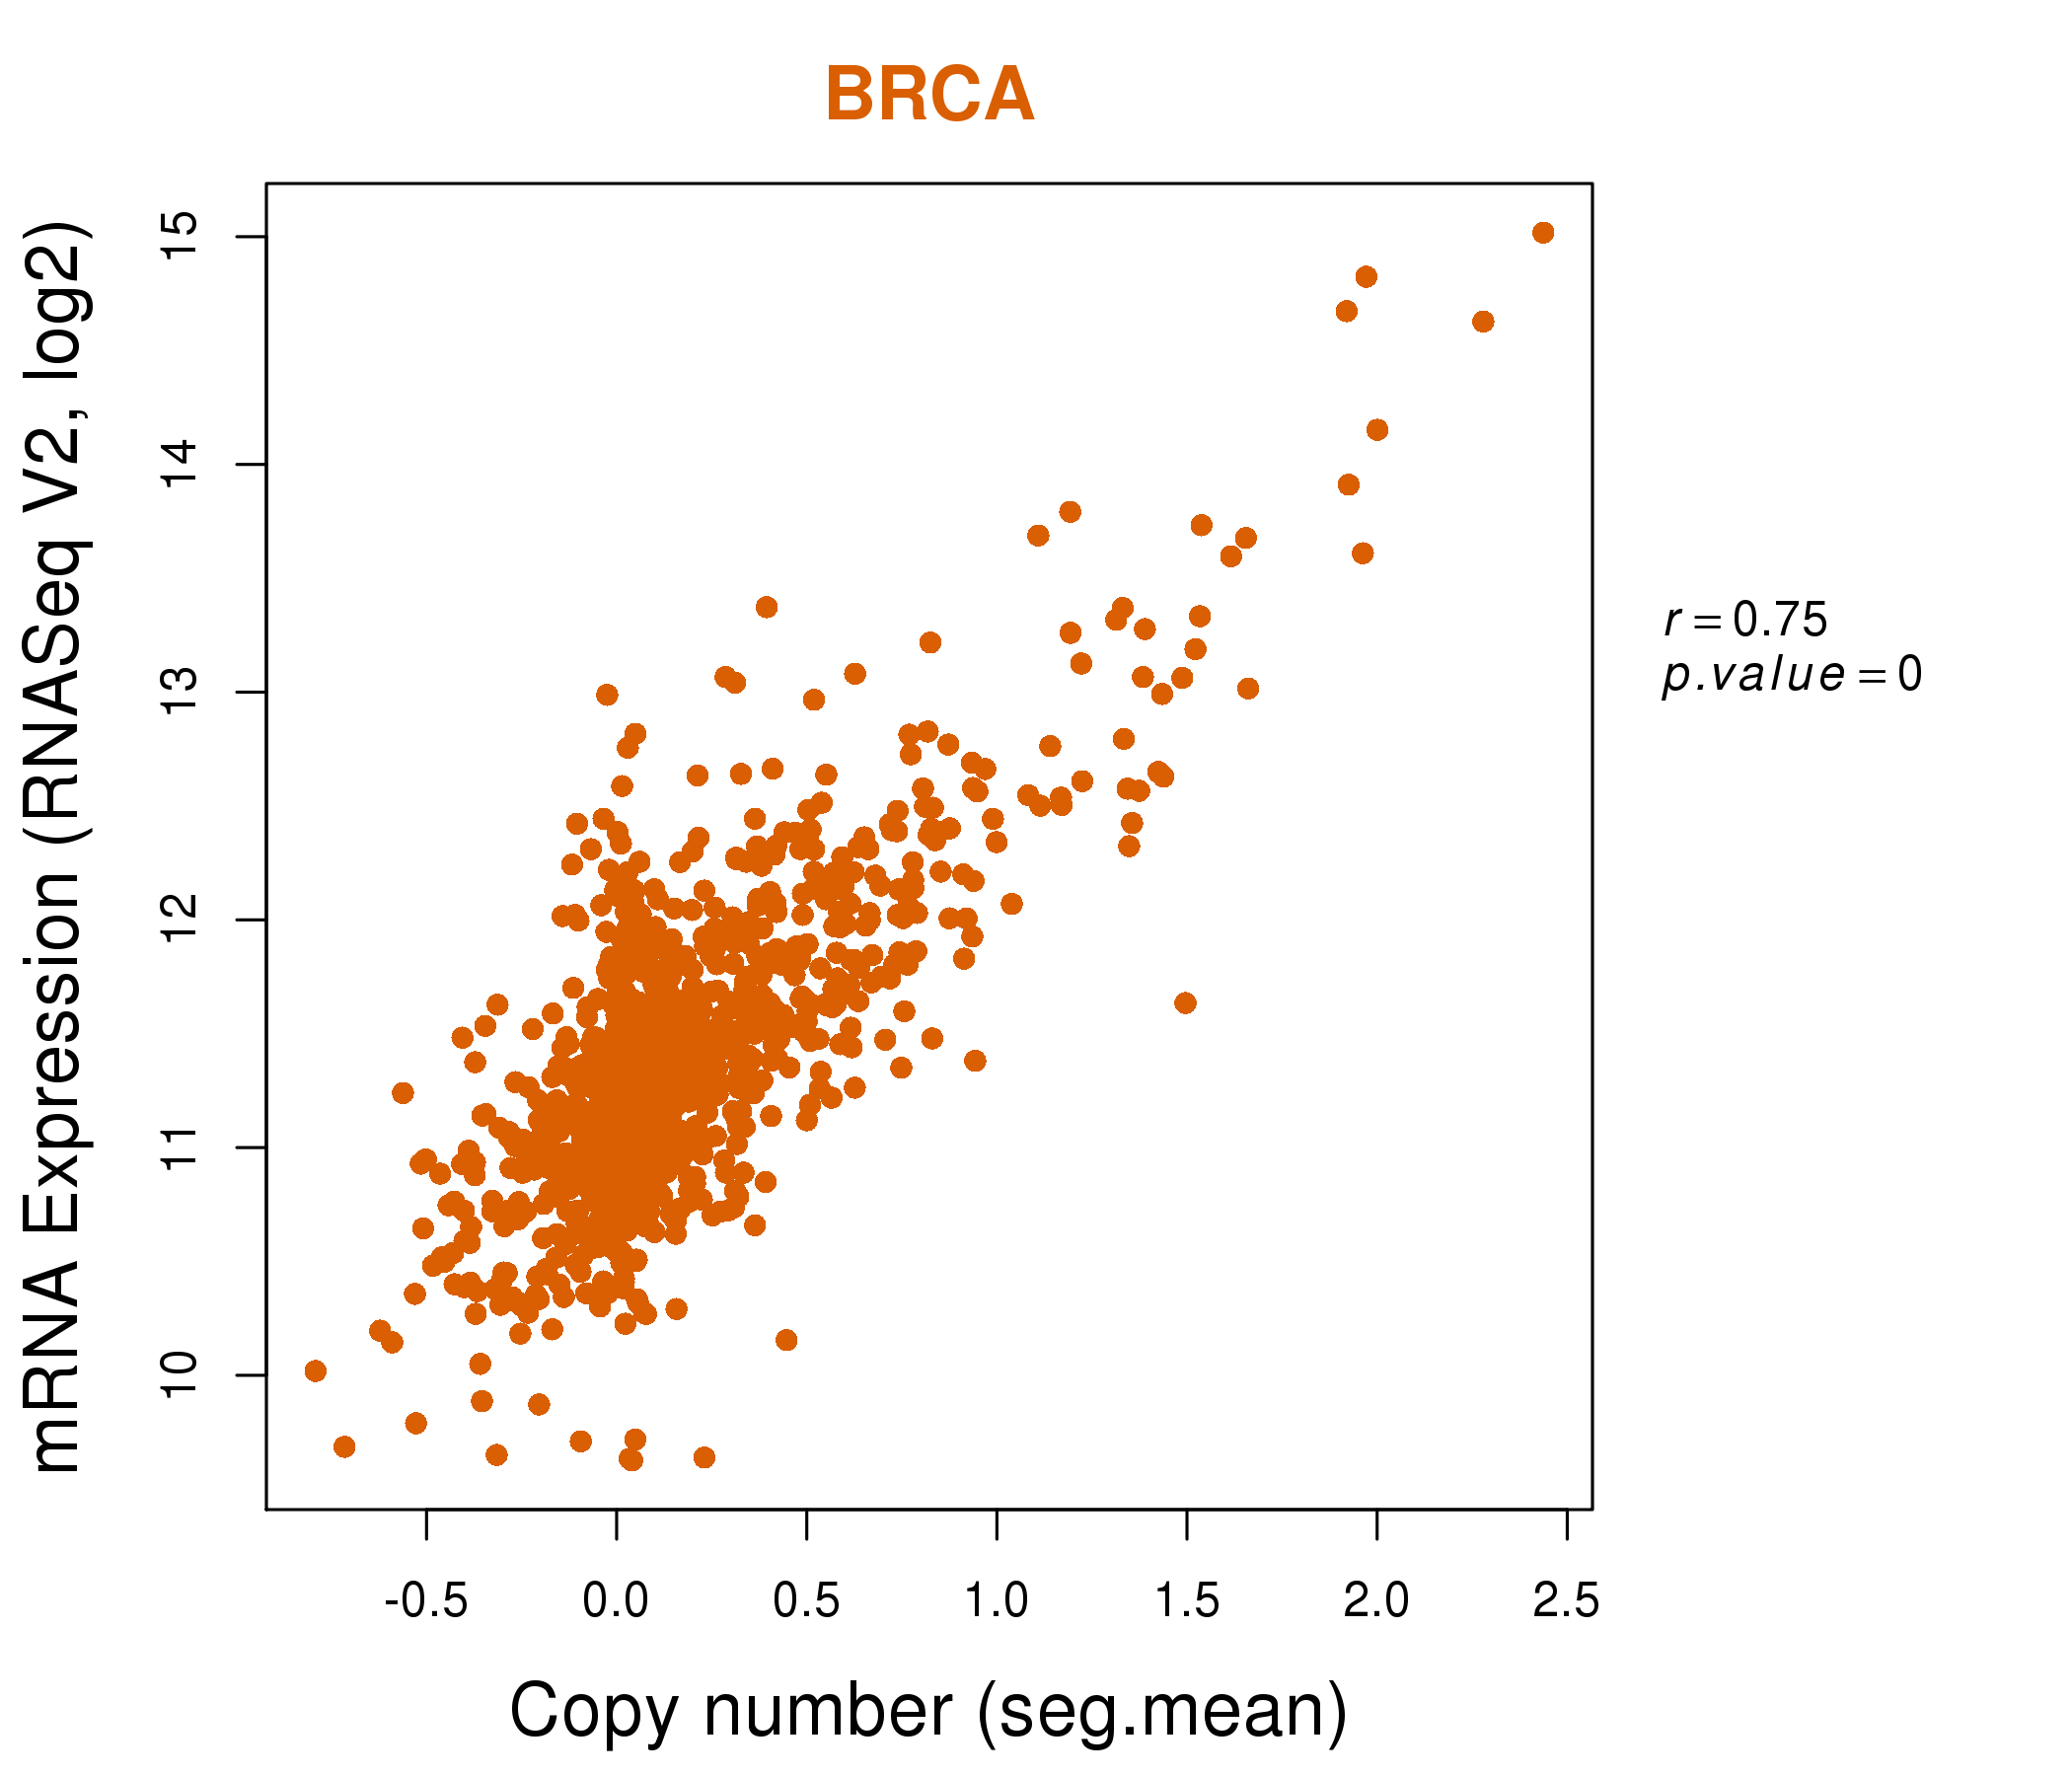
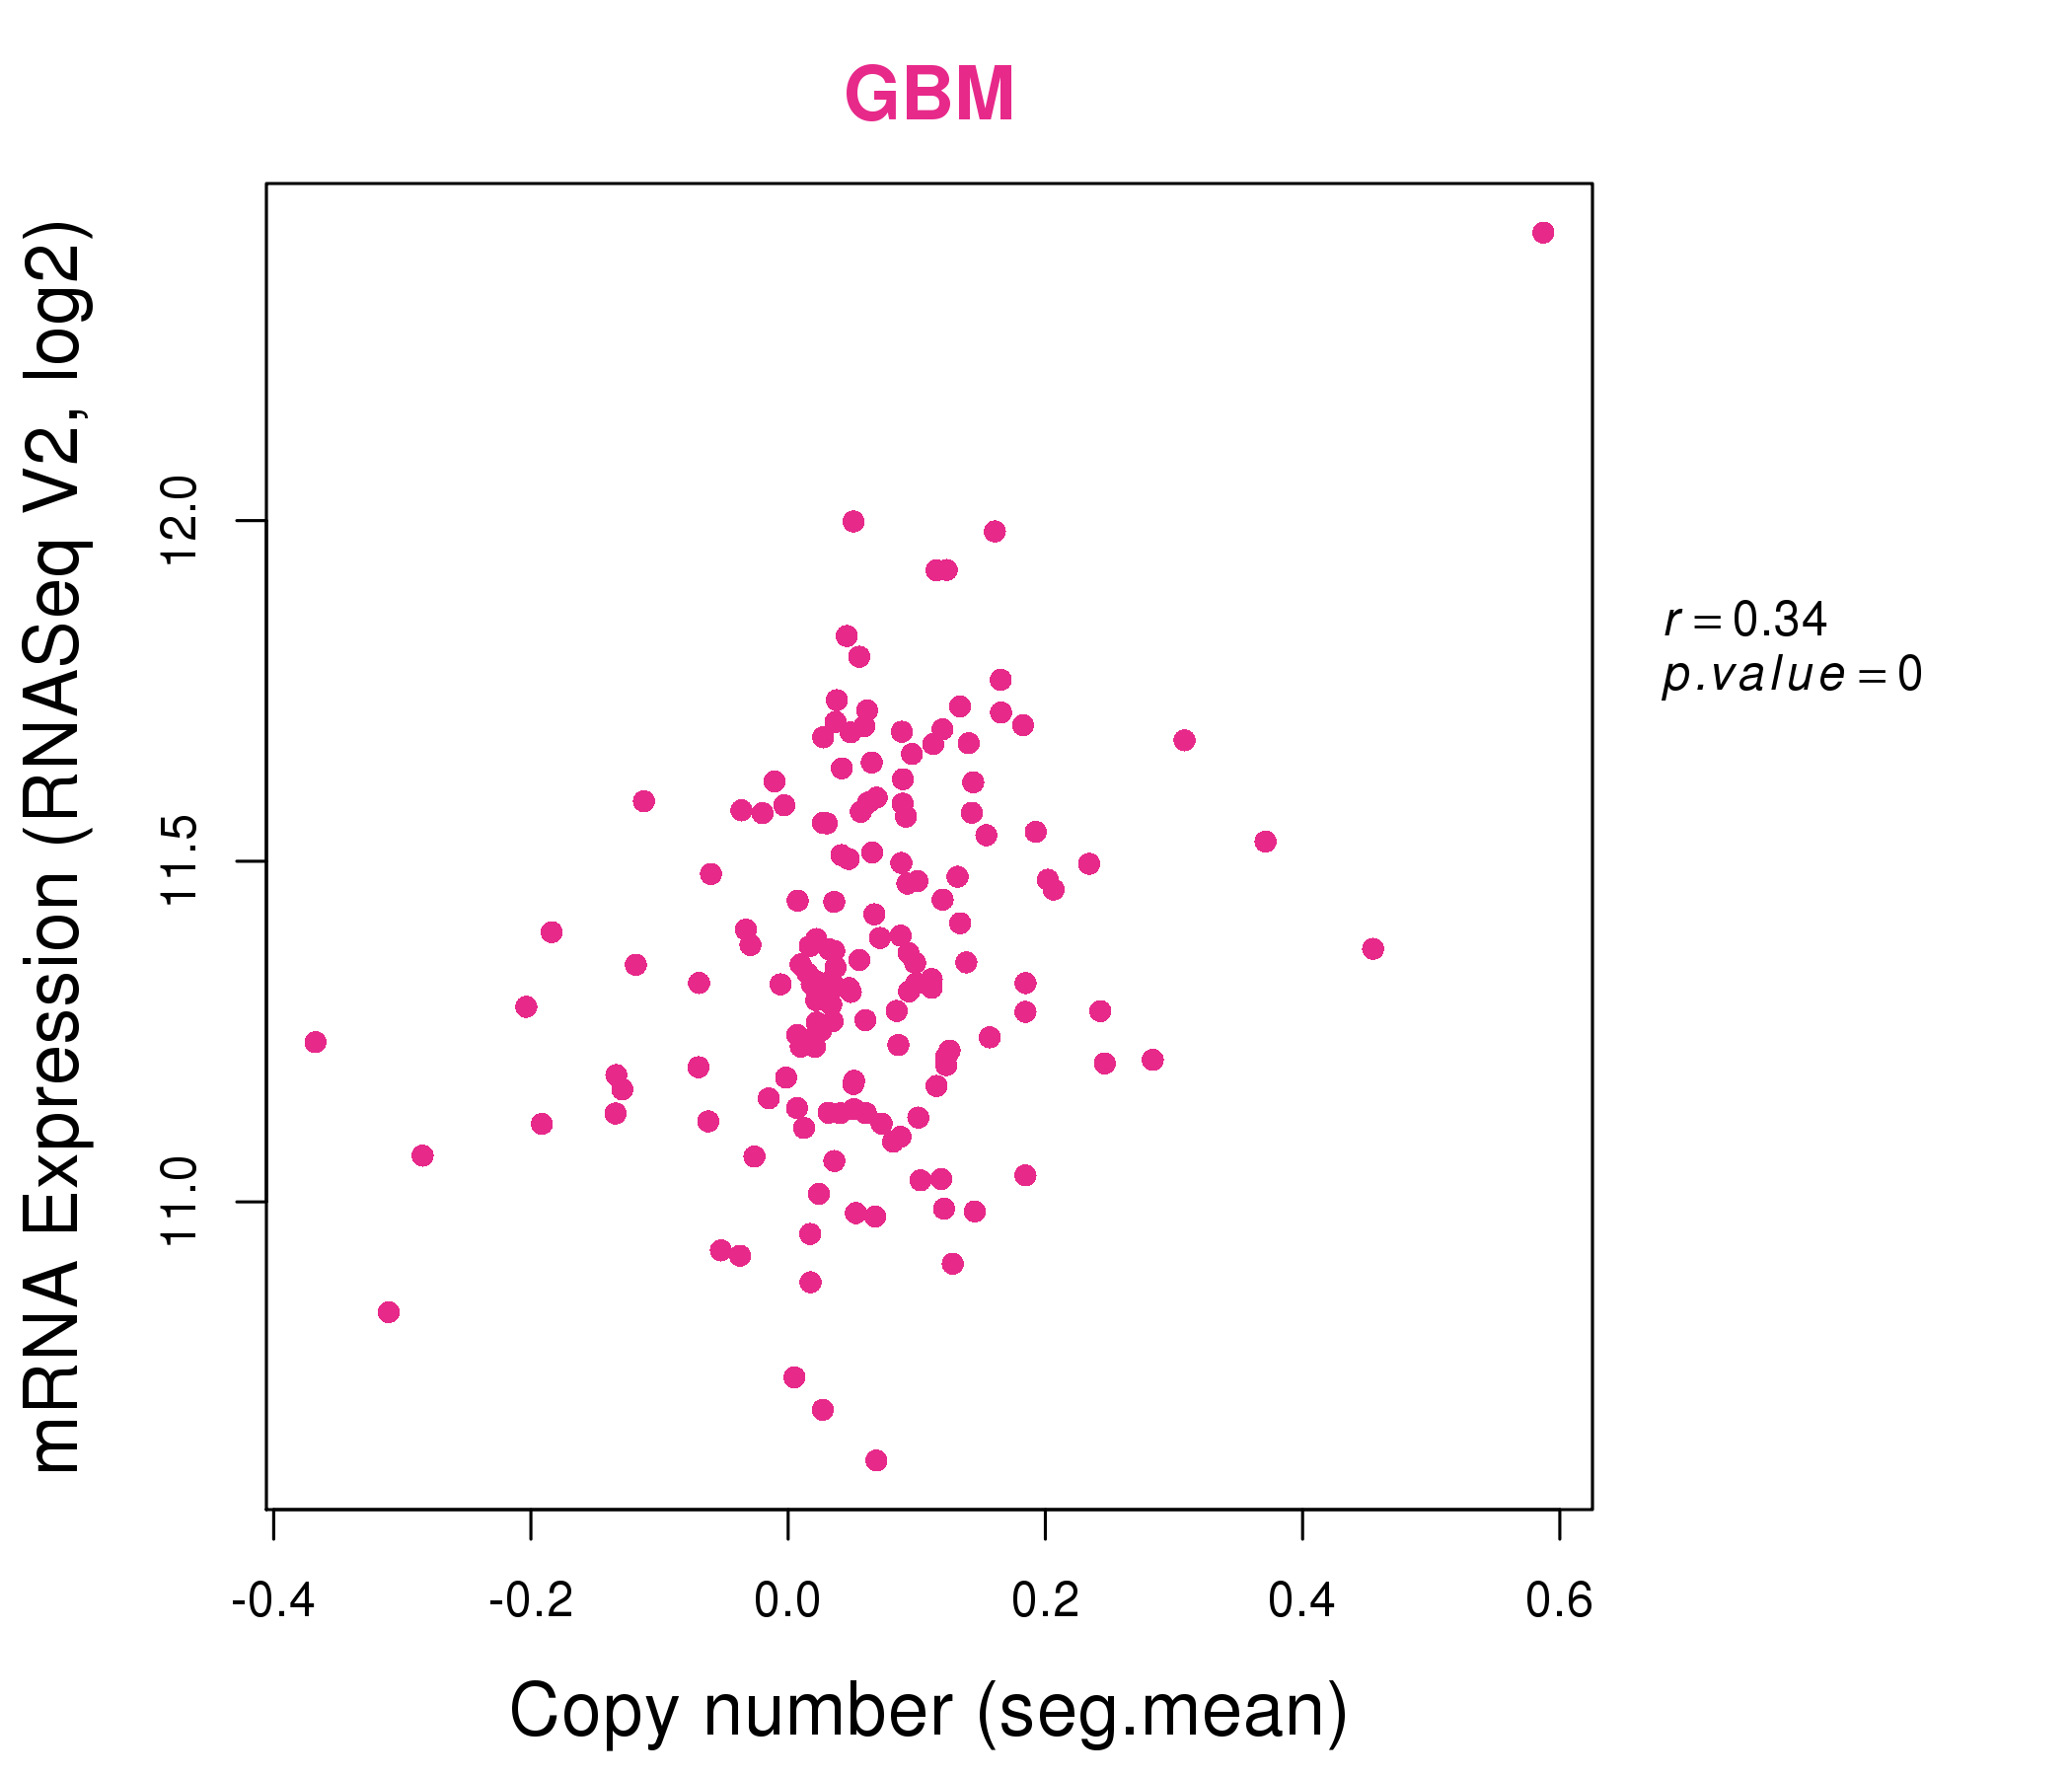
| * This plots show the correlation between CNV and gene expression. |
: Open all plots for all cancer types
 |
|
 |
|
| Top |
| Gene-Gene Network Information |
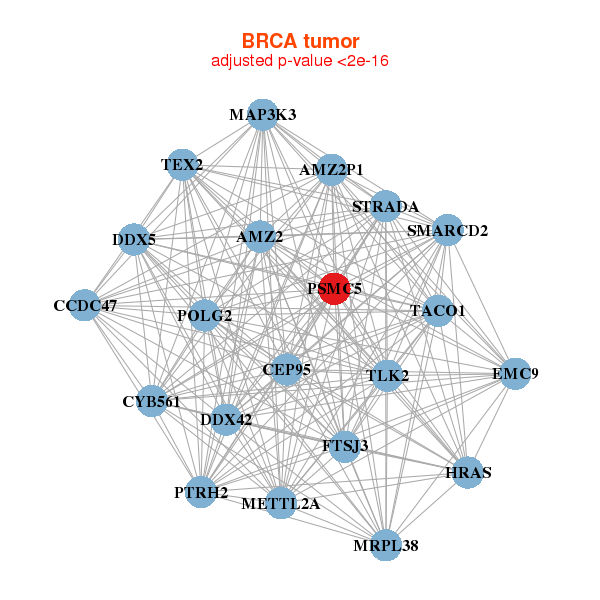
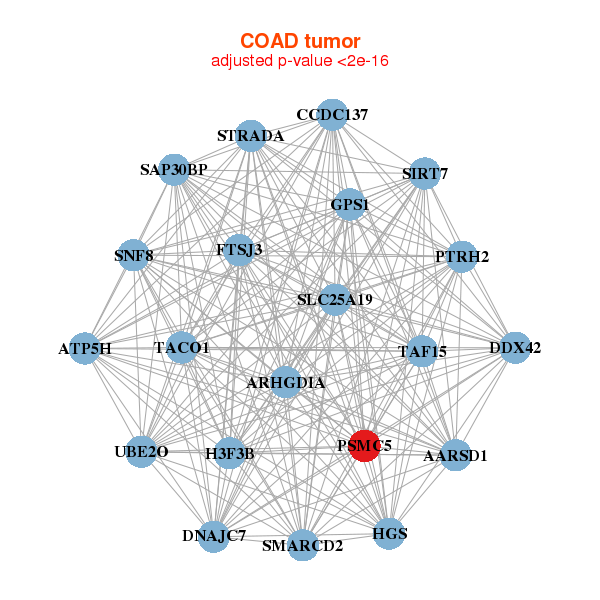
| * Co-Expression network figures were drawn using R package igraph. Only the top 20 genes with the highest correlations were shown. Red circle: input gene, orange circle: cell metabolism gene, sky circle: other gene |
: Open all plots for all cancer types
 |
|
| AMZ2,AMZ2P1,CEP95,CCDC47,CYB561,DDX42,DDX5, EMC9,FTSJ3,HRAS,MAP3K3,METTL2A,MRPL38,POLG2, PSMC5,PTRH2,SMARCD2,STRADA,TACO1,TEX2,TLK2 | ARL6IP4,AURKAIP1,HYPK,TSR3,C19orf70,CDC37,CHMP2A, COPS6,CUEDC2,FIS1,GADD45GIP1,MRPL28,NAA10,NDUFA13, NDUFS6,PDAP1,PSMC3,PSMC5,SNF8,STUB1,UBXN6 |
 |
|
| AARSD1,ARHGDIA,ATP5H,CCDC137,DDX42,DNAJC7,FTSJ3, GPS1,H3F3B,HGS,PSMC5,PTRH2,SAP30BP,SIRT7, SLC25A19,SMARCD2,SNF8,STRADA,TACO1,TAF15,UBE2O | ADCYAP1,APLN,KIAA1549L,CMSS1,CCDC124,ENO1,HARS, IFITM2,LEPREL1,NUDC,PDAP1,PFDN2,PGAM1,PSMB2, PSMB6,PSMC3,PSMC5,S100A11,STOM,TUBG1,U2AF1 |
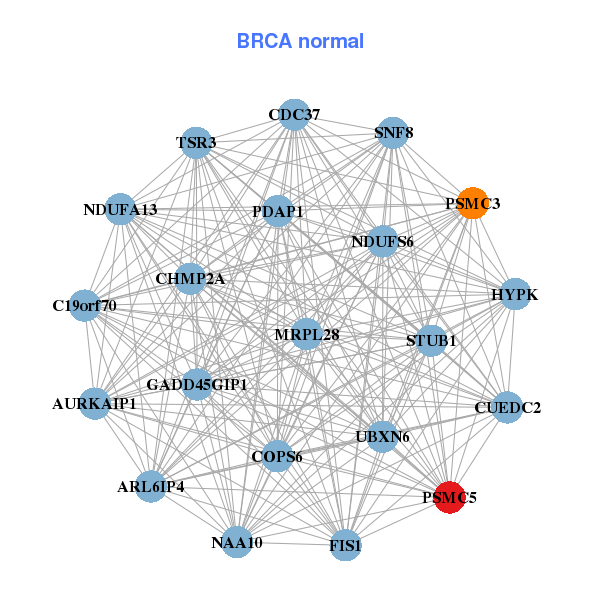
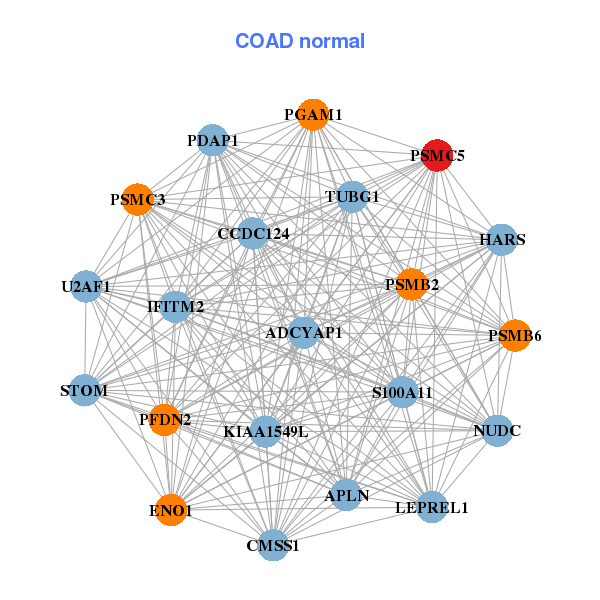
| * Co-Expression network figures were drawn using R package igraph. Only the top 20 genes with the highest correlations were shown. Red circle: input gene, orange circle: cell metabolism gene, sky circle: other gene |
: Open all plots for all cancer types
| Top |
: Open all interacting genes' information including KEGG pathway for all interacting genes from DAVID
| Top |
| Pharmacological Information for PSMC5 |
| There's no related Drug. |
| Top |
| Cross referenced IDs for PSMC5 |
| * We obtained these cross-references from Uniprot database. It covers 150 different DBs, 18 categories. http://www.uniprot.org/help/cross_references_section |
: Open all cross reference information
|
Copyright © 2016-Present - The Univsersity of Texas Health Science Center at Houston @ |