|
||||||||||||||||||||
| |
| Phenotypic Information (metabolism pathway, cancer, disease, phenome) |
| |
| |
| Gene-Gene Network Information: Co-Expression Network, Interacting Genes & KEGG |
| |
|


| Gene Summary for PSMD2 |
| Basic gene info. | Gene symbol | PSMD2 |
| Gene name | proteasome (prosome, macropain) 26S subunit, non-ATPase, 2 | |
| Synonyms | P97|RPN1|S2|TRAP2 | |
| Cytomap | UCSC genome browser: 3q27.1 | |
| Genomic location | chr3 :184017021-184026840 | |
| Type of gene | protein-coding | |
| RefGenes | NM_001278708.1, NM_001278709.1,NM_002808.4, | |
| Ensembl id | ENSG00000175166 | |
| Description | 26S proteasome non-ATPase regulatory subunit 255.11 proteinTNFR-associated protein 2protein 55.11tumor necrosis factor type 1 receptor-associated protein 2 | |
| Modification date | 20141207 | |
| dbXrefs | MIM : 606223 | |
| HGNC : HGNC | ||
| Ensembl : ENSG00000175166 | ||
| HPRD : 05870 | ||
| Vega : OTTHUMG00000156796 | ||
| Protein | UniProt: go to UniProt's Cross Reference DB Table | |
| Expression | CleanEX: HS_PSMD2 | |
| BioGPS: 5708 | ||
| Gene Expression Atlas: ENSG00000175166 | ||
| The Human Protein Atlas: ENSG00000175166 | ||
| Pathway | NCI Pathway Interaction Database: PSMD2 | |
| KEGG: PSMD2 | ||
| REACTOME: PSMD2 | ||
| ConsensusPathDB | ||
| Pathway Commons: PSMD2 | ||
| Metabolism | MetaCyc: PSMD2 | |
| HUMANCyc: PSMD2 | ||
| Regulation | Ensembl's Regulation: ENSG00000175166 | |
| miRBase: chr3 :184,017,021-184,026,840 | ||
| TargetScan: NM_001278708 | ||
| cisRED: ENSG00000175166 | ||
| Context | iHOP: PSMD2 | |
| cancer metabolism search in PubMed: PSMD2 | ||
| UCL Cancer Institute: PSMD2 | ||
| Assigned class in ccmGDB | C | |
| Top |
| Phenotypic Information for PSMD2(metabolism pathway, cancer, disease, phenome) |
| Cancer | CGAP: PSMD2 |
| Familial Cancer Database: PSMD2 | |
| * This gene is included in those cancer gene databases. |
|
|
|
|
|
| . | ||||||||||||||
Oncogene 1 | Significant driver gene in | |||||||||||||||||||
| cf) number; DB name 1 Oncogene; http://nar.oxfordjournals.org/content/35/suppl_1/D721.long, 2 Tumor Suppressor gene; https://bioinfo.uth.edu/TSGene/, 3 Cancer Gene Census; http://www.nature.com/nrc/journal/v4/n3/abs/nrc1299.html, 4 CancerGenes; http://nar.oxfordjournals.org/content/35/suppl_1/D721.long, 5 Network of Cancer Gene; http://ncg.kcl.ac.uk/index.php, 1Therapeutic Vulnerabilities in Cancer; http://cbio.mskcc.org/cancergenomics/statius/ |
| REACTOME_METABOLISM_OF_AMINO_ACIDS_AND_DERIVATIVES REACTOME_METABOLISM_OF_MRNA REACTOME_METABOLISM_OF_RNA | |
| OMIM | |
| Orphanet | |
| Disease | KEGG Disease: PSMD2 |
| MedGen: PSMD2 (Human Medical Genetics with Condition) | |
| ClinVar: PSMD2 | |
| Phenotype | MGI: PSMD2 (International Mouse Phenotyping Consortium) |
| PhenomicDB: PSMD2 | |
| Mutations for PSMD2 |
| * Under tables are showing count per each tissue to give us broad intuition about tissue specific mutation patterns.You can go to the detailed page for each mutation database's web site. |
| There's no structural variation information in COSMIC data for this gene. |
| * From mRNA Sanger sequences, Chitars2.0 arranged chimeric transcripts. This table shows PSMD2 related fusion information. |
| ID | Head Gene | Tail Gene | Accession | Gene_a | qStart_a | qEnd_a | Chromosome_a | tStart_a | tEnd_a | Gene_a | qStart_a | qEnd_a | Chromosome_a | tStart_a | tEnd_a |
| CA336957 | PSMD2 | 37 | 273 | 3 | 184017116 | 184018173 | HDAC10 | 271 | 358 | 22 | 50683616 | 50683703 | |
| CA336827 | PSMD2 | 37 | 273 | 3 | 184017116 | 184018173 | HDAC10 | 271 | 362 | 22 | 50683612 | 50683703 | |
| CA336584 | PSMD2 | 1 | 155 | 3 | 184017035 | 184017189 | YBX2 | 156 | 215 | 17 | 7191584 | 7191643 | |
| DA541950 | DHFR | 1 | 107 | 5 | 79947318 | 79947424 | PSMD2 | 108 | 556 | 3 | 184019408 | 184020492 | |
| BE002761 | PSMD2 | 5 | 158 | 3 | 184018072 | 184018227 | TTC39C | 141 | 514 | 18 | 21619719 | 21620092 | |
| BF081412 | DST | 10 | 355 | 6 | 56371298 | 56373505 | PSMD2 | 343 | 570 | 3 | 184023571 | 184023926 | |
| BE720207 | PSMD2 | 6 | 279 | 3 | 184021161 | 184021806 | INPP1 | 260 | 458 | 2 | 191236012 | 191236210 | |
| AI201767 | SYS1 | 1 | 221 | 20 | 43996535 | 43996755 | PSMD2 | 216 | 332 | 3 | 184019372 | 184019676 | |
| AF075367 | SERPINA1 | 1 | 439 | 14 | 94849170 | 94854926 | PSMD2 | 429 | 683 | 3 | 184026505 | 184026757 | |
| CO245088 | PSMD2 | 18 | 73 | 3 | 184023562 | 184023617 | PSMD2 | 72 | 751 | 3 | 184017638 | 184020284 | |
| AI110868 | SERPINA1 | 1 | 439 | 14 | 94849170 | 94854926 | PSMD2 | 429 | 683 | 3 | 184026505 | 184026757 | |
| BE720196 | PSMD2 | 2 | 285 | 3 | 184021161 | 184021818 | INPP1 | 266 | 464 | 2 | 191236012 | 191236210 | |
| BE003023 | PSMD2 | 15 | 119 | 3 | 184018072 | 184018176 | PSMD2 | 112 | 312 | 3 | 184018205 | 184019685 | |
| Top |
| There's no copy number variation information in COSMIC data for this gene. |
| Top |
|
 |
| Top |
| Stat. for Non-Synonymous SNVs (# total SNVs=40) | (# total SNVs=18) |
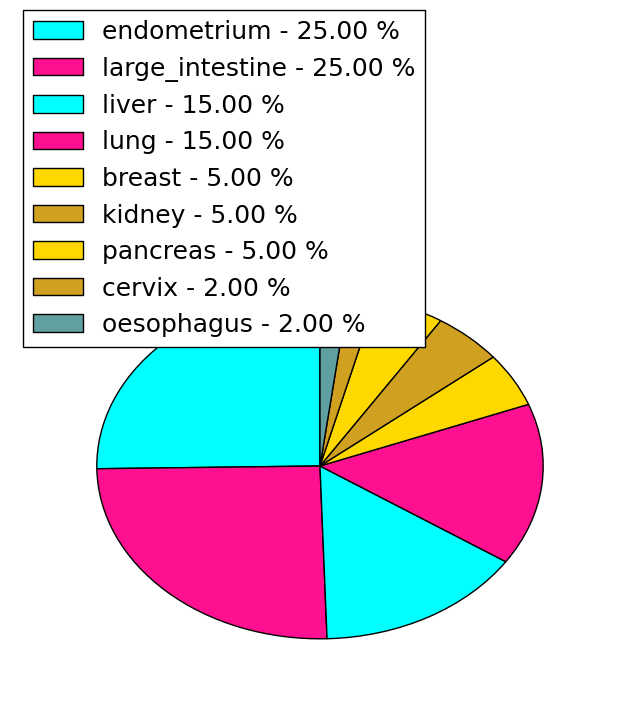 | 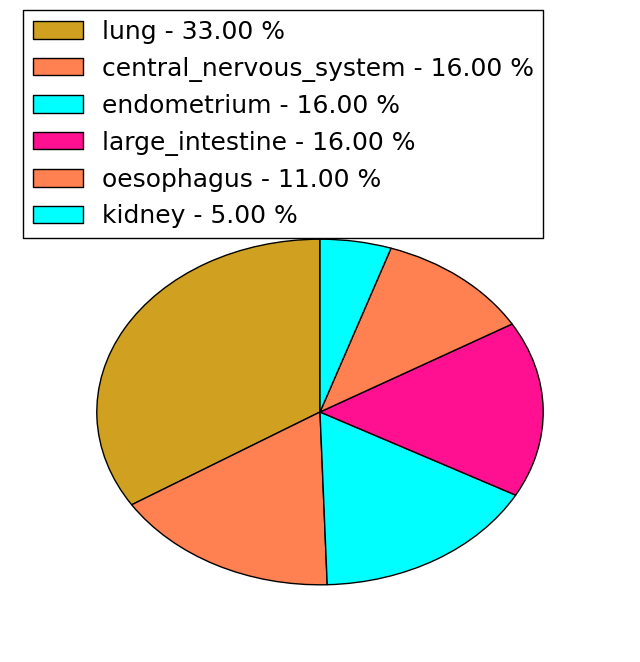 |
(# total SNVs=2) | (# total SNVs=0) |
 |
| Top |
| * When you move the cursor on each content, you can see more deailed mutation information on the Tooltip. Those are primary_site,primary_histology,mutation(aa),pubmedID. |
| GRCh37 position | Mutation(aa) | Unique sampleID count |
| chr3:184020156-184020156 | p.? | 3 |
| chr3:184024196-184024196 | p.D621E | 2 |
| chr3:184017699-184017699 | p.? | 2 |
| chr3:184025278-184025278 | p.Y723C | 2 |
| chr3:184025435-184025435 | p.R746H | 2 |
| chr3:184021749-184021749 | p.L446L | 2 |
| chr3:184018174-184018174 | p.R100H | 2 |
| chr3:184019697-184019697 | p.R181Q | 2 |
| chr3:184026538-184026538 | p.T863A | 1 |
| chr3:184019718-184019718 | p.V188A | 1 |
| Top |
|
 |
| Point Mutation/ Tissue ID | 1 | 2 | 3 | 4 | 5 | 6 | 7 | 8 | 9 | 10 | 11 | 12 | 13 | 14 | 15 | 16 | 17 | 18 | 19 | 20 |
| # sample | 2 | 1 | 8 | 1 | 7 | 2 | 6 | 4 | 1 | 7 | 15 | 12 | ||||||||
| # mutation | 2 | 1 | 8 | 1 | 7 | 2 | 7 | 4 | 1 | 7 | 18 | 12 | ||||||||
| nonsynonymous SNV | 2 | 1 | 5 | 3 | 2 | 4 | 2 | 1 | 2 | 14 | 9 | |||||||||
| synonymous SNV | 3 | 1 | 4 | 3 | 2 | 5 | 4 | 3 |
| cf) Tissue ID; Tissue type (1; BLCA[Bladder Urothelial Carcinoma], 2; BRCA[Breast invasive carcinoma], 3; CESC[Cervical squamous cell carcinoma and endocervical adenocarcinoma], 4; COAD[Colon adenocarcinoma], 5; GBM[Glioblastoma multiforme], 6; Glioma Low Grade, 7; HNSC[Head and Neck squamous cell carcinoma], 8; KICH[Kidney Chromophobe], 9; KIRC[Kidney renal clear cell carcinoma], 10; KIRP[Kidney renal papillary cell carcinoma], 11; LAML[Acute Myeloid Leukemia], 12; LUAD[Lung adenocarcinoma], 13; LUSC[Lung squamous cell carcinoma], 14; OV[Ovarian serous cystadenocarcinoma ], 15; PAAD[Pancreatic adenocarcinoma], 16; PRAD[Prostate adenocarcinoma], 17; SKCM[Skin Cutaneous Melanoma], 18:STAD[Stomach adenocarcinoma], 19:THCA[Thyroid carcinoma], 20:UCEC[Uterine Corpus Endometrial Carcinoma]) |
| Top |
| * We represented just top 10 SNVs. When you move the cursor on each content, you can see more deailed mutation information on the Tooltip. Those are primary_site, primary_histology, mutation(aa), pubmedID. |
| Genomic Position | Mutation(aa) | Unique sampleID count |
| chr3:184019697 | p.L758F,PSMD2 | 2 |
| chr3:184026613 | p.R100H | 2 |
| chr3:184018174 | p.R616H,PSMD2 | 2 |
| chr3:184025435 | p.R51Q,PSMD2 | 2 |
| chr3:184025484 | p.R557Q,PSMD2 | 1 |
| chr3:184020522 | p.T733A,PSMD2 | 1 |
| chr3:184026546 | p.C121C,PSMD2 | 1 |
| chr3:184022099 | p.G356G,PSMD2 | 1 |
| chr3:184024268 | p.N575N,PSMD2 | 1 |
| chr3:184025708 | p.F735F,PSMD2 | 1 |
| * Copy number data were extracted from TCGA using R package TCGA-Assembler. The URLs of all public data files on TCGA DCC data server were gathered on Jan-05-2015. Function ProcessCNAData in TCGA-Assembler package was used to obtain gene-level copy number value which is calculated as the average copy number of the genomic region of a gene. |
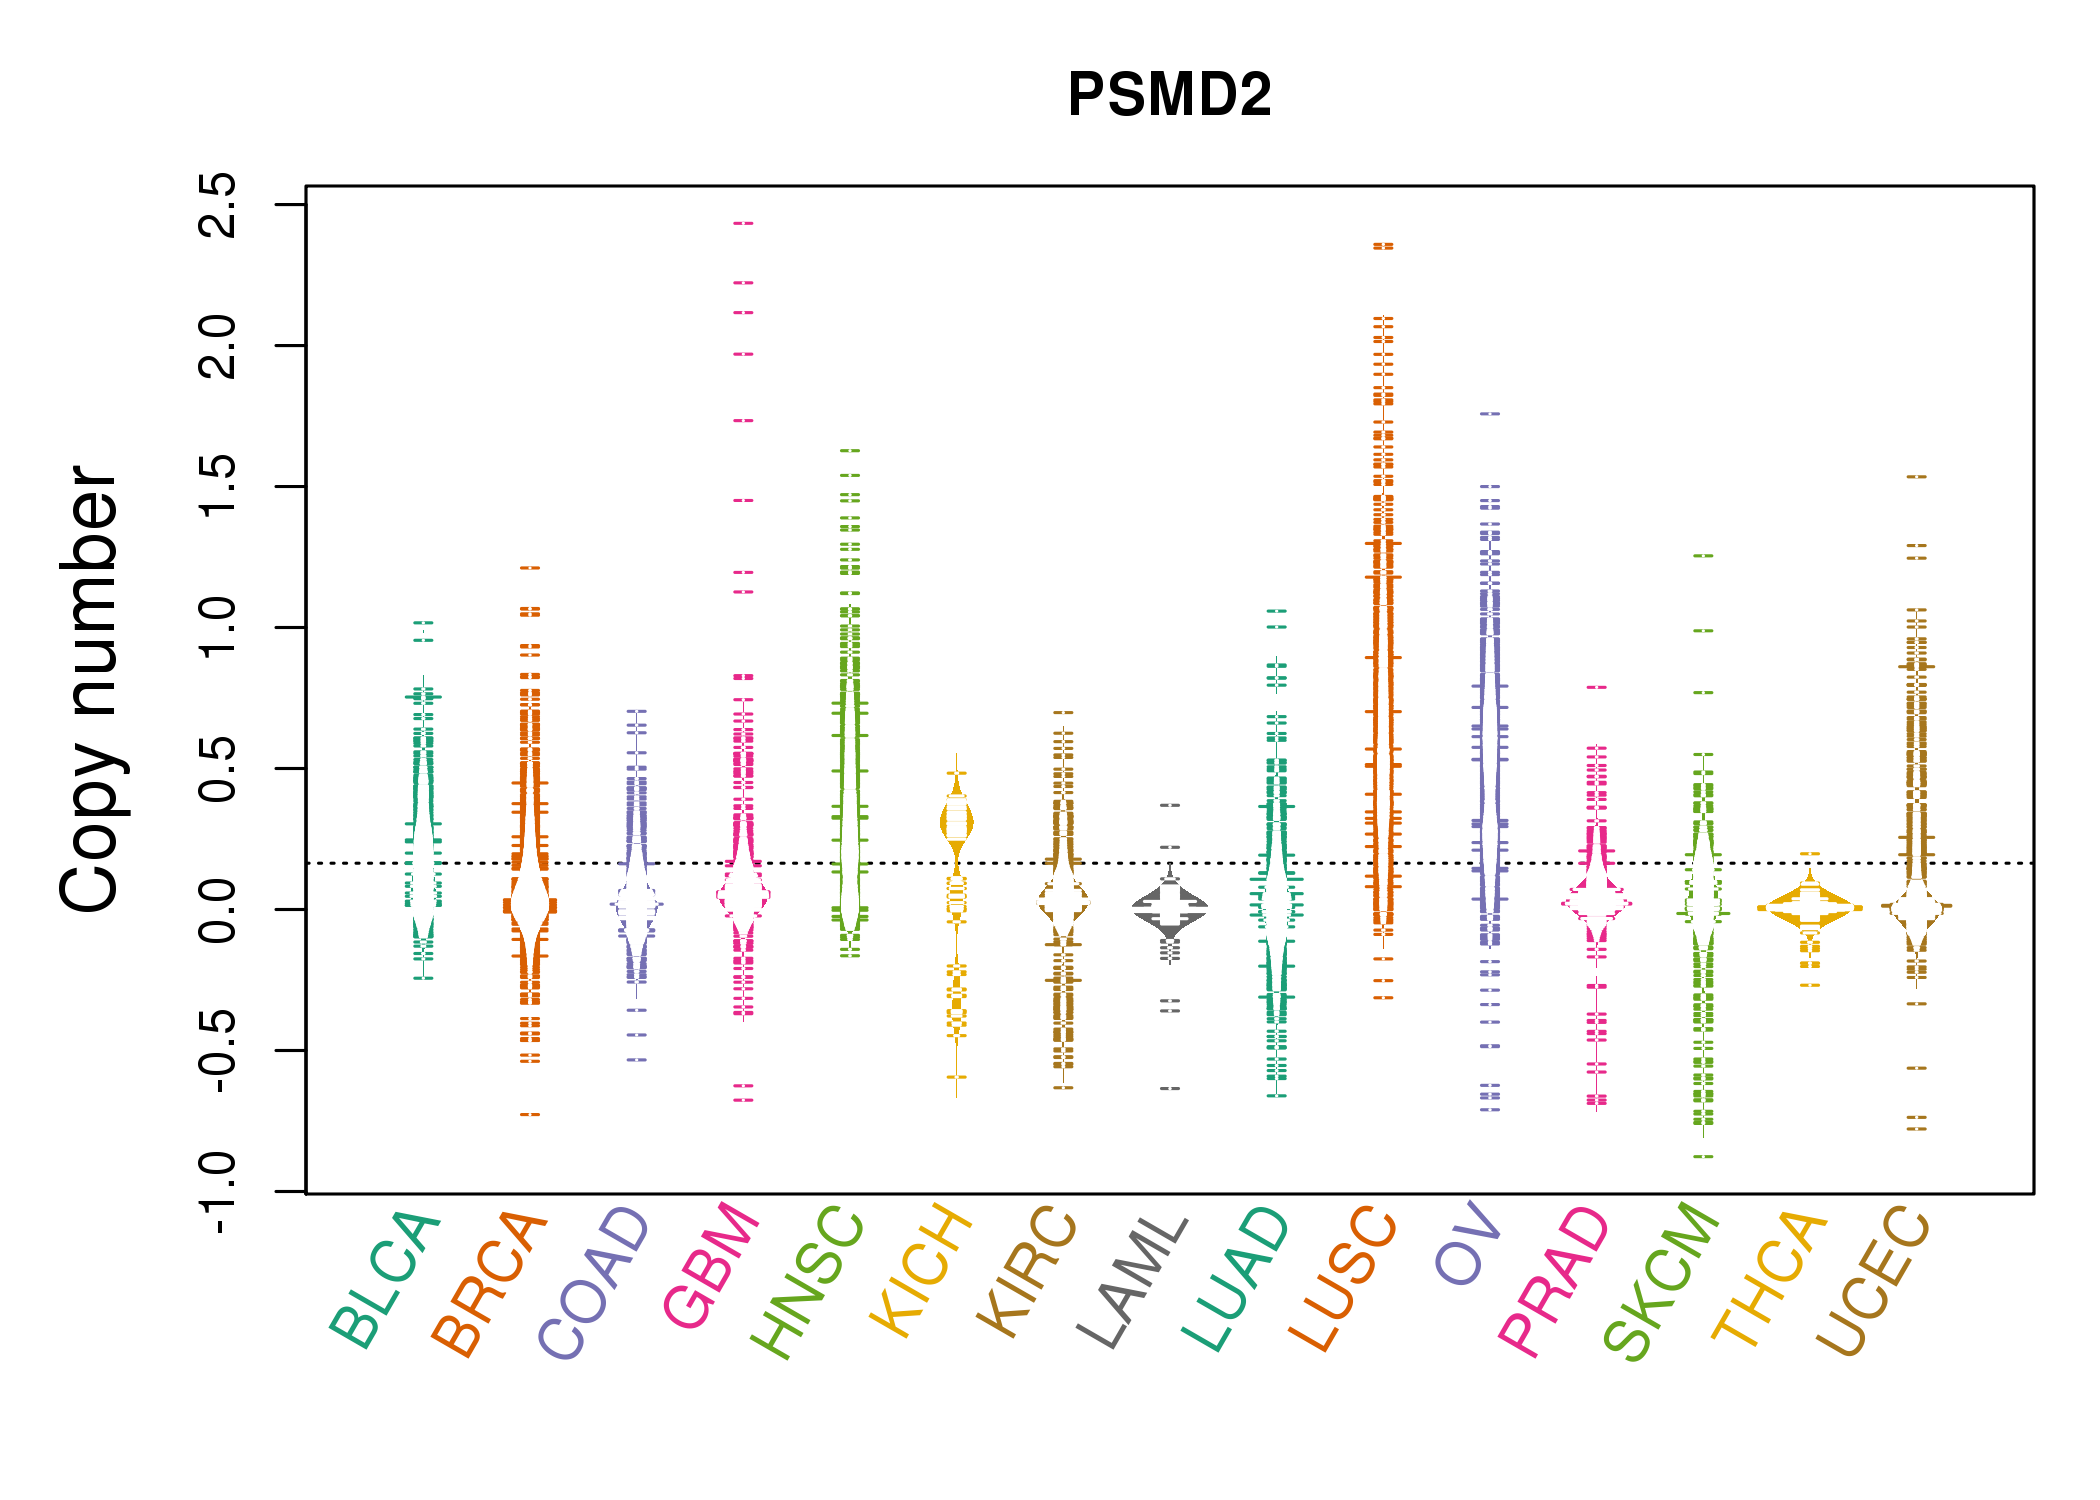 |
| cf) Tissue ID[Tissue type]: BLCA[Bladder Urothelial Carcinoma], BRCA[Breast invasive carcinoma], CESC[Cervical squamous cell carcinoma and endocervical adenocarcinoma], COAD[Colon adenocarcinoma], GBM[Glioblastoma multiforme], Glioma Low Grade, HNSC[Head and Neck squamous cell carcinoma], KICH[Kidney Chromophobe], KIRC[Kidney renal clear cell carcinoma], KIRP[Kidney renal papillary cell carcinoma], LAML[Acute Myeloid Leukemia], LUAD[Lung adenocarcinoma], LUSC[Lung squamous cell carcinoma], OV[Ovarian serous cystadenocarcinoma ], PAAD[Pancreatic adenocarcinoma], PRAD[Prostate adenocarcinoma], SKCM[Skin Cutaneous Melanoma], STAD[Stomach adenocarcinoma], THCA[Thyroid carcinoma], UCEC[Uterine Corpus Endometrial Carcinoma] |
| Top |
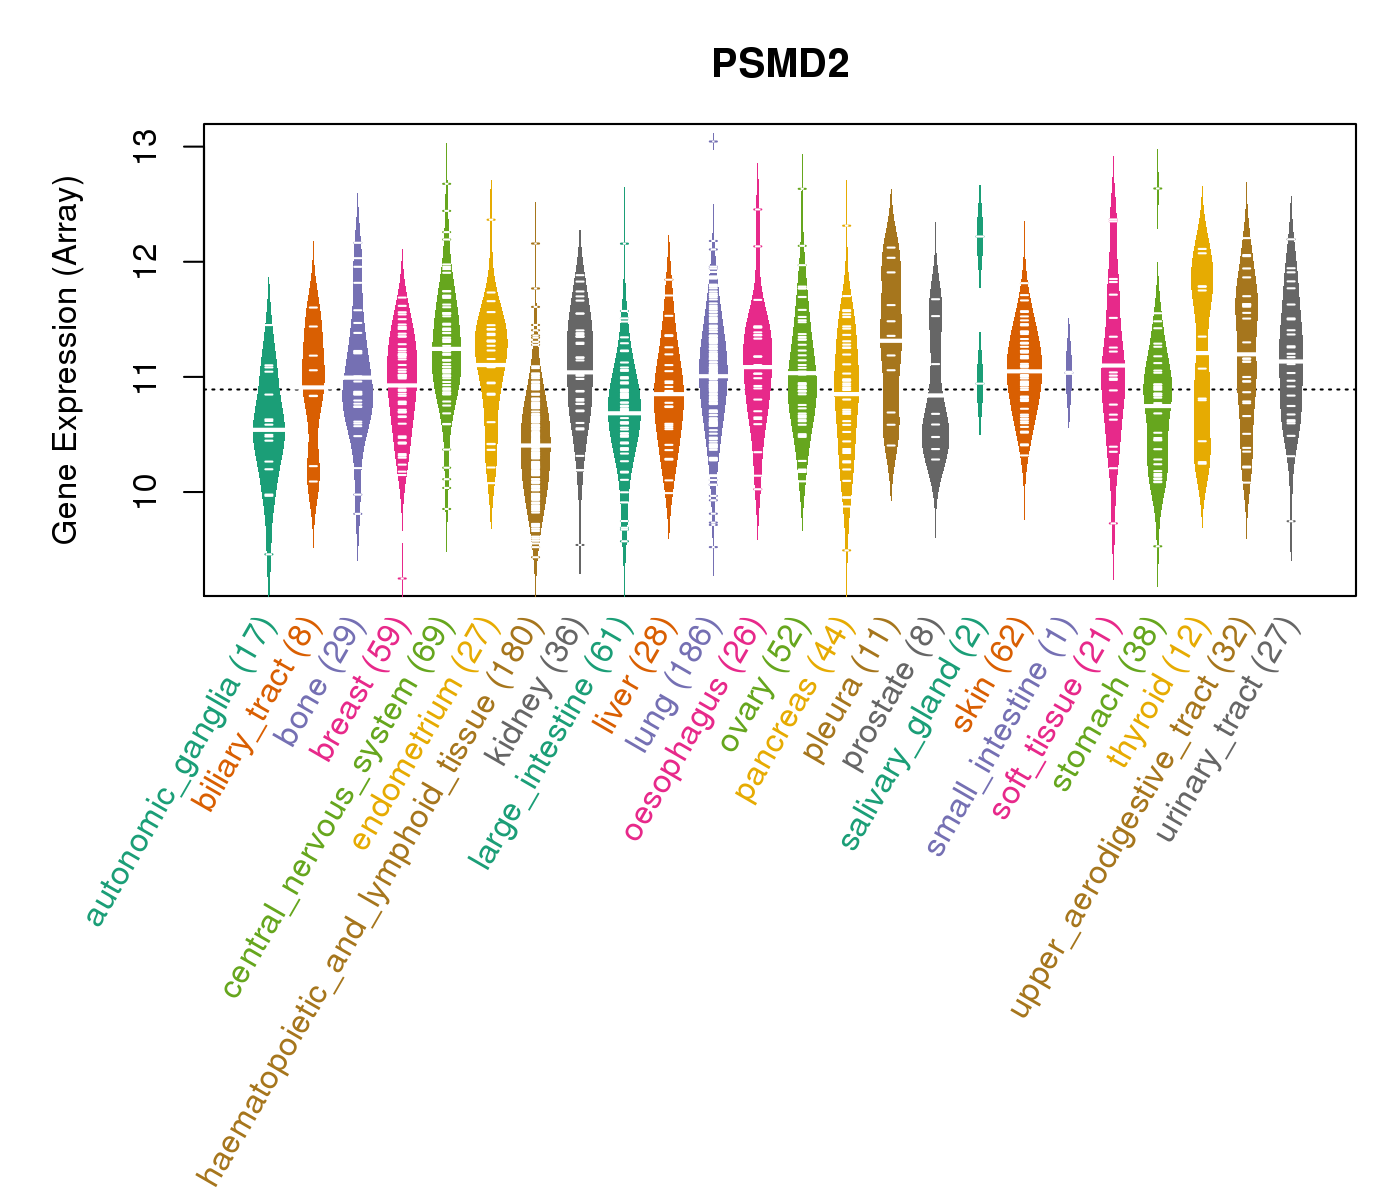
| Gene Expression for PSMD2 |
| * CCLE gene expression data were extracted from CCLE_Expression_Entrez_2012-10-18.res: Gene-centric RMA-normalized mRNA expression data. |
 |
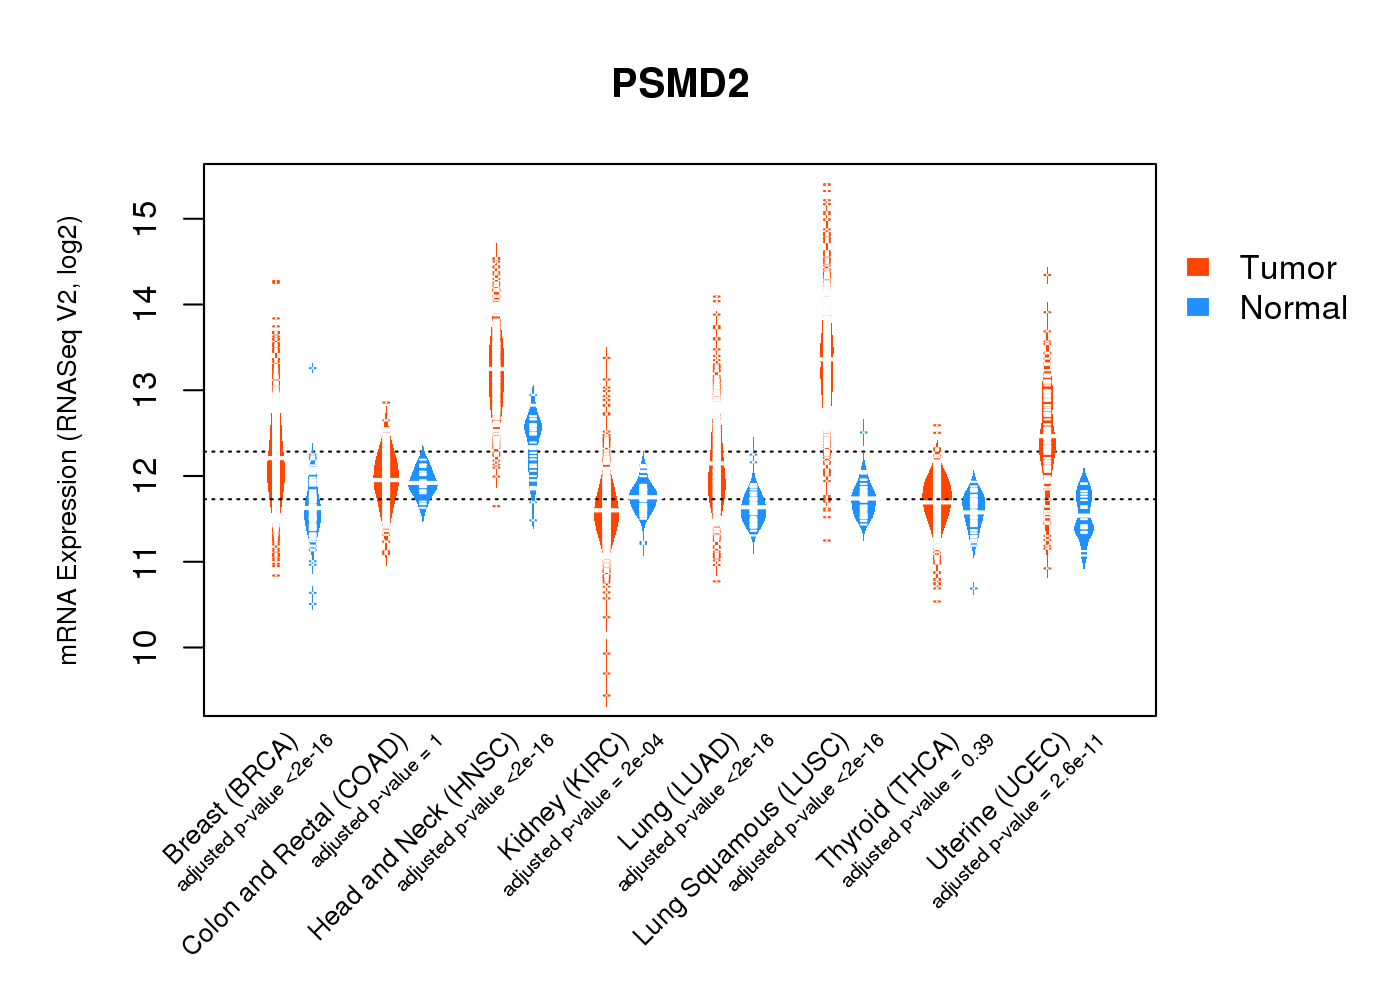
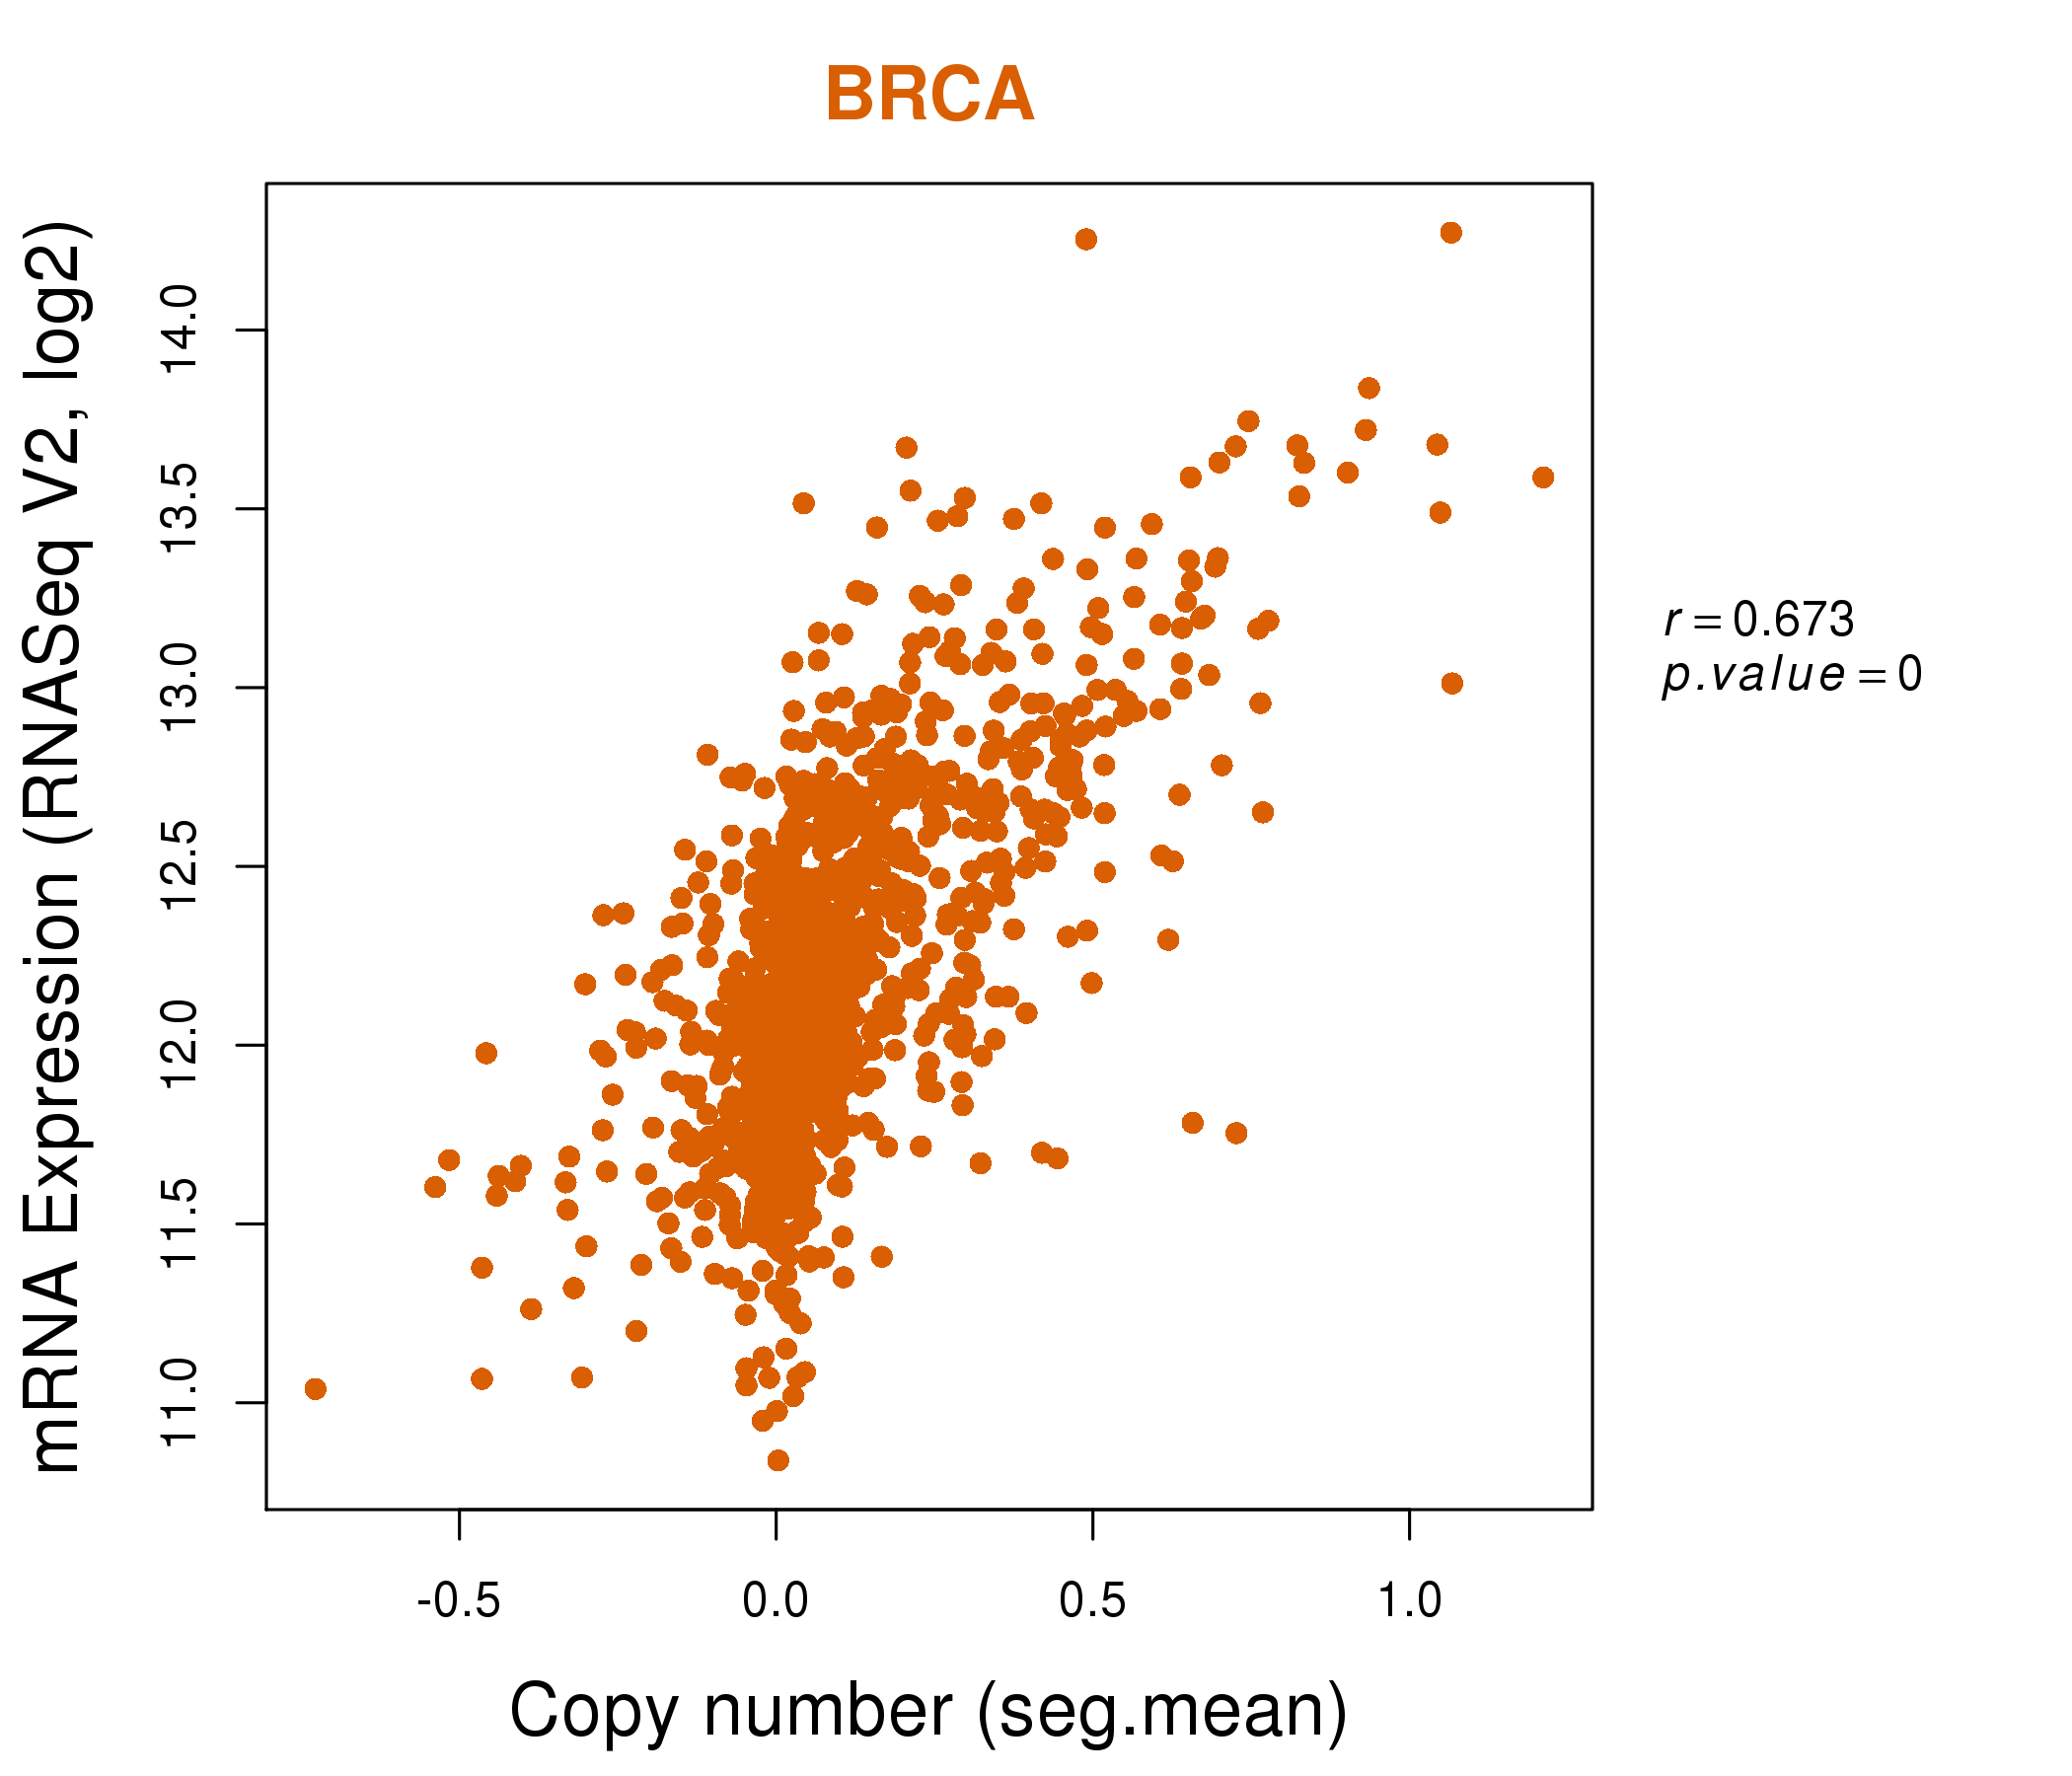
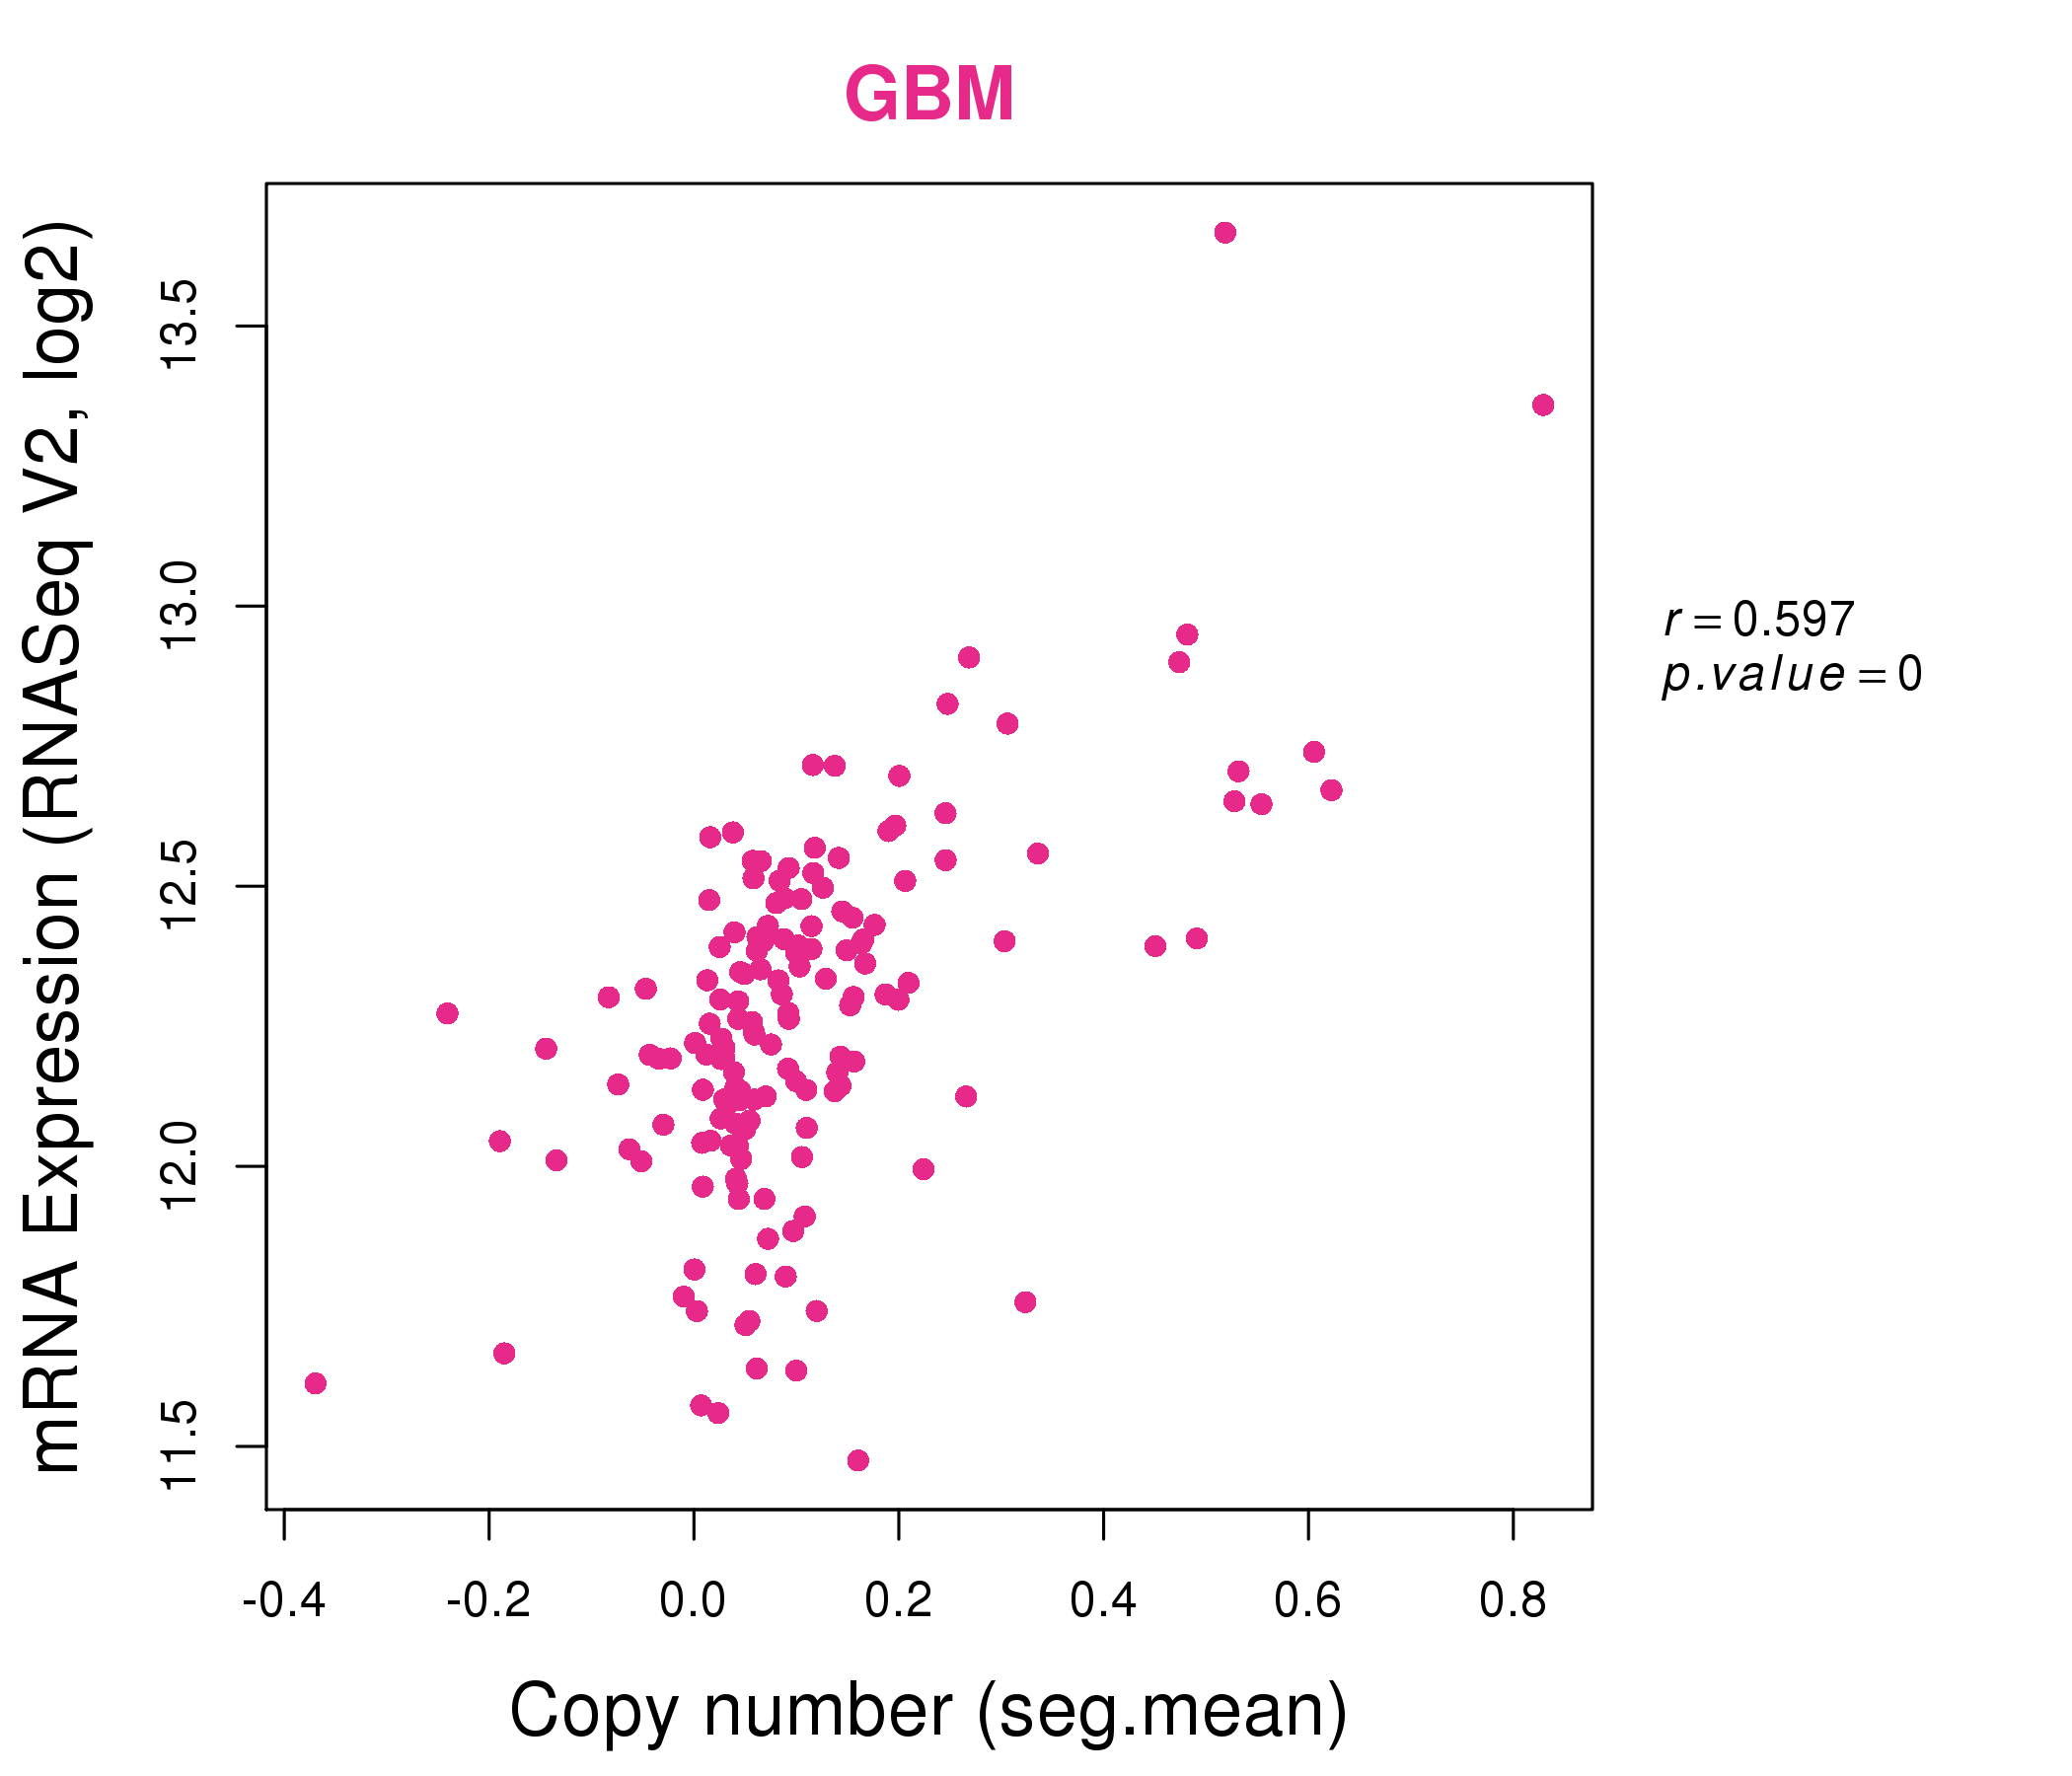
| * Normalized gene expression data of RNASeqV2 was extracted from TCGA using R package TCGA-Assembler. The URLs of all public data files on TCGA DCC data server were gathered at Jan-05-2015. Only eight cancer types have enough normal control samples for differential expression analysis. (t test, adjusted p<0.05 (using Benjamini-Hochberg FDR)) |
 |
| Top |
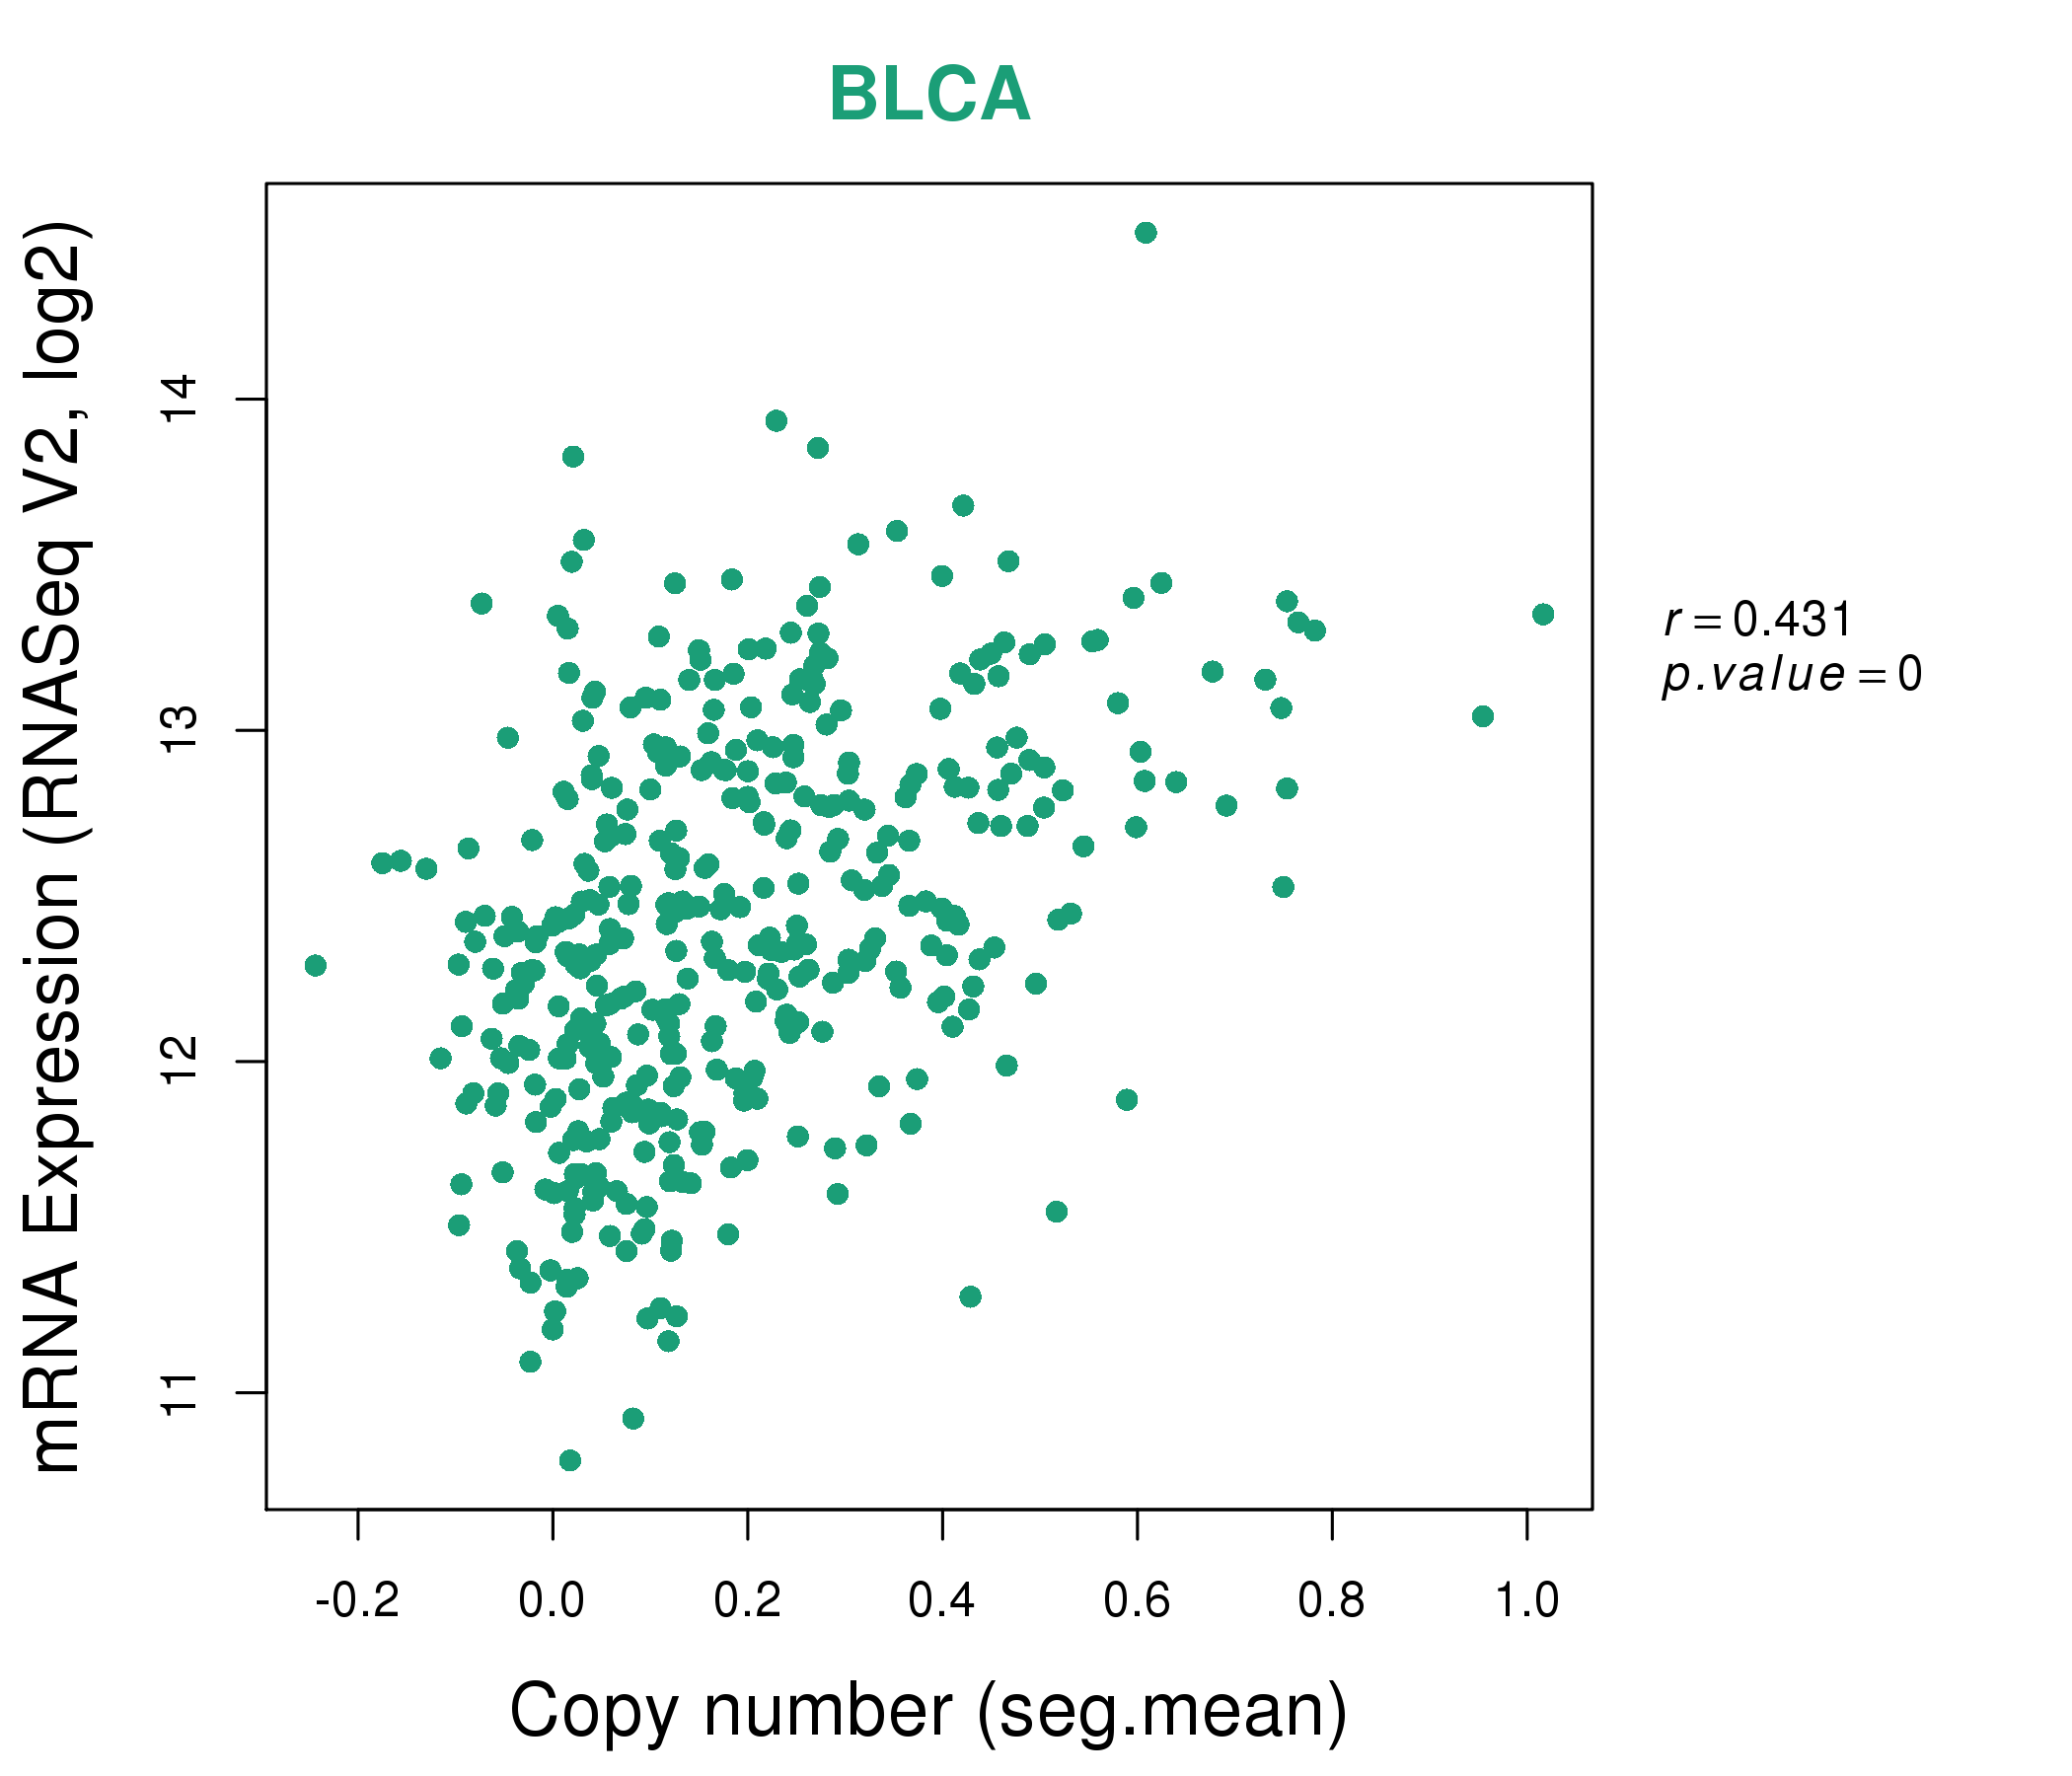
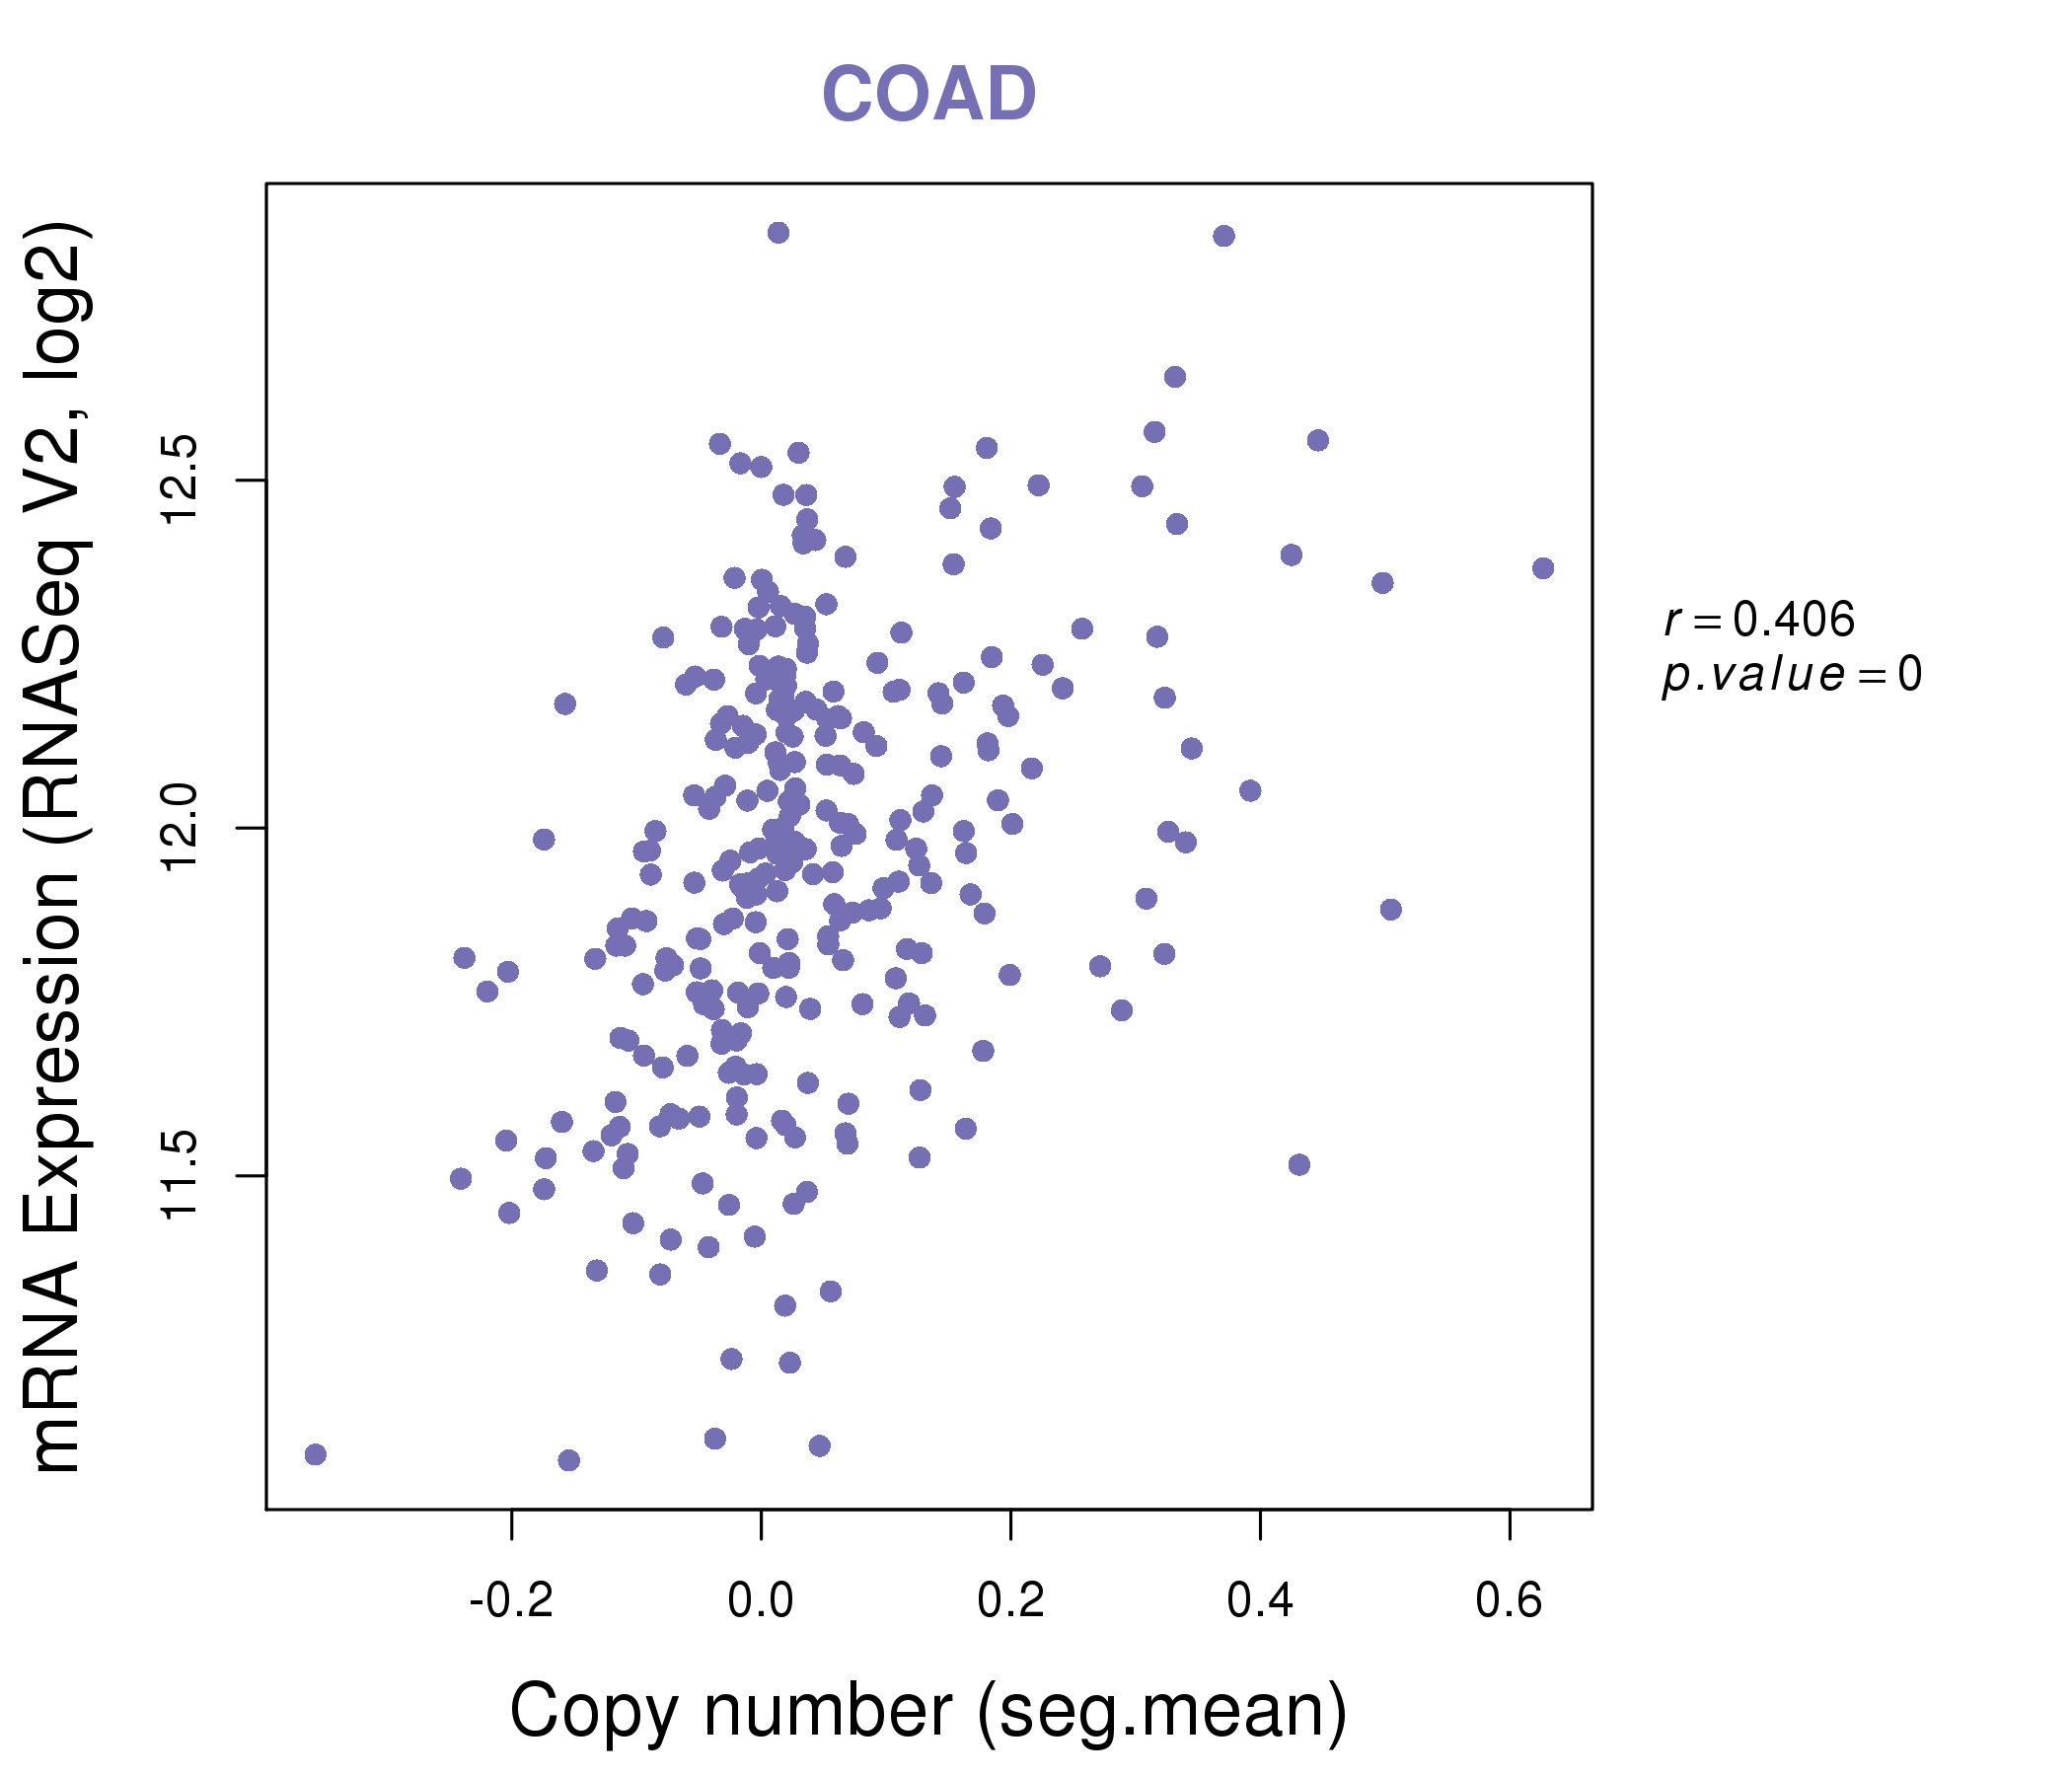
| * This plots show the correlation between CNV and gene expression. |
: Open all plots for all cancer types
 |
|
 |
|
| Top |
| Gene-Gene Network Information |
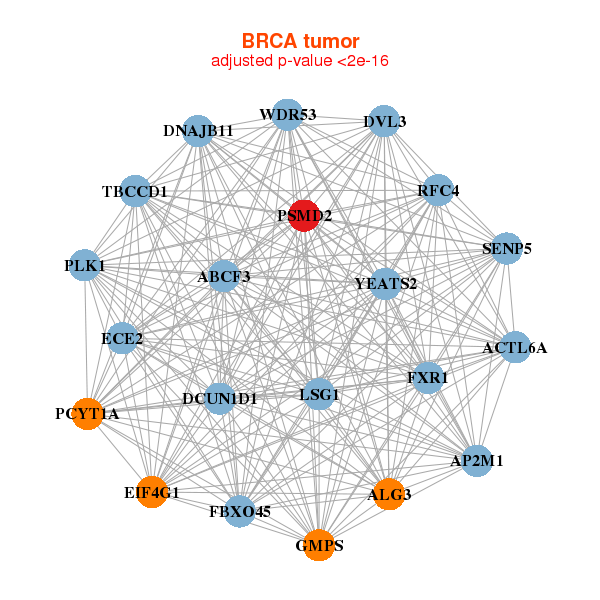
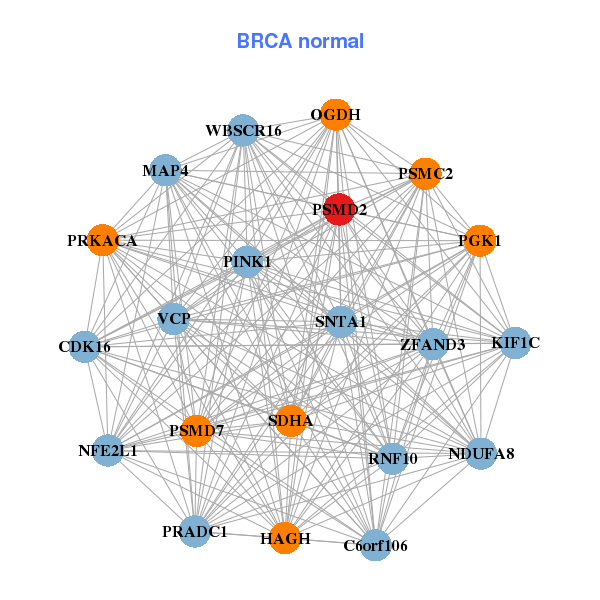
| * Co-Expression network figures were drawn using R package igraph. Only the top 20 genes with the highest correlations were shown. Red circle: input gene, orange circle: cell metabolism gene, sky circle: other gene |
: Open all plots for all cancer types
 |
| ||||
| ABCF3,ACTL6A,ALG3,AP2M1,DCUN1D1,DNAJB11,DVL3, ECE2,EIF4G1,FBXO45,FXR1,GMPS,LSG1,PCYT1A, PLK1,PSMD2,RFC4,SENP5,TBCCD1,WDR53,YEATS2 | PRADC1,C6orf106,CDK16,HAGH,KIF1C,MAP4,NDUFA8, NFE2L1,OGDH,PGK1,PINK1,PRKACA,PSMC2,PSMD2, PSMD7,RNF10,SDHA,SNTA1,VCP,WBSCR16,ZFAND3 | ||||
 |
| ||||
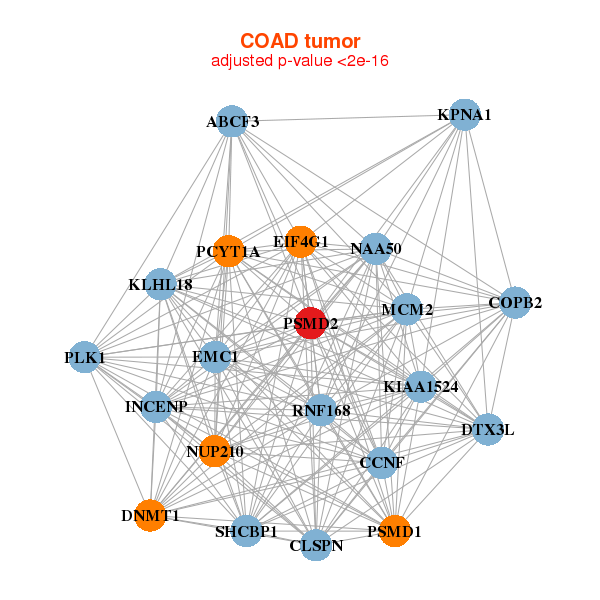
| ABCF3,CCNF,CLSPN,COPB2,DNMT1,DTX3L,EIF4G1, INCENP,EMC1,KIAA1524,KLHL18,KPNA1,MCM2,NAA50, NUP210,PCYT1A,PLK1,PSMD1,PSMD2,RNF168,SHCBP1 | ACTR3,ADRM1,CALR,CAP1,CARS,CEACAM6,ENO1, OR52I1,PCBP1,PGAM1,PLIN3,PSMB2,PSMC3,PSMC4, PSMD1,PSMD2,PSMD3,RALB,SNORA45B,TARS,TFG |
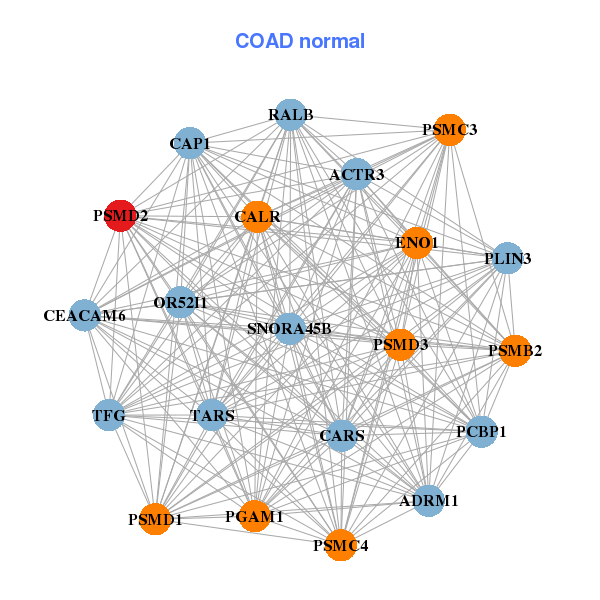
| * Co-Expression network figures were drawn using R package igraph. Only the top 20 genes with the highest correlations were shown. Red circle: input gene, orange circle: cell metabolism gene, sky circle: other gene |
: Open all plots for all cancer types
| Top |
: Open all interacting genes' information including KEGG pathway for all interacting genes from DAVID
| Top |
| Pharmacological Information for PSMD2 |
| DB Category | DB Name | DB's ID and Url link |
| * Gene Centered Interaction Network. |
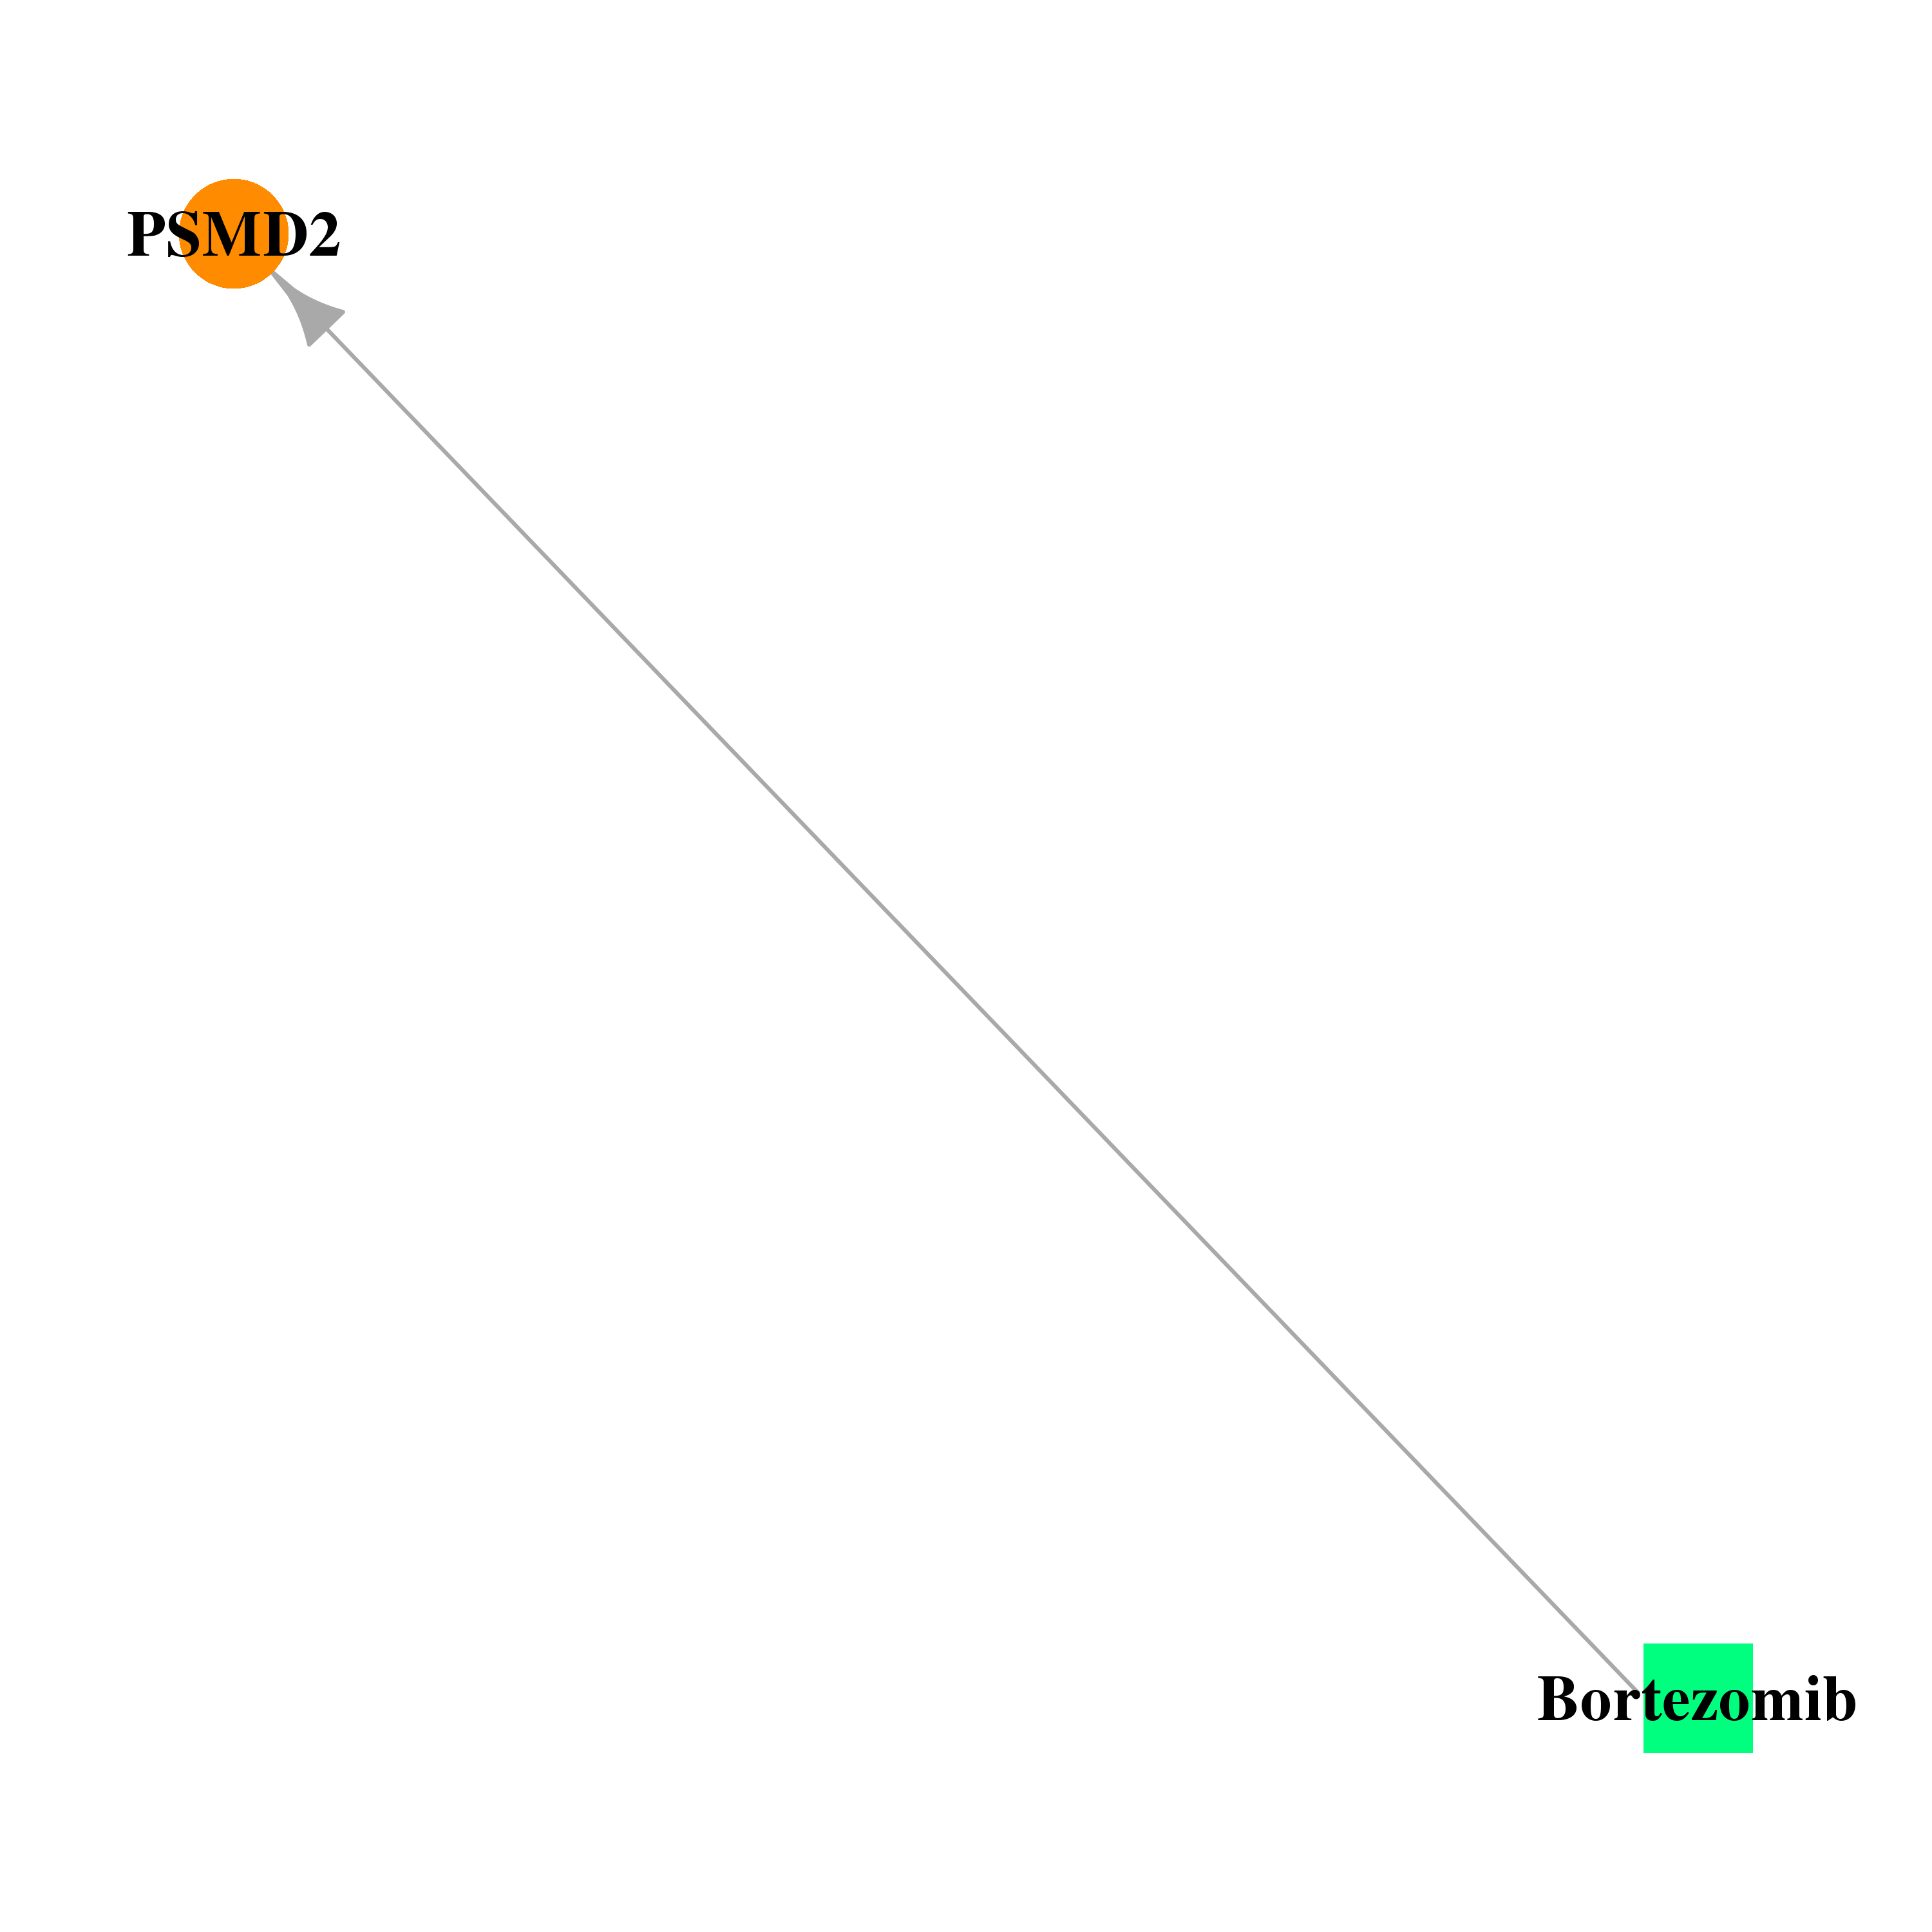 |
| * Drug Centered Interaction Network. |
| DrugBank ID | Target Name | Drug Groups | Generic Name | Drug Centered Network | Drug Structure |
| DB00188 | proteasome (prosome, macropain) 26S subunit, non-ATPase, 2 | approved; investigational | Bortezomib | 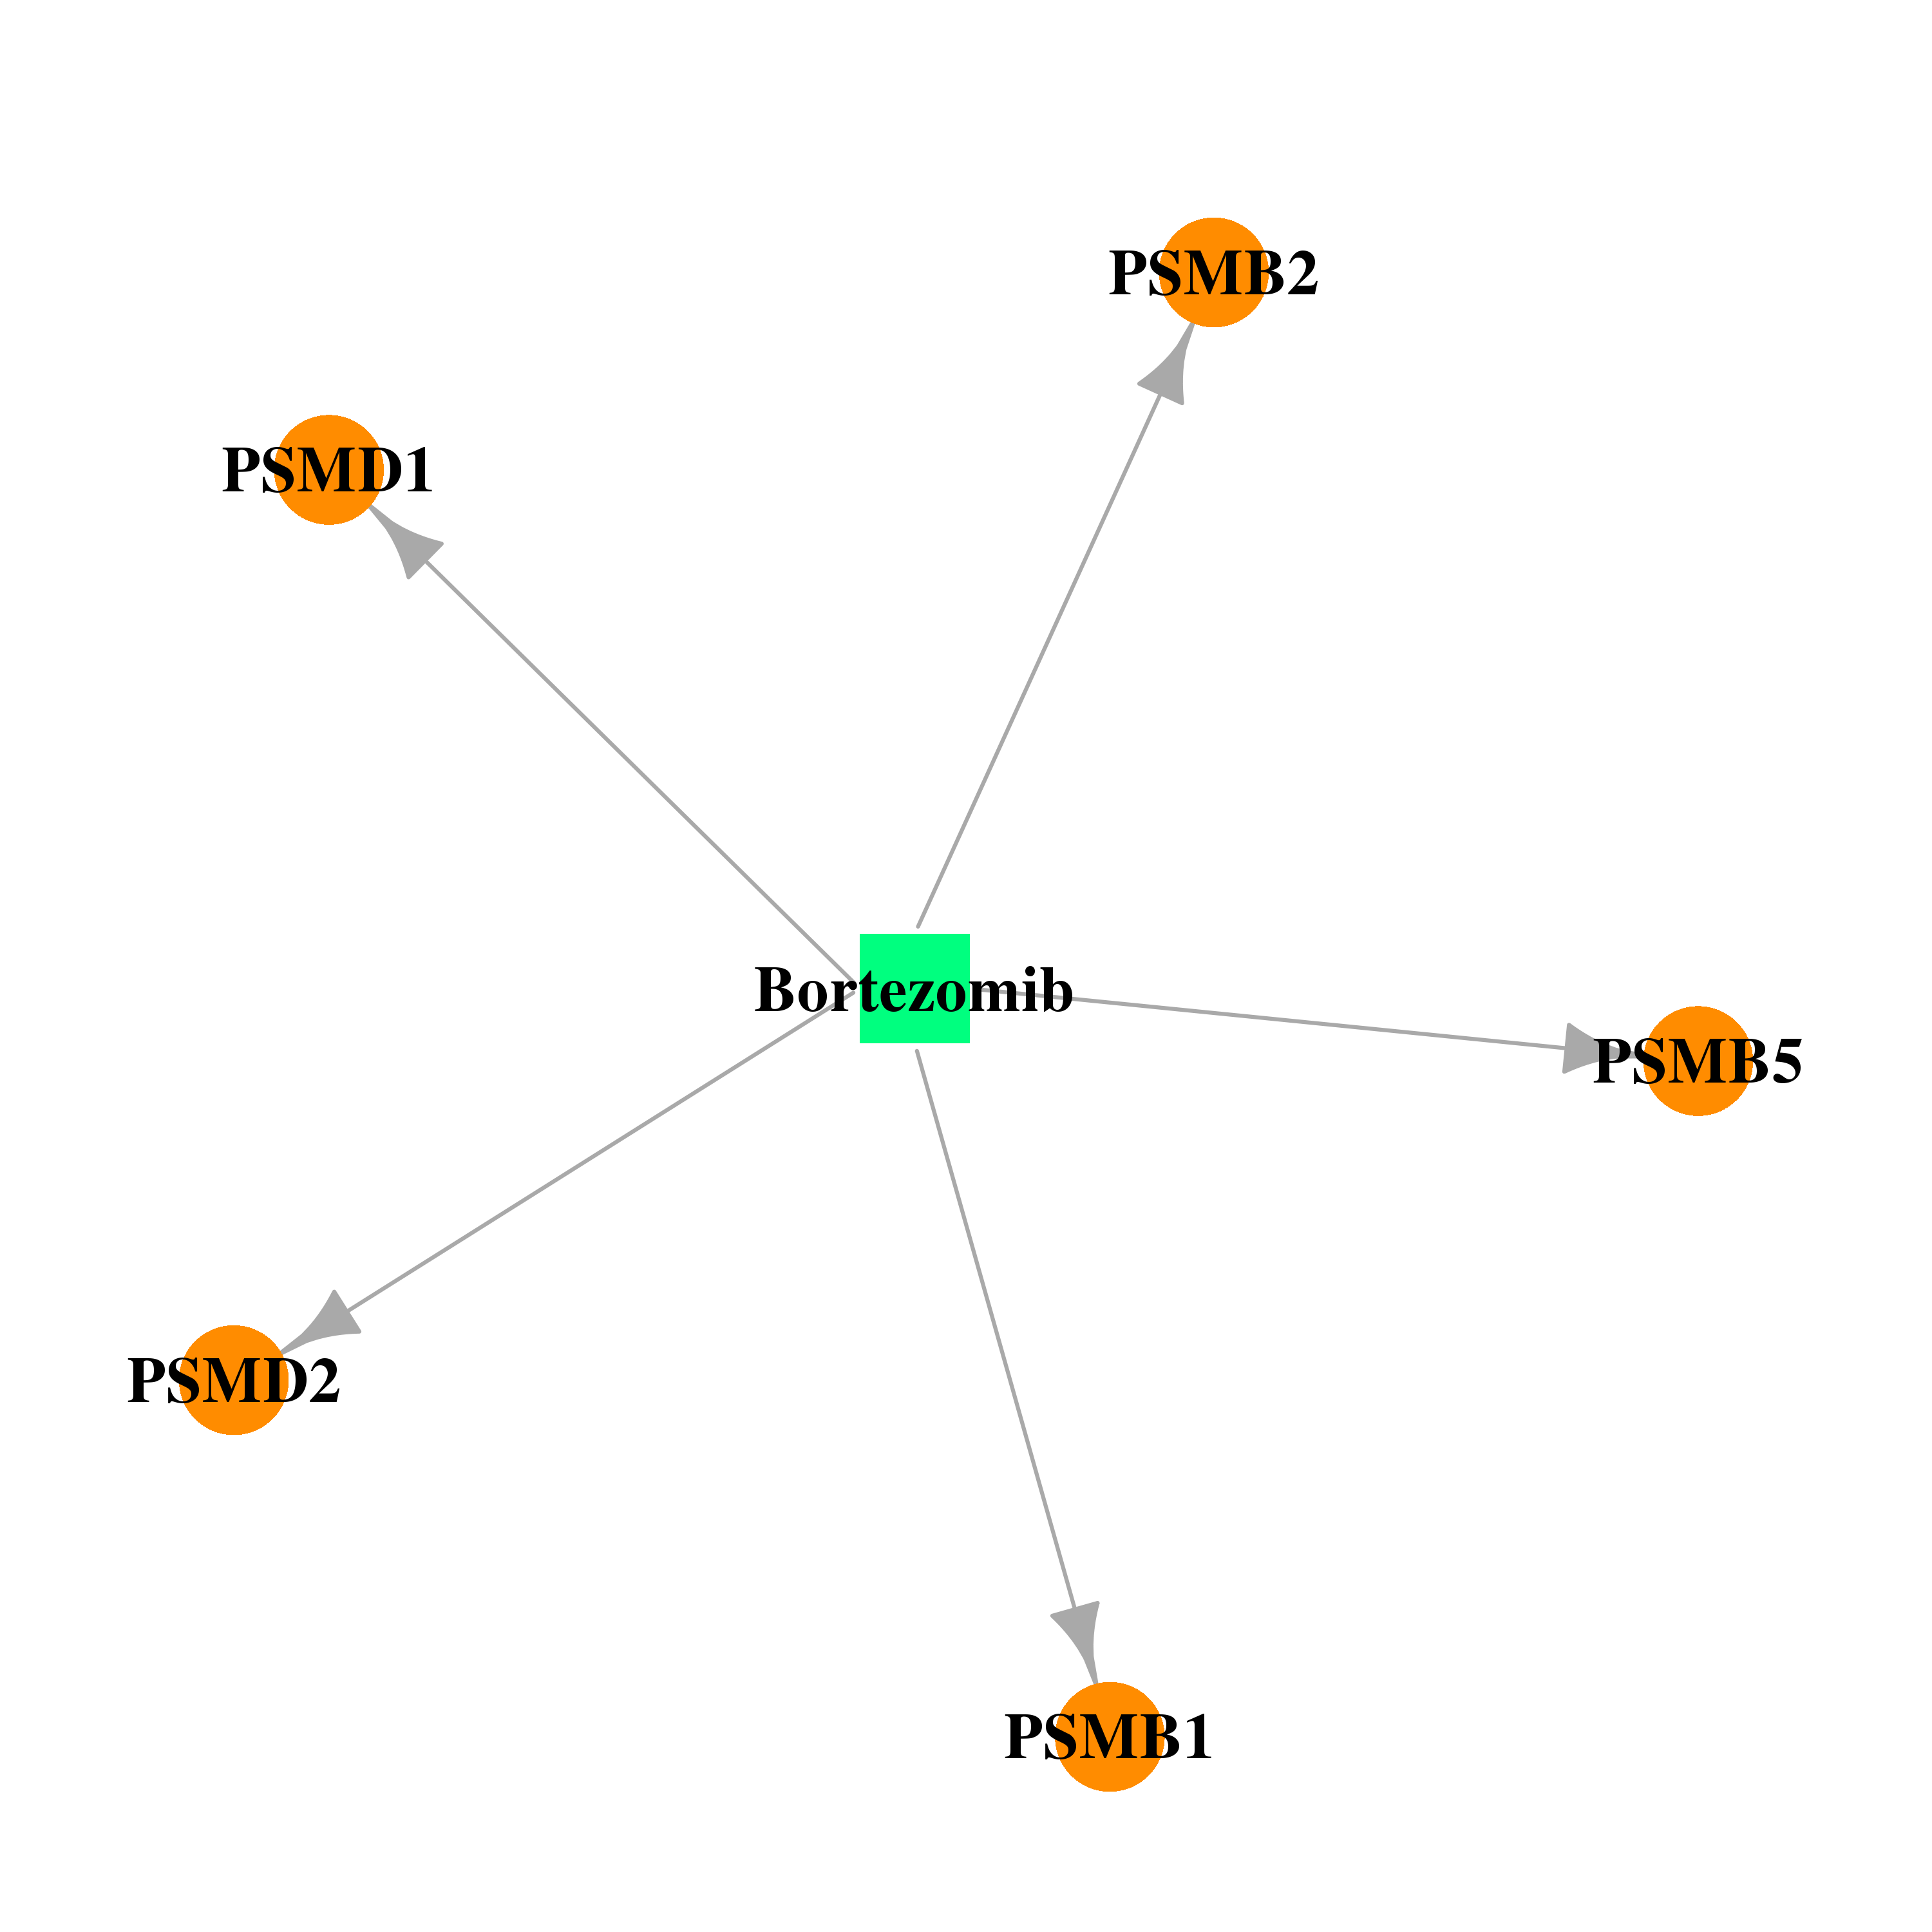 | 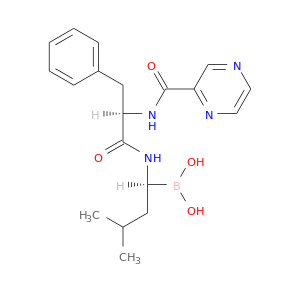 |
| Top |
| Cross referenced IDs for PSMD2 |
| * We obtained these cross-references from Uniprot database. It covers 150 different DBs, 18 categories. http://www.uniprot.org/help/cross_references_section |
: Open all cross reference information
|
Copyright © 2016-Present - The Univsersity of Texas Health Science Center at Houston @ |