|
||||||||||||||||||||
| |
| Phenotypic Information (metabolism pathway, cancer, disease, phenome) |
| |
| |
| Gene-Gene Network Information: Co-Expression Network, Interacting Genes & KEGG |
| |
|


| Gene Summary for PSMD4 |
| Basic gene info. | Gene symbol | PSMD4 |
| Gene name | proteasome (prosome, macropain) 26S subunit, non-ATPase, 4 | |
| Synonyms | AF|AF-1|ASF|MCB1|Rpn10|S5A|pUB-R5 | |
| Cytomap | UCSC genome browser: 1q21.3 | |
| Genomic location | chr1 :151227196-151239954 | |
| Type of gene | protein-coding | |
| RefGenes | NM_002810.2, NM_153822.2, | |
| Ensembl id | ENSG00000159352 | |
| Description | 26S proteasome non-ATPase regulatory subunit 426S proteasome regulatory subunit S5AS5a/antisecretory factor proteinangiocidinantisecretory factor 1multiubiquitin chain-binding protein | |
| Modification date | 20141207 | |
| dbXrefs | MIM : 601648 | |
| HGNC : HGNC | ||
| Ensembl : ENSG00000159352 | ||
| HPRD : 03386 | ||
| Vega : OTTHUMG00000012349 | ||
| Protein | UniProt: go to UniProt's Cross Reference DB Table | |
| Expression | CleanEX: HS_PSMD4 | |
| BioGPS: 5710 | ||
| Gene Expression Atlas: ENSG00000159352 | ||
| The Human Protein Atlas: ENSG00000159352 | ||
| Pathway | NCI Pathway Interaction Database: PSMD4 | |
| KEGG: PSMD4 | ||
| REACTOME: PSMD4 | ||
| ConsensusPathDB | ||
| Pathway Commons: PSMD4 | ||
| Metabolism | MetaCyc: PSMD4 | |
| HUMANCyc: PSMD4 | ||
| Regulation | Ensembl's Regulation: ENSG00000159352 | |
| miRBase: chr1 :151,227,196-151,239,954 | ||
| TargetScan: NM_002810 | ||
| cisRED: ENSG00000159352 | ||
| Context | iHOP: PSMD4 | |
| cancer metabolism search in PubMed: PSMD4 | ||
| UCL Cancer Institute: PSMD4 | ||
| Assigned class in ccmGDB | C | |
| Top |
| Phenotypic Information for PSMD4(metabolism pathway, cancer, disease, phenome) |
| Cancer | CGAP: PSMD4 |
| Familial Cancer Database: PSMD4 | |
| * This gene is included in those cancer gene databases. |
|
|
|
|
|
| . | ||||||||||||||
Oncogene 1 | Significant driver gene in | |||||||||||||||||||
| cf) number; DB name 1 Oncogene; http://nar.oxfordjournals.org/content/35/suppl_1/D721.long, 2 Tumor Suppressor gene; https://bioinfo.uth.edu/TSGene/, 3 Cancer Gene Census; http://www.nature.com/nrc/journal/v4/n3/abs/nrc1299.html, 4 CancerGenes; http://nar.oxfordjournals.org/content/35/suppl_1/D721.long, 5 Network of Cancer Gene; http://ncg.kcl.ac.uk/index.php, 1Therapeutic Vulnerabilities in Cancer; http://cbio.mskcc.org/cancergenomics/statius/ |
| REACTOME_METABOLISM_OF_AMINO_ACIDS_AND_DERIVATIVES REACTOME_METABOLISM_OF_MRNA REACTOME_METABOLISM_OF_RNA | |
| OMIM | |
| Orphanet | |
| Disease | KEGG Disease: PSMD4 |
| MedGen: PSMD4 (Human Medical Genetics with Condition) | |
| ClinVar: PSMD4 | |
| Phenotype | MGI: PSMD4 (International Mouse Phenotyping Consortium) |
| PhenomicDB: PSMD4 | |
| Mutations for PSMD4 |
| * Under tables are showing count per each tissue to give us broad intuition about tissue specific mutation patterns.You can go to the detailed page for each mutation database's web site. |
| - Statistics for Tissue and Mutation type | Top |
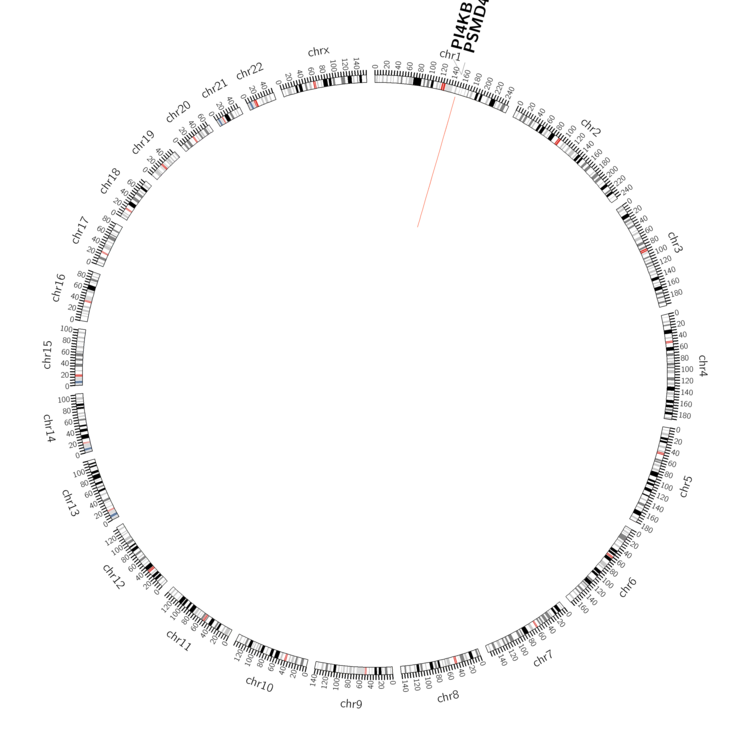 |
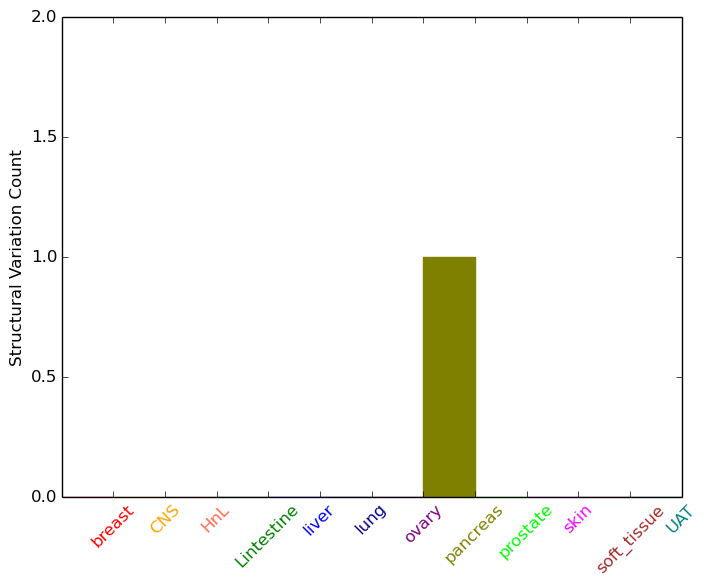
| - For Inter-chromosomal Variations |
| There's no inter-chromosomal structural variation. |
| - For Intra-chromosomal Variations |
| * Intra-chromosomal variantions includes 'intrachromosomal amplicon to amplicon', 'intrachromosomal amplicon to non-amplified dna', 'intrachromosomal deletion', 'intrachromosomal fold-back inversion', 'intrachromosomal inversion', 'intrachromosomal tandem duplication', 'Intrachromosomal unknown type', 'intrachromosomal with inverted orientation', 'intrachromosomal with non-inverted orientation'. |
 |
| Sample | Symbol_a | Chr_a | Start_a | End_a | Symbol_b | Chr_b | Start_b | End_b |
| pancreas | PSMD4 | chr1 | 151236464 | 151236484 | PI4KB | chr1 | 151295275 | 151295295 |
| cf) Tissue number; Tissue name (1;Breast, 2;Central_nervous_system, 3;Haematopoietic_and_lymphoid_tissue, 4;Large_intestine, 5;Liver, 6;Lung, 7;Ovary, 8;Pancreas, 9;Prostate, 10;Skin, 11;Soft_tissue, 12;Upper_aerodigestive_tract) |
| * From mRNA Sanger sequences, Chitars2.0 arranged chimeric transcripts. This table shows PSMD4 related fusion information. |
| ID | Head Gene | Tail Gene | Accession | Gene_a | qStart_a | qEnd_a | Chromosome_a | tStart_a | tEnd_a | Gene_a | qStart_a | qEnd_a | Chromosome_a | tStart_a | tEnd_a |
| BU590293 | RPS9 | 1 | 325 | 19 | 54705447 | 54711372 | PSMD4 | 312 | 506 | 1 | 151239761 | 151239955 | |
| BU538390 | C20orf27 | 1 | 335 | 20 | 3734588 | 3735159 | PSMD4 | 335 | 670 | 1 | 151237348 | 151238086 | |
| U51007 | IQGAP1 | 7 | 128 | 15 | 91045344 | 91045467 | PSMD4 | 119 | 1323 | 1 | 151227233 | 151239865 | |
| Top |
| There's no copy number variation information in COSMIC data for this gene. |
| Top |
|
 |
| Top |
| Stat. for Non-Synonymous SNVs (# total SNVs=24) | (# total SNVs=4) |
 |  |
(# total SNVs=1) | (# total SNVs=0) |
 |
| Top |
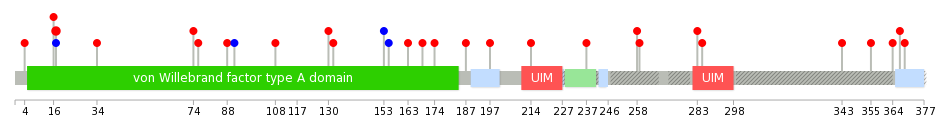
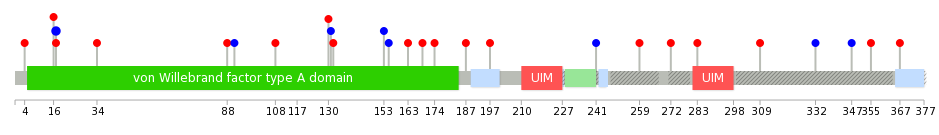
| * When you move the cursor on each content, you can see more deailed mutation information on the Tooltip. Those are primary_site,primary_histology,mutation(aa),pubmedID. |
| GRCh37 position | Mutation(aa) | Unique sampleID count |
| chr1:151234659-151234659 | p.R17W | 2 |
| chr1:151238020-151238020 | p.L197M | 1 |
| chr1:151239713-151239713 | p.P343L | 1 |
| chr1:151236495-151236495 | p.R91R | 1 |
| chr1:151238072-151238072 | p.P214H | 1 |
| chr1:151239749-151239749 | p.A355D | 1 |
| chr1:151237347-151237347 | p.R108C | 1 |
| chr1:151238503-151238508 | p.R230_Q231delRQ | 1 |
| chr1:151239776-151239776 | p.T364I | 1 |
| chr1:151237660-151237660 | p.R130C | 1 |
| Top |
|
 |
| Point Mutation/ Tissue ID | 1 | 2 | 3 | 4 | 5 | 6 | 7 | 8 | 9 | 10 | 11 | 12 | 13 | 14 | 15 | 16 | 17 | 18 | 19 | 20 |
| # sample | 1 | 2 | 3 | 1 | 3 | 2 | 5 | 1 | 2 | 2 | 3 | |||||||||
| # mutation | 1 | 2 | 4 | 1 | 3 | 2 | 5 | 1 | 2 | 2 | 4 | |||||||||
| nonsynonymous SNV | 1 | 2 | 2 | 1 | 1 | 2 | 1 | 1 | 2 | 1 | 4 | |||||||||
| synonymous SNV | 2 | 2 | 4 | 1 |
| cf) Tissue ID; Tissue type (1; BLCA[Bladder Urothelial Carcinoma], 2; BRCA[Breast invasive carcinoma], 3; CESC[Cervical squamous cell carcinoma and endocervical adenocarcinoma], 4; COAD[Colon adenocarcinoma], 5; GBM[Glioblastoma multiforme], 6; Glioma Low Grade, 7; HNSC[Head and Neck squamous cell carcinoma], 8; KICH[Kidney Chromophobe], 9; KIRC[Kidney renal clear cell carcinoma], 10; KIRP[Kidney renal papillary cell carcinoma], 11; LAML[Acute Myeloid Leukemia], 12; LUAD[Lung adenocarcinoma], 13; LUSC[Lung squamous cell carcinoma], 14; OV[Ovarian serous cystadenocarcinoma ], 15; PAAD[Pancreatic adenocarcinoma], 16; PRAD[Prostate adenocarcinoma], 17; SKCM[Skin Cutaneous Melanoma], 18:STAD[Stomach adenocarcinoma], 19:THCA[Thyroid carcinoma], 20:UCEC[Uterine Corpus Endometrial Carcinoma]) |
| Top |
| * We represented just top 10 SNVs. When you move the cursor on each content, you can see more deailed mutation information on the Tooltip. Those are primary_site, primary_histology, mutation(aa), pubmedID. |
| Genomic Position | Mutation(aa) | Unique sampleID count |
| chr1:151234661 | p.R17R | 2 |
| chr1:151238548 | p.A155A | 1 |
| chr1:151237660 | p.K163E | 1 |
| chr1:151238796 | p.H169Y | 1 |
| chr1:151237665 | p.P174S | 1 |
| chr1:151238835 | p.E4Q | 1 |
| chr1:151237667 | p.P187L | 1 |
| chr1:151238867 | p.M16I | 1 |
| chr1:151227268 | p.L197M | 1 |
| chr1:151237890 | p.R17W | 1 |
| * Copy number data were extracted from TCGA using R package TCGA-Assembler. The URLs of all public data files on TCGA DCC data server were gathered on Jan-05-2015. Function ProcessCNAData in TCGA-Assembler package was used to obtain gene-level copy number value which is calculated as the average copy number of the genomic region of a gene. |
 |
| cf) Tissue ID[Tissue type]: BLCA[Bladder Urothelial Carcinoma], BRCA[Breast invasive carcinoma], CESC[Cervical squamous cell carcinoma and endocervical adenocarcinoma], COAD[Colon adenocarcinoma], GBM[Glioblastoma multiforme], Glioma Low Grade, HNSC[Head and Neck squamous cell carcinoma], KICH[Kidney Chromophobe], KIRC[Kidney renal clear cell carcinoma], KIRP[Kidney renal papillary cell carcinoma], LAML[Acute Myeloid Leukemia], LUAD[Lung adenocarcinoma], LUSC[Lung squamous cell carcinoma], OV[Ovarian serous cystadenocarcinoma ], PAAD[Pancreatic adenocarcinoma], PRAD[Prostate adenocarcinoma], SKCM[Skin Cutaneous Melanoma], STAD[Stomach adenocarcinoma], THCA[Thyroid carcinoma], UCEC[Uterine Corpus Endometrial Carcinoma] |
| Top |
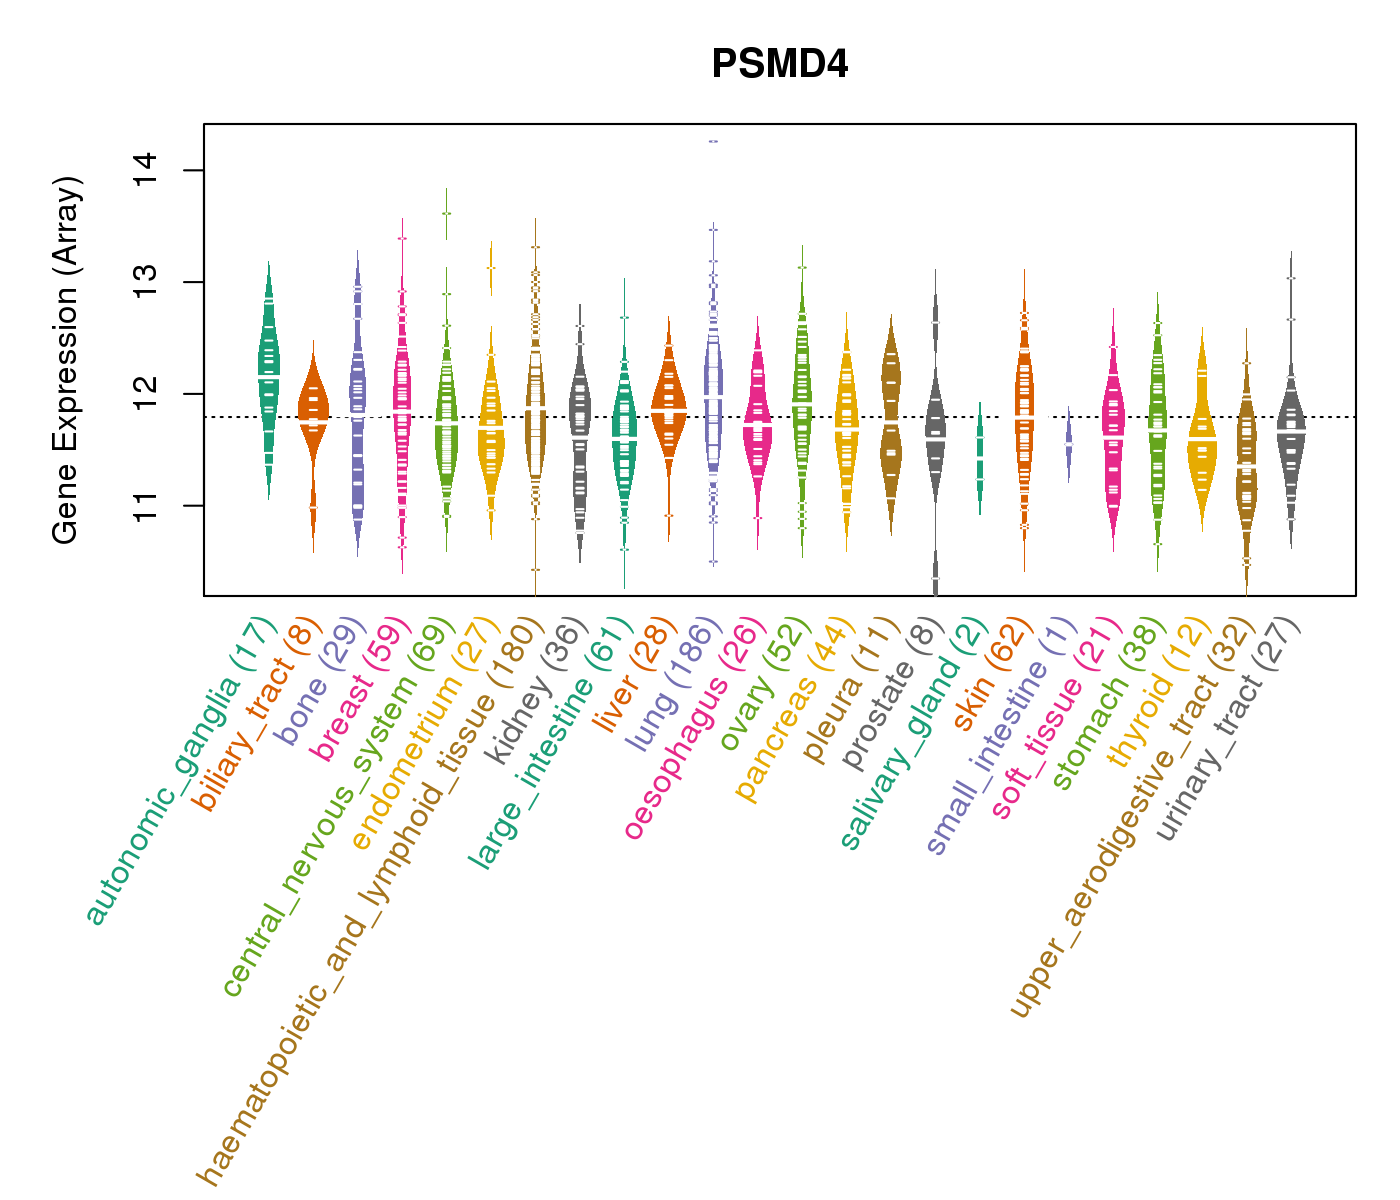
| Gene Expression for PSMD4 |
| * CCLE gene expression data were extracted from CCLE_Expression_Entrez_2012-10-18.res: Gene-centric RMA-normalized mRNA expression data. |
 |
| * Normalized gene expression data of RNASeqV2 was extracted from TCGA using R package TCGA-Assembler. The URLs of all public data files on TCGA DCC data server were gathered at Jan-05-2015. Only eight cancer types have enough normal control samples for differential expression analysis. (t test, adjusted p<0.05 (using Benjamini-Hochberg FDR)) |
 |
| Top |
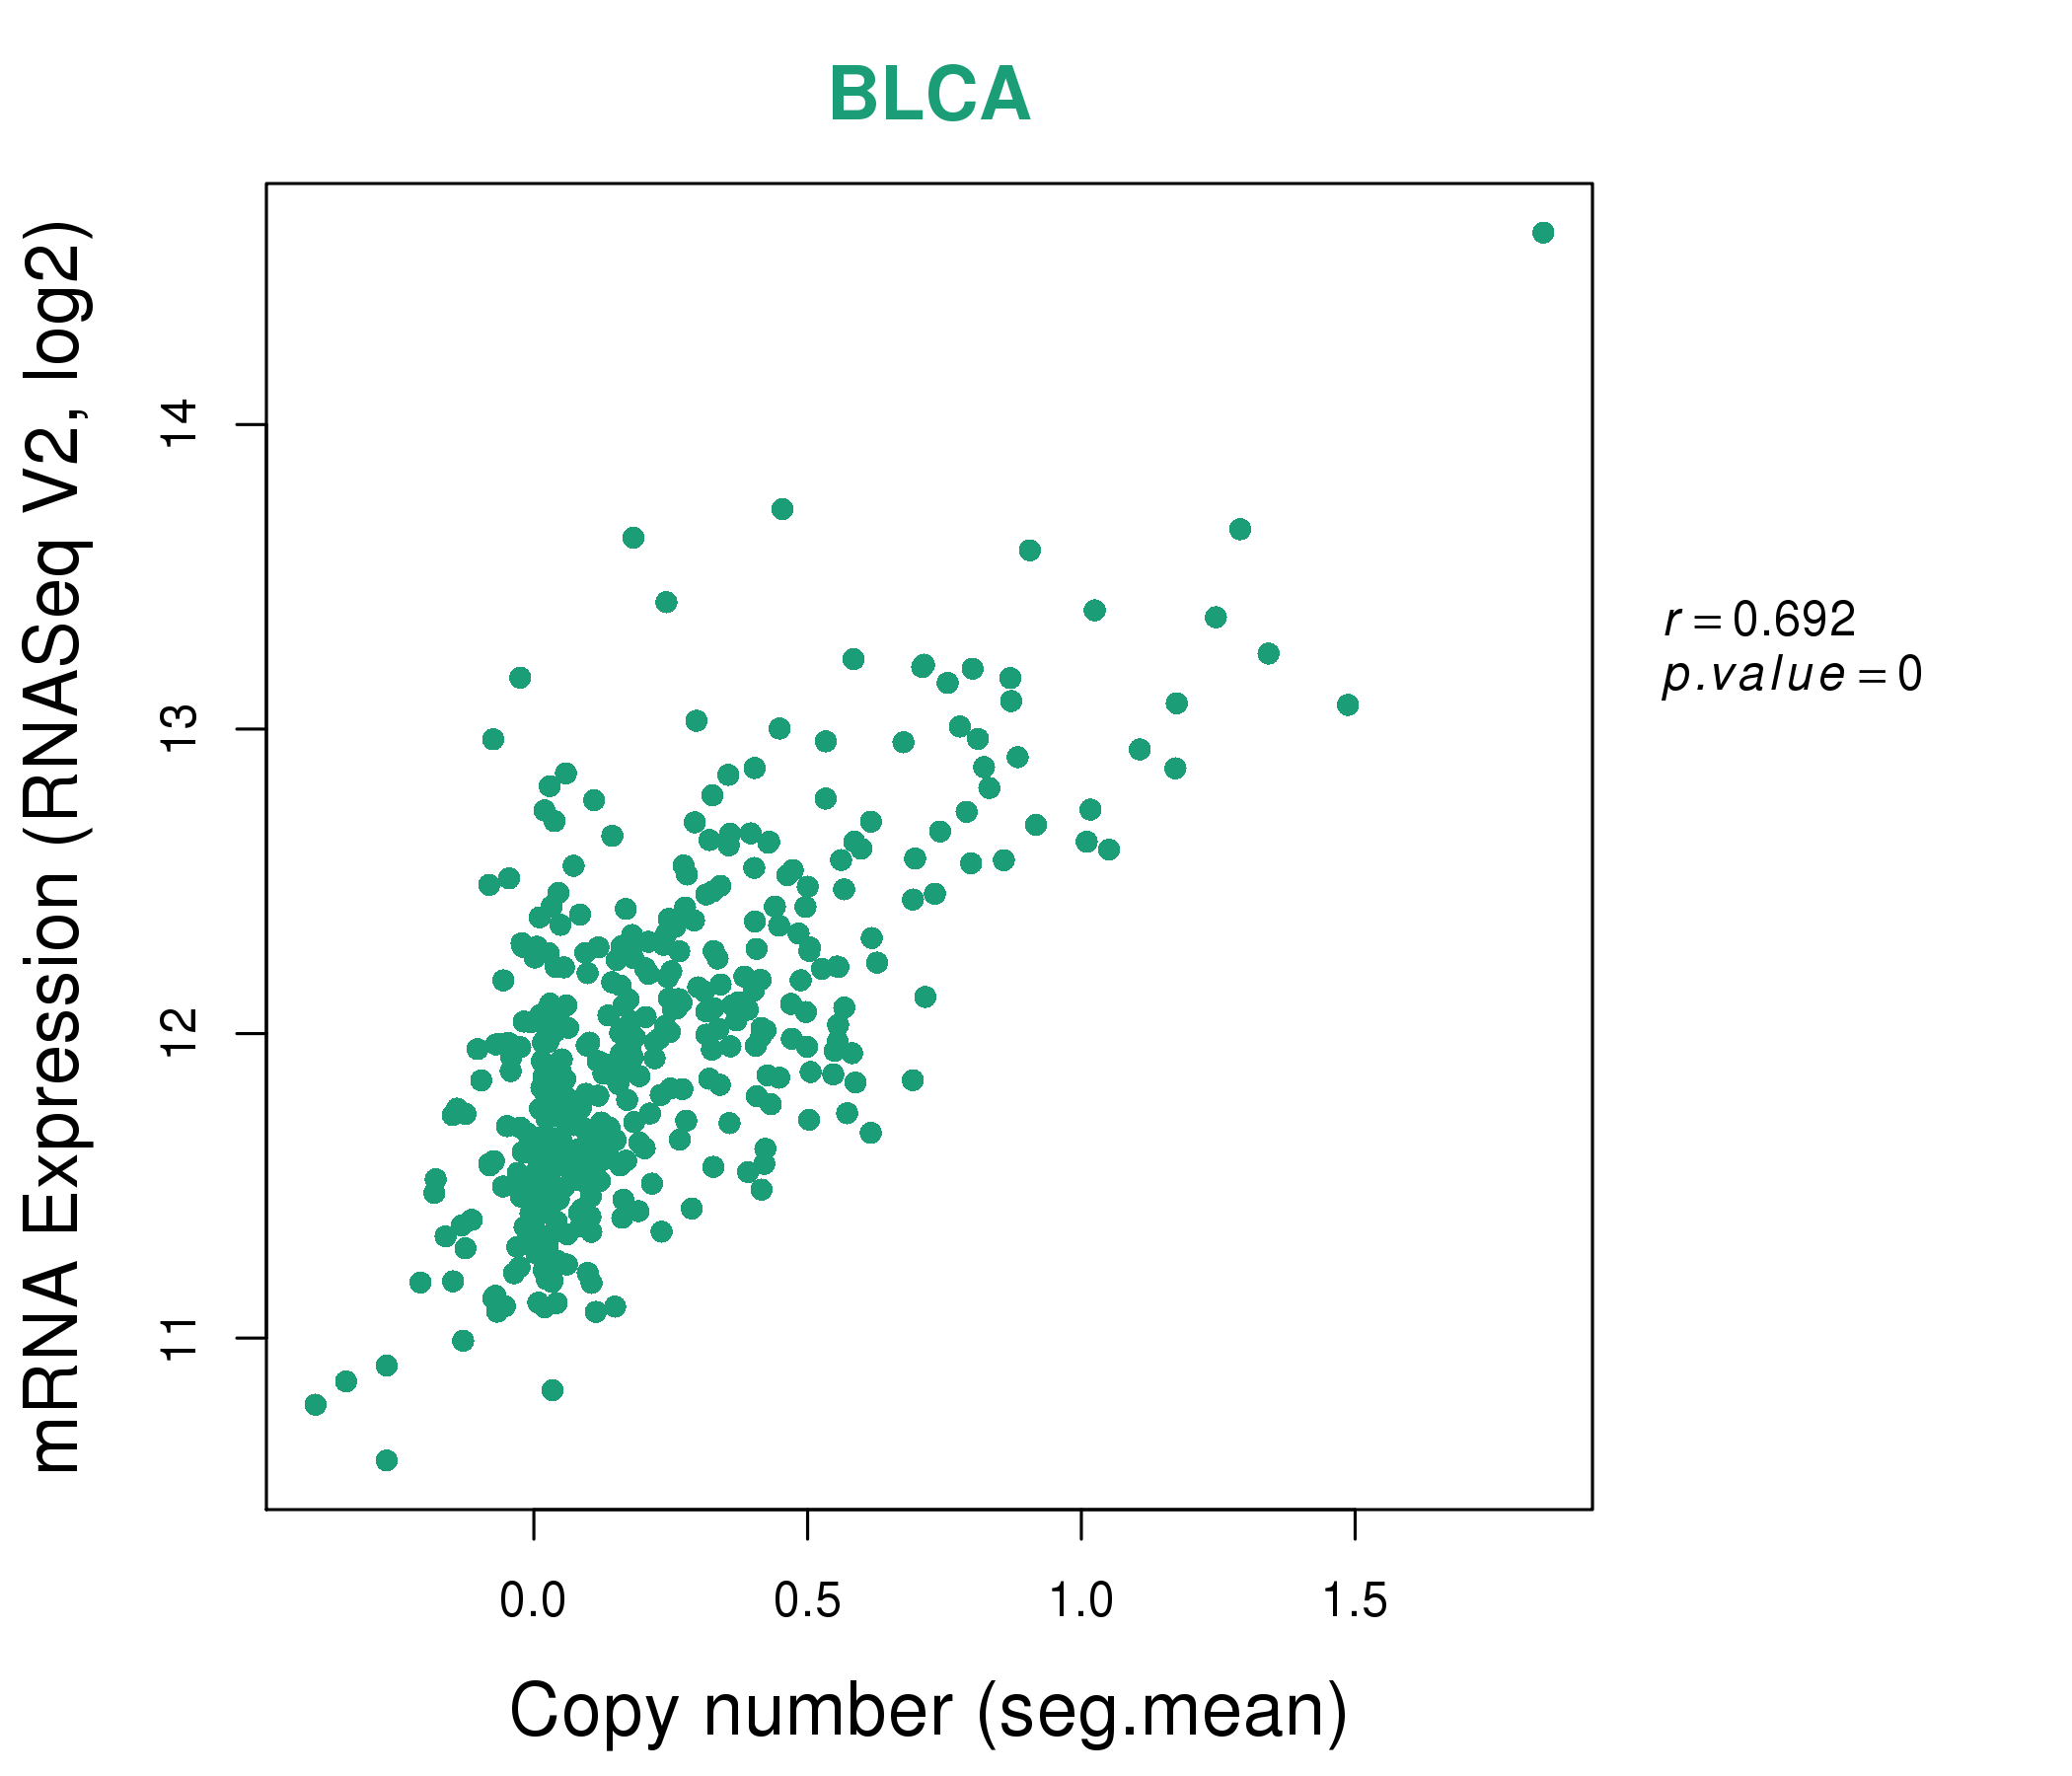
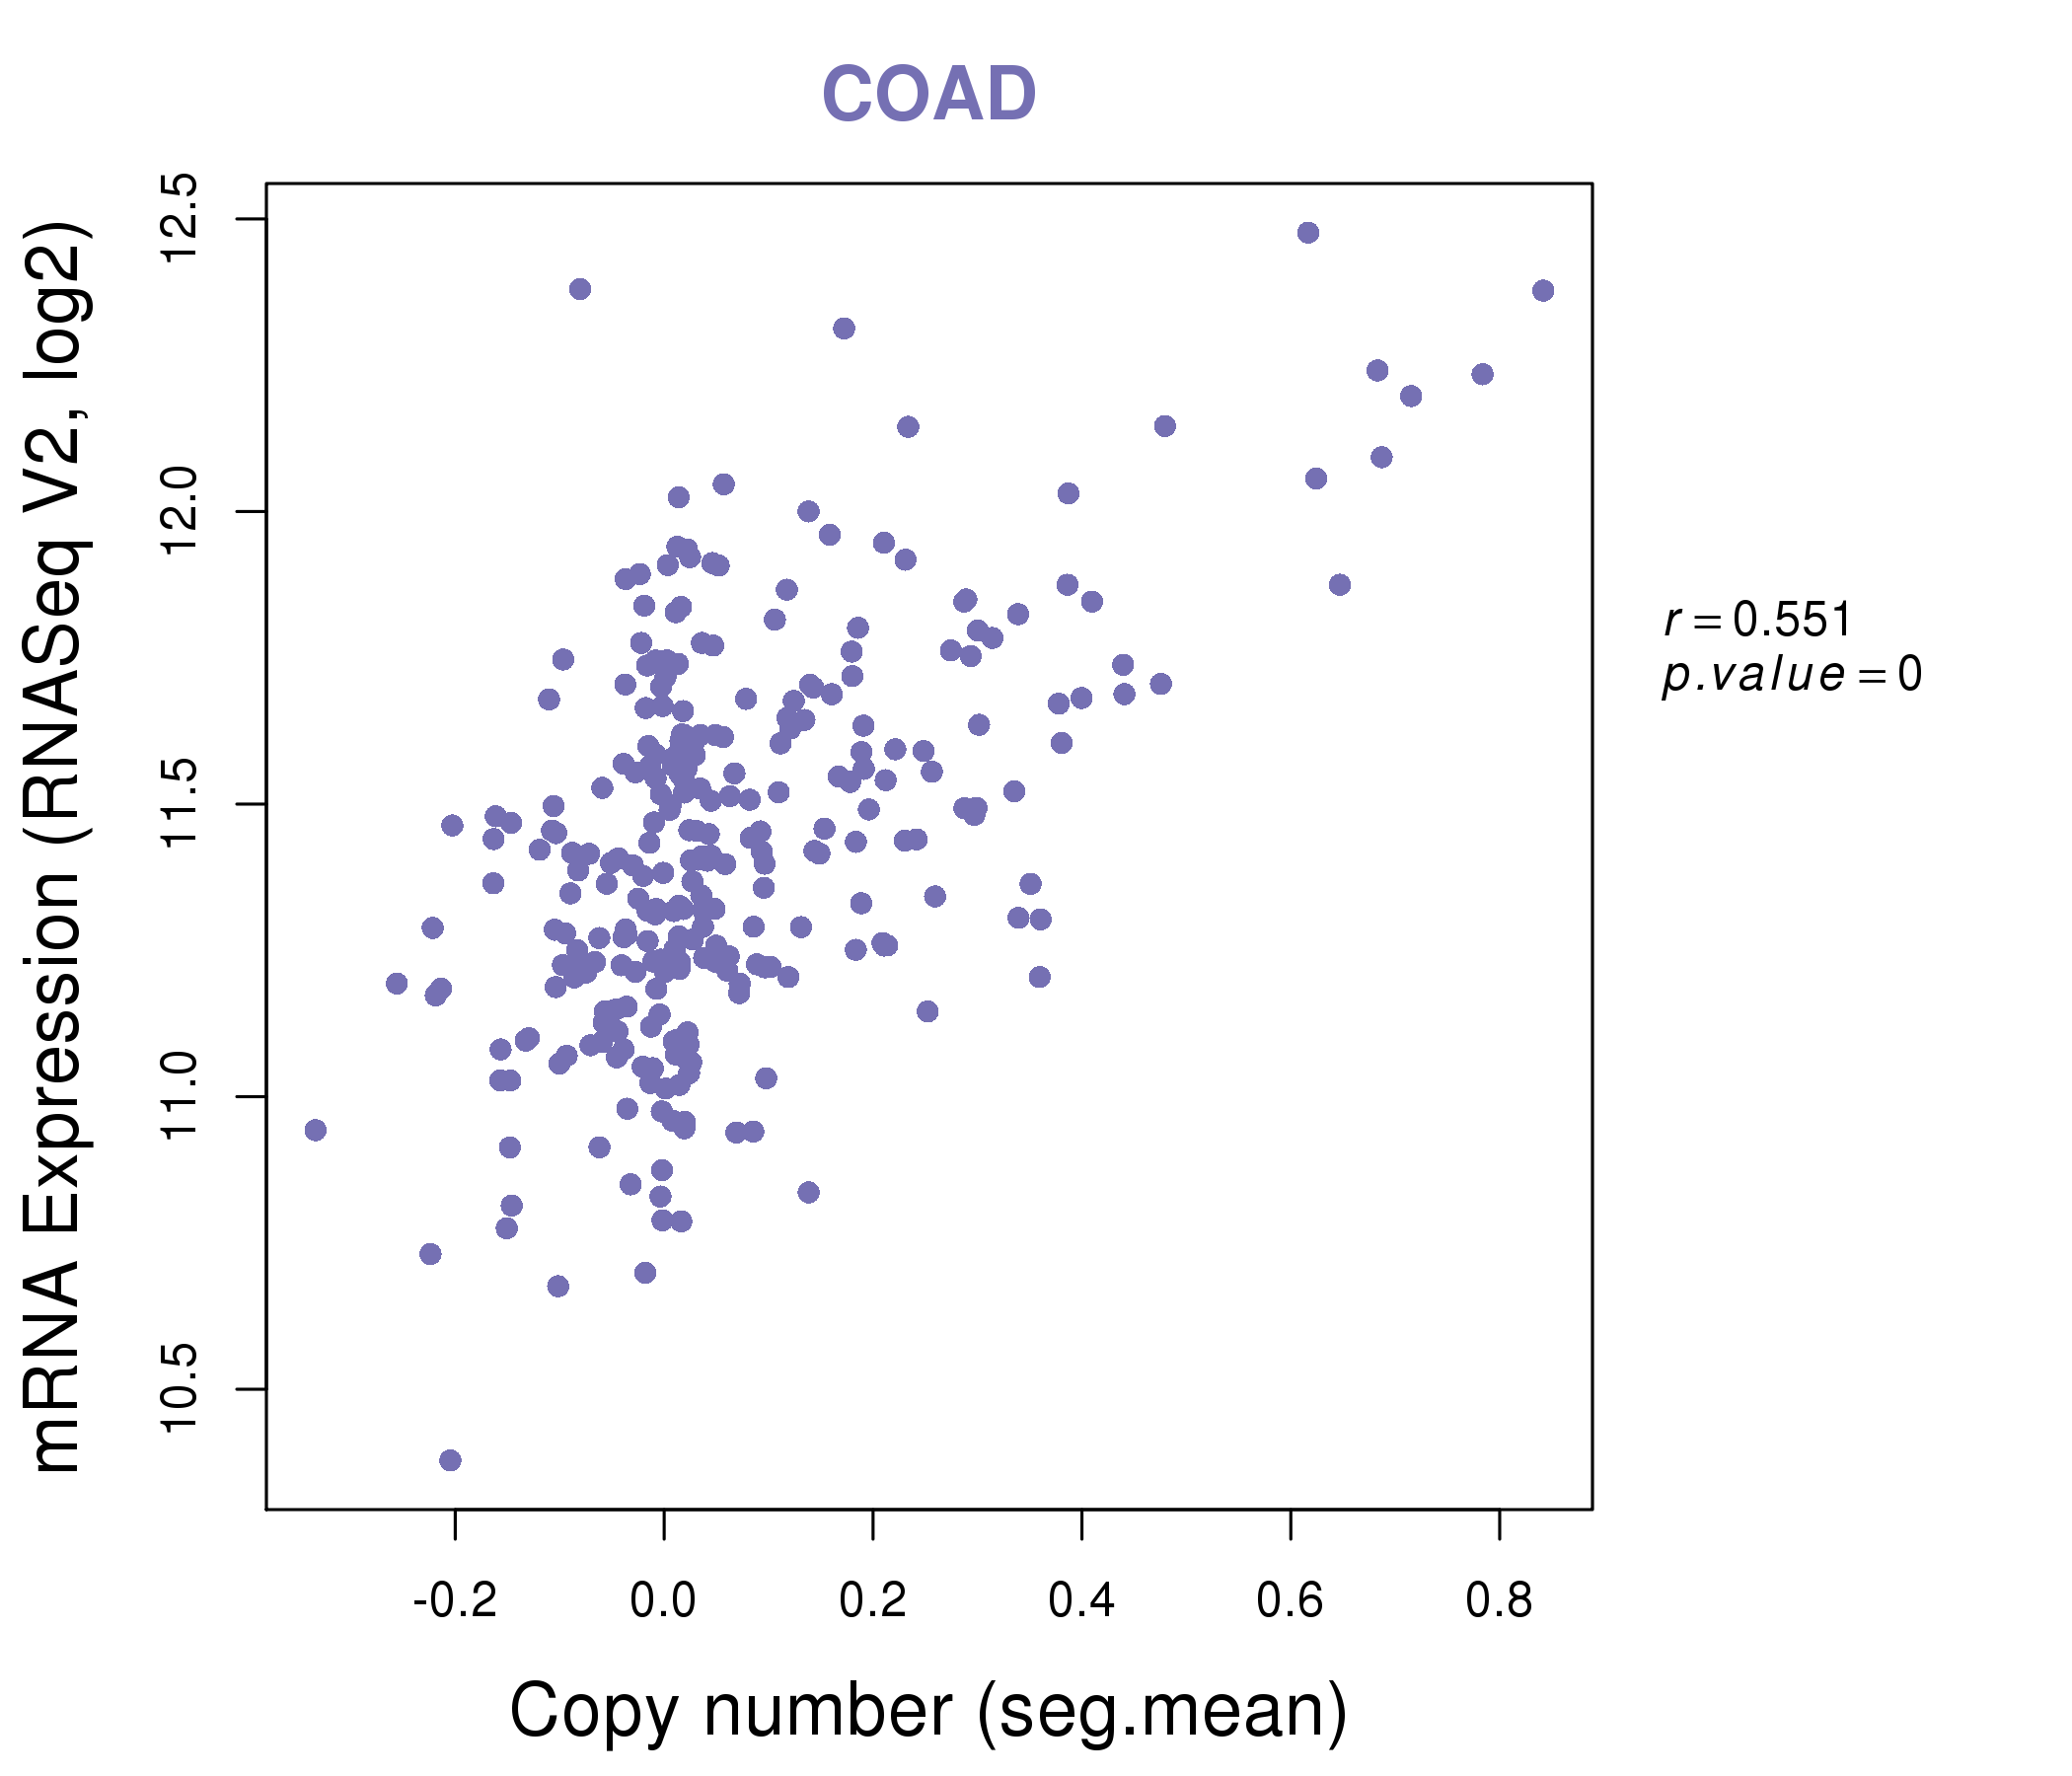
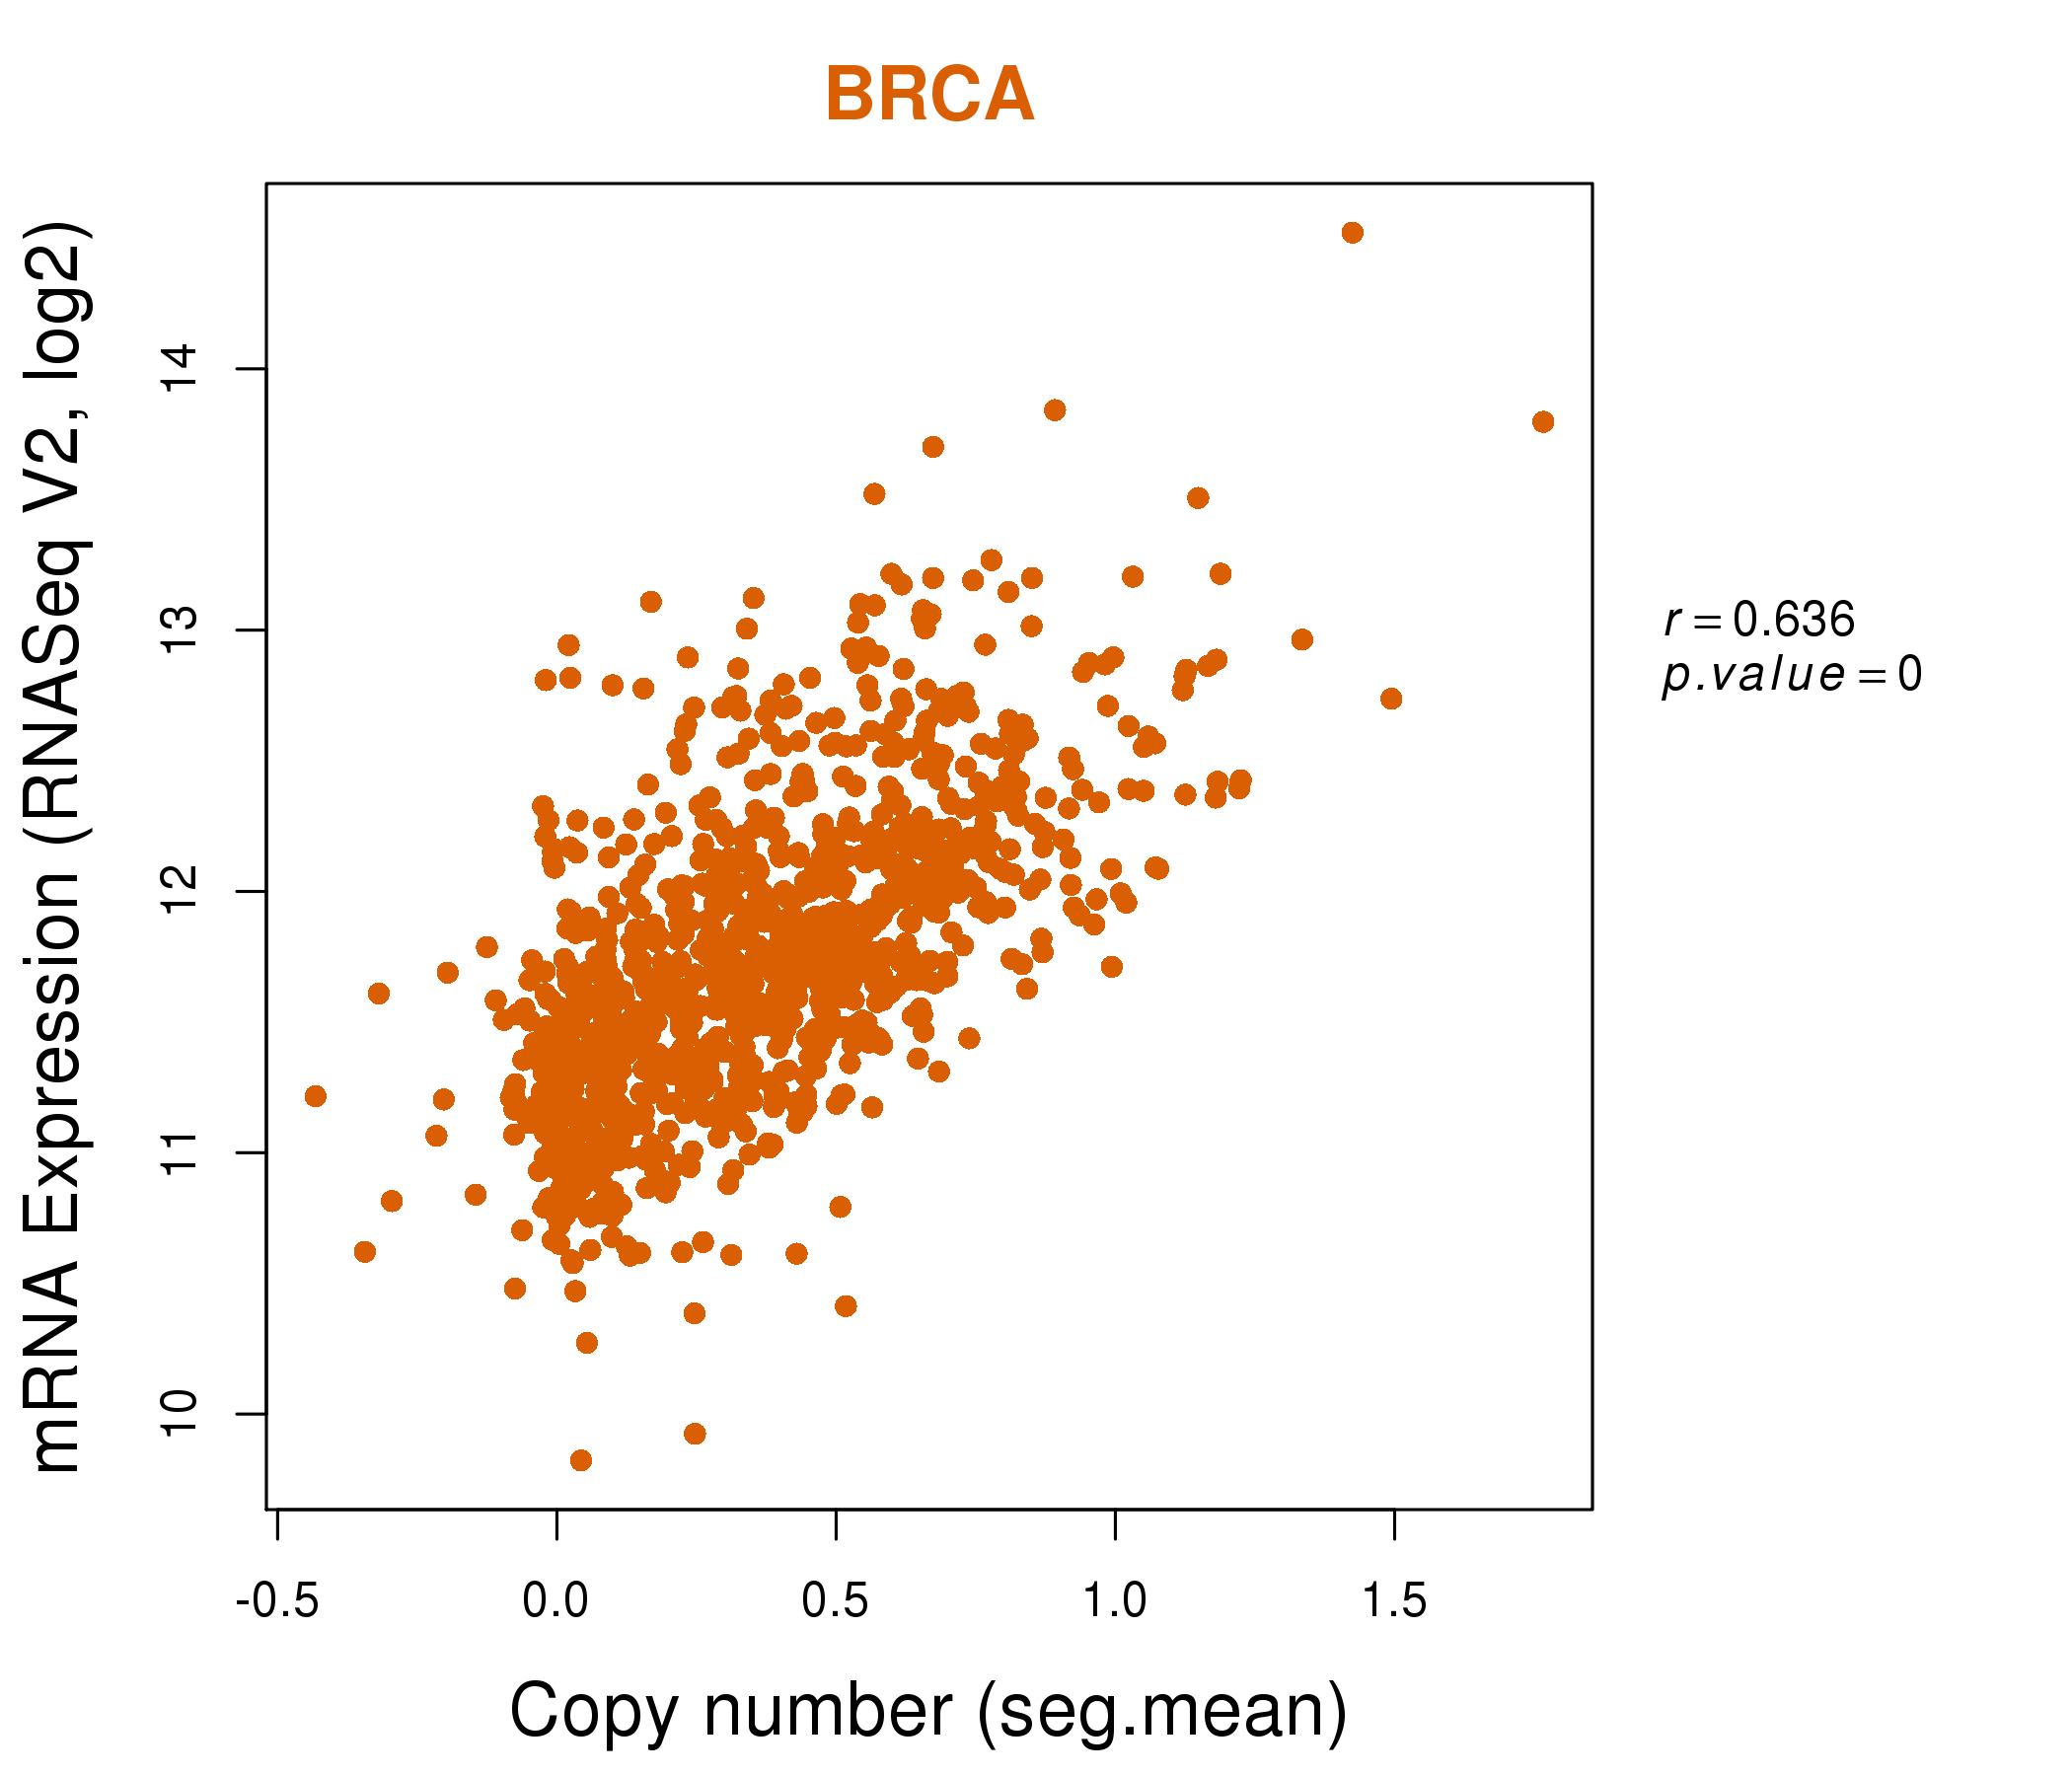
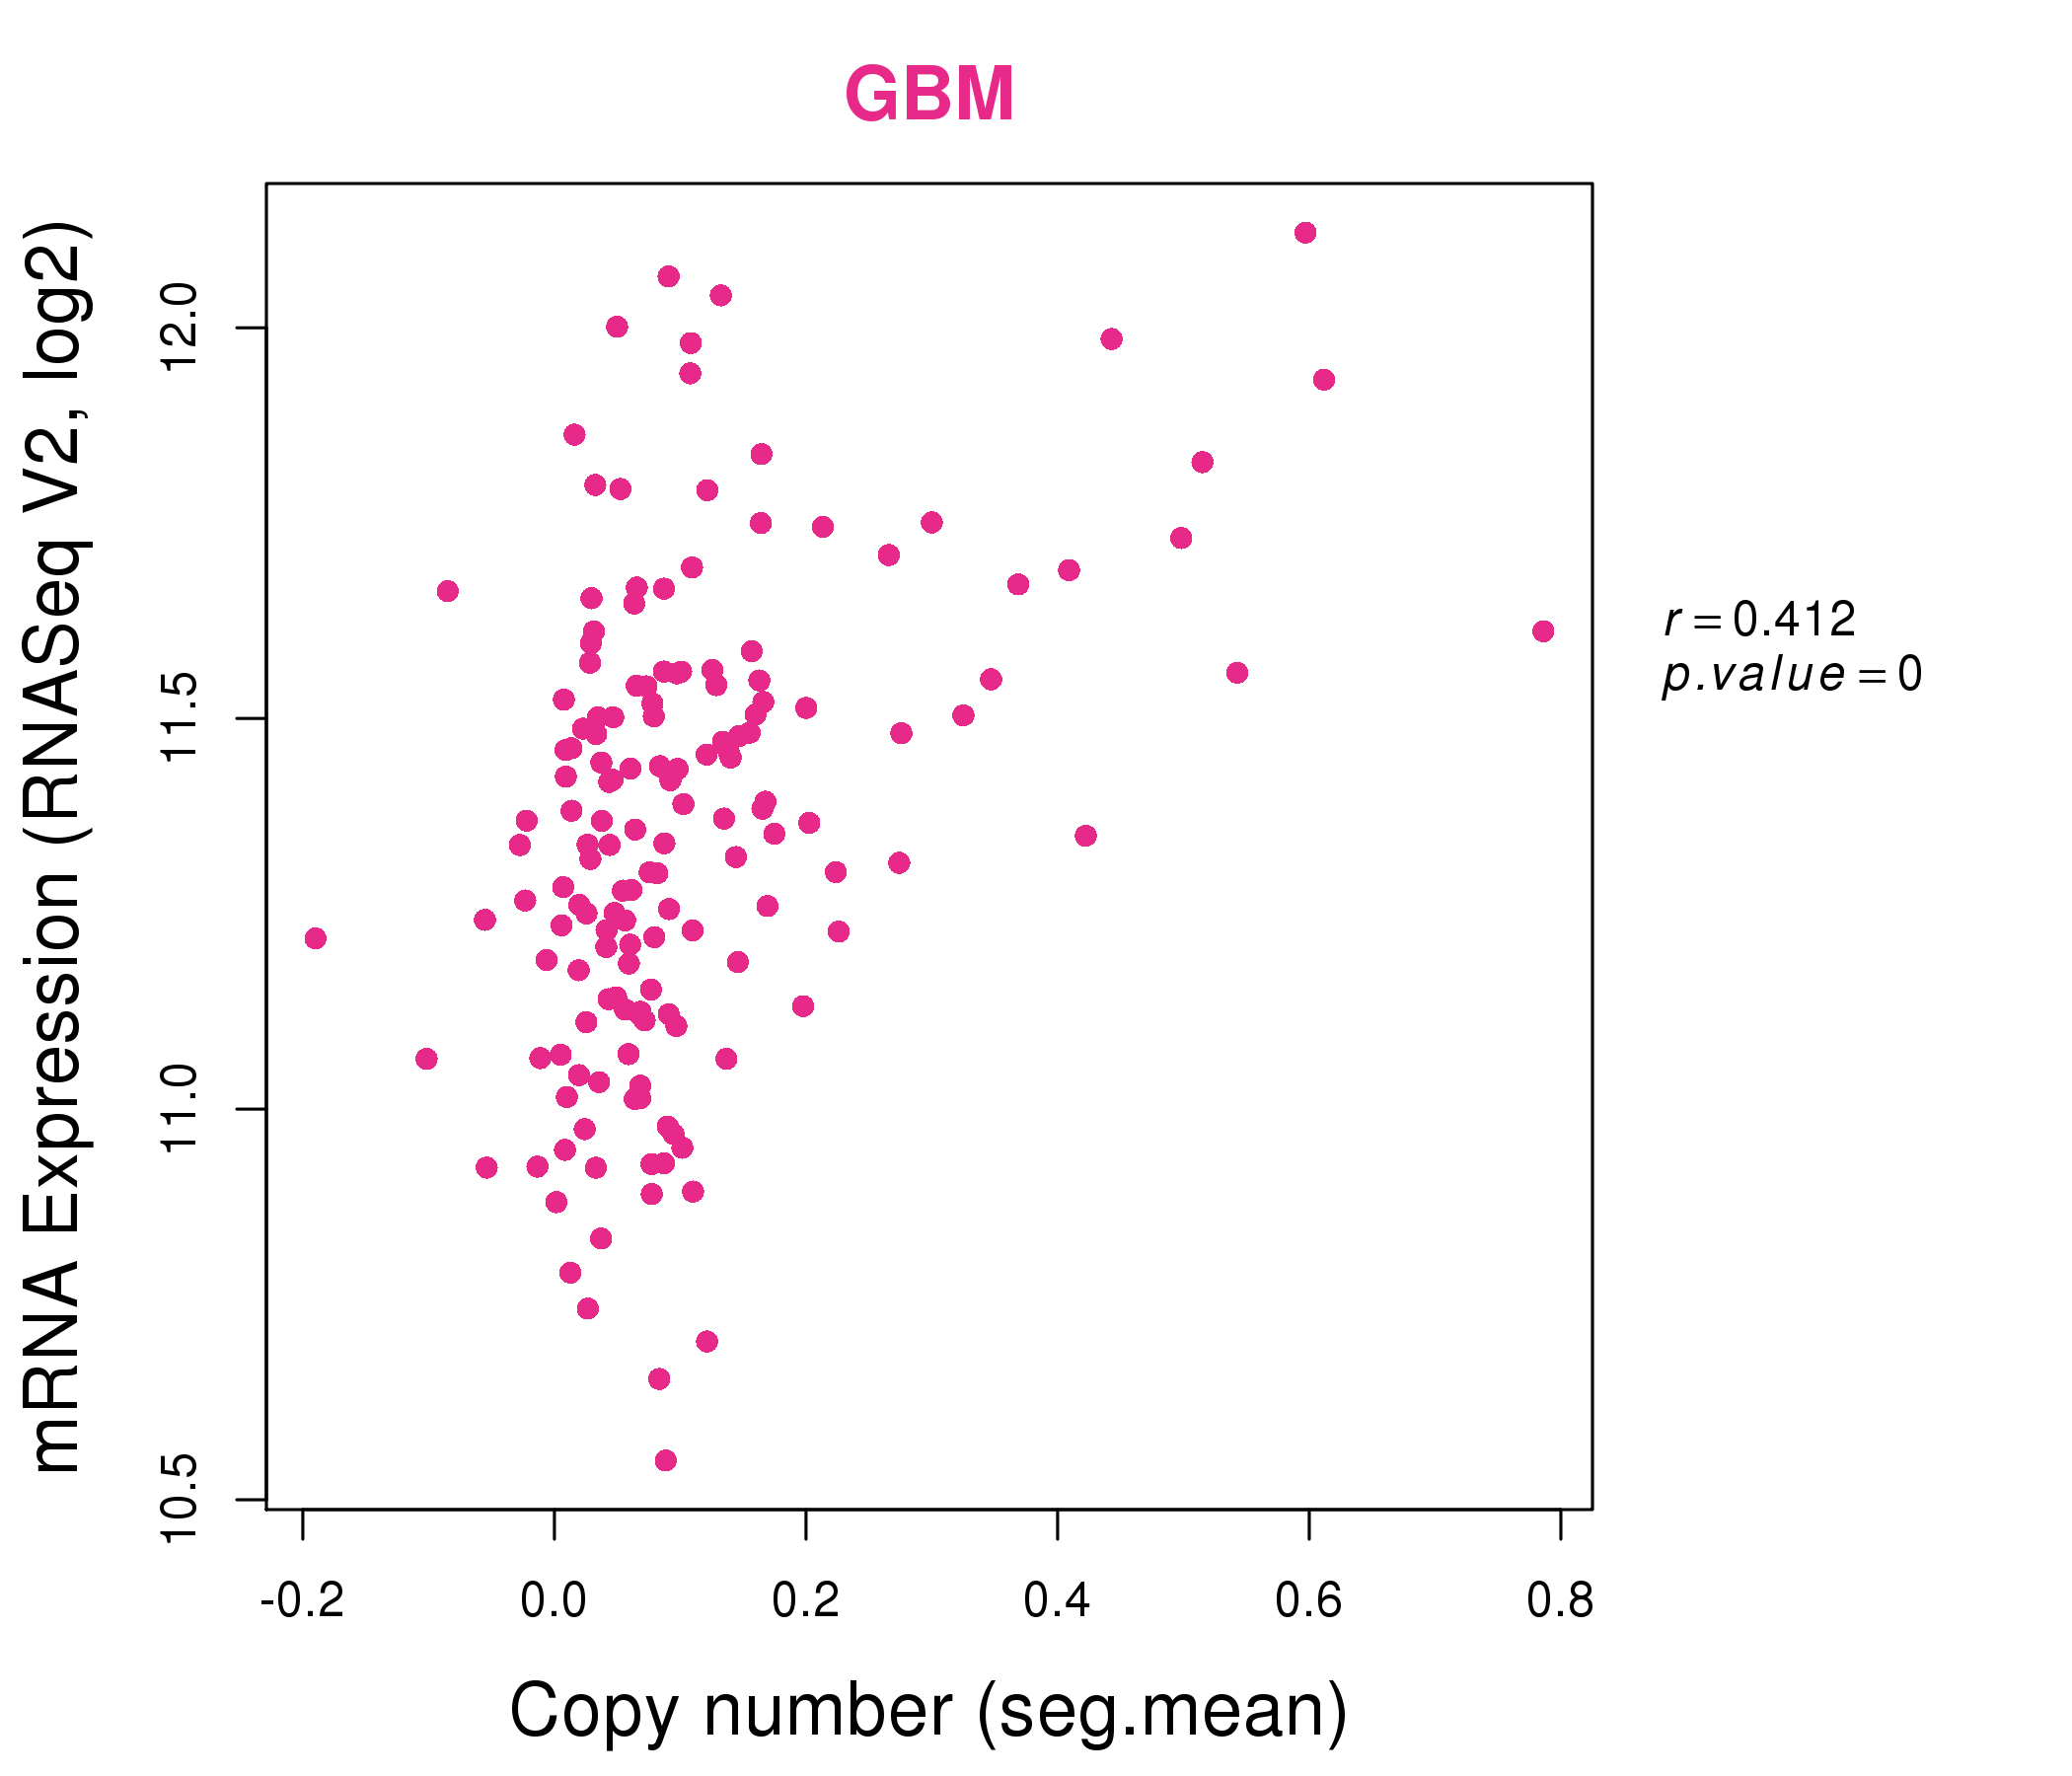
| * This plots show the correlation between CNV and gene expression. |
: Open all plots for all cancer types
 |
|
 |
|
| Top |
| Gene-Gene Network Information |
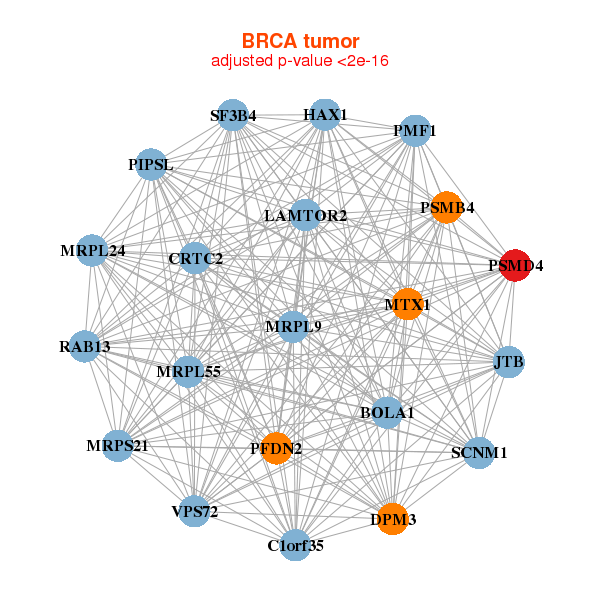
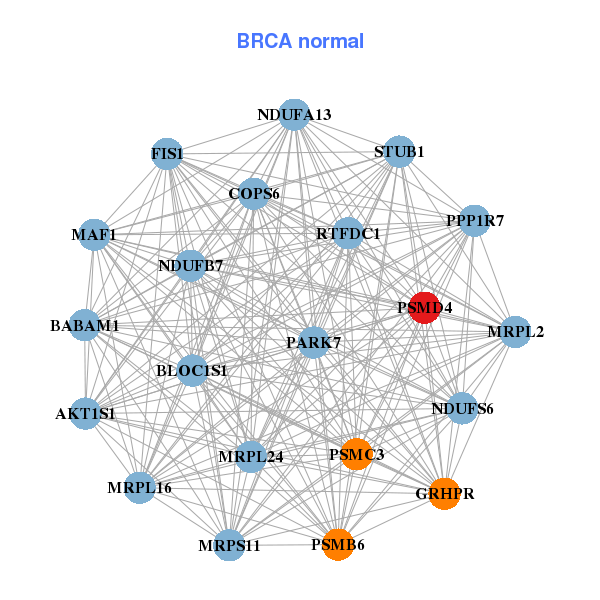
| * Co-Expression network figures were drawn using R package igraph. Only the top 20 genes with the highest correlations were shown. Red circle: input gene, orange circle: cell metabolism gene, sky circle: other gene |
: Open all plots for all cancer types
 |
| ||||
| BOLA1,C1orf35,CRTC2,DPM3,HAX1,JTB,MRPL24, MRPL55,MRPL9,MRPS21,MTX1,PFDN2,PIPSL,PMF1, PSMB4,PSMD4,RAB13,LAMTOR2,SCNM1,SF3B4,VPS72 | AKT1S1,BLOC1S1,BABAM1,RTFDC1,COPS6,FIS1,GRHPR, MAF1,MRPL16,MRPL24,MRPL2,MRPS11,NDUFA13,NDUFB7, NDUFS6,PARK7,PPP1R7,PSMB6,PSMC3,PSMD4,STUB1 | ||||
 |
| ||||
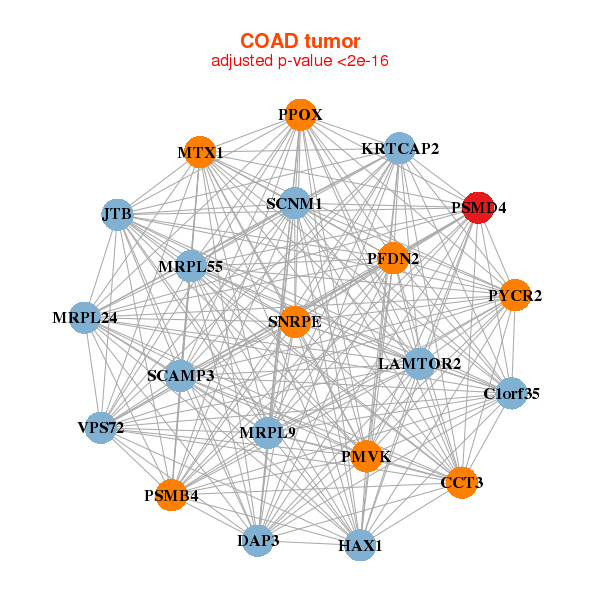
| C1orf35,CCT3,DAP3,HAX1,JTB,KRTCAP2,MRPL24, MRPL55,MRPL9,MTX1,PFDN2,PMVK,PPOX,PSMB4, PSMD4,PYCR2,LAMTOR2,SCAMP3,SCNM1,SNRPE,VPS72 | C11orf73,COPRS,BRK1,COPS6,CREB3,DPCD,DRAP1, MANBAL,MEA1,MPV17,NUBP1,PARK7,PFDN1,PSMB6, PSMC3,PSMD4,RANGRF,SNAPIN,SSSCA1,TRMT112,UROD |
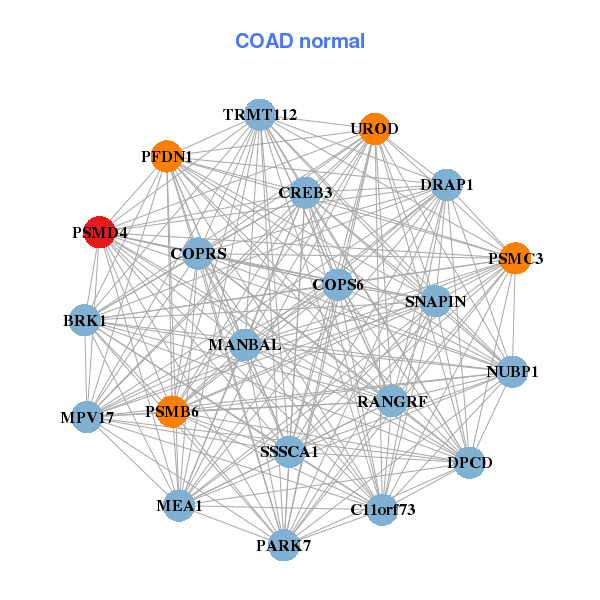
| * Co-Expression network figures were drawn using R package igraph. Only the top 20 genes with the highest correlations were shown. Red circle: input gene, orange circle: cell metabolism gene, sky circle: other gene |
: Open all plots for all cancer types
| Top |
: Open all interacting genes' information including KEGG pathway for all interacting genes from DAVID
| Top |
| Pharmacological Information for PSMD4 |
| DB Category | DB Name | DB's ID and Url link |
| * Gene Centered Interaction Network. |
 |
| * Drug Centered Interaction Network. |
| DrugBank ID | Target Name | Drug Groups | Generic Name | Drug Centered Network | Drug Structure |
| DB00171 | proteasome (prosome, macropain) 26S subunit, non-ATPase, 4 | approved; nutraceutical | Adenosine triphosphate |  |  |
| Top |
| Cross referenced IDs for PSMD4 |
| * We obtained these cross-references from Uniprot database. It covers 150 different DBs, 18 categories. http://www.uniprot.org/help/cross_references_section |
: Open all cross reference information
|
Copyright © 2016-Present - The Univsersity of Texas Health Science Center at Houston @ |