|
||||||||||||||||||||
| |
| Phenotypic Information (metabolism pathway, cancer, disease, phenome) |
| |
| |
| Gene-Gene Network Information: Co-Expression Network, Interacting Genes & KEGG |
| |
|


| Gene Summary for PNPLA2 |
| Basic gene info. | Gene symbol | PNPLA2 |
| Gene name | patatin-like phospholipase domain containing 2 | |
| Synonyms | 1110001C14Rik|ATGL|PEDF-R|TTS-2.2|TTS2|iPLA2zeta | |
| Cytomap | UCSC genome browser: 11p15.5 | |
| Genomic location | chr11 :818900-825571 | |
| Type of gene | protein-coding | |
| RefGenes | NM_020376.3, | |
| Ensembl id | ENSG00000177666 | |
| Description | IPLA2-zetaTTS2.2adipose triglyceride lipasecalcium-independent phospholipase A2desnutrinpatatin-like phospholipase domain containing protein 2patatin-like phospholipase domain-containing protein 2pigment epithelium-derived factortransport-secretio | |
| Modification date | 20141207 | |
| dbXrefs | MIM : 609059 | |
| HGNC : HGNC | ||
| Ensembl : ENSG00000177666 | ||
| HPRD : 11443 | ||
| Vega : OTTHUMG00000133309 | ||
| Protein | UniProt: go to UniProt's Cross Reference DB Table | |
| Expression | CleanEX: HS_PNPLA2 | |
| BioGPS: 57104 | ||
| Gene Expression Atlas: ENSG00000177666 | ||
| The Human Protein Atlas: ENSG00000177666 | ||
| Pathway | NCI Pathway Interaction Database: PNPLA2 | |
| KEGG: PNPLA2 | ||
| REACTOME: PNPLA2 | ||
| ConsensusPathDB | ||
| Pathway Commons: PNPLA2 | ||
| Metabolism | MetaCyc: PNPLA2 | |
| HUMANCyc: PNPLA2 | ||
| Regulation | Ensembl's Regulation: ENSG00000177666 | |
| miRBase: chr11 :818,900-825,571 | ||
| TargetScan: NM_020376 | ||
| cisRED: ENSG00000177666 | ||
| Context | iHOP: PNPLA2 | |
| cancer metabolism search in PubMed: PNPLA2 | ||
| UCL Cancer Institute: PNPLA2 | ||
| Assigned class in ccmGDB | C | |
| Top |
| Phenotypic Information for PNPLA2(metabolism pathway, cancer, disease, phenome) |
| Cancer | CGAP: PNPLA2 |
| Familial Cancer Database: PNPLA2 | |
| * This gene is included in those cancer gene databases. |
|
|
|
|
|
|
| ||||||||||||||
Oncogene 1 | Significant driver gene in | |||||||||||||||||||
| cf) number; DB name 1 Oncogene; http://nar.oxfordjournals.org/content/35/suppl_1/D721.long, 2 Tumor Suppressor gene; https://bioinfo.uth.edu/TSGene/, 3 Cancer Gene Census; http://www.nature.com/nrc/journal/v4/n3/abs/nrc1299.html, 4 CancerGenes; http://nar.oxfordjournals.org/content/35/suppl_1/D721.long, 5 Network of Cancer Gene; http://ncg.kcl.ac.uk/index.php, 1Therapeutic Vulnerabilities in Cancer; http://cbio.mskcc.org/cancergenomics/statius/ |
| REACTOME_PHOSPHOLIPID_METABOLISM REACTOME_METABOLISM_OF_LIPIDS_AND_LIPOPROTEINS | |
| OMIM | |
| Orphanet | |
| Disease | KEGG Disease: PNPLA2 |
| MedGen: PNPLA2 (Human Medical Genetics with Condition) | |
| ClinVar: PNPLA2 | |
| Phenotype | MGI: PNPLA2 (International Mouse Phenotyping Consortium) |
| PhenomicDB: PNPLA2 | |
| Mutations for PNPLA2 |
| * Under tables are showing count per each tissue to give us broad intuition about tissue specific mutation patterns.You can go to the detailed page for each mutation database's web site. |
| There's no structural variation information in COSMIC data for this gene. |
| * From mRNA Sanger sequences, Chitars2.0 arranged chimeric transcripts. This table shows PNPLA2 related fusion information. |
| ID | Head Gene | Tail Gene | Accession | Gene_a | qStart_a | qEnd_a | Chromosome_a | tStart_a | tEnd_a | Gene_a | qStart_a | qEnd_a | Chromosome_a | tStart_a | tEnd_a |
| BG960633 | PNPLA2 | 14 | 243 | 11 | 820586 | 820922 | PNPLA2 | 226 | 348 | 11 | 820923 | 821042 | |
| AV703000 | UNC119 | 1 | 350 | 17 | 26874715 | 26875703 | PNPLA2 | 345 | 435 | 11 | 825127 | 825217 | |
| BQ446930 | PNPLA2 | 19 | 113 | 11 | 825124 | 825218 | CCDC162P | 100 | 328 | 6 | 109669115 | 109669342 | |
| BI017246 | PNPLA2 | 12 | 262 | 11 | 821832 | 822552 | GHITM | 255 | 361 | 10 | 85912193 | 85912300 | |
| BU960554 | HM13 | 3 | 230 | 20 | 30154044 | 30157173 | PNPLA2 | 218 | 407 | 11 | 825028 | 825217 | |
| Top |
| There's no copy number variation information in COSMIC data for this gene. |
| Top |
|
 |
| Top |
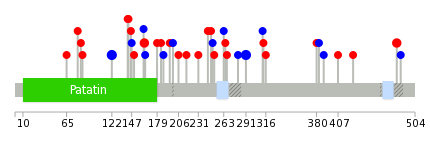
| Stat. for Non-Synonymous SNVs (# total SNVs=19) | (# total SNVs=11) |
 |  |
(# total SNVs=0) | (# total SNVs=0) |
| Top |
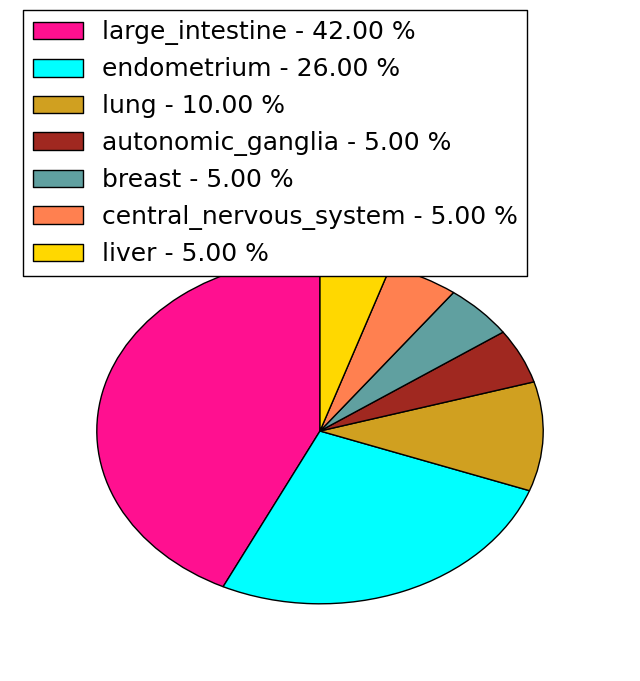
| * When you move the cursor on each content, you can see more deailed mutation information on the Tooltip. Those are primary_site,primary_histology,mutation(aa),pubmedID. |
| GRCh37 position | Mutation(aa) | Unique sampleID count |
| chr11:821806-821806 | p.S122S | 3 |
| chr11:823809-823809 | p.P291P | 3 |
| chr11:824789-824789 | p.L481P | 2 |
| chr11:822398-822398 | p.R163H | 2 |
| chr11:822445-822445 | p.K179E | 1 |
| chr11:823582-823582 | p.R251Q | 1 |
| chr11:824428-824428 | p.L389L | 1 |
| chr11:822460-822460 | p.V184M | 1 |
| chr11:823725-823725 | p.A263A | 1 |
| chr11:821962-821962 | p.N142S | 1 |
| Top |
|
 |
| Point Mutation/ Tissue ID | 1 | 2 | 3 | 4 | 5 | 6 | 7 | 8 | 9 | 10 | 11 | 12 | 13 | 14 | 15 | 16 | 17 | 18 | 19 | 20 |
| # sample | 2 | 1 | 1 | 2 | 1 | 1 | 3 | 8 | ||||||||||||
| # mutation | 2 | 1 | 1 | 2 | 1 | 1 | 3 | 8 | ||||||||||||
| nonsynonymous SNV | 2 | 1 | 1 | 1 | 3 | 5 | ||||||||||||||
| synonymous SNV | 2 | 1 | 3 |
| cf) Tissue ID; Tissue type (1; BLCA[Bladder Urothelial Carcinoma], 2; BRCA[Breast invasive carcinoma], 3; CESC[Cervical squamous cell carcinoma and endocervical adenocarcinoma], 4; COAD[Colon adenocarcinoma], 5; GBM[Glioblastoma multiforme], 6; Glioma Low Grade, 7; HNSC[Head and Neck squamous cell carcinoma], 8; KICH[Kidney Chromophobe], 9; KIRC[Kidney renal clear cell carcinoma], 10; KIRP[Kidney renal papillary cell carcinoma], 11; LAML[Acute Myeloid Leukemia], 12; LUAD[Lung adenocarcinoma], 13; LUSC[Lung squamous cell carcinoma], 14; OV[Ovarian serous cystadenocarcinoma ], 15; PAAD[Pancreatic adenocarcinoma], 16; PRAD[Prostate adenocarcinoma], 17; SKCM[Skin Cutaneous Melanoma], 18:STAD[Stomach adenocarcinoma], 19:THCA[Thyroid carcinoma], 20:UCEC[Uterine Corpus Endometrial Carcinoma]) |
| Top |
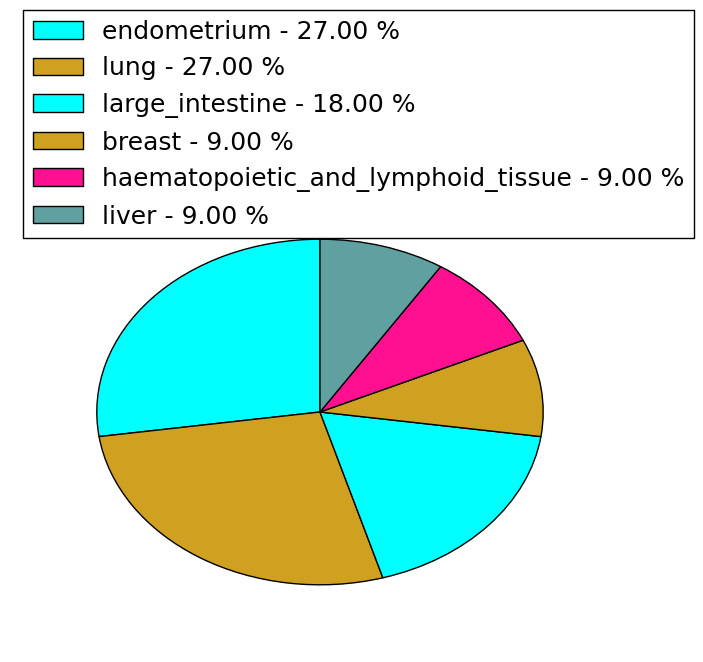
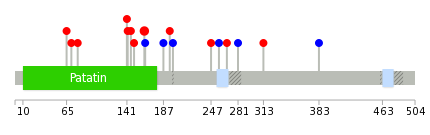
| * We represented just top 10 SNVs. When you move the cursor on each content, you can see more deailed mutation information on the Tooltip. Those are primary_site, primary_histology, mutation(aa), pubmedID. |
| Genomic Position | Mutation(aa) | Unique sampleID count |
| chr11:822398 | p.R163H | 2 |
| chr11:823736 | p.P195L | 1 |
| chr11:821962 | p.S199S | 1 |
| chr11:823779 | p.R247H | 1 |
| chr11:821973 | p.R257R | 1 |
| chr11:824015 | p.A267V | 1 |
| chr11:821985 | p.S281S | 1 |
| chr11:824410 | p.A65V | 1 |
| chr11:822402 | p.V313M | 1 |
| chr11:822471 | p.E71Q | 1 |
| * Copy number data were extracted from TCGA using R package TCGA-Assembler. The URLs of all public data files on TCGA DCC data server were gathered on Jan-05-2015. Function ProcessCNAData in TCGA-Assembler package was used to obtain gene-level copy number value which is calculated as the average copy number of the genomic region of a gene. |
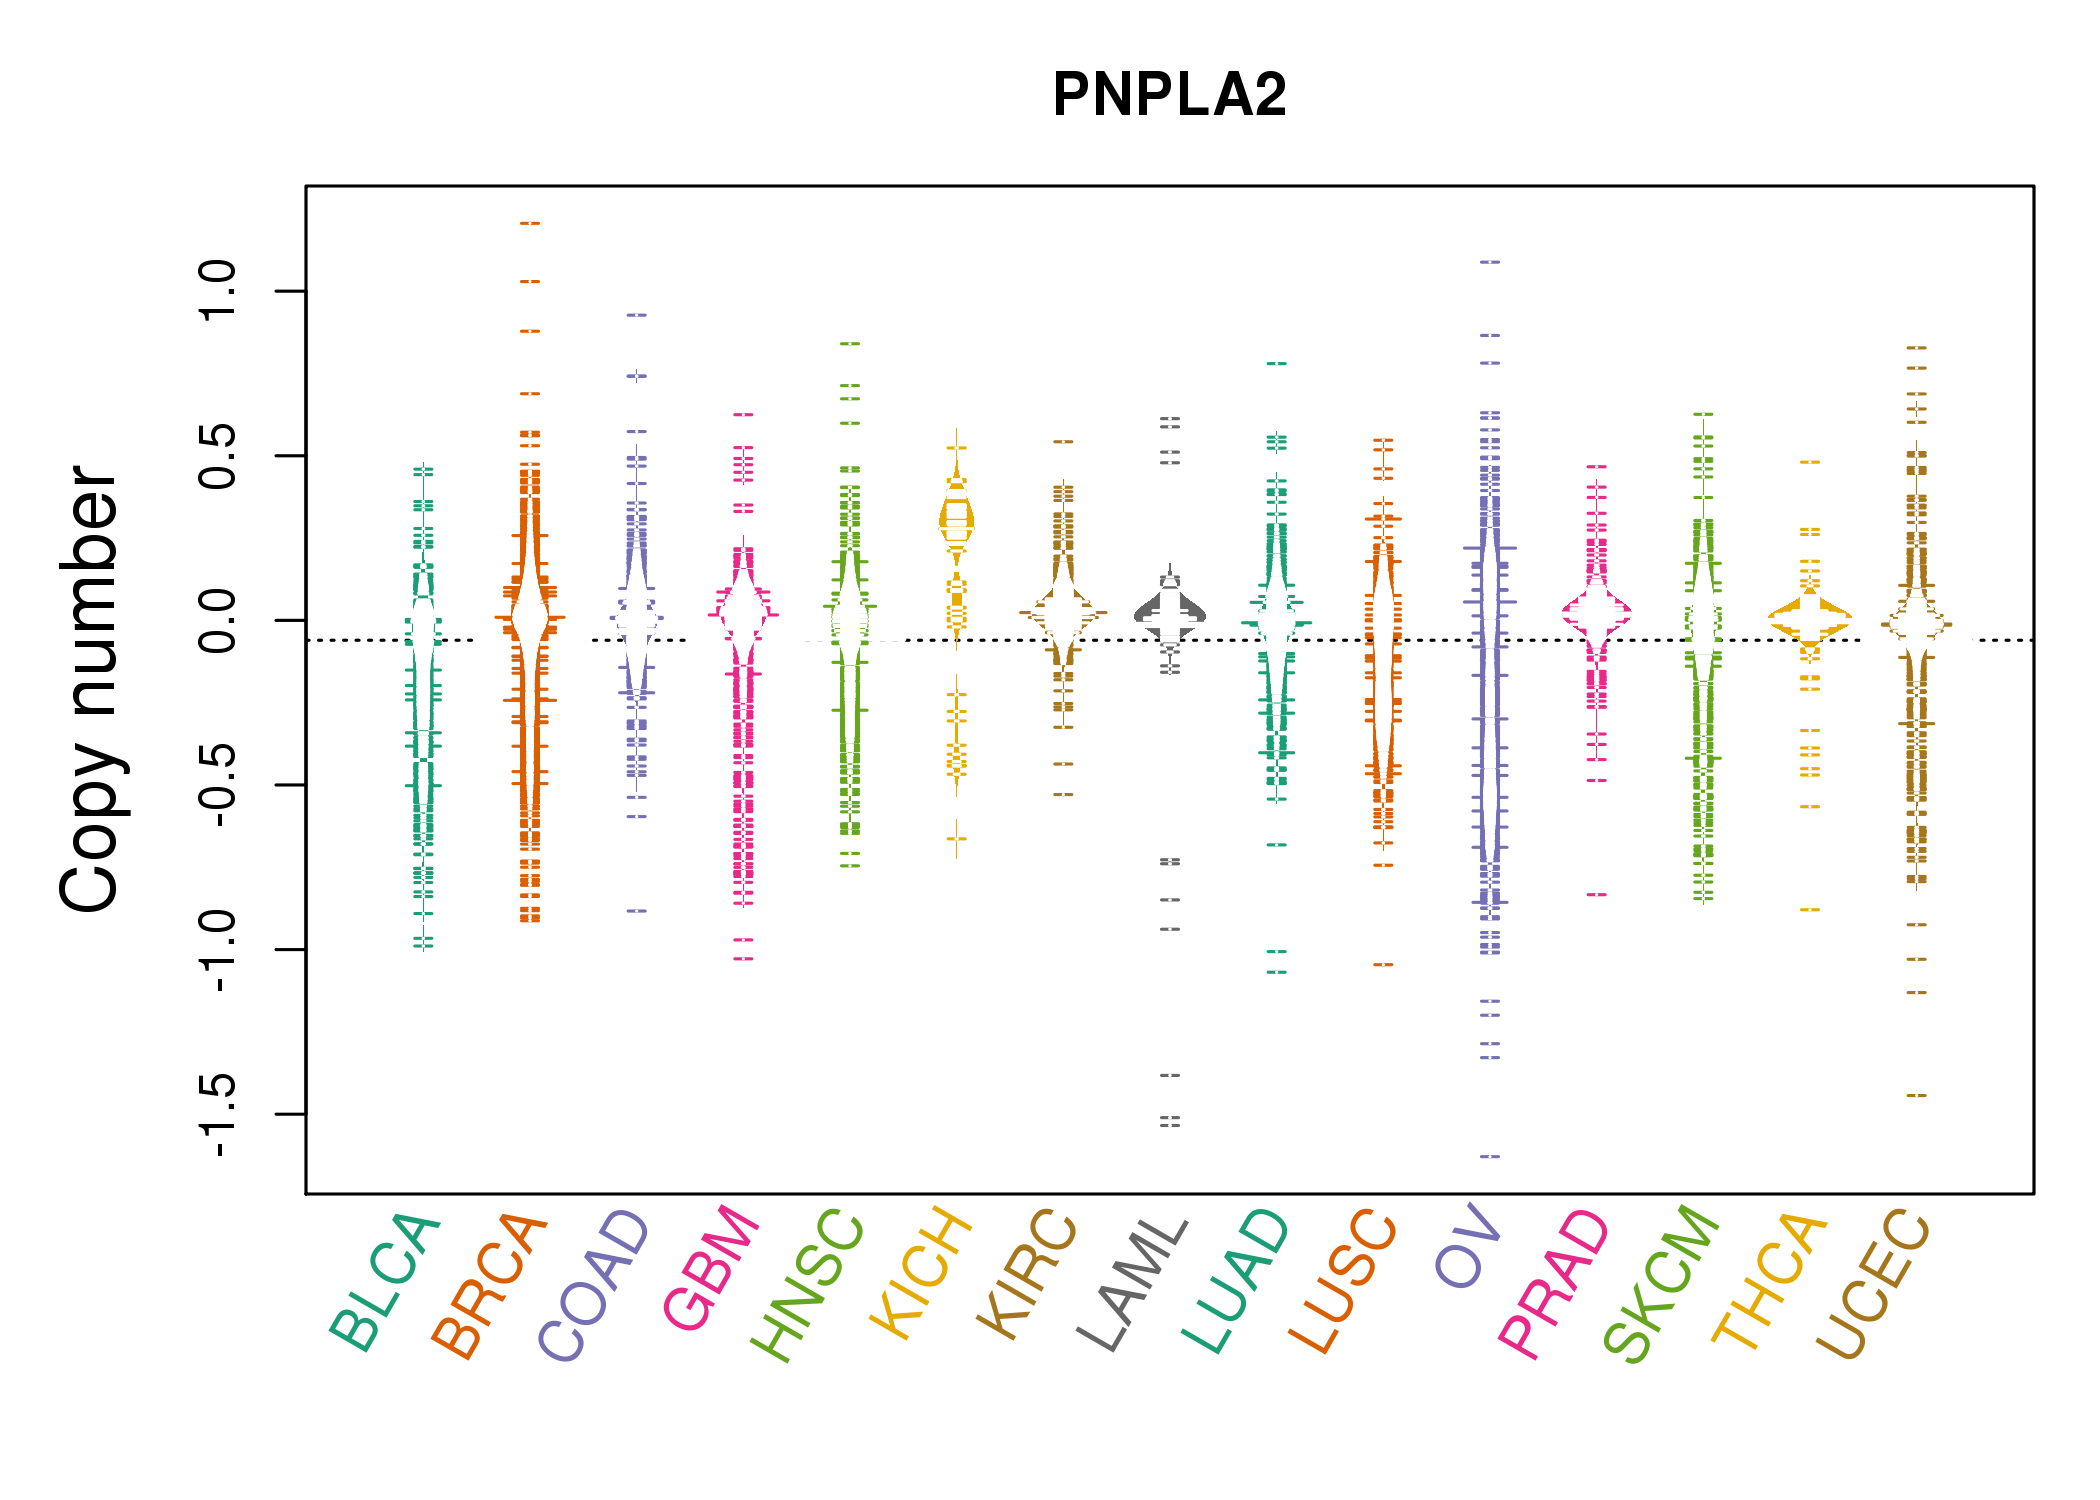 |
| cf) Tissue ID[Tissue type]: BLCA[Bladder Urothelial Carcinoma], BRCA[Breast invasive carcinoma], CESC[Cervical squamous cell carcinoma and endocervical adenocarcinoma], COAD[Colon adenocarcinoma], GBM[Glioblastoma multiforme], Glioma Low Grade, HNSC[Head and Neck squamous cell carcinoma], KICH[Kidney Chromophobe], KIRC[Kidney renal clear cell carcinoma], KIRP[Kidney renal papillary cell carcinoma], LAML[Acute Myeloid Leukemia], LUAD[Lung adenocarcinoma], LUSC[Lung squamous cell carcinoma], OV[Ovarian serous cystadenocarcinoma ], PAAD[Pancreatic adenocarcinoma], PRAD[Prostate adenocarcinoma], SKCM[Skin Cutaneous Melanoma], STAD[Stomach adenocarcinoma], THCA[Thyroid carcinoma], UCEC[Uterine Corpus Endometrial Carcinoma] |
| Top |
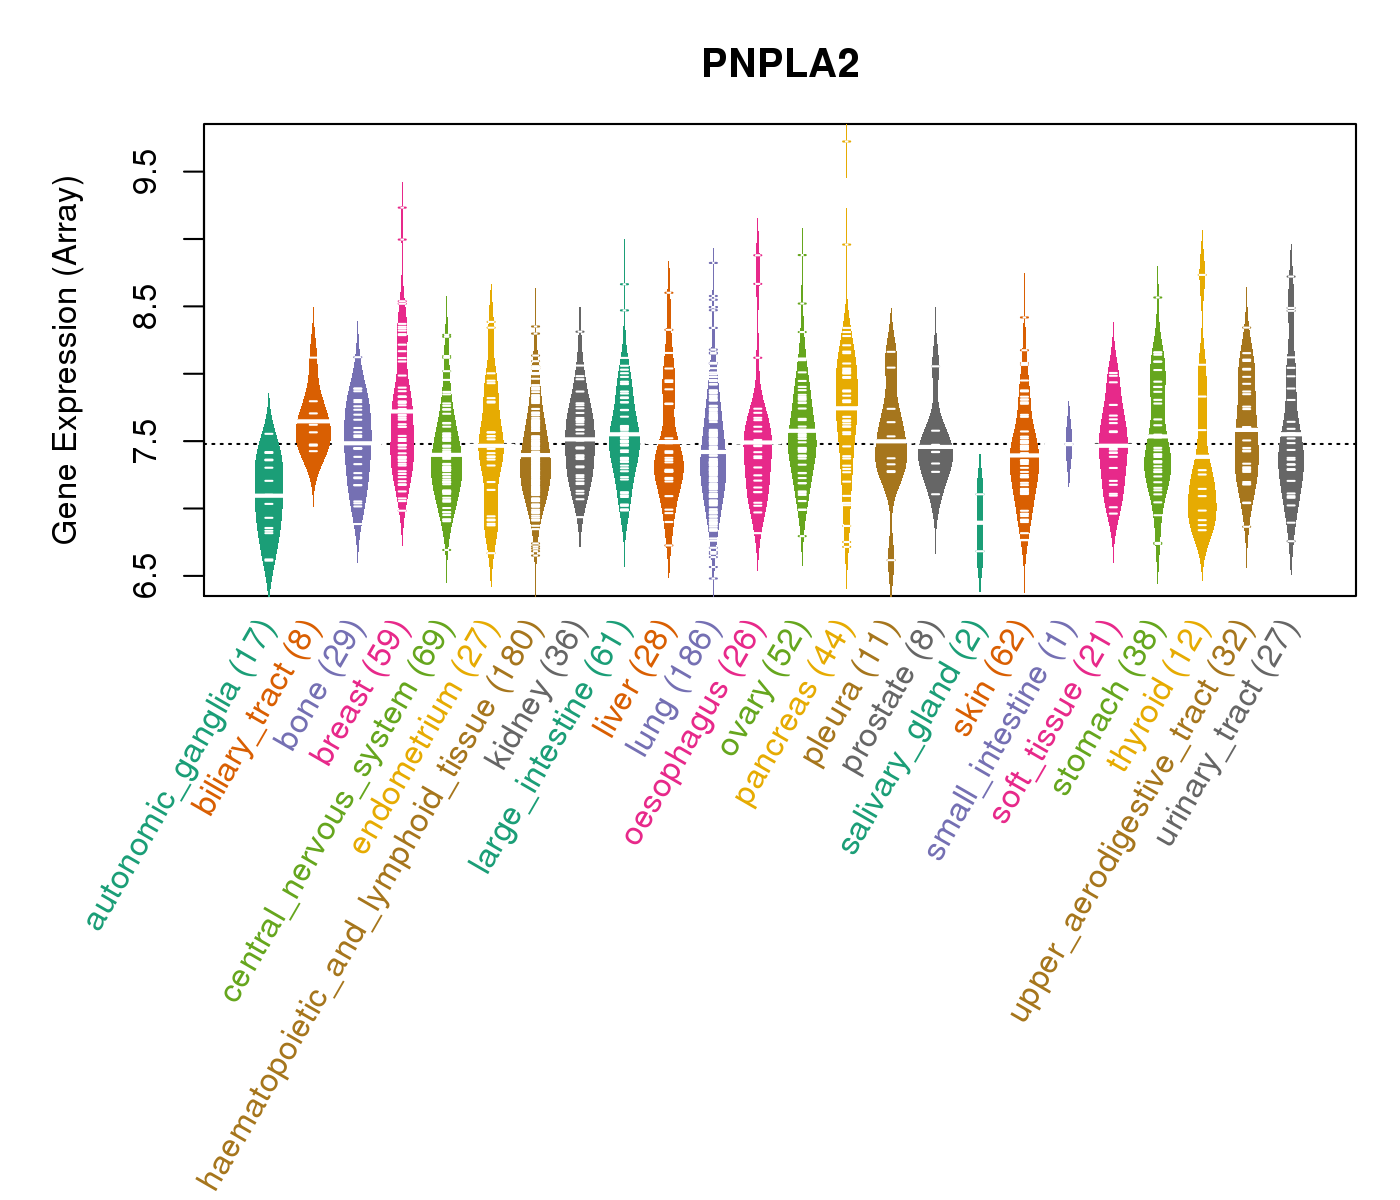
| Gene Expression for PNPLA2 |
| * CCLE gene expression data were extracted from CCLE_Expression_Entrez_2012-10-18.res: Gene-centric RMA-normalized mRNA expression data. |
 |
| * Normalized gene expression data of RNASeqV2 was extracted from TCGA using R package TCGA-Assembler. The URLs of all public data files on TCGA DCC data server were gathered at Jan-05-2015. Only eight cancer types have enough normal control samples for differential expression analysis. (t test, adjusted p<0.05 (using Benjamini-Hochberg FDR)) |
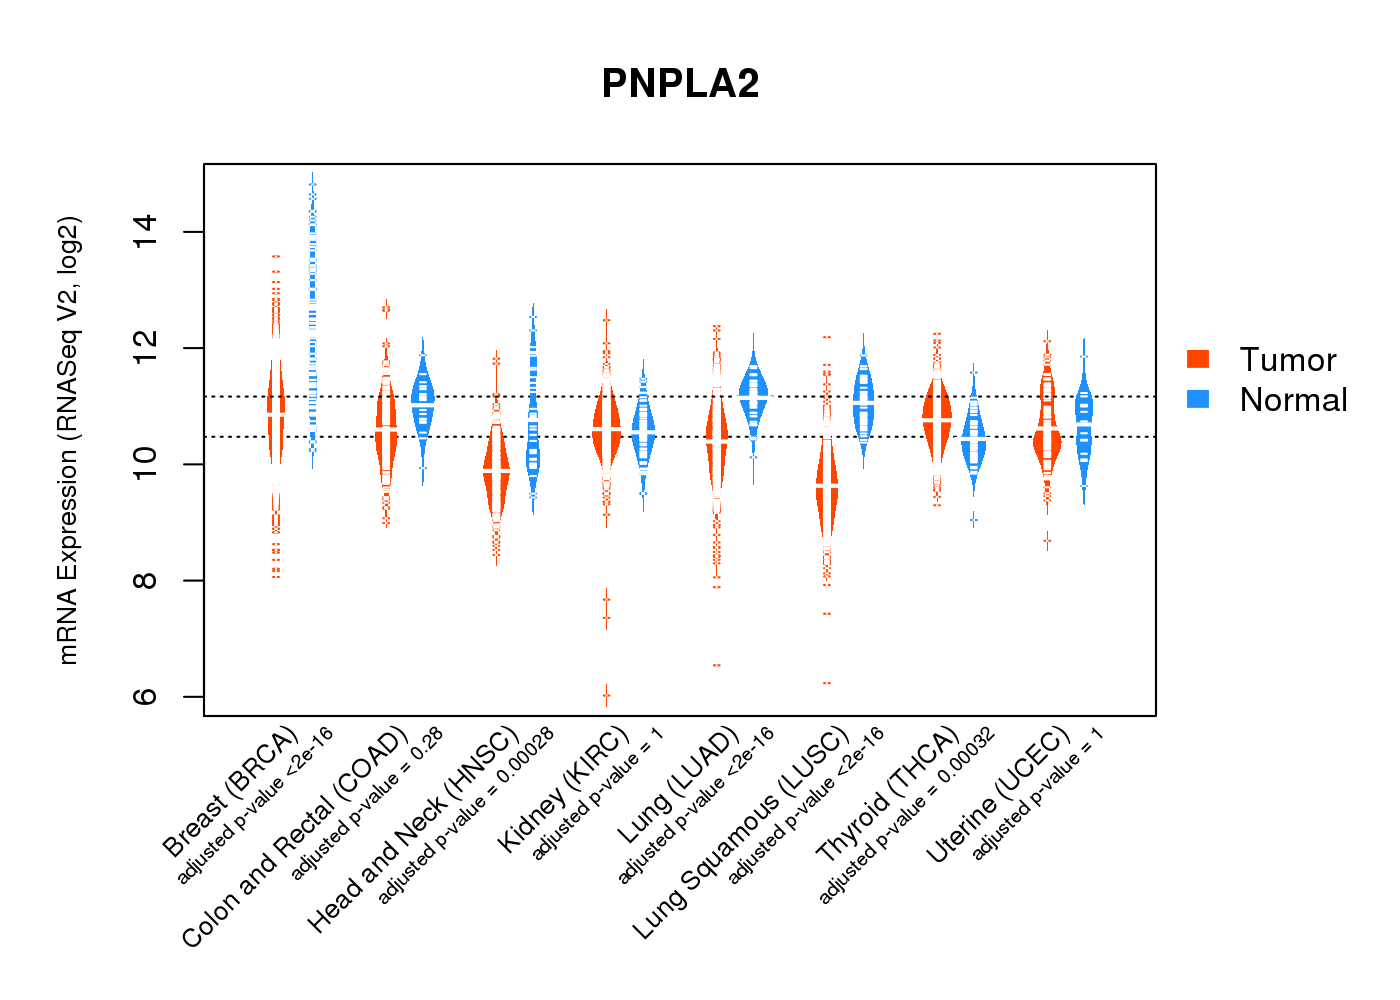 |
| Top |
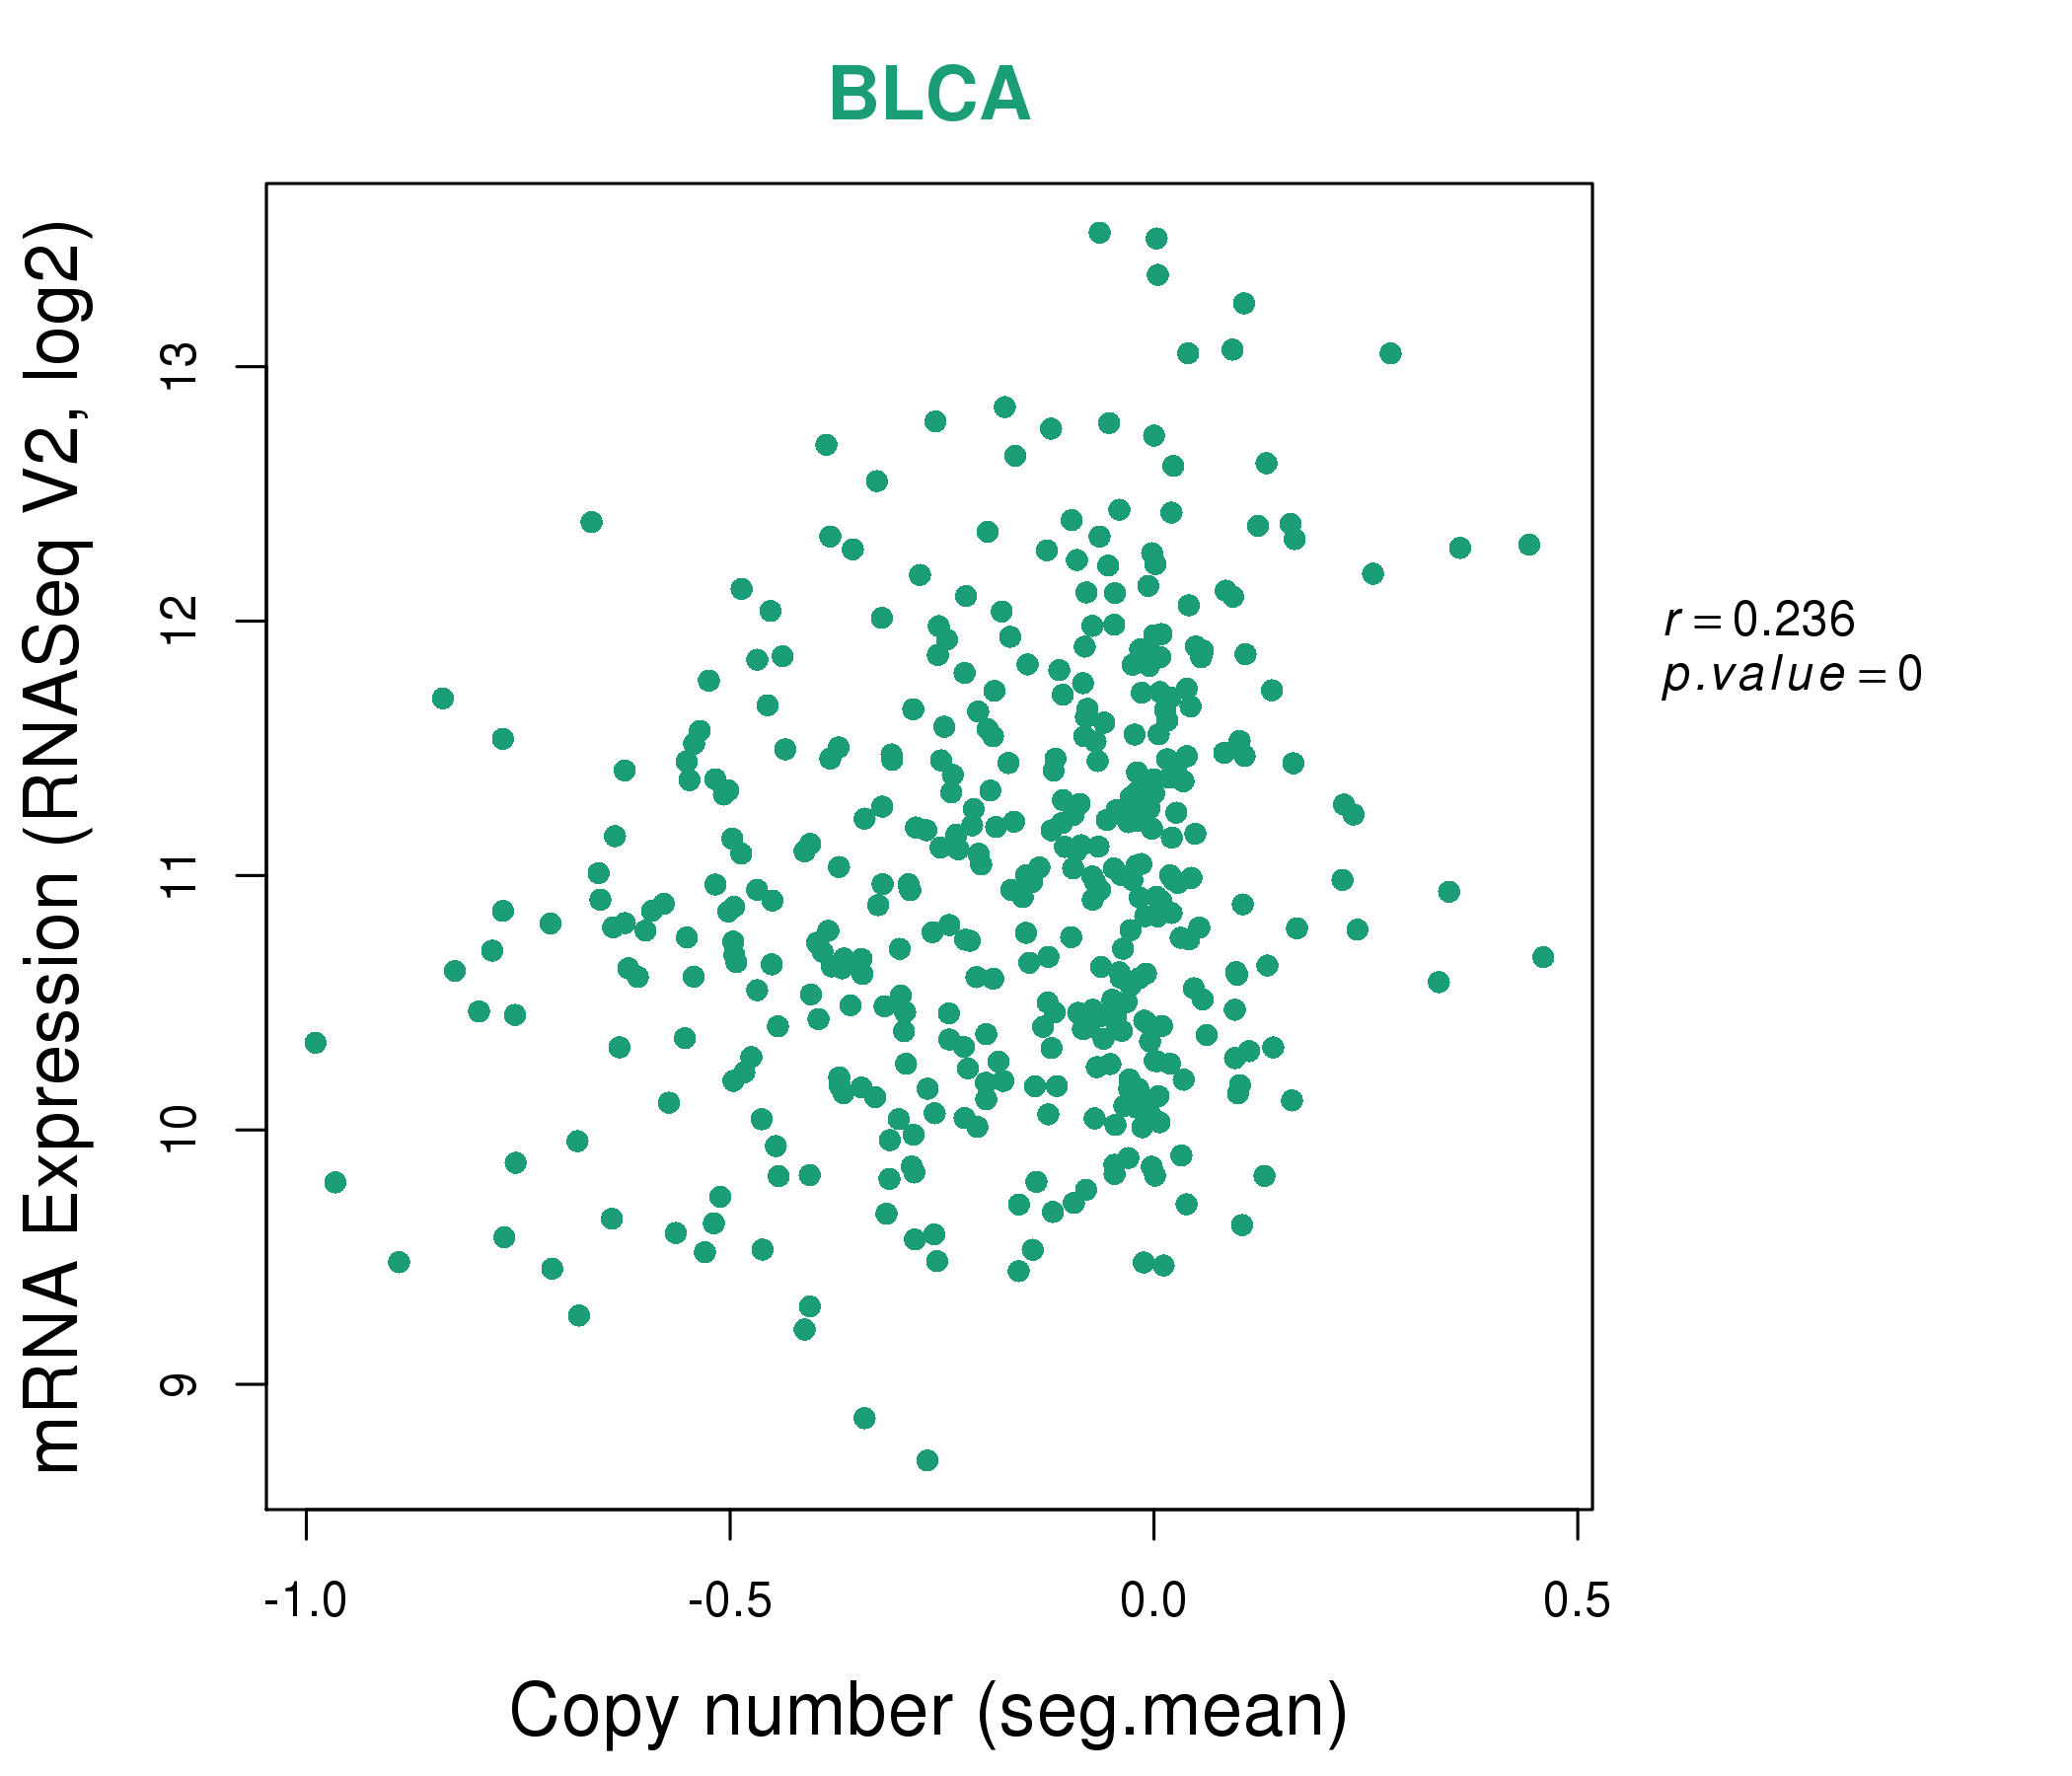
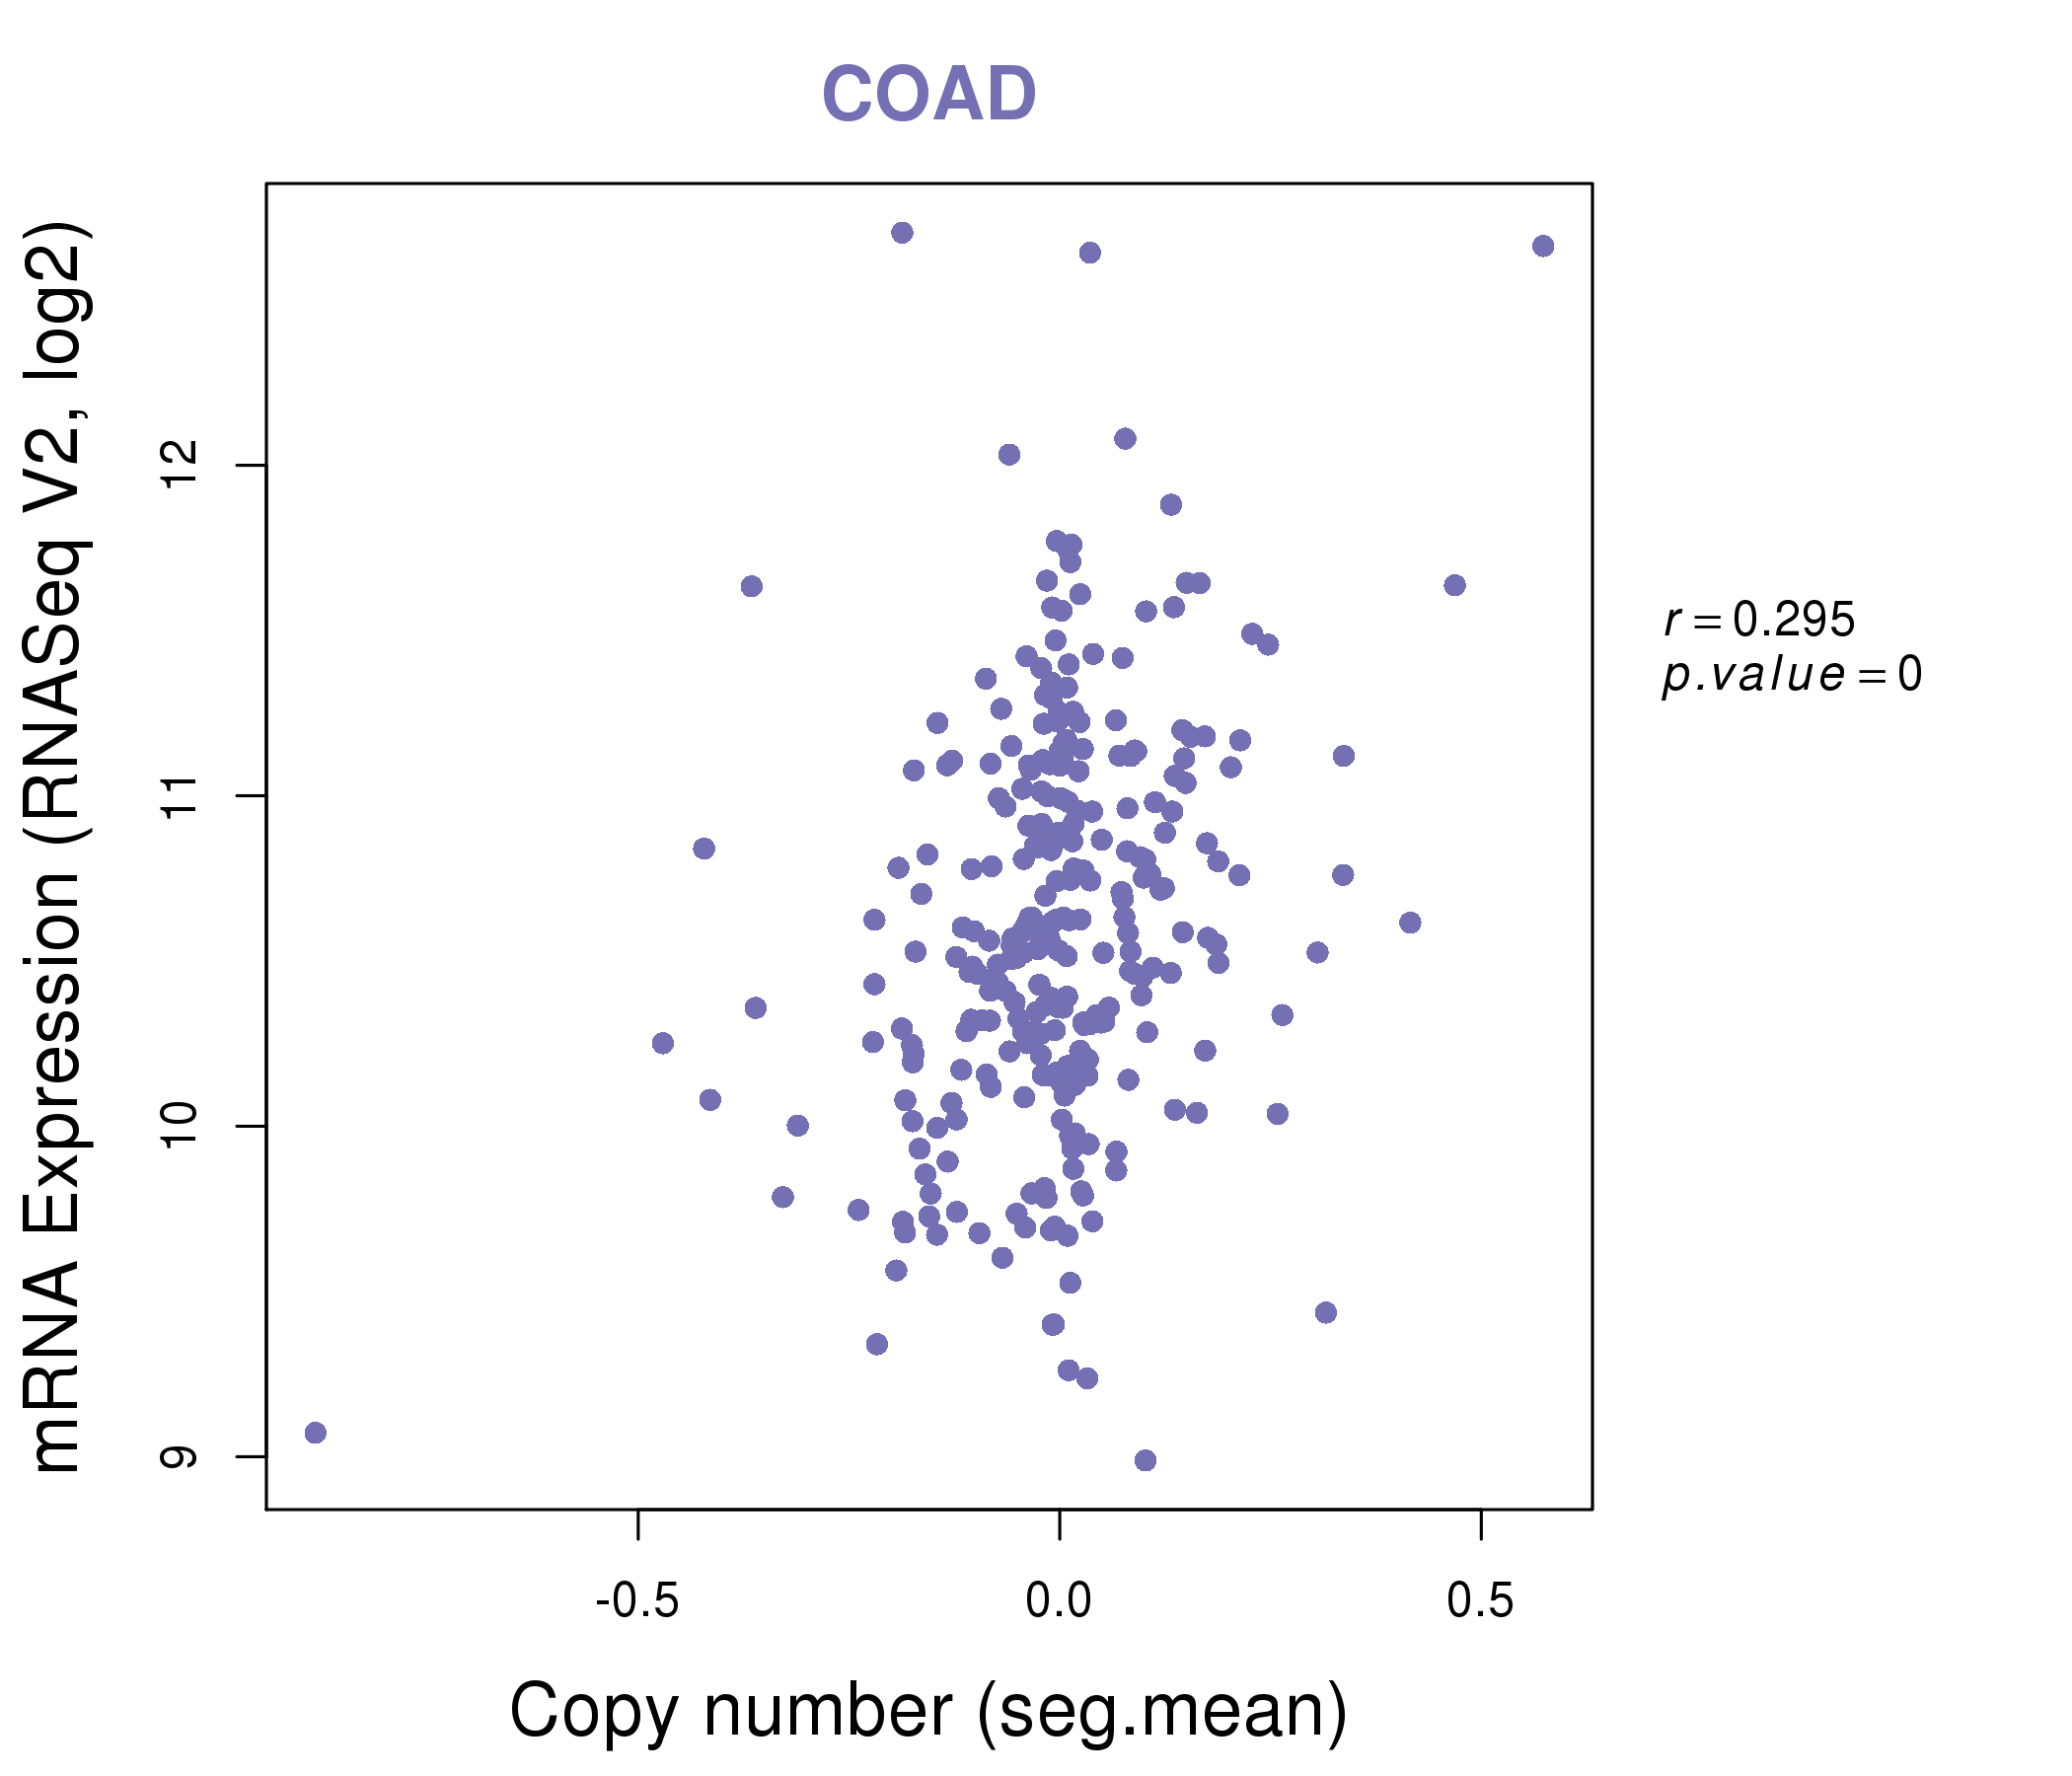
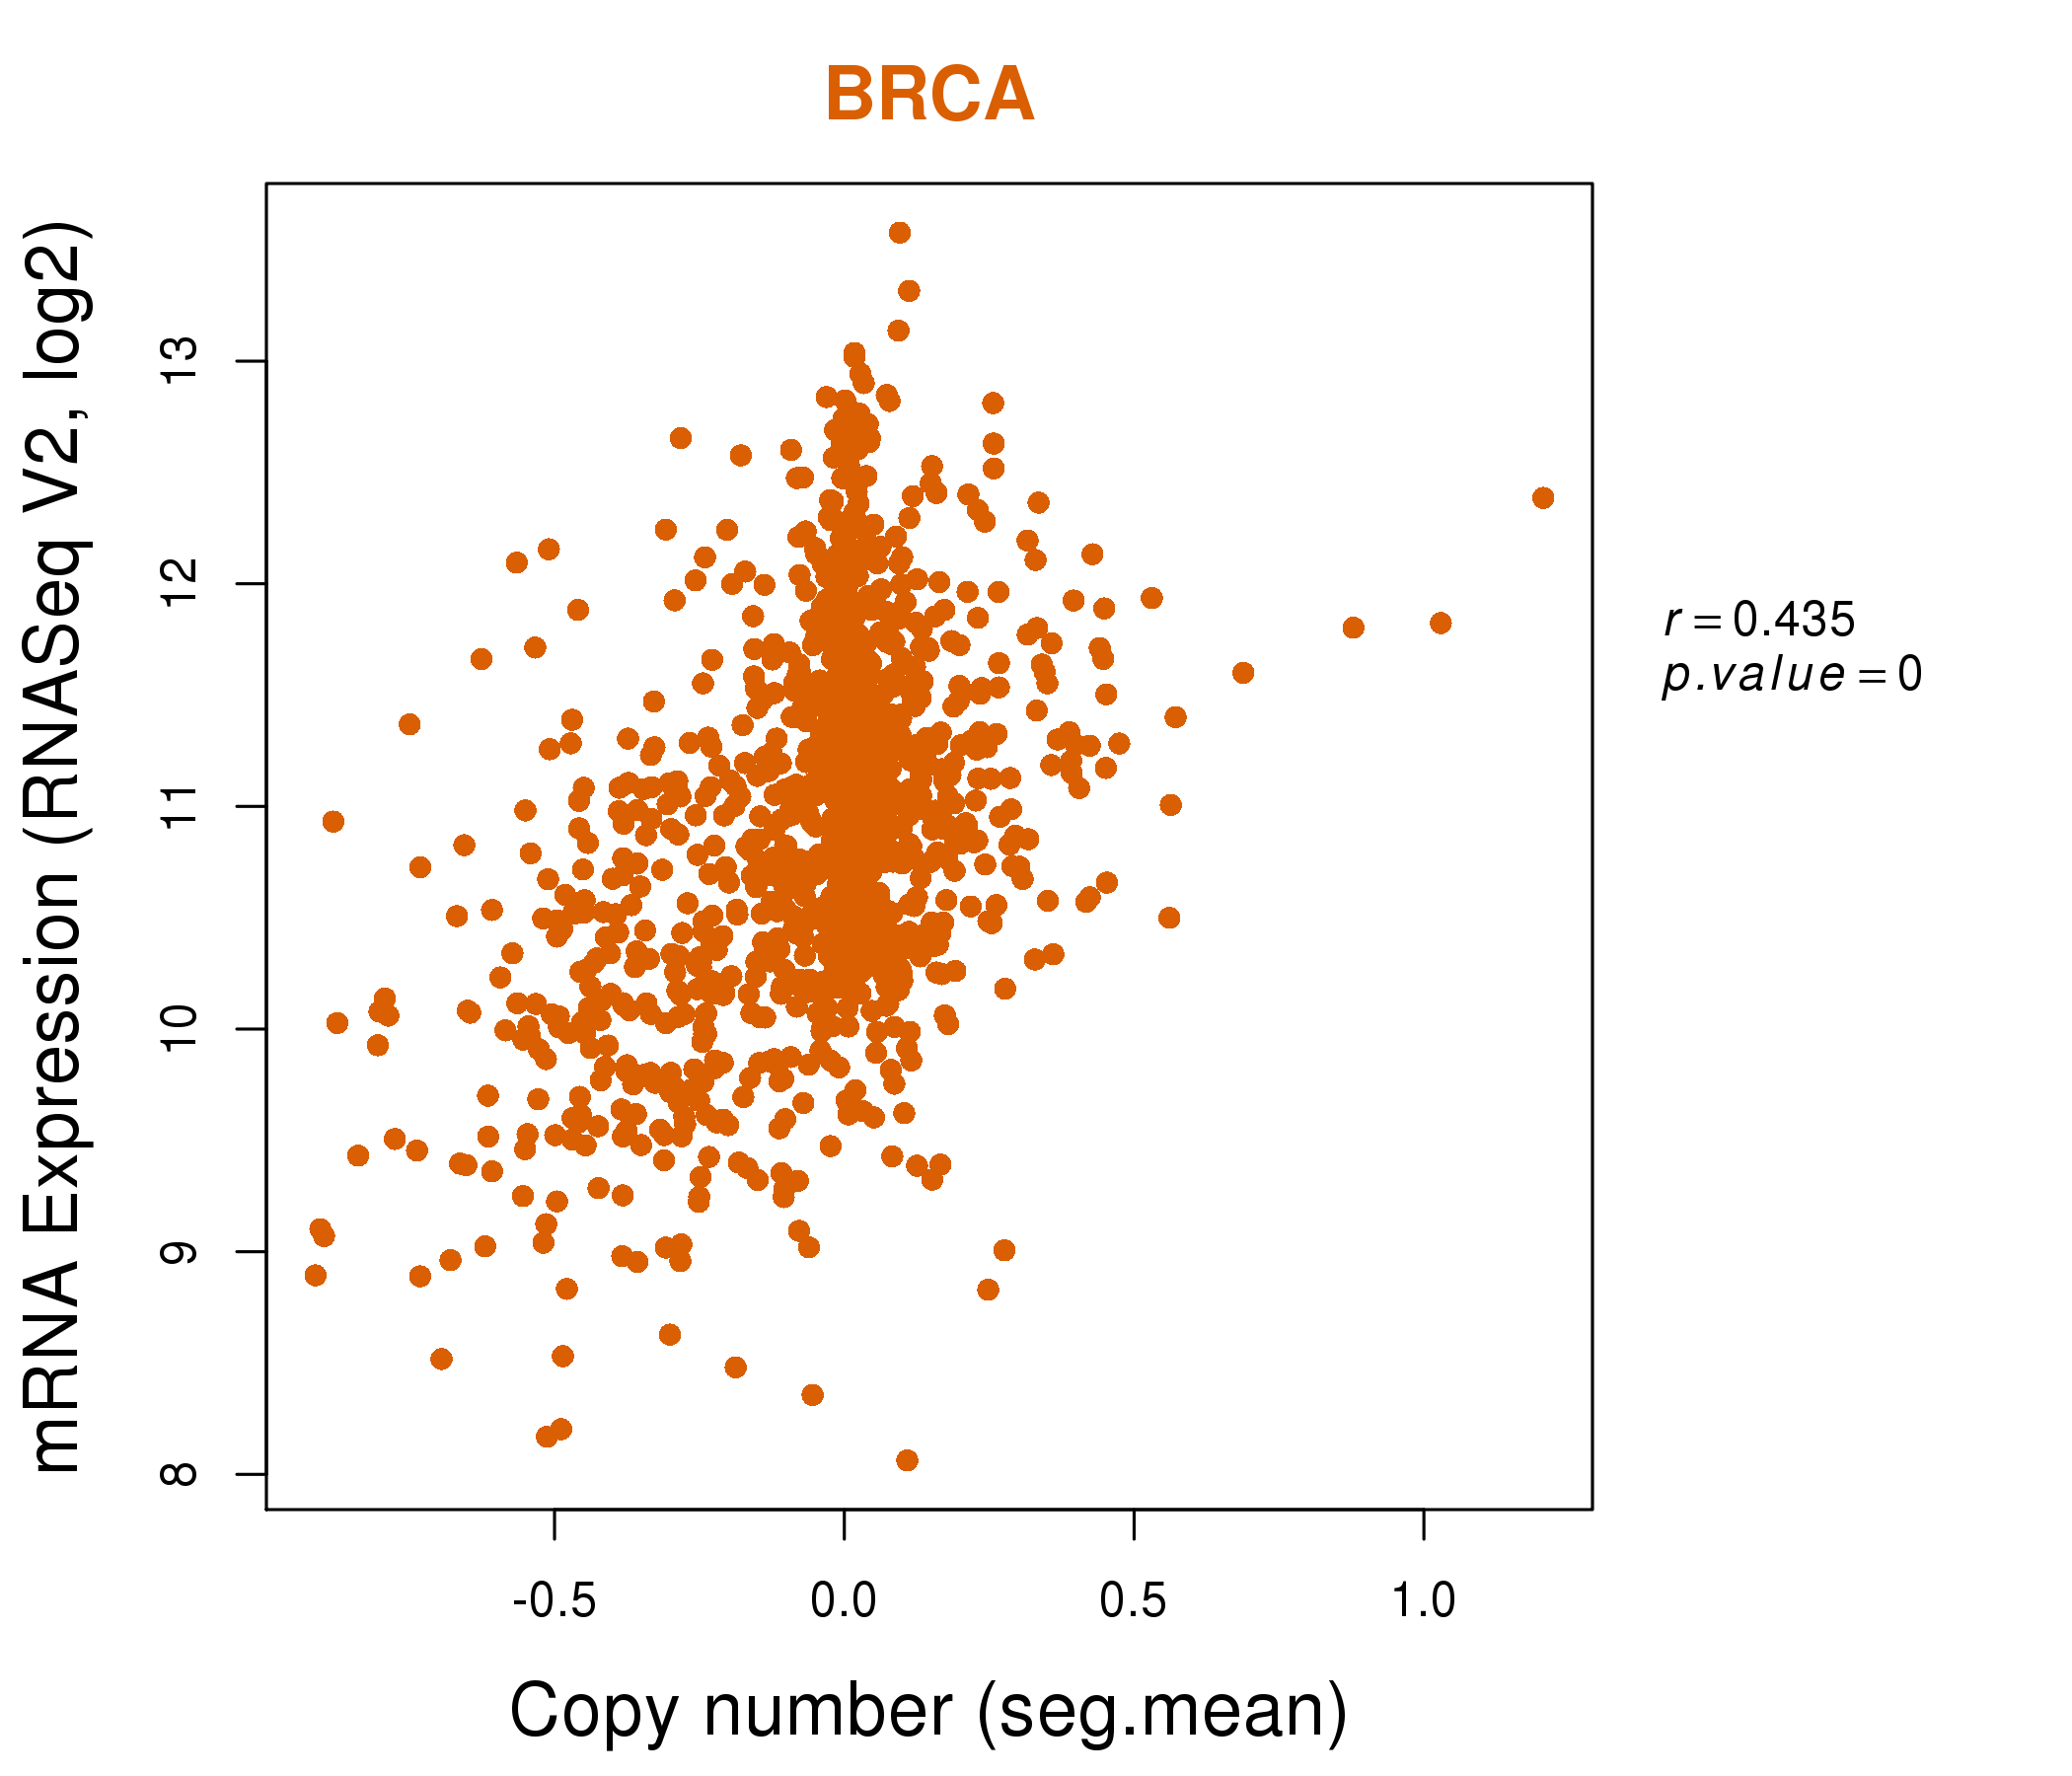
| * This plots show the correlation between CNV and gene expression. |
: Open all plots for all cancer types
 |
|
 |
|

| Top |
| Gene-Gene Network Information |
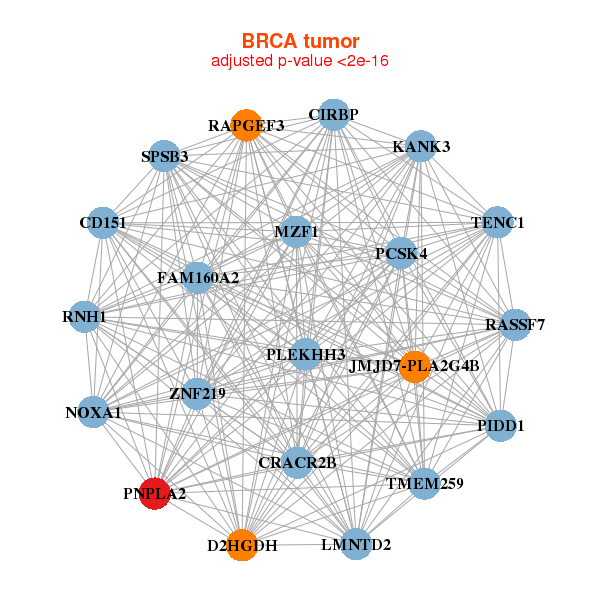
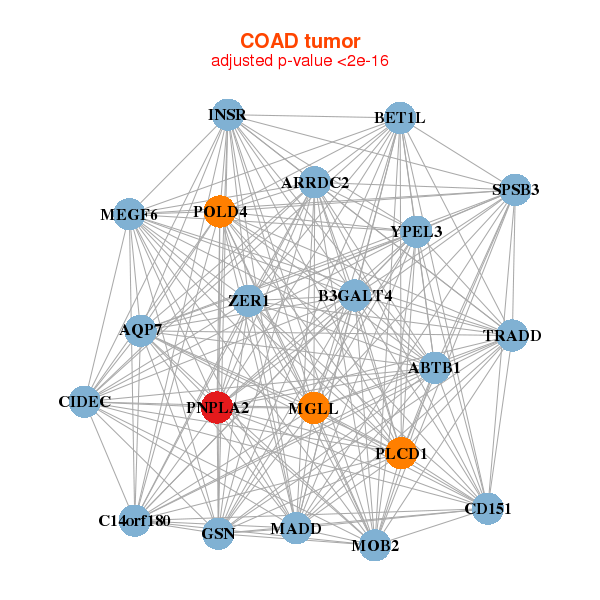
| * Co-Expression network figures were drawn using R package igraph. Only the top 20 genes with the highest correlations were shown. Red circle: input gene, orange circle: cell metabolism gene, sky circle: other gene |
: Open all plots for all cancer types
 |
|
| LMNTD2,TMEM259,CD151,CIRBP,D2HGDH,CRACR2B,FAM160A2, JMJD7-PLA2G4B,KANK3,PIDD1,MZF1,NOXA1,PCSK4,PLEKHH3, PNPLA2,RAPGEF3,RASSF7,RNH1,SPSB3,TENC1,ZNF219 | ABHD15,ACAA2,ACACB,AGPAT2,ALDH2,AQP7,ADIRF, FAM213A,CAMK1,CEBPA,CIDEC,CSPG4,FAH,HEPN1, LIPE,MLXIPL,PLA2G16,PNPLA2,RDH5,TMEM132C,TYRO3 |
 |
|
| ABTB1,AQP7,ARRDC2,B3GALT4,BET1L,C14orf180,CD151, CIDEC,GSN,INSR,MADD,MEGF6,MGLL,MOB2, PLCD1,PNPLA2,POLD4,SPSB3,TRADD,YPEL3,ZER1 | AGPAT3,ATG9A,C1orf106,CTSD,EPN1,EPS8L2,ESPN, FTH1,FTH1P3,HECTD3,KIAA2013,LOC151534,PIGS,PNPLA2, SLC9A3R1,SPINT1,STARD3,TICAM1,TMEM175,TNIP1,TOM1 |

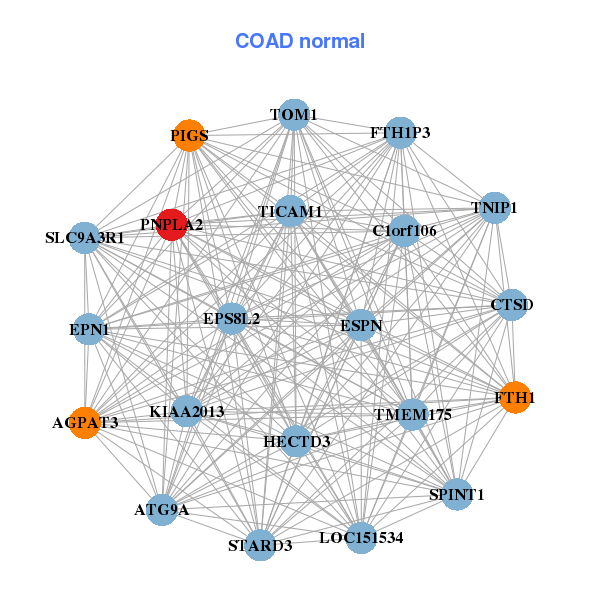
| * Co-Expression network figures were drawn using R package igraph. Only the top 20 genes with the highest correlations were shown. Red circle: input gene, orange circle: cell metabolism gene, sky circle: other gene |
: Open all plots for all cancer types
| Top |
: Open all interacting genes' information including KEGG pathway for all interacting genes from DAVID
| Top |
| Pharmacological Information for PNPLA2 |
| There's no related Drug. |
| Top |
| Cross referenced IDs for PNPLA2 |
| * We obtained these cross-references from Uniprot database. It covers 150 different DBs, 18 categories. http://www.uniprot.org/help/cross_references_section |
: Open all cross reference information
|
Copyright © 2016-Present - The Univsersity of Texas Health Science Center at Houston @ |