|
||||||||||||||||||||||||||||||||||||||||||||||||||||||||||||||||||||||||||||||||||||||||||||||||||||||||||||||||||||||||||||||||||||||||||||||||||||||||||||||||||||||||||||||||||||||||||||||||||||||||||||||||||||||||||||||||||||||||||||||||||||||||||||||||||||||||||||||||||||||||||||||||||||||||||||||||||||||||||
| |
| Phenotypic Information (metabolism pathway, cancer, disease, phenome) |
| |
| |
| Gene-Gene Network Information: Co-Expression Network, Interacting Genes & KEGG |
| |
|


| Gene Summary for PSMD8 |
| Basic gene info. | Gene symbol | PSMD8 |
| Gene name | proteasome (prosome, macropain) 26S subunit, non-ATPase, 8 | |
| Synonyms | HEL-S-91n|HIP6|HYPF|Nin1p|Rpn12|S14|p31 | |
| Cytomap | UCSC genome browser: 19q13.2 | |
| Genomic location | chr19 :38865189-38874464 | |
| Type of gene | protein-coding | |
| RefGenes | NM_002812.4, | |
| Ensembl id | ENSG00000099341 | |
| Description | 26S proteasome non-ATPase regulatory subunit 826S proteasome regulatory subunit RPN1226S proteasome regulatory subunit S1426S proteasome regulatory subunit p31epididymis secretory sperm binding protein Li 91n | |
| Modification date | 20141207 | |
| dbXrefs | HGNC : HGNC | |
| Ensembl : ENSG00000099341 | ||
| HPRD : 10171 | ||
| Vega : OTTHUMG00000150691 | ||
| Protein | UniProt: go to UniProt's Cross Reference DB Table | |
| Expression | CleanEX: HS_PSMD8 | |
| BioGPS: 5714 | ||
| Gene Expression Atlas: ENSG00000099341 | ||
| The Human Protein Atlas: ENSG00000099341 | ||
| Pathway | NCI Pathway Interaction Database: PSMD8 | |
| KEGG: PSMD8 | ||
| REACTOME: PSMD8 | ||
| ConsensusPathDB | ||
| Pathway Commons: PSMD8 | ||
| Metabolism | MetaCyc: PSMD8 | |
| HUMANCyc: PSMD8 | ||
| Regulation | Ensembl's Regulation: ENSG00000099341 | |
| miRBase: chr19 :38,865,189-38,874,464 | ||
| TargetScan: NM_002812 | ||
| cisRED: ENSG00000099341 | ||
| Context | iHOP: PSMD8 | |
| cancer metabolism search in PubMed: PSMD8 | ||
| UCL Cancer Institute: PSMD8 | ||
| Assigned class in ccmGDB | C | |
| Top |
| Phenotypic Information for PSMD8(metabolism pathway, cancer, disease, phenome) |
| Cancer | CGAP: PSMD8 |
| Familial Cancer Database: PSMD8 | |
| * This gene is included in those cancer gene databases. |
|
|
|
|
|
| . | ||||||||||||||||||||||||||||||||||||||||||||||||||||||||||||||||||||||||||||||||||||||||||||||||||||||||||||||||||||||||||||||||||||||||||||||||||||||||||||||||||||||||||||||||||||||||||||||||||||||||||||||||||||||||||||||||||||||||||||||||||||||||||||||||||||||||||||||||||||||||||||||||||||||||||||||||||||
Oncogene 1 | Significant driver gene in | |||||||||||||||||||||||||||||||||||||||||||||||||||||||||||||||||||||||||||||||||||||||||||||||||||||||||||||||||||||||||||||||||||||||||||||||||||||||||||||||||||||||||||||||||||||||||||||||||||||||||||||||||||||||||||||||||||||||||||||||||||||||||||||||||||||||||||||||||||||||||||||||||||||||||||||||||||||||||
| cf) number; DB name 1 Oncogene; http://nar.oxfordjournals.org/content/35/suppl_1/D721.long, 2 Tumor Suppressor gene; https://bioinfo.uth.edu/TSGene/, 3 Cancer Gene Census; http://www.nature.com/nrc/journal/v4/n3/abs/nrc1299.html, 4 CancerGenes; http://nar.oxfordjournals.org/content/35/suppl_1/D721.long, 5 Network of Cancer Gene; http://ncg.kcl.ac.uk/index.php, 1Therapeutic Vulnerabilities in Cancer; http://cbio.mskcc.org/cancergenomics/statius/ |
| REACTOME_METABOLISM_OF_AMINO_ACIDS_AND_DERIVATIVES REACTOME_METABOLISM_OF_MRNA REACTOME_METABOLISM_OF_RNA | |
| OMIM | |
| Orphanet | |
| Disease | KEGG Disease: PSMD8 |
| MedGen: PSMD8 (Human Medical Genetics with Condition) | |
| ClinVar: PSMD8 | |
| Phenotype | MGI: PSMD8 (International Mouse Phenotyping Consortium) |
| PhenomicDB: PSMD8 | |
| Mutations for PSMD8 |
| * Under tables are showing count per each tissue to give us broad intuition about tissue specific mutation patterns.You can go to the detailed page for each mutation database's web site. |
| - Statistics for Tissue and Mutation type | Top |
 |
| - For Inter-chromosomal Variations |
| There's no inter-chromosomal structural variation. |
| - For Intra-chromosomal Variations |
| * Intra-chromosomal variantions includes 'intrachromosomal amplicon to amplicon', 'intrachromosomal amplicon to non-amplified dna', 'intrachromosomal deletion', 'intrachromosomal fold-back inversion', 'intrachromosomal inversion', 'intrachromosomal tandem duplication', 'Intrachromosomal unknown type', 'intrachromosomal with inverted orientation', 'intrachromosomal with non-inverted orientation'. |
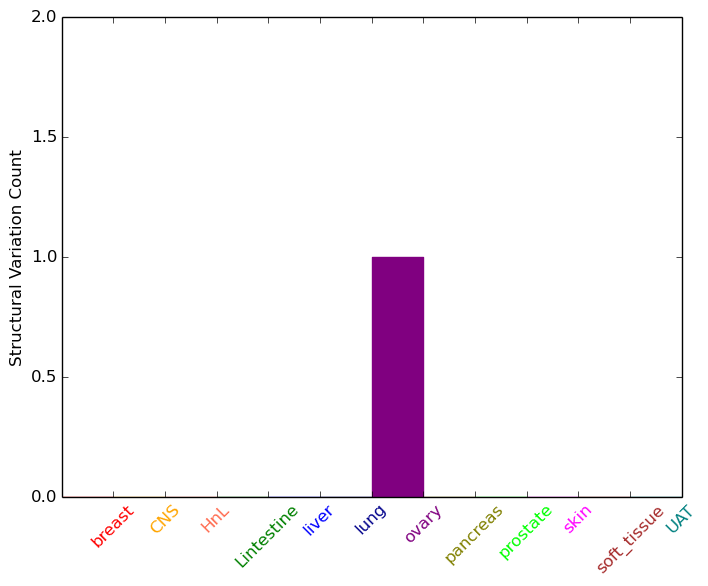 |
| Sample | Symbol_a | Chr_a | Start_a | End_a | Symbol_b | Chr_b | Start_b | End_b |
| ovary | PSMD8 | chr19 | 38870129 | 38870149 | PSMD8 | chr19 | 38872296 | 38872316 |
| cf) Tissue number; Tissue name (1;Breast, 2;Central_nervous_system, 3;Haematopoietic_and_lymphoid_tissue, 4;Large_intestine, 5;Liver, 6;Lung, 7;Ovary, 8;Pancreas, 9;Prostate, 10;Skin, 11;Soft_tissue, 12;Upper_aerodigestive_tract) |
| * From mRNA Sanger sequences, Chitars2.0 arranged chimeric transcripts. This table shows PSMD8 related fusion information. |
| ID | Head Gene | Tail Gene | Accession | Gene_a | qStart_a | qEnd_a | Chromosome_a | tStart_a | tEnd_a | Gene_a | qStart_a | qEnd_a | Chromosome_a | tStart_a | tEnd_a |
| DW427896 | PSMD8 | 17 | 109 | 19 | 38866836 | 38867047 | HDLBP | 110 | 277 | 2 | 242195674 | 242196041 | |
| AA437370 | PSMD8 | 1 | 63 | 19 | 38874402 | 38874464 | SLC35B2 | 53 | 445 | 6 | 44222415 | 44222808 | |
| BF093758 | ITGAL | 1 | 412 | 16 | 30518119 | 30525166 | PSMD8 | 410 | 497 | 19 | 38866122 | 38866209 | |
| AX794816 | ITGAL | 1 | 412 | 16 | 30518119 | 30525166 | PSMD8 | 410 | 497 | 19 | 38866122 | 38866209 | |
| BC071826 | ELF2 | 45 | 447 | 4 | 140035878 | 140036280 | PSMD8 | 448 | 1392 | 19 | 38865435 | 38874115 | |
| Top |
| Mutation type/ Tissue ID | brca | cns | cerv | endome | haematopo | kidn | Lintest | liver | lung | ns | ovary | pancre | prost | skin | stoma | thyro | urina | |||
| Total # sample | 1 | 1 | ||||||||||||||||||
| GAIN (# sample) | 1 | 1 | ||||||||||||||||||
| LOSS (# sample) |
| cf) Tissue ID; Tissue type (1; Breast, 2; Central_nervous_system, 3; Cervix, 4; Endometrium, 5; Haematopoietic_and_lymphoid_tissue, 6; Kidney, 7; Large_intestine, 8; Liver, 9; Lung, 10; NS, 11; Ovary, 12; Pancreas, 13; Prostate, 14; Skin, 15; Stomach, 16; Thyroid, 17; Urinary_tract) |
| Top |
|
 |
| Top |
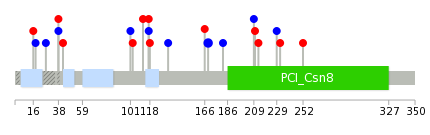
| Stat. for Non-Synonymous SNVs (# total SNVs=10) | (# total SNVs=9) |
 |  |
(# total SNVs=0) | (# total SNVs=1) |
 |
| Top |
| * When you move the cursor on each content, you can see more deailed mutation information on the Tooltip. Those are primary_site,primary_histology,mutation(aa),pubmedID. |
| GRCh37 position | Mutation(aa) | Unique sampleID count |
| chr19:38871622-38871622 | p.I169I | 2 |
| chr19:38866832-38866832 | p.T38T | 1 |
| chr19:38866844-38866844 | p.K42N | 1 |
| chr19:38871643-38871643 | p.? | 1 |
| chr19:38867066-38867067 | p.Q77fs*8 | 1 |
| chr19:38872778-38872778 | p.I182I | 1 |
| chr19:38869925-38869925 | p.L101L | 1 |
| chr19:38872859-38872859 | p.Y209Y | 1 |
| chr19:38869929-38869929 | p.L103I | 1 |
| chr19:38872860-38872860 | p.A210T | 1 |
| Top |
|
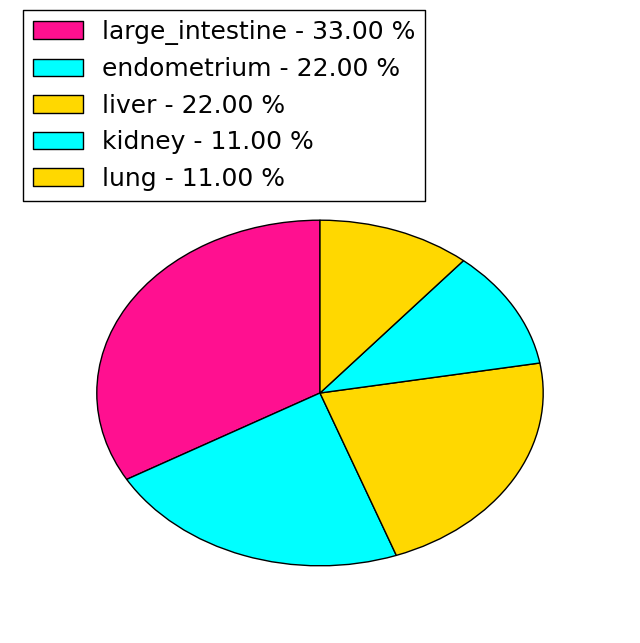
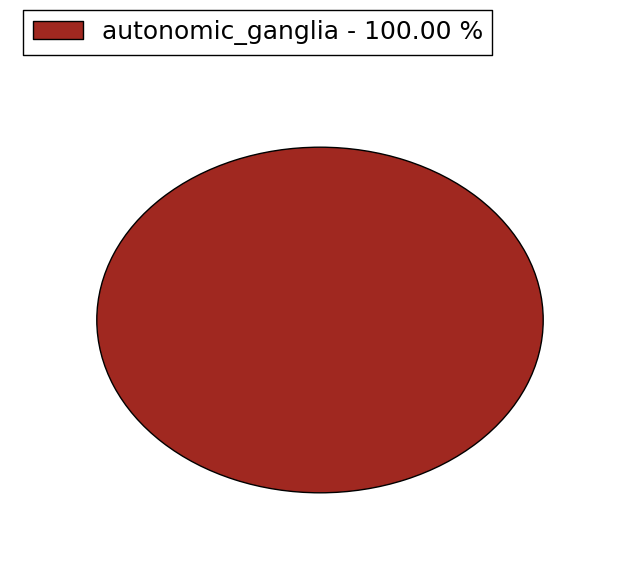
 |
| Point Mutation/ Tissue ID | 1 | 2 | 3 | 4 | 5 | 6 | 7 | 8 | 9 | 10 | 11 | 12 | 13 | 14 | 15 | 16 | 17 | 18 | 19 | 20 |
| # sample | 1 | 3 | 1 | 1 | 3 | 3 | ||||||||||||||
| # mutation | 1 | 2 | 1 | 1 | 3 | 3 | ||||||||||||||
| nonsynonymous SNV | 1 | 1 | 1 | 2 | 1 | |||||||||||||||
| synonymous SNV | 1 | 1 | 1 | 2 |
| cf) Tissue ID; Tissue type (1; BLCA[Bladder Urothelial Carcinoma], 2; BRCA[Breast invasive carcinoma], 3; CESC[Cervical squamous cell carcinoma and endocervical adenocarcinoma], 4; COAD[Colon adenocarcinoma], 5; GBM[Glioblastoma multiforme], 6; Glioma Low Grade, 7; HNSC[Head and Neck squamous cell carcinoma], 8; KICH[Kidney Chromophobe], 9; KIRC[Kidney renal clear cell carcinoma], 10; KIRP[Kidney renal papillary cell carcinoma], 11; LAML[Acute Myeloid Leukemia], 12; LUAD[Lung adenocarcinoma], 13; LUSC[Lung squamous cell carcinoma], 14; OV[Ovarian serous cystadenocarcinoma ], 15; PAAD[Pancreatic adenocarcinoma], 16; PRAD[Prostate adenocarcinoma], 17; SKCM[Skin Cutaneous Melanoma], 18:STAD[Stomach adenocarcinoma], 19:THCA[Thyroid carcinoma], 20:UCEC[Uterine Corpus Endometrial Carcinoma]) |
| Top |
| * We represented just top 10 SNVs. When you move the cursor on each content, you can see more deailed mutation information on the Tooltip. Those are primary_site, primary_histology, mutation(aa), pubmedID. |
| Genomic Position | Mutation(aa) | Unique sampleID count |
| chr19:38869973 | p.T210T | 2 |
| chr19:38871607 | p.T257T | 1 |
| chr19:38872859 | p.Y302Y | 1 |
| chr19:38872860 | p.A303T | 1 |
| chr19:38873894 | p.R306Q | 1 |
| chr19:38873943 | p.Q322Q | 1 |
| chr19:38874011 | p.Q345R | 1 |
| chr19:38865566 | p.L109I | 1 |
| chr19:38866844 | p.K135N | 1 |
| chr19:38869925 | p.L194L | 1 |
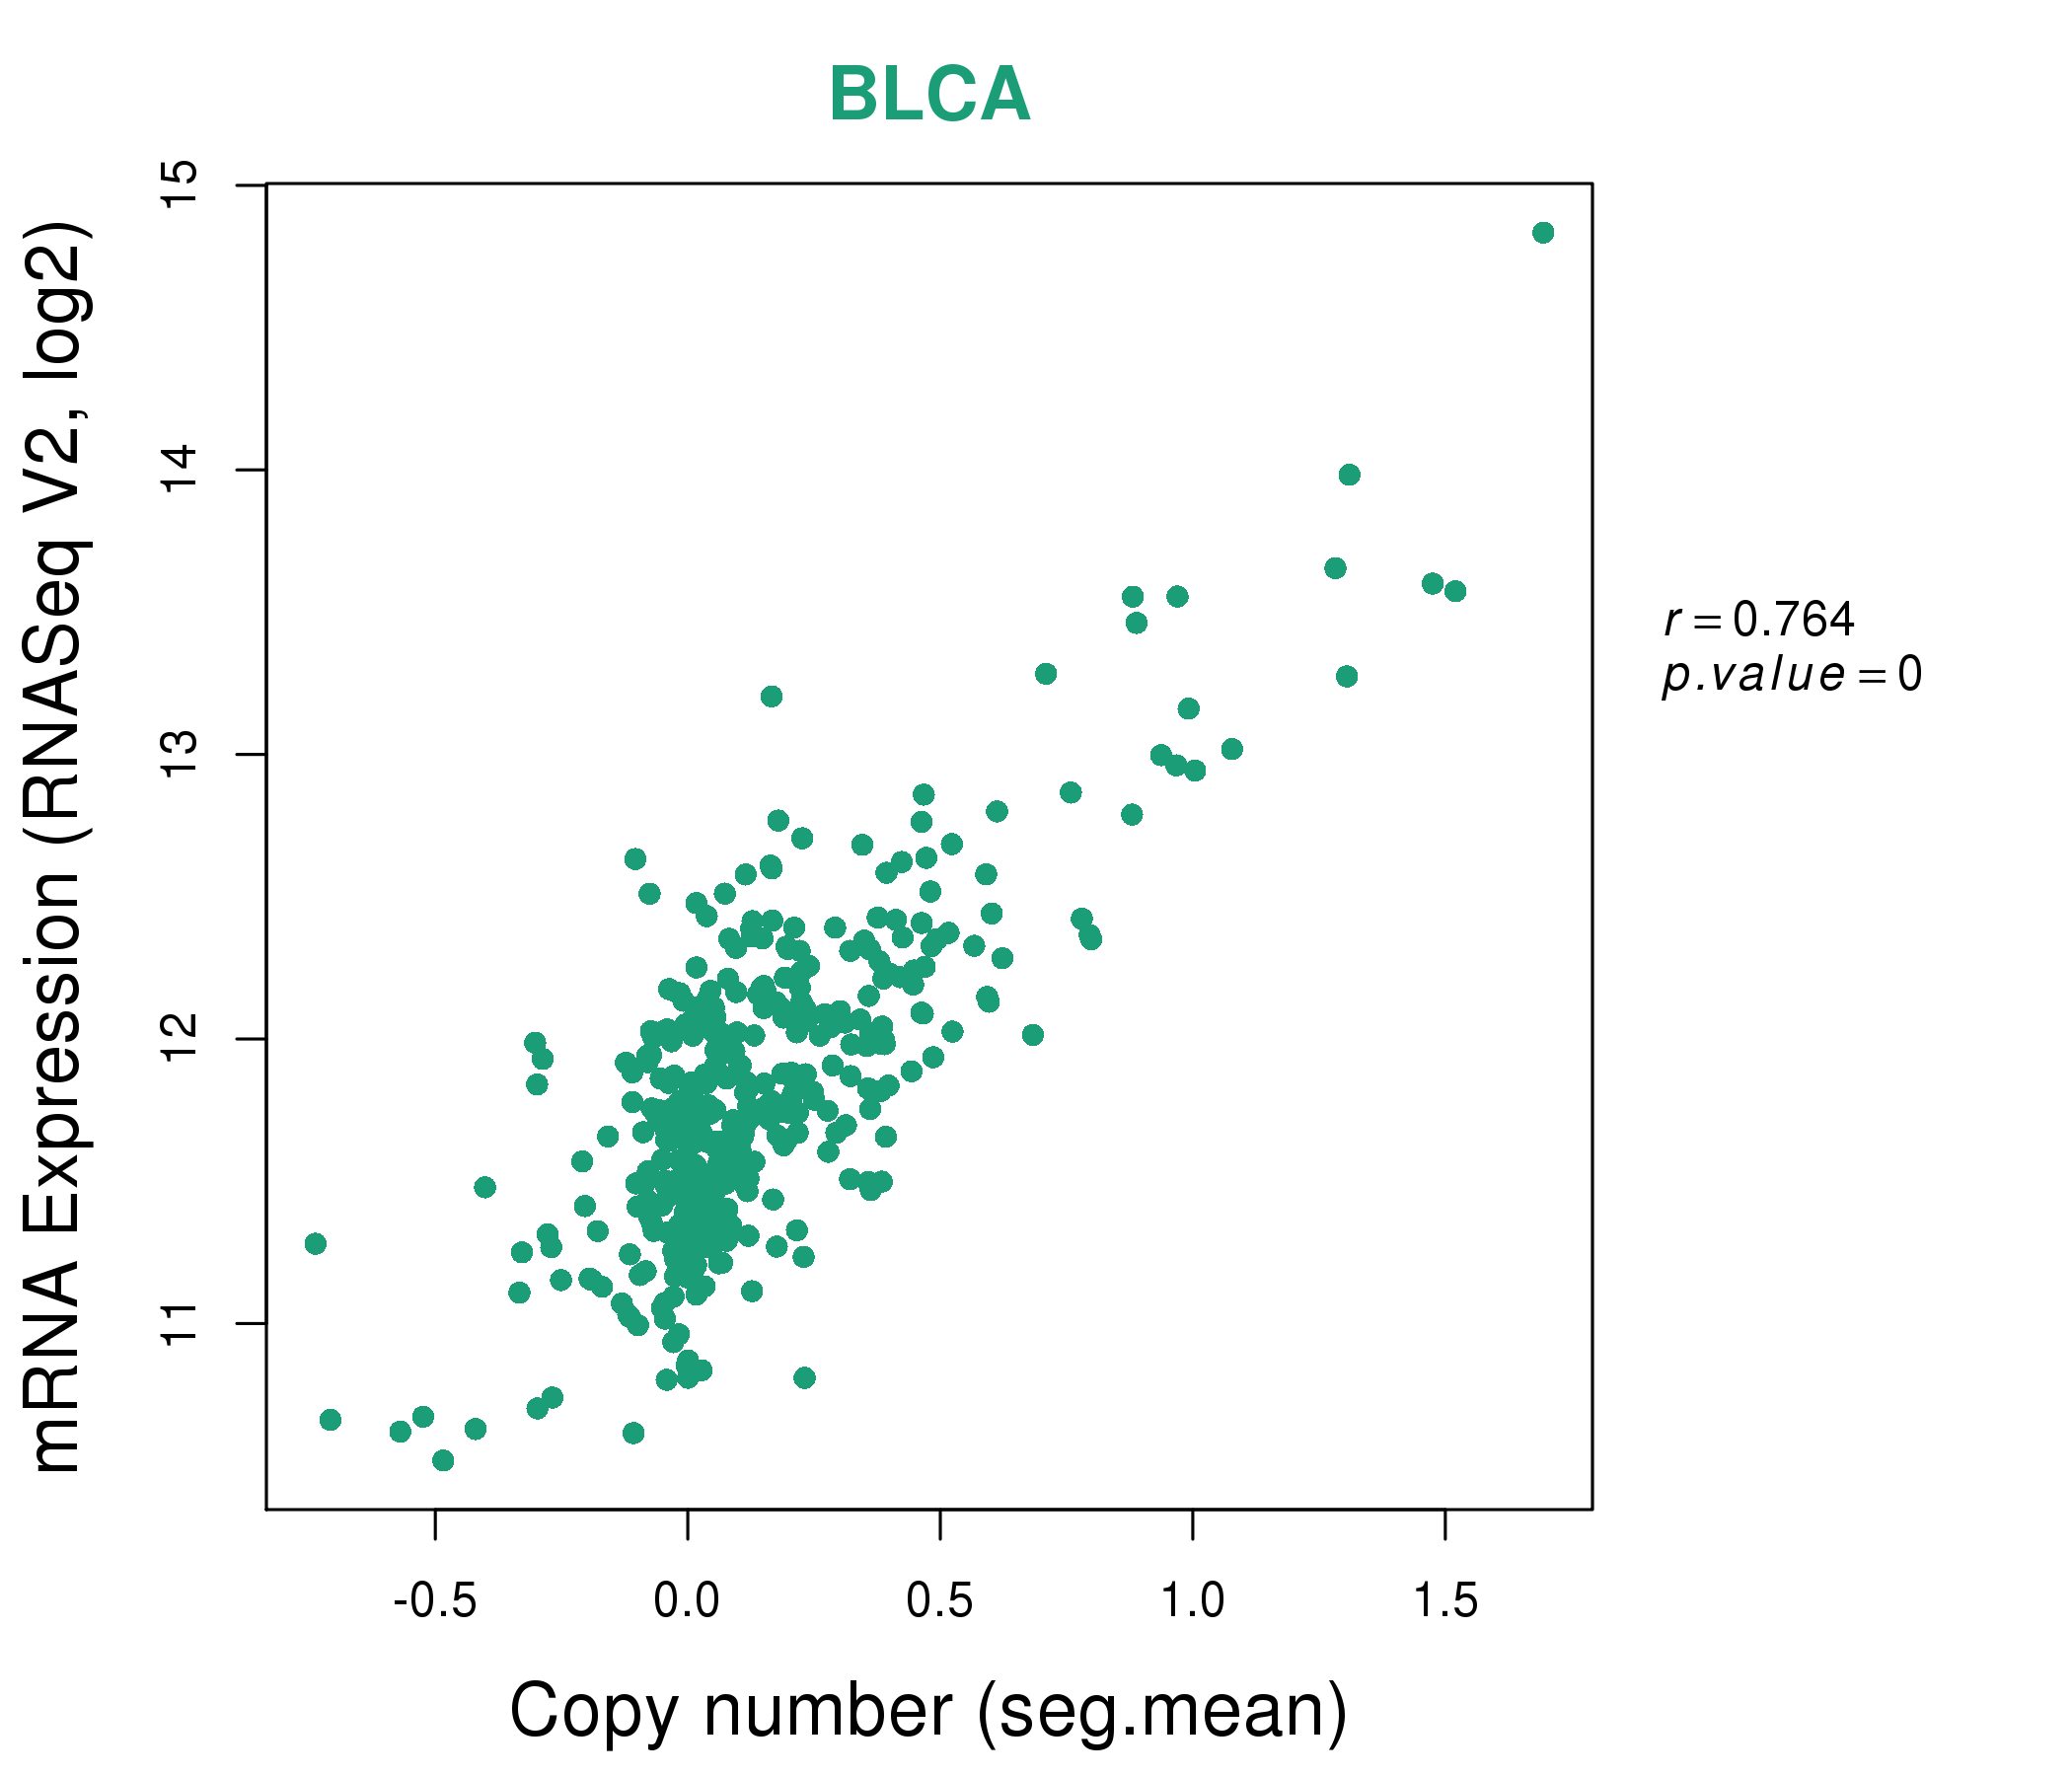
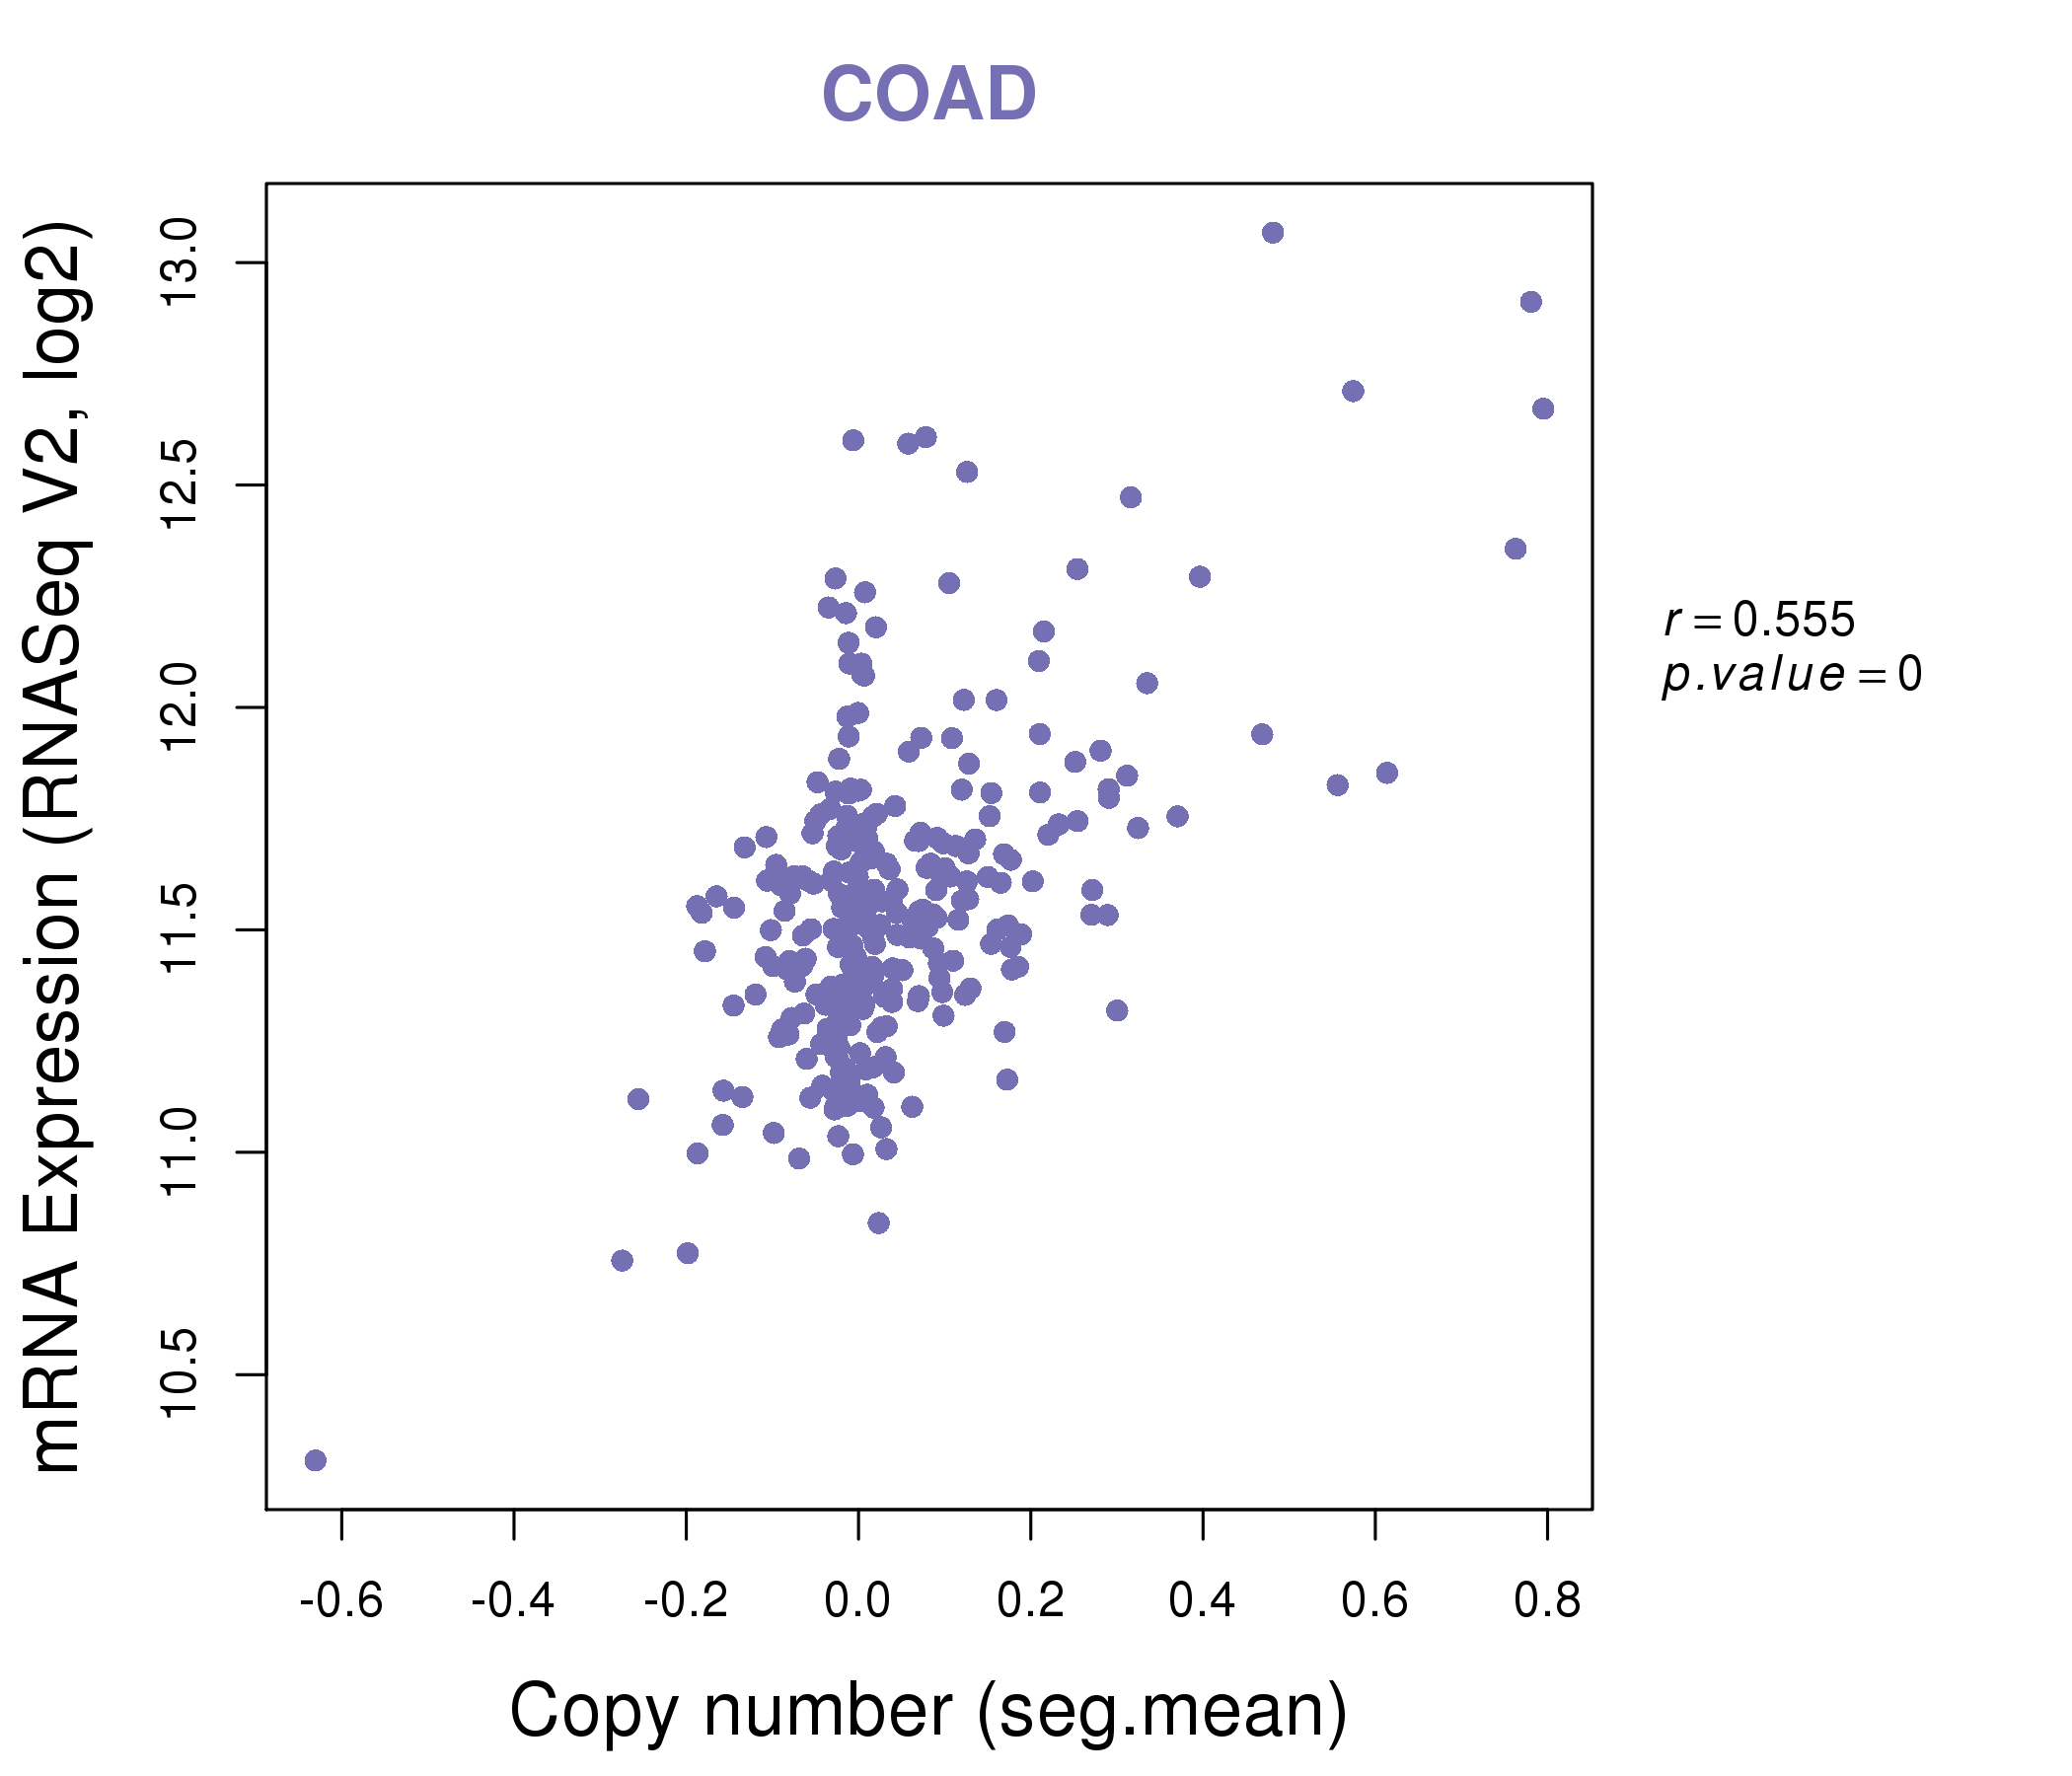
| * Copy number data were extracted from TCGA using R package TCGA-Assembler. The URLs of all public data files on TCGA DCC data server were gathered on Jan-05-2015. Function ProcessCNAData in TCGA-Assembler package was used to obtain gene-level copy number value which is calculated as the average copy number of the genomic region of a gene. |
 |
| cf) Tissue ID[Tissue type]: BLCA[Bladder Urothelial Carcinoma], BRCA[Breast invasive carcinoma], CESC[Cervical squamous cell carcinoma and endocervical adenocarcinoma], COAD[Colon adenocarcinoma], GBM[Glioblastoma multiforme], Glioma Low Grade, HNSC[Head and Neck squamous cell carcinoma], KICH[Kidney Chromophobe], KIRC[Kidney renal clear cell carcinoma], KIRP[Kidney renal papillary cell carcinoma], LAML[Acute Myeloid Leukemia], LUAD[Lung adenocarcinoma], LUSC[Lung squamous cell carcinoma], OV[Ovarian serous cystadenocarcinoma ], PAAD[Pancreatic adenocarcinoma], PRAD[Prostate adenocarcinoma], SKCM[Skin Cutaneous Melanoma], STAD[Stomach adenocarcinoma], THCA[Thyroid carcinoma], UCEC[Uterine Corpus Endometrial Carcinoma] |
| Top |
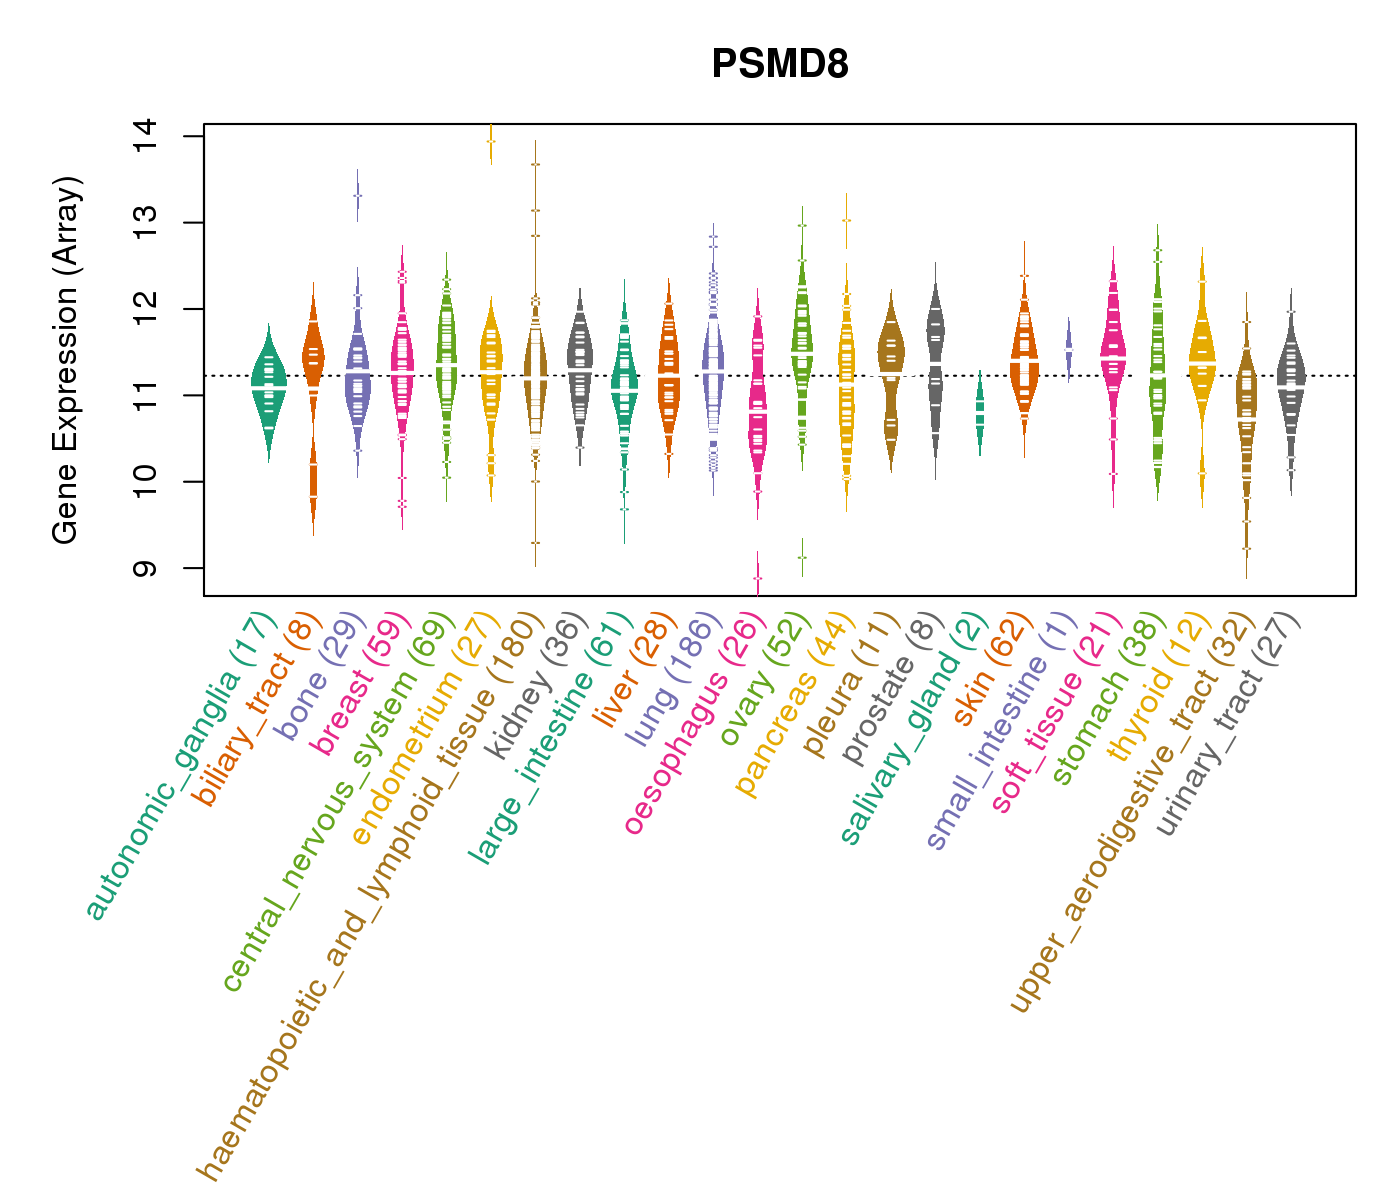
| Gene Expression for PSMD8 |
| * CCLE gene expression data were extracted from CCLE_Expression_Entrez_2012-10-18.res: Gene-centric RMA-normalized mRNA expression data. |
 |
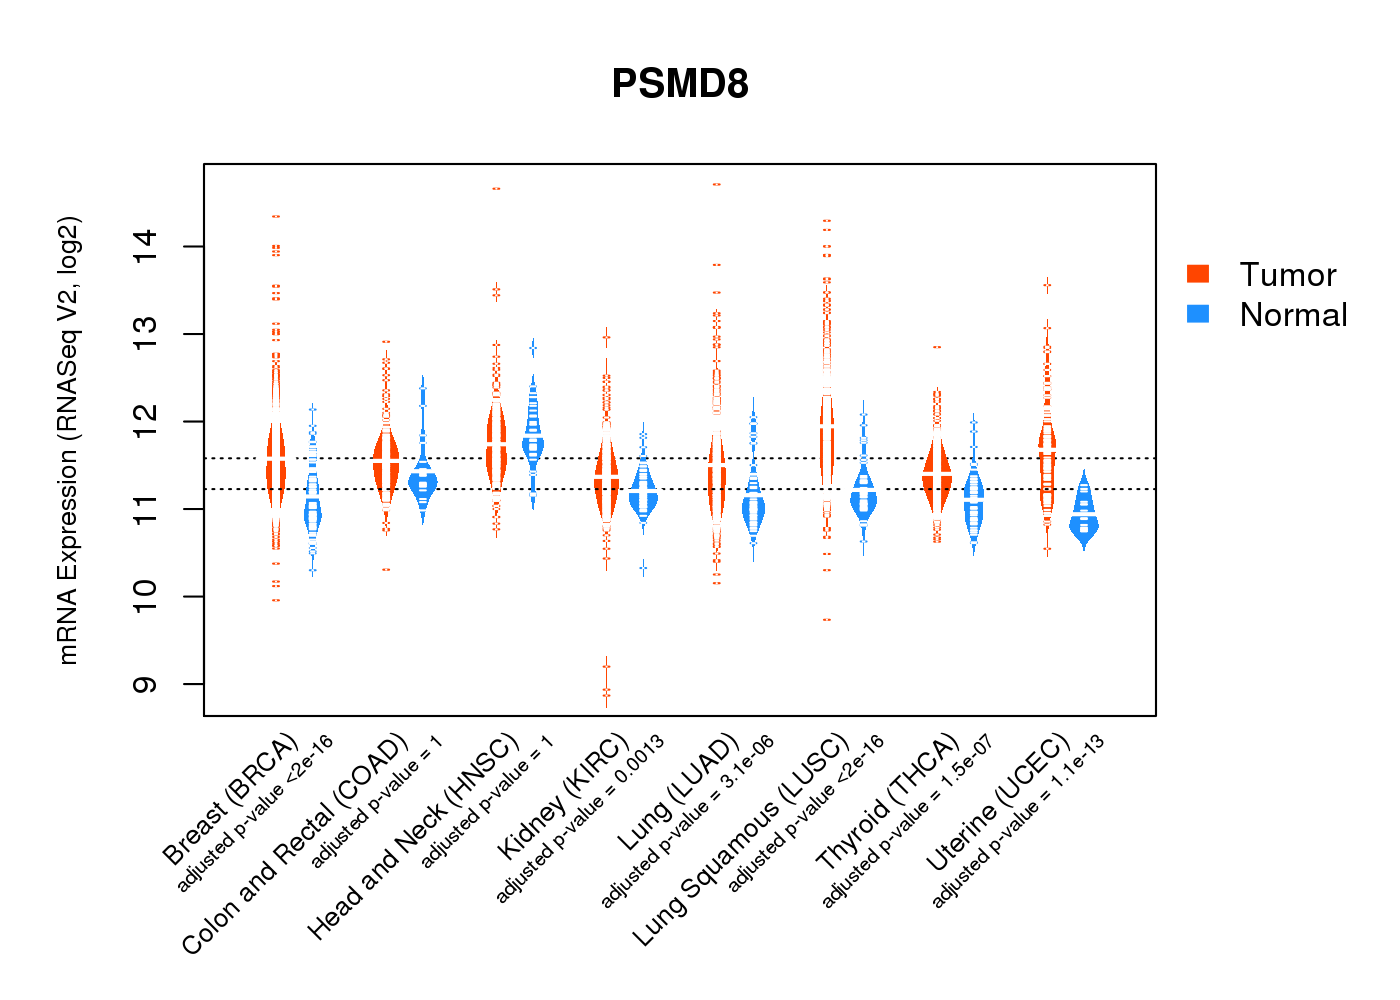
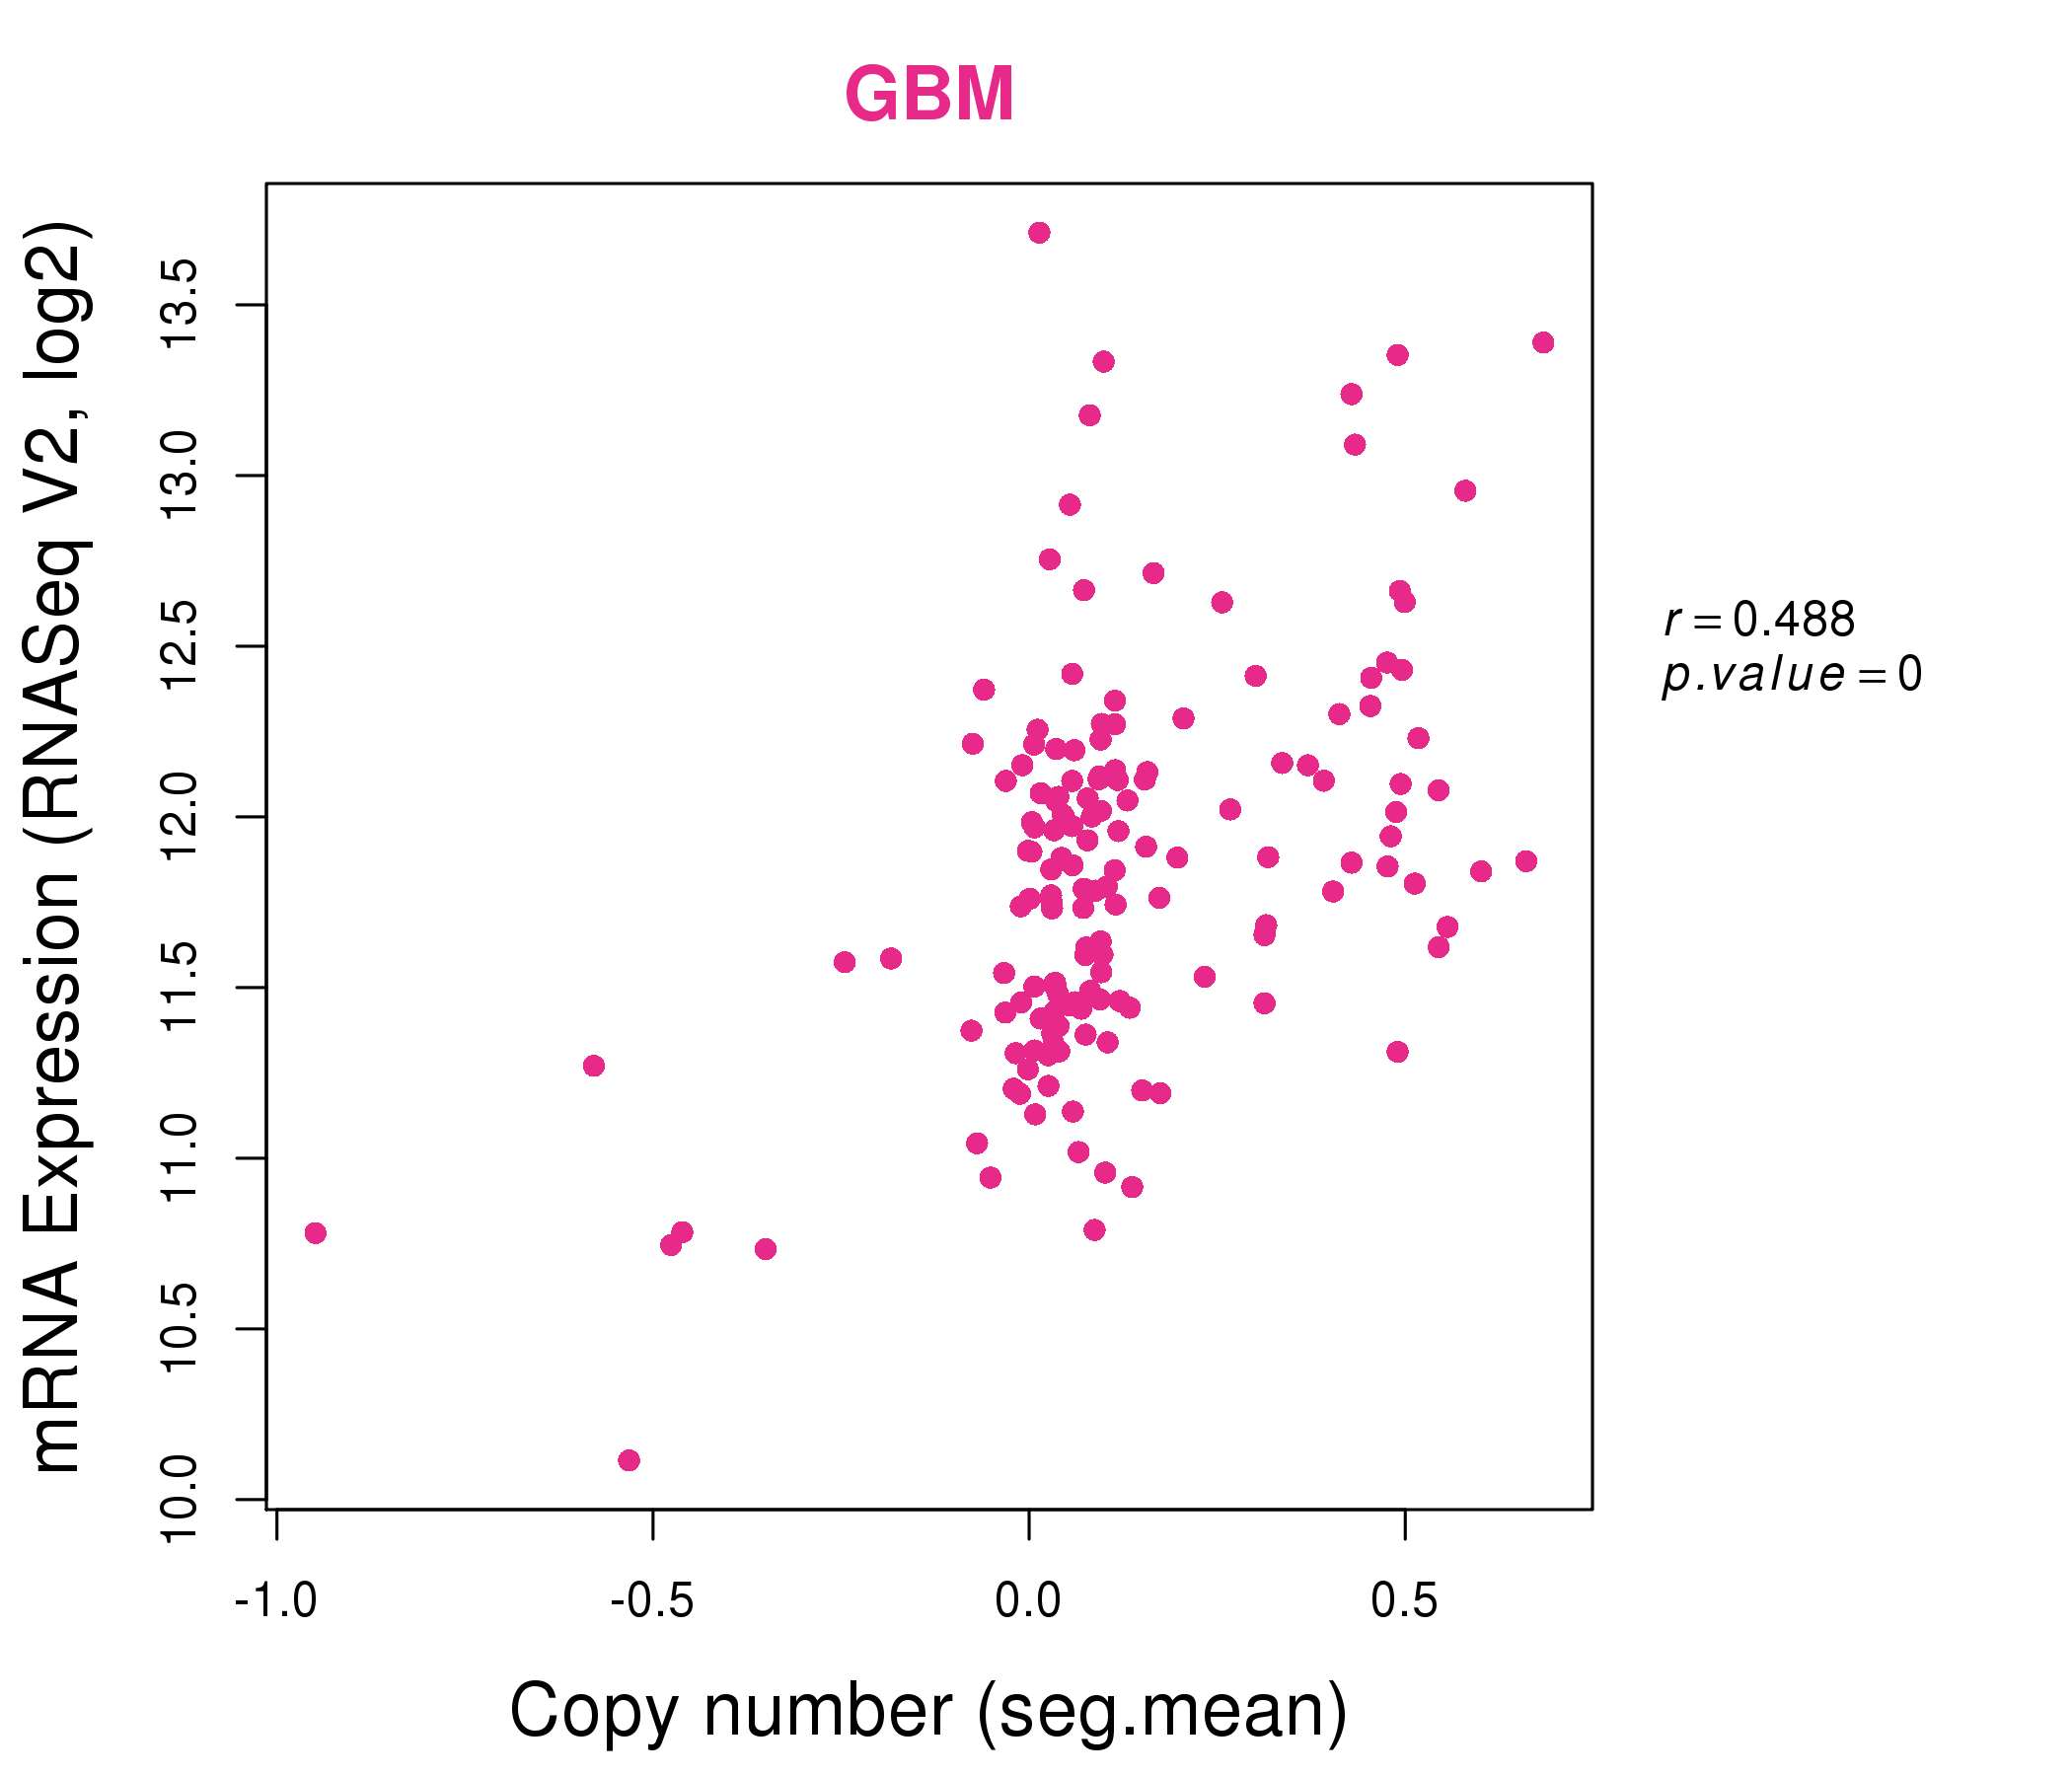
| * Normalized gene expression data of RNASeqV2 was extracted from TCGA using R package TCGA-Assembler. The URLs of all public data files on TCGA DCC data server were gathered at Jan-05-2015. Only eight cancer types have enough normal control samples for differential expression analysis. (t test, adjusted p<0.05 (using Benjamini-Hochberg FDR)) |
 |
| Top |
| * This plots show the correlation between CNV and gene expression. |
: Open all plots for all cancer types
 |
|
 |
|

| Top |
| Gene-Gene Network Information |
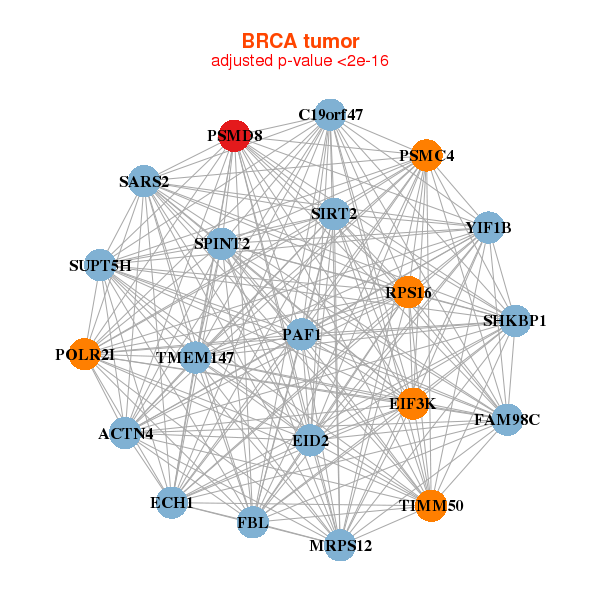
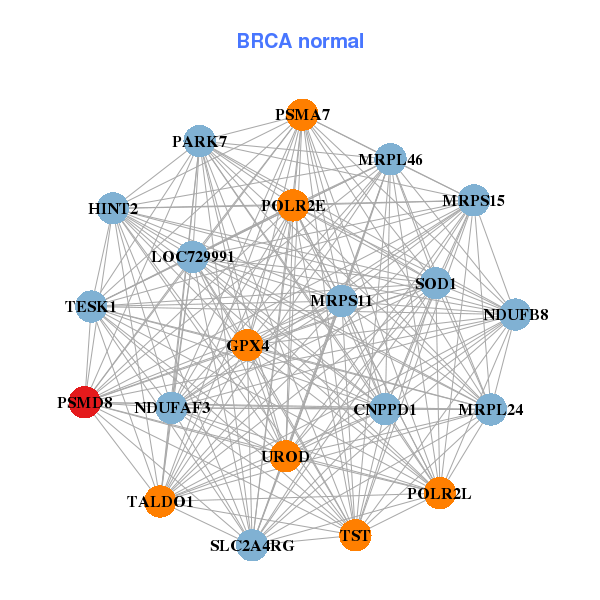
| * Co-Expression network figures were drawn using R package igraph. Only the top 20 genes with the highest correlations were shown. Red circle: input gene, orange circle: cell metabolism gene, sky circle: other gene |
: Open all plots for all cancer types
 |
|
| ACTN4,C19orf47,ECH1,EID2,EIF3K,FAM98C,FBL, MRPS12,PAF1,POLR2I,PSMC4,PSMD8,RPS16,SARS2, SHKBP1,SIRT2,SPINT2,SUPT5H,TIMM50,TMEM147,YIF1B | CNPPD1,GPX4,HINT2,LOC729991,MRPL24,MRPL46,MRPS11, MRPS15,NDUFAF3,NDUFB8,PARK7,POLR2E,POLR2L,PSMA7, PSMD8,SLC2A4RG,SOD1,TALDO1,TESK1,TST,UROD |
 |
|
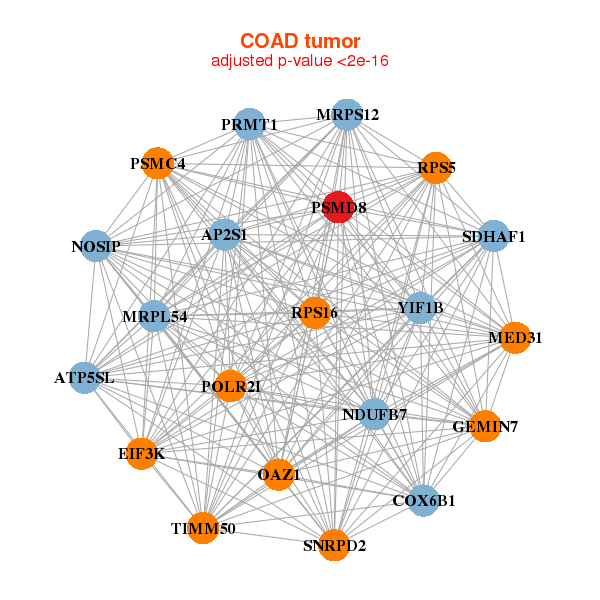
| AP2S1,ATP5SL,COX6B1,EIF3K,GEMIN7,MED31,MRPL54, MRPS12,NDUFB7,NOSIP,OAZ1,POLR2I,PRMT1,PSMC4, PSMD8,RPS16,RPS5,SDHAF1,SNRPD2,TIMM50,YIF1B | CHCHD2,CKLF,DAD1,HAX1,LAMTOR5,MRPL22,MRPL52, MYEOV2,NDUFA6,NDUFA7,NDUFB4,NDUFB6,PHF5A,POLR2F, PSMA7,PSMD8,PSMD9,RBX1,STOML2,TIMM8B,UFD1L |
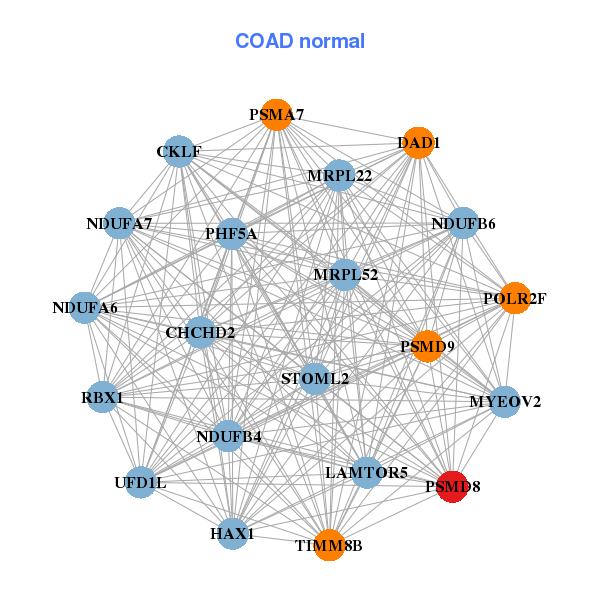
| * Co-Expression network figures were drawn using R package igraph. Only the top 20 genes with the highest correlations were shown. Red circle: input gene, orange circle: cell metabolism gene, sky circle: other gene |
: Open all plots for all cancer types
| Top |
: Open all interacting genes' information including KEGG pathway for all interacting genes from DAVID
| Top |
| Pharmacological Information for PSMD8 |
| There's no related Drug. |
| Top |
| Cross referenced IDs for PSMD8 |
| * We obtained these cross-references from Uniprot database. It covers 150 different DBs, 18 categories. http://www.uniprot.org/help/cross_references_section |
: Open all cross reference information
|
Copyright © 2016-Present - The Univsersity of Texas Health Science Center at Houston @ |