|
||||||||||||||||||||||||||||||||||||||||||||||||||||||||||||||||||||||||||||||||||||||||||||||||||||||||||||||||||||||||||||||||||||||||||||||||||||||||||||||||||||||||||||||||||||||||||||||||||||||||||||||||||||||||||||||||||||||||||||||||||||||||||||||||||||||||||||||||||||||||||||||||||||||||||||||||||||
| |
| Phenotypic Information (metabolism pathway, cancer, disease, phenome) |
| |
| |
| Gene-Gene Network Information: Co-Expression Network, Interacting Genes & KEGG |
| |
|


| Gene Summary for PSMD9 |
| Top |
| Phenotypic Information for PSMD9(metabolism pathway, cancer, disease, phenome) |
| Cancer | CGAP: PSMD9 |
| Familial Cancer Database: PSMD9 | |
| * This gene is included in those cancer gene databases. |
|
|
|
|
|
| . | ||||||||||||||||||||||||||||||||||||||||||||||||||||||||||||||||||||||||||||||||||||||||||||||||||||||||||||||||||||||||||||||||||||||||||||||||||||||||||||||||||||||||||||||||||||||||||||||||||||||||||||||||||||||||||||||||||||||||||||||||||||||||||||||||||||||||||||||||||||||||||||||||||||||||||||||
Oncogene 1 | Significant driver gene in | |||||||||||||||||||||||||||||||||||||||||||||||||||||||||||||||||||||||||||||||||||||||||||||||||||||||||||||||||||||||||||||||||||||||||||||||||||||||||||||||||||||||||||||||||||||||||||||||||||||||||||||||||||||||||||||||||||||||||||||||||||||||||||||||||||||||||||||||||||||||||||||||||||||||||||||||||||
| cf) number; DB name 1 Oncogene; http://nar.oxfordjournals.org/content/35/suppl_1/D721.long, 2 Tumor Suppressor gene; https://bioinfo.uth.edu/TSGene/, 3 Cancer Gene Census; http://www.nature.com/nrc/journal/v4/n3/abs/nrc1299.html, 4 CancerGenes; http://nar.oxfordjournals.org/content/35/suppl_1/D721.long, 5 Network of Cancer Gene; http://ncg.kcl.ac.uk/index.php, 1Therapeutic Vulnerabilities in Cancer; http://cbio.mskcc.org/cancergenomics/statius/ |
| REACTOME_METABOLISM_OF_AMINO_ACIDS_AND_DERIVATIVES REACTOME_METABOLISM_OF_MRNA REACTOME_METABOLISM_OF_RNA | |
| OMIM | |
| Orphanet | |
| Disease | KEGG Disease: PSMD9 |
| MedGen: PSMD9 (Human Medical Genetics with Condition) | |
| ClinVar: PSMD9 | |
| Phenotype | MGI: PSMD9 (International Mouse Phenotyping Consortium) |
| PhenomicDB: PSMD9 | |
| Mutations for PSMD9 |
| * Under tables are showing count per each tissue to give us broad intuition about tissue specific mutation patterns.You can go to the detailed page for each mutation database's web site. |
| There's no structural variation information in COSMIC data for this gene. |
| * From mRNA Sanger sequences, Chitars2.0 arranged chimeric transcripts. This table shows PSMD9 related fusion information. |
| ID | Head Gene | Tail Gene | Accession | Gene_a | qStart_a | qEnd_a | Chromosome_a | tStart_a | tEnd_a | Gene_a | qStart_a | qEnd_a | Chromosome_a | tStart_a | tEnd_a |
| Top |
| Mutation type/ Tissue ID | brca | cns | cerv | endome | haematopo | kidn | Lintest | liver | lung | ns | ovary | pancre | prost | skin | stoma | thyro | urina | |||
| Total # sample | 1 | |||||||||||||||||||
| GAIN (# sample) | 1 | |||||||||||||||||||
| LOSS (# sample) |
| cf) Tissue ID; Tissue type (1; Breast, 2; Central_nervous_system, 3; Cervix, 4; Endometrium, 5; Haematopoietic_and_lymphoid_tissue, 6; Kidney, 7; Large_intestine, 8; Liver, 9; Lung, 10; NS, 11; Ovary, 12; Pancreas, 13; Prostate, 14; Skin, 15; Stomach, 16; Thyroid, 17; Urinary_tract) |
| Top |
|
 |
| Top |
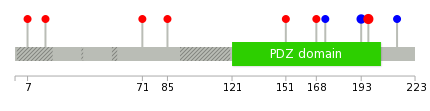
| Stat. for Non-Synonymous SNVs (# total SNVs=6) | (# total SNVs=2) |
 | 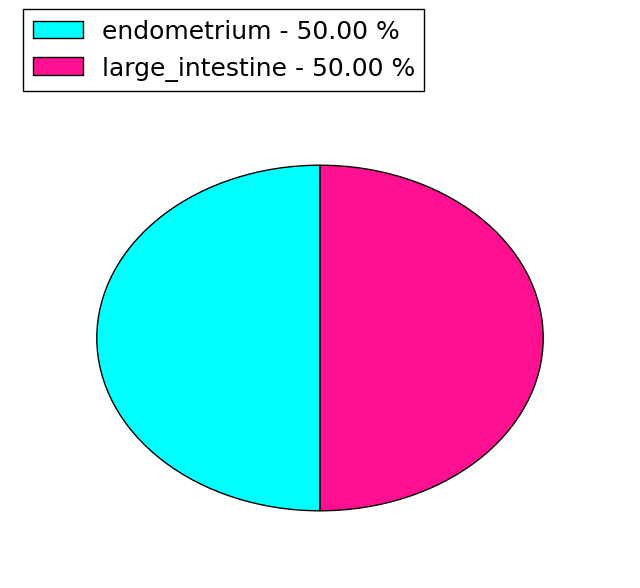 |
(# total SNVs=0) | (# total SNVs=0) |
| Top |
| * When you move the cursor on each content, you can see more deailed mutation information on the Tooltip. Those are primary_site,primary_histology,mutation(aa),pubmedID. |
| GRCh37 position | Mutation(aa) | Unique sampleID count |
| chr12:122353796-122353796 | p.E197G | 3 |
| chr12:122353785-122353785 | p.I193I | 2 |
| chr12:122332718-122332718 | p.Q71L | 1 |
| chr12:122337551-122337551 | p.D85Y | 1 |
| chr12:122337750-122337750 | p.A151V | 1 |
| chr12:122340962-122340962 | p.Q168H | 1 |
| chr12:122340977-122340977 | p.L173L | 1 |
| chr12:122353804-122353804 | p.Q200* | 1 |
| chr12:122326782-122326782 | p.R7K | 1 |
| chr12:122353845-122353845 | p.L213L | 1 |
| Top |
|
 |
| Point Mutation/ Tissue ID | 1 | 2 | 3 | 4 | 5 | 6 | 7 | 8 | 9 | 10 | 11 | 12 | 13 | 14 | 15 | 16 | 17 | 18 | 19 | 20 |
| # sample | 1 | 2 | 3 | 3 | ||||||||||||||||
| # mutation | 1 | 2 | 2 | 3 | ||||||||||||||||
| nonsynonymous SNV | 1 | 1 | 2 | |||||||||||||||||
| synonymous SNV | 1 | 2 | 1 |
| cf) Tissue ID; Tissue type (1; BLCA[Bladder Urothelial Carcinoma], 2; BRCA[Breast invasive carcinoma], 3; CESC[Cervical squamous cell carcinoma and endocervical adenocarcinoma], 4; COAD[Colon adenocarcinoma], 5; GBM[Glioblastoma multiforme], 6; Glioma Low Grade, 7; HNSC[Head and Neck squamous cell carcinoma], 8; KICH[Kidney Chromophobe], 9; KIRC[Kidney renal clear cell carcinoma], 10; KIRP[Kidney renal papillary cell carcinoma], 11; LAML[Acute Myeloid Leukemia], 12; LUAD[Lung adenocarcinoma], 13; LUSC[Lung squamous cell carcinoma], 14; OV[Ovarian serous cystadenocarcinoma ], 15; PAAD[Pancreatic adenocarcinoma], 16; PRAD[Prostate adenocarcinoma], 17; SKCM[Skin Cutaneous Melanoma], 18:STAD[Stomach adenocarcinoma], 19:THCA[Thyroid carcinoma], 20:UCEC[Uterine Corpus Endometrial Carcinoma]) |
| Top |
| * We represented just top 10 SNVs. When you move the cursor on each content, you can see more deailed mutation information on the Tooltip. Those are primary_site, primary_histology, mutation(aa), pubmedID. |
| Genomic Position | Mutation(aa) | Unique sampleID count |
| chr12:122353785 | p.I88I,PSMD9 | 2 |
| chr12:122337655 | p.L68L,PSMD9 | 1 |
| chr12:122340962 | p.L108L,PSMD9 | 1 |
| chr12:122340977 | p.R7K,PSMD9 | 1 |
| chr12:122353845 | p.D85Y | 1 |
| chr12:122326782 | p.L100Q | 1 |
| chr12:122337551 | p.A119A | 1 |
| chr12:122337597 | p.Q63H,PSMD9 | 1 |
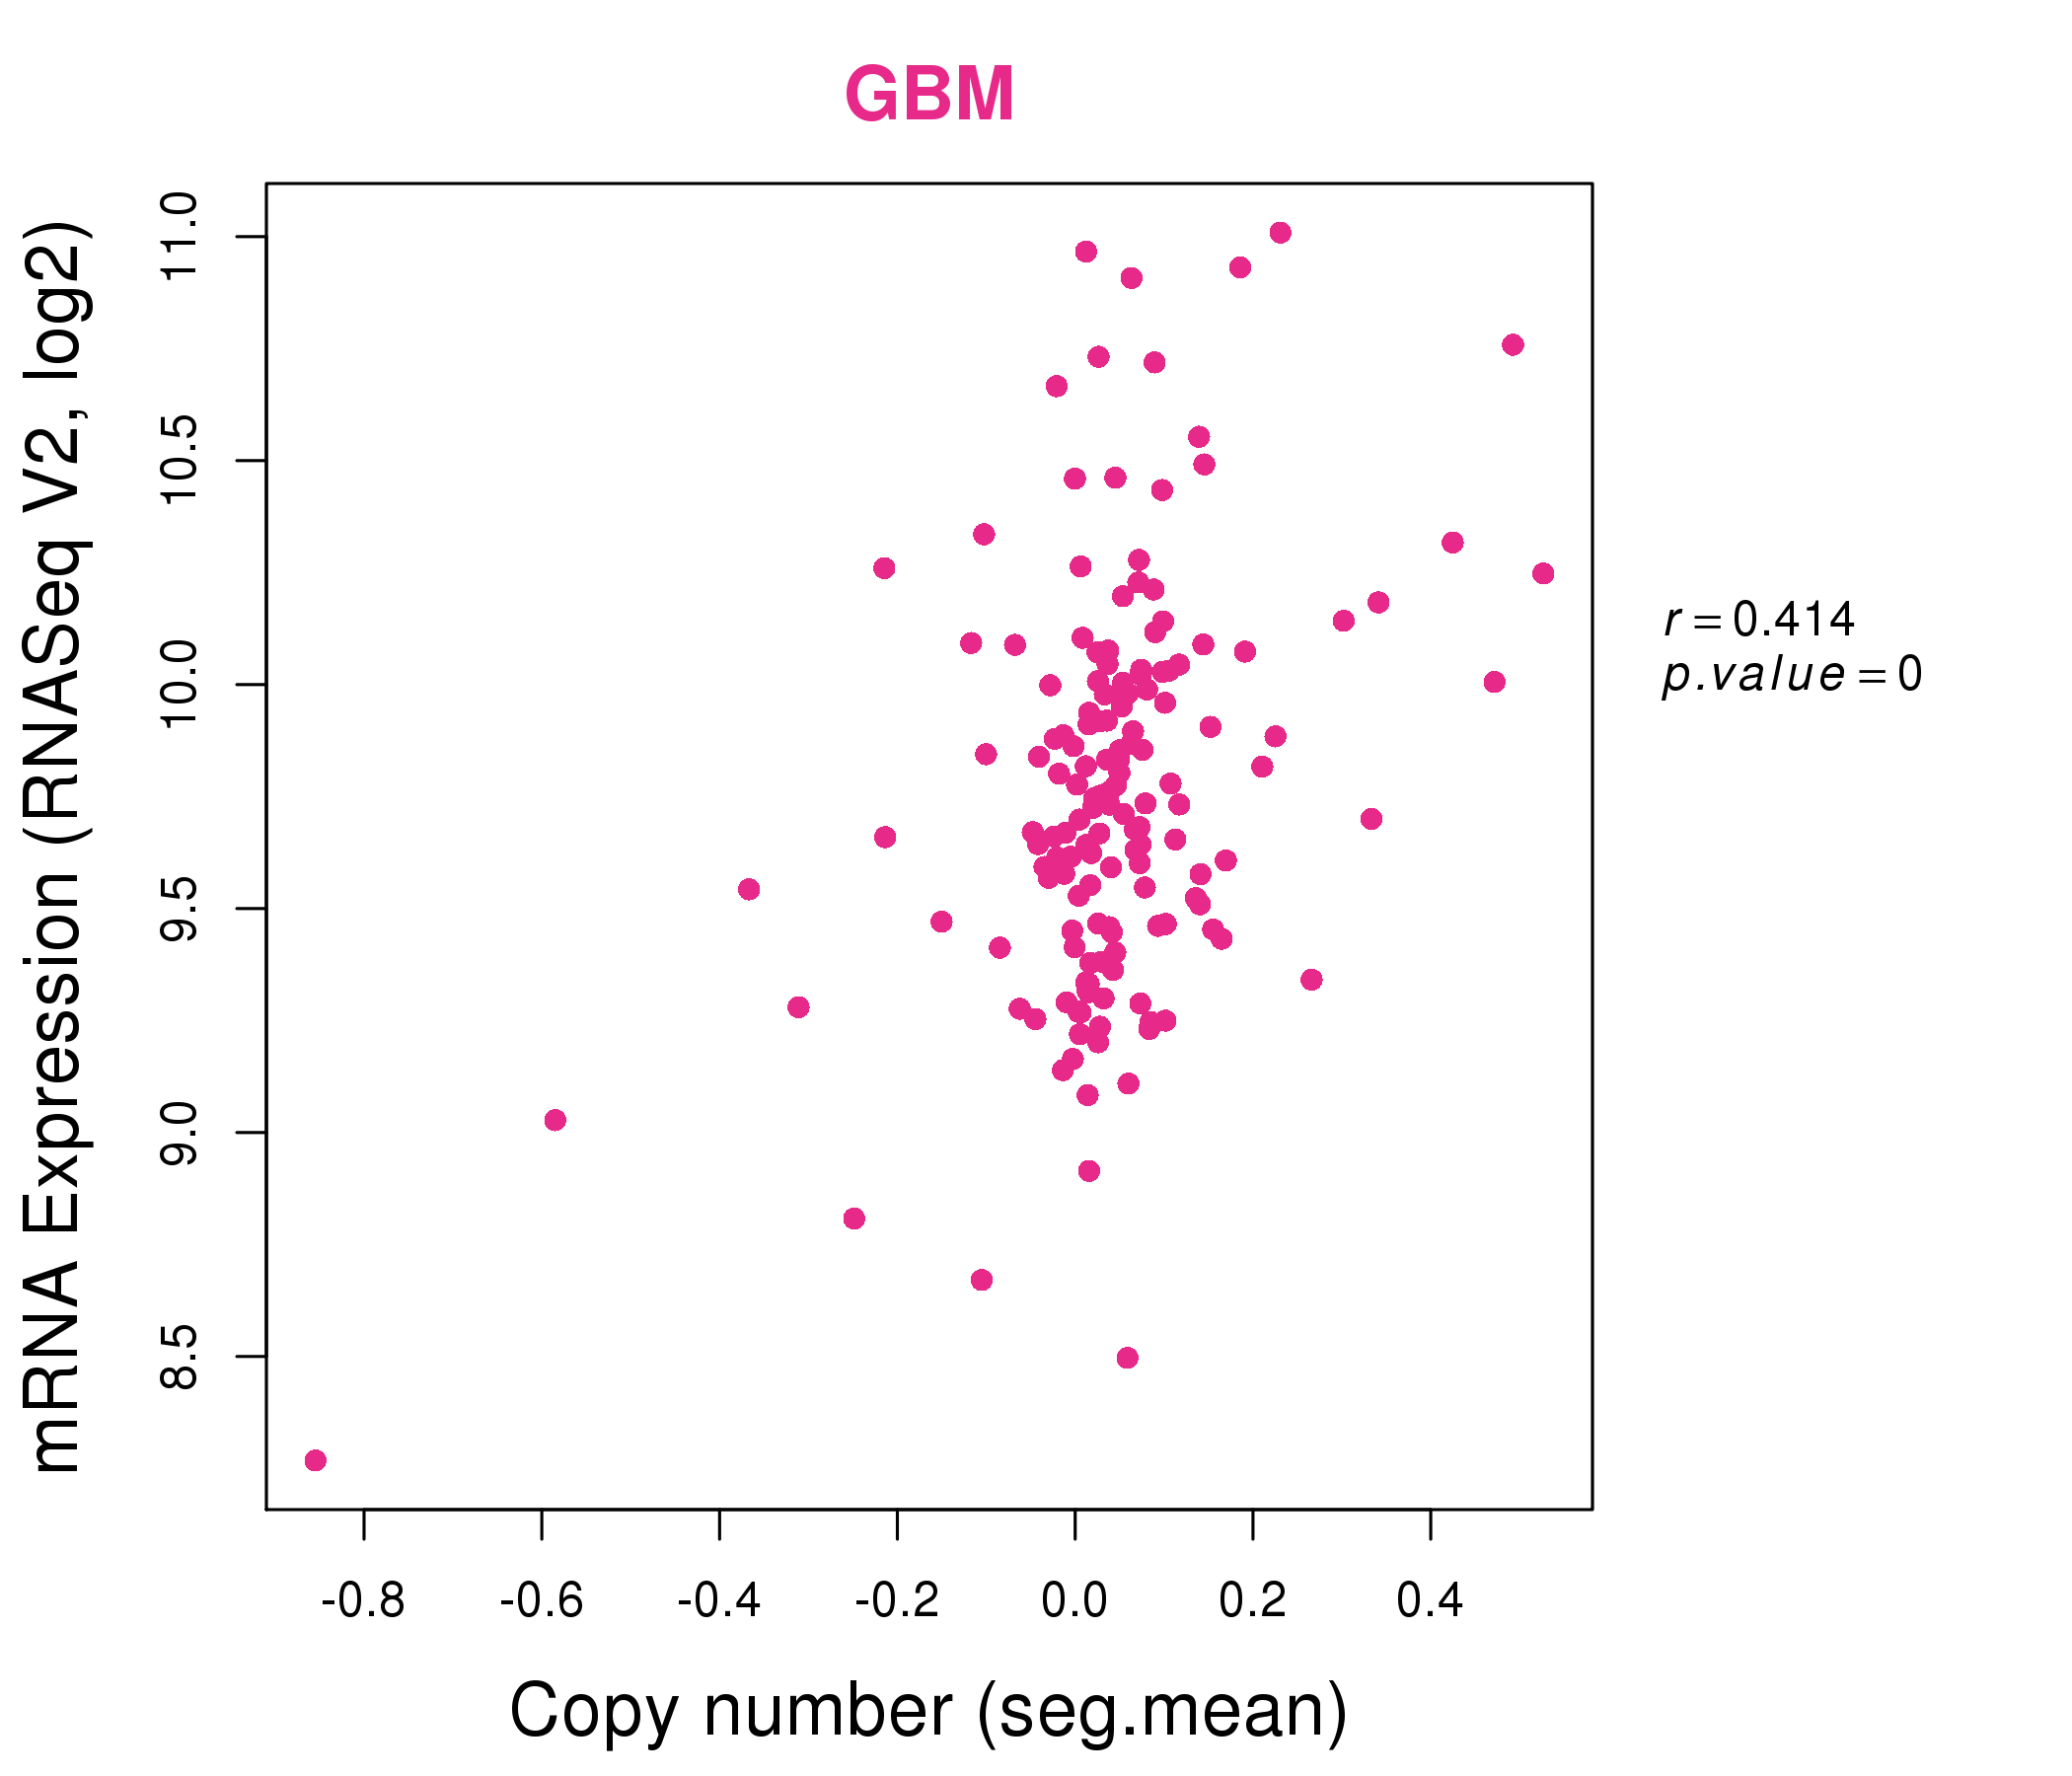
| * Copy number data were extracted from TCGA using R package TCGA-Assembler. The URLs of all public data files on TCGA DCC data server were gathered on Jan-05-2015. Function ProcessCNAData in TCGA-Assembler package was used to obtain gene-level copy number value which is calculated as the average copy number of the genomic region of a gene. |
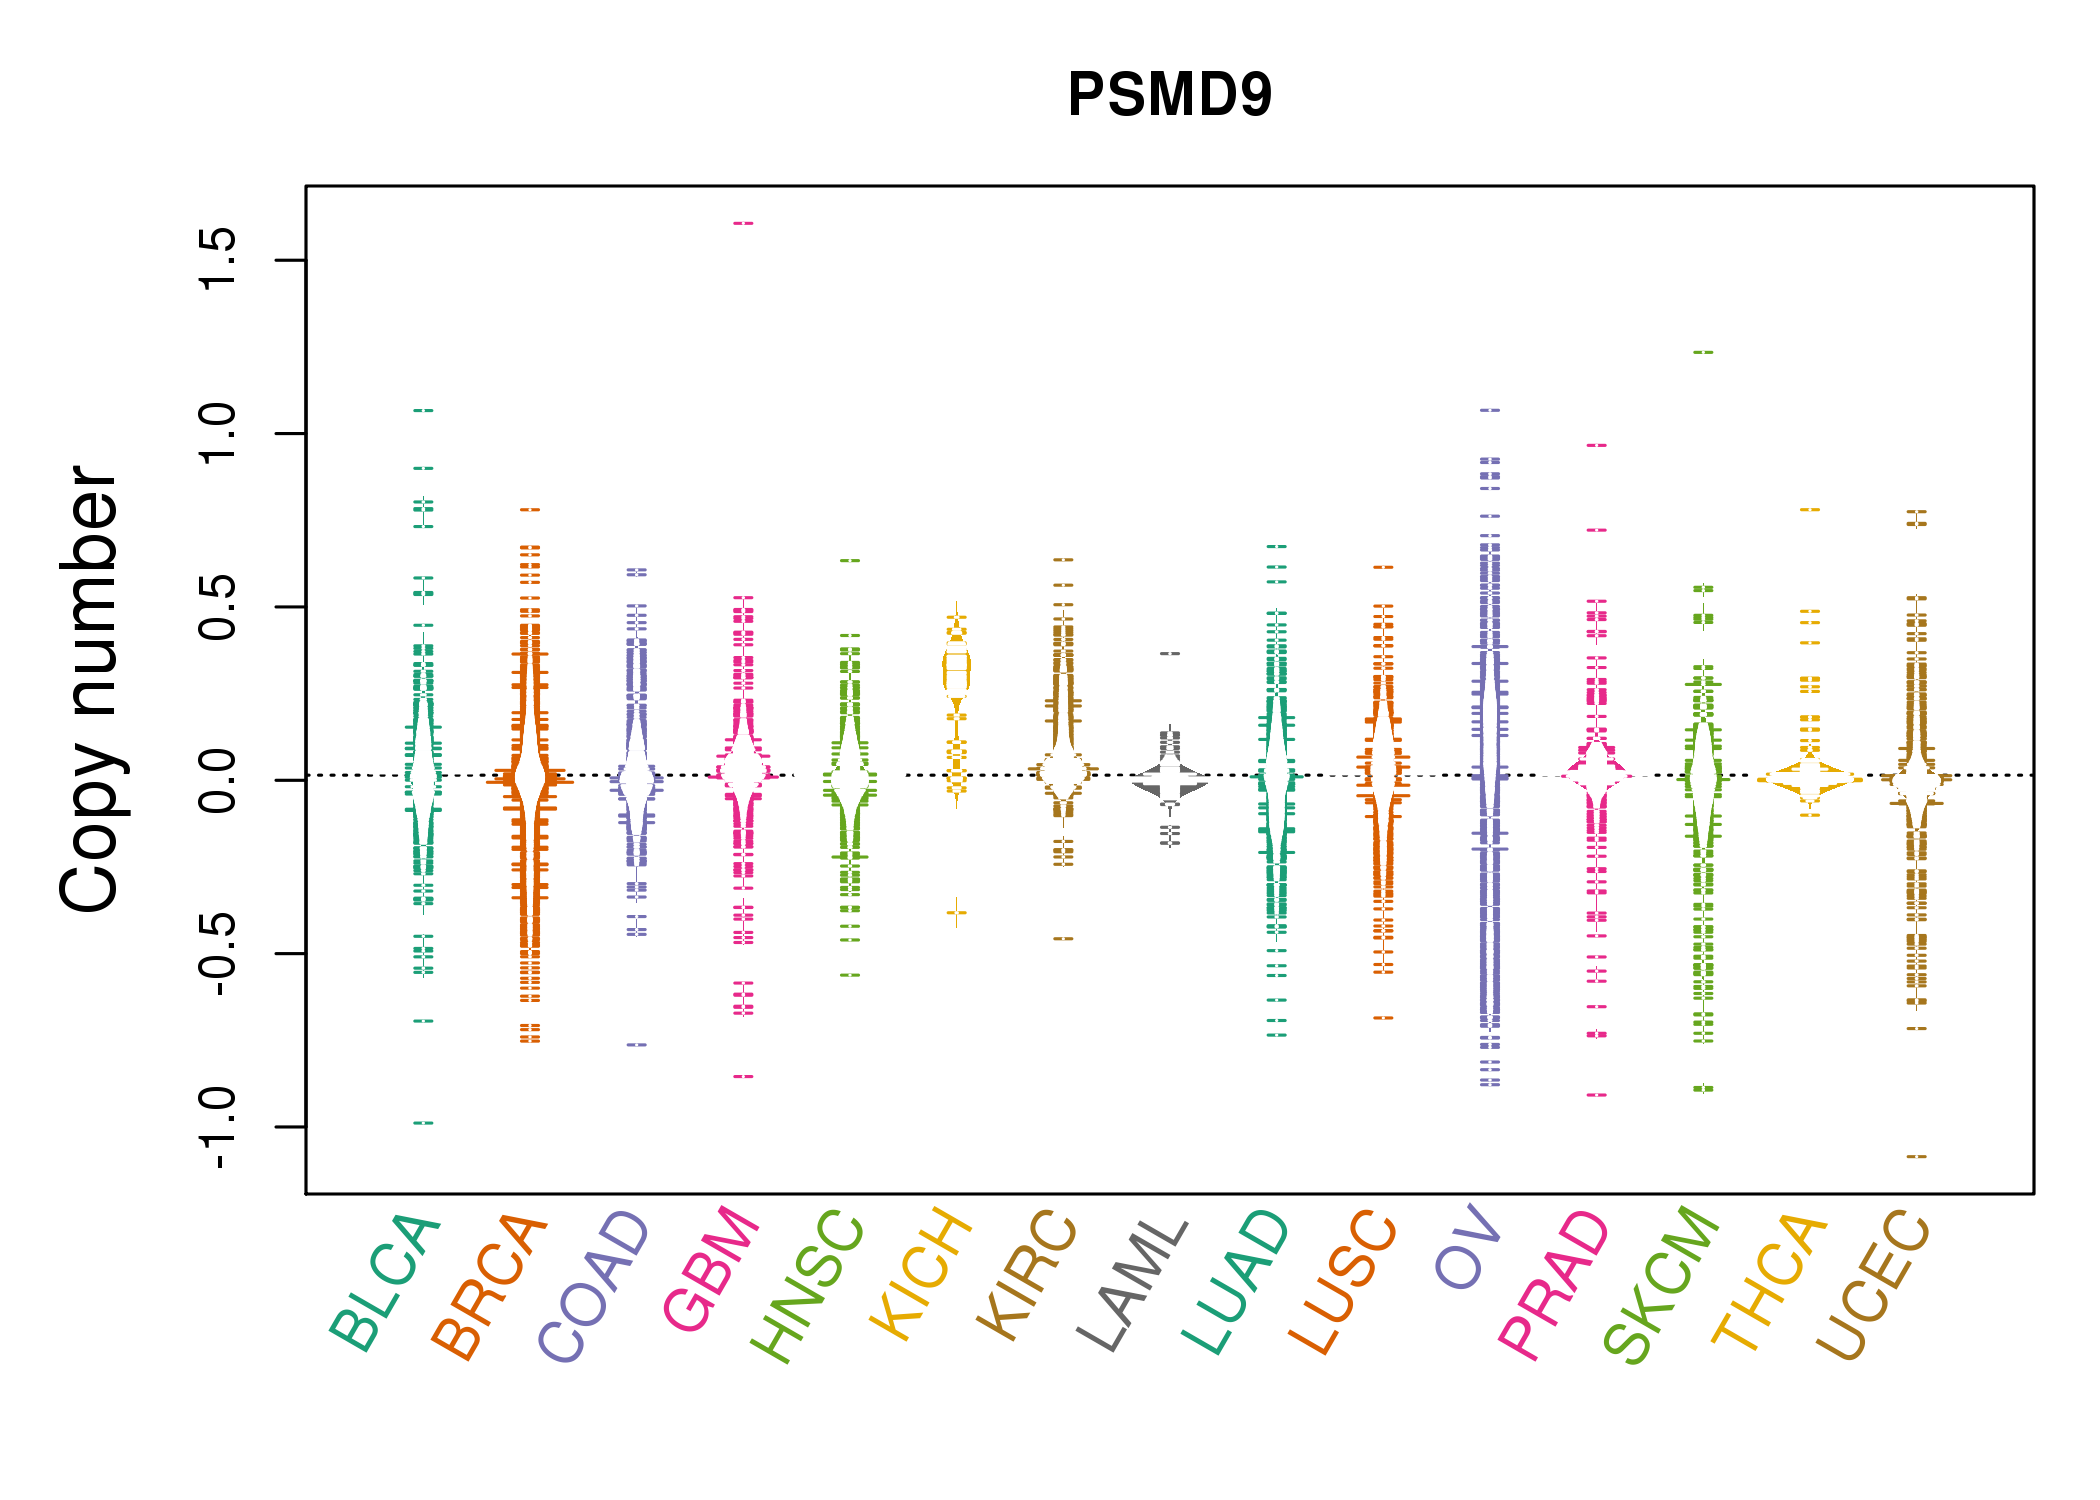 |
| cf) Tissue ID[Tissue type]: BLCA[Bladder Urothelial Carcinoma], BRCA[Breast invasive carcinoma], CESC[Cervical squamous cell carcinoma and endocervical adenocarcinoma], COAD[Colon adenocarcinoma], GBM[Glioblastoma multiforme], Glioma Low Grade, HNSC[Head and Neck squamous cell carcinoma], KICH[Kidney Chromophobe], KIRC[Kidney renal clear cell carcinoma], KIRP[Kidney renal papillary cell carcinoma], LAML[Acute Myeloid Leukemia], LUAD[Lung adenocarcinoma], LUSC[Lung squamous cell carcinoma], OV[Ovarian serous cystadenocarcinoma ], PAAD[Pancreatic adenocarcinoma], PRAD[Prostate adenocarcinoma], SKCM[Skin Cutaneous Melanoma], STAD[Stomach adenocarcinoma], THCA[Thyroid carcinoma], UCEC[Uterine Corpus Endometrial Carcinoma] |
| Top |
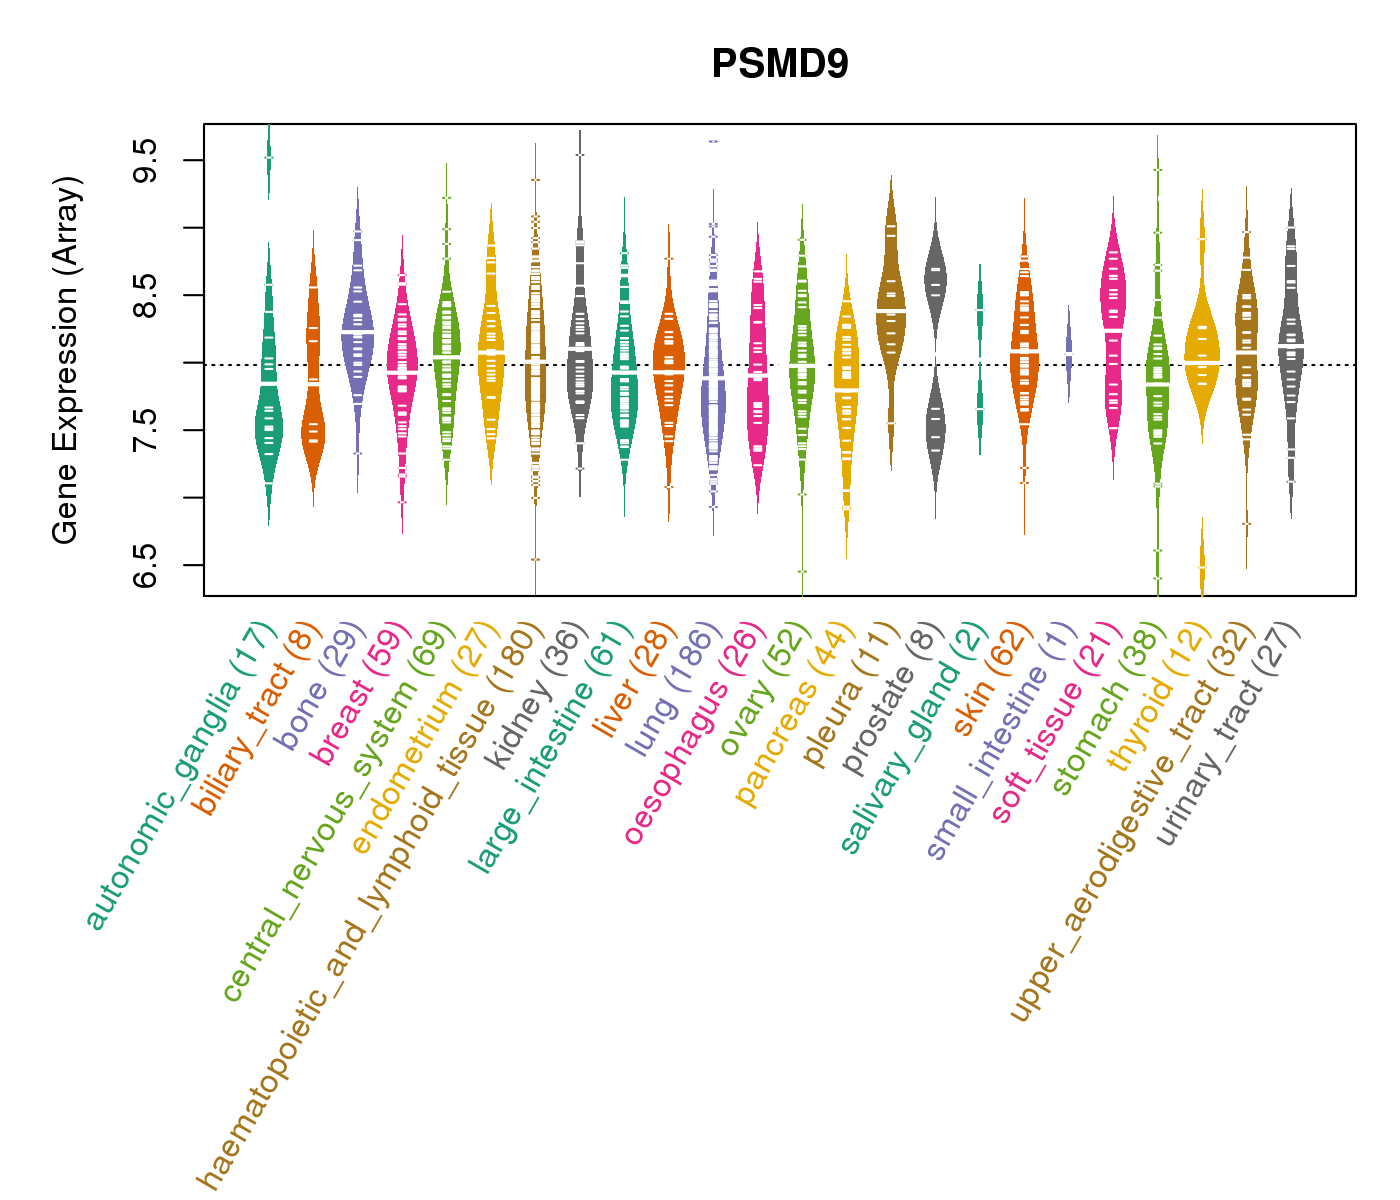
| Gene Expression for PSMD9 |
| * CCLE gene expression data were extracted from CCLE_Expression_Entrez_2012-10-18.res: Gene-centric RMA-normalized mRNA expression data. |
 |
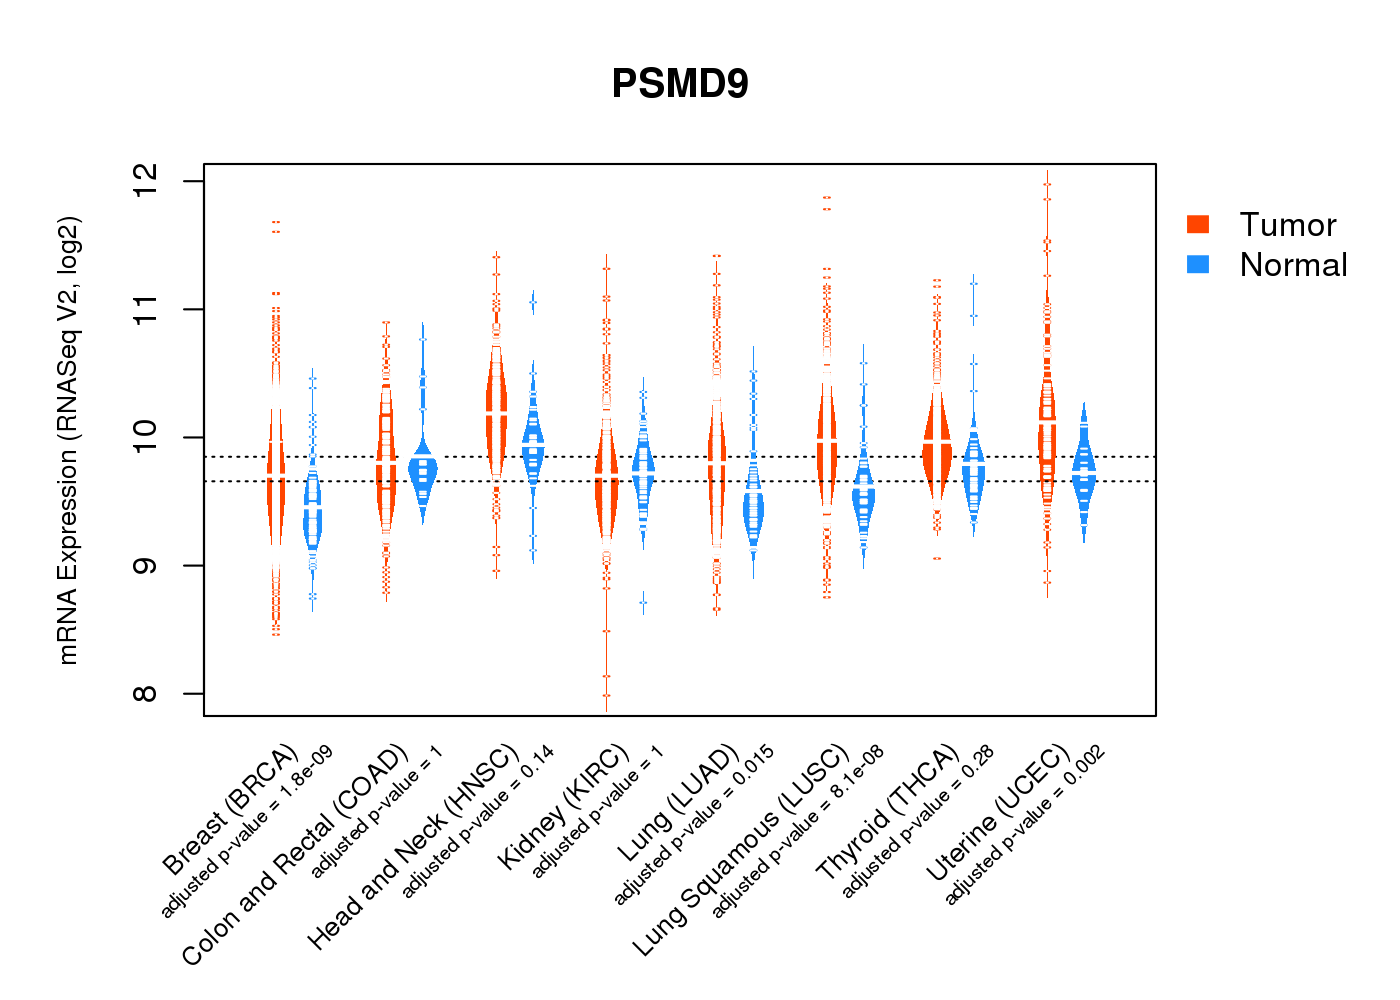
| * Normalized gene expression data of RNASeqV2 was extracted from TCGA using R package TCGA-Assembler. The URLs of all public data files on TCGA DCC data server were gathered at Jan-05-2015. Only eight cancer types have enough normal control samples for differential expression analysis. (t test, adjusted p<0.05 (using Benjamini-Hochberg FDR)) |
 |
| Top |
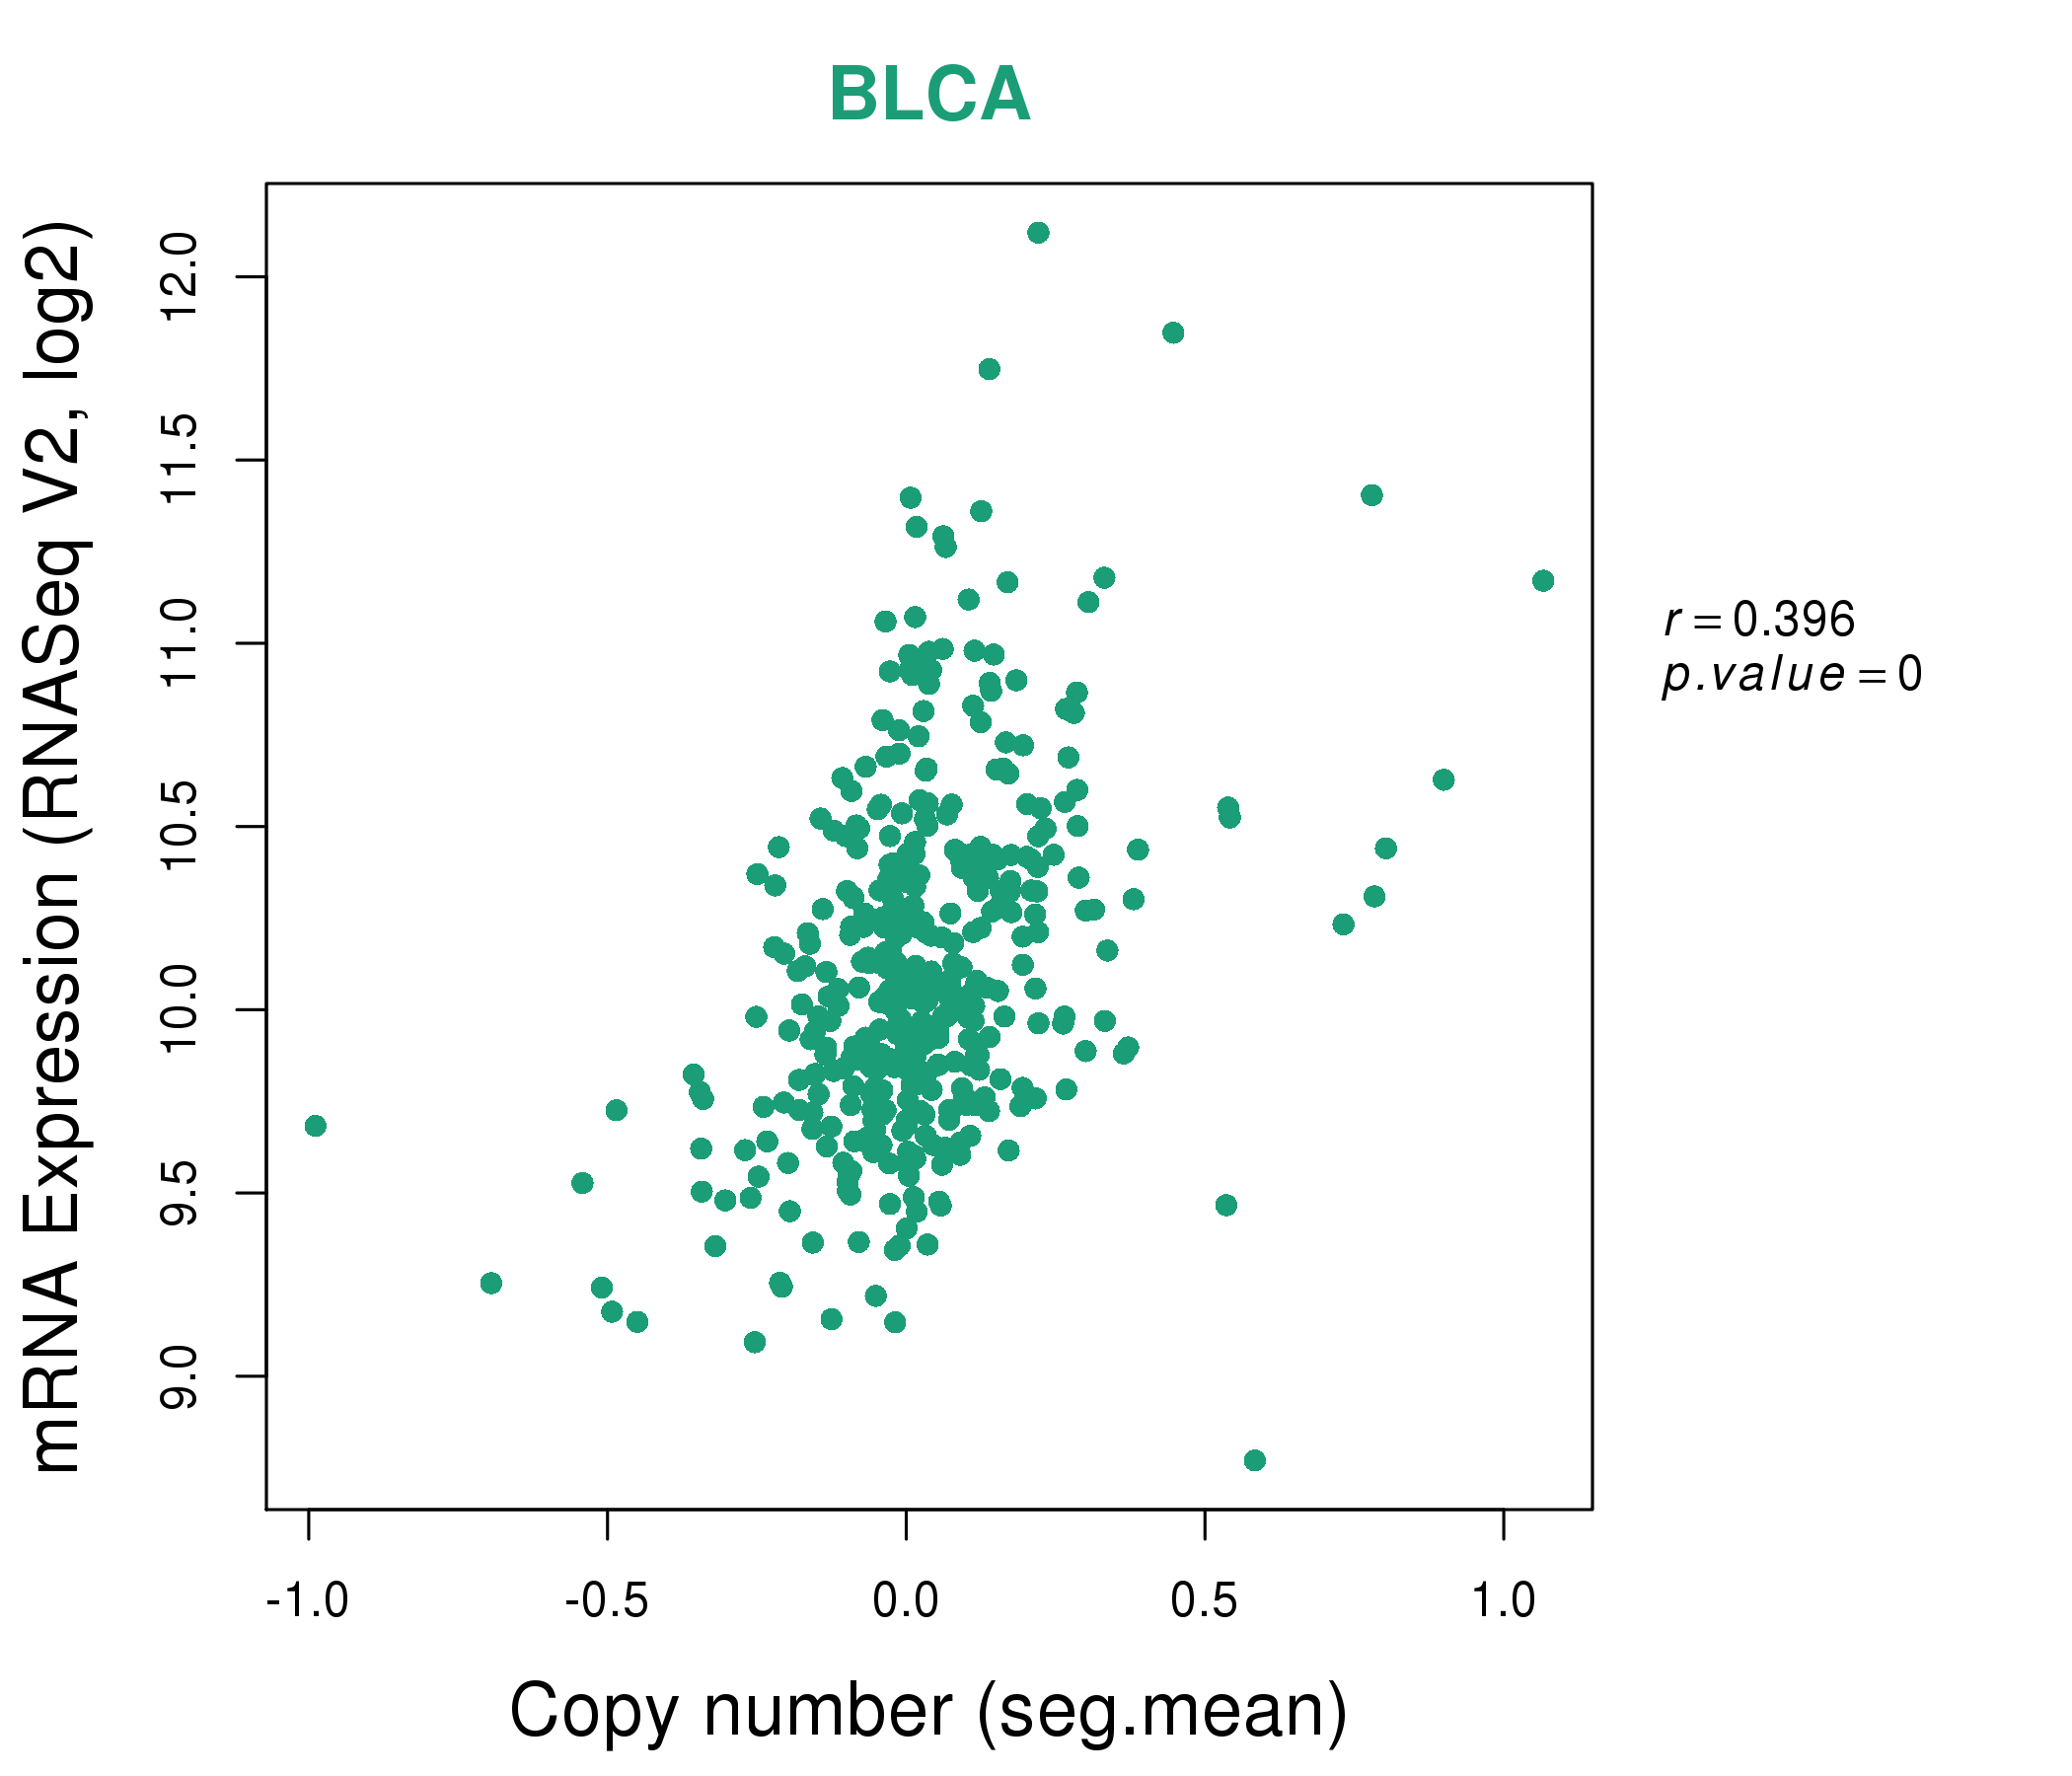
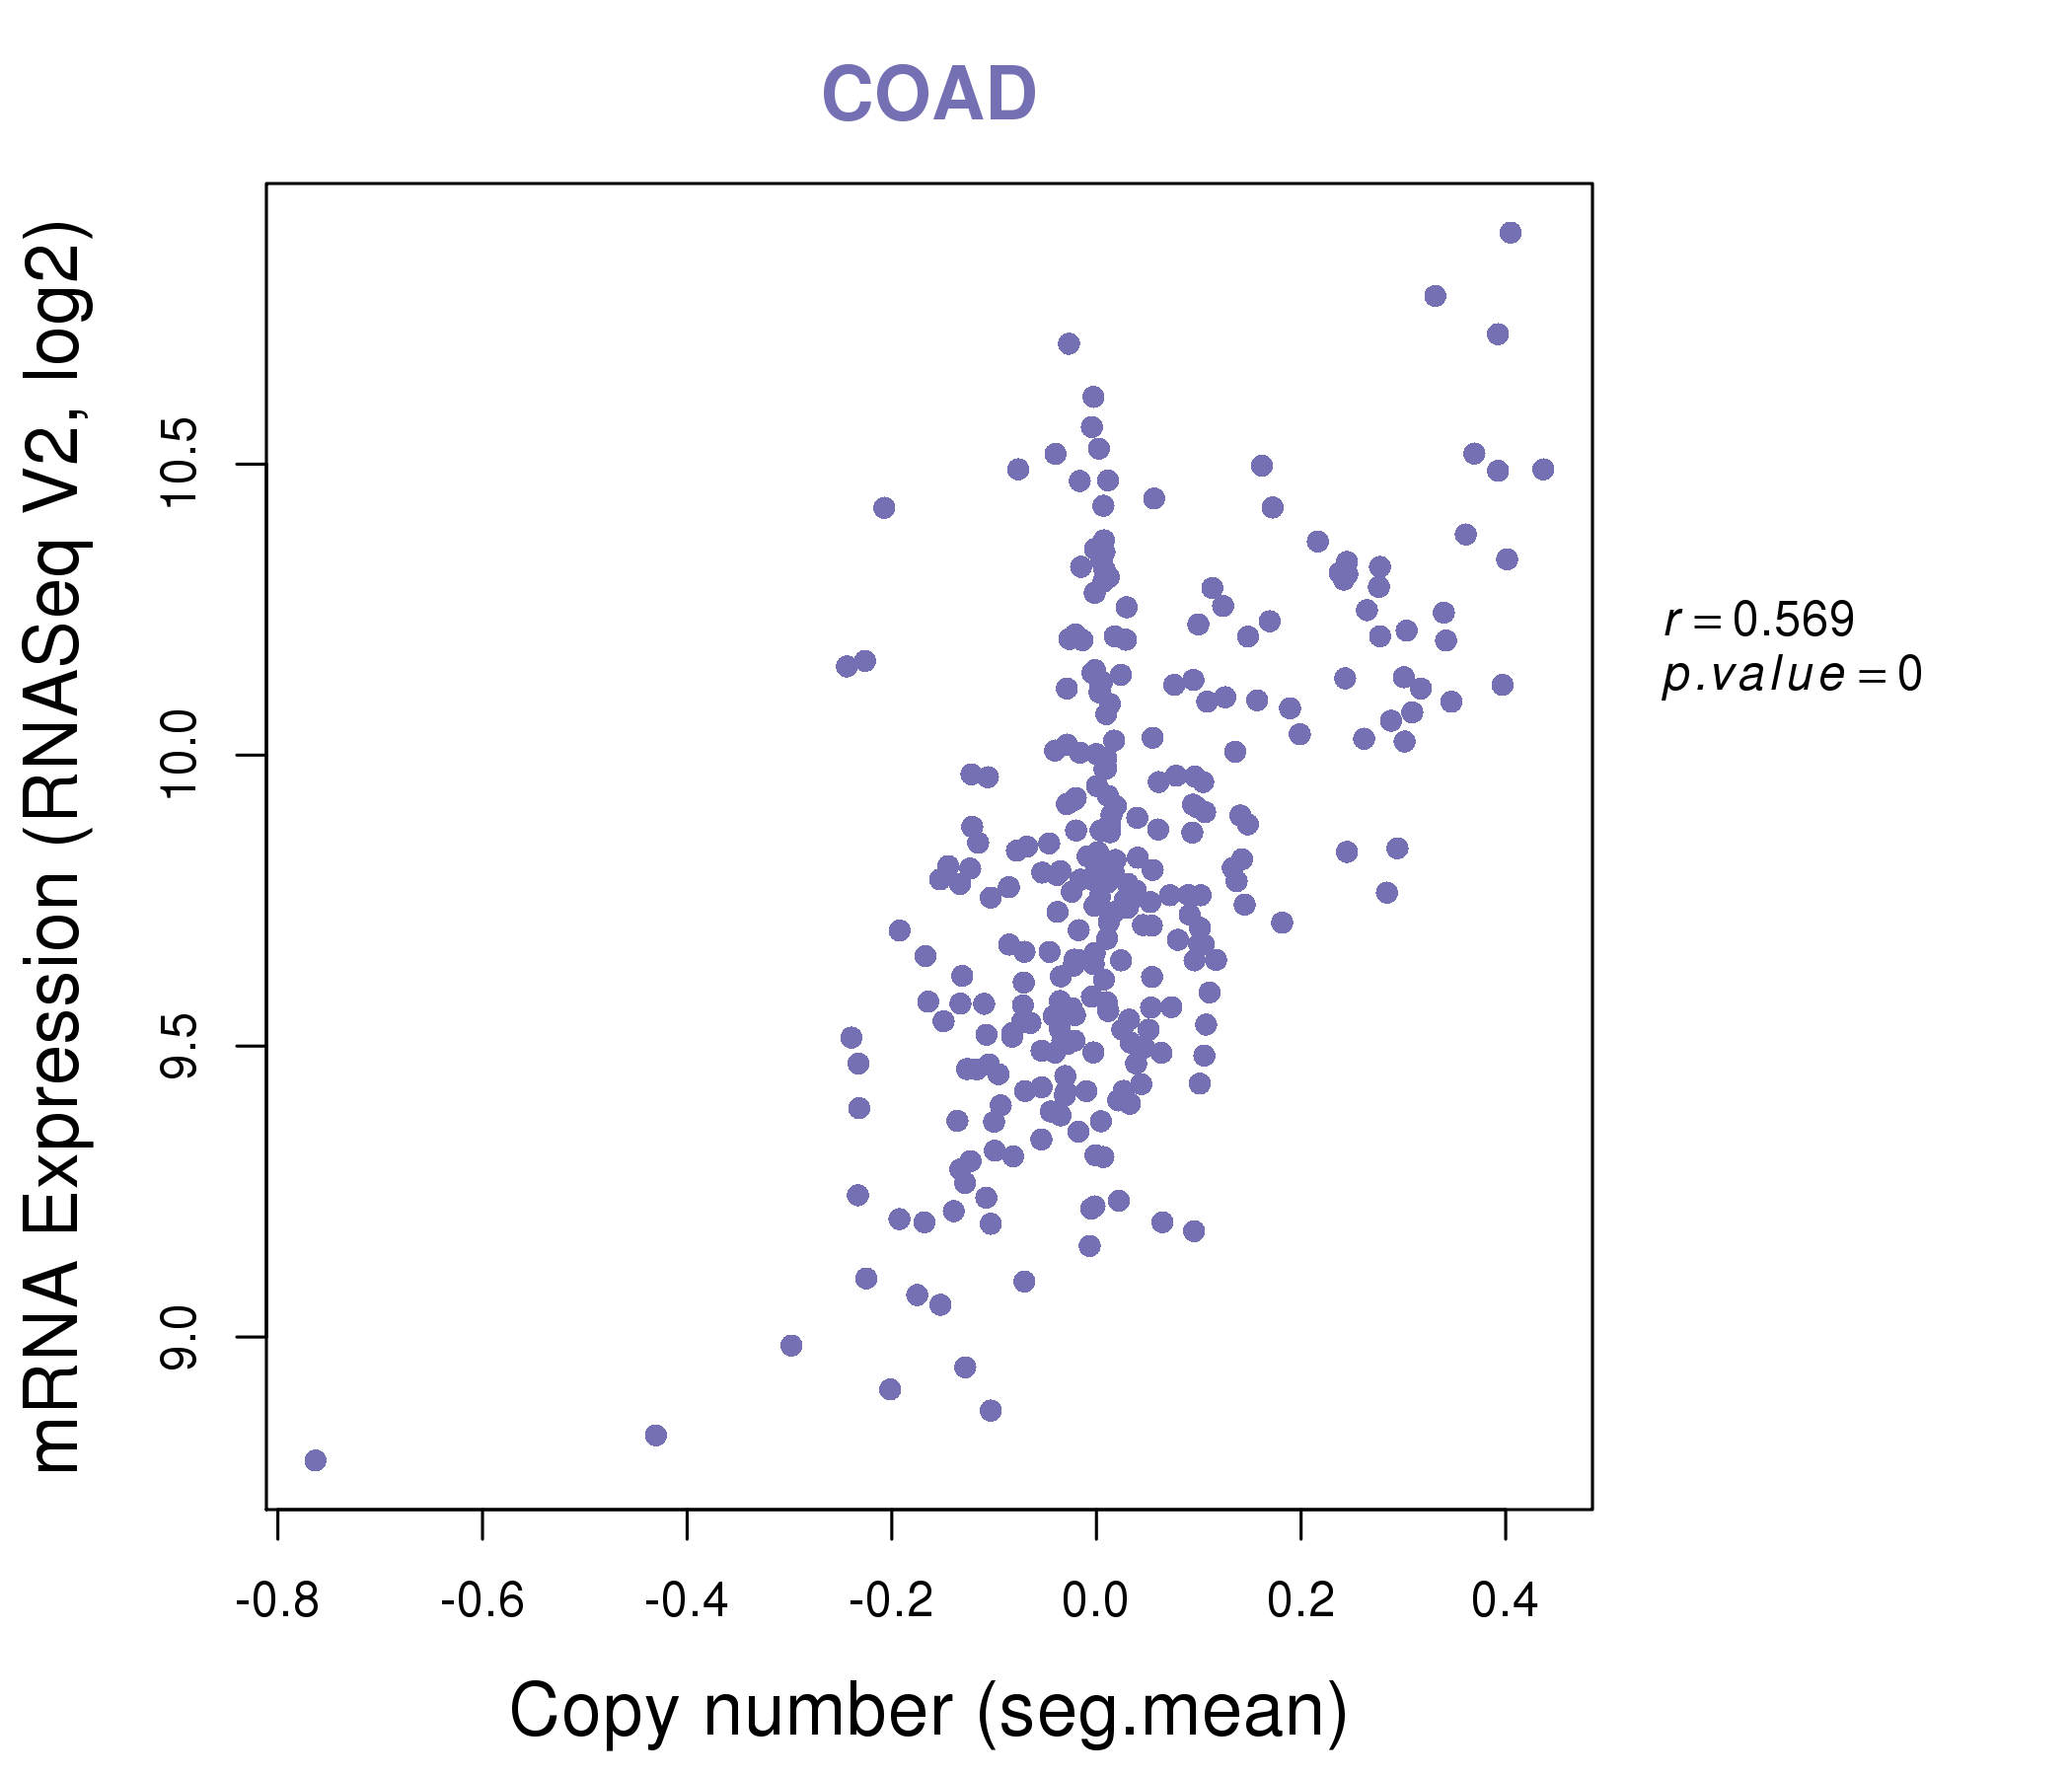
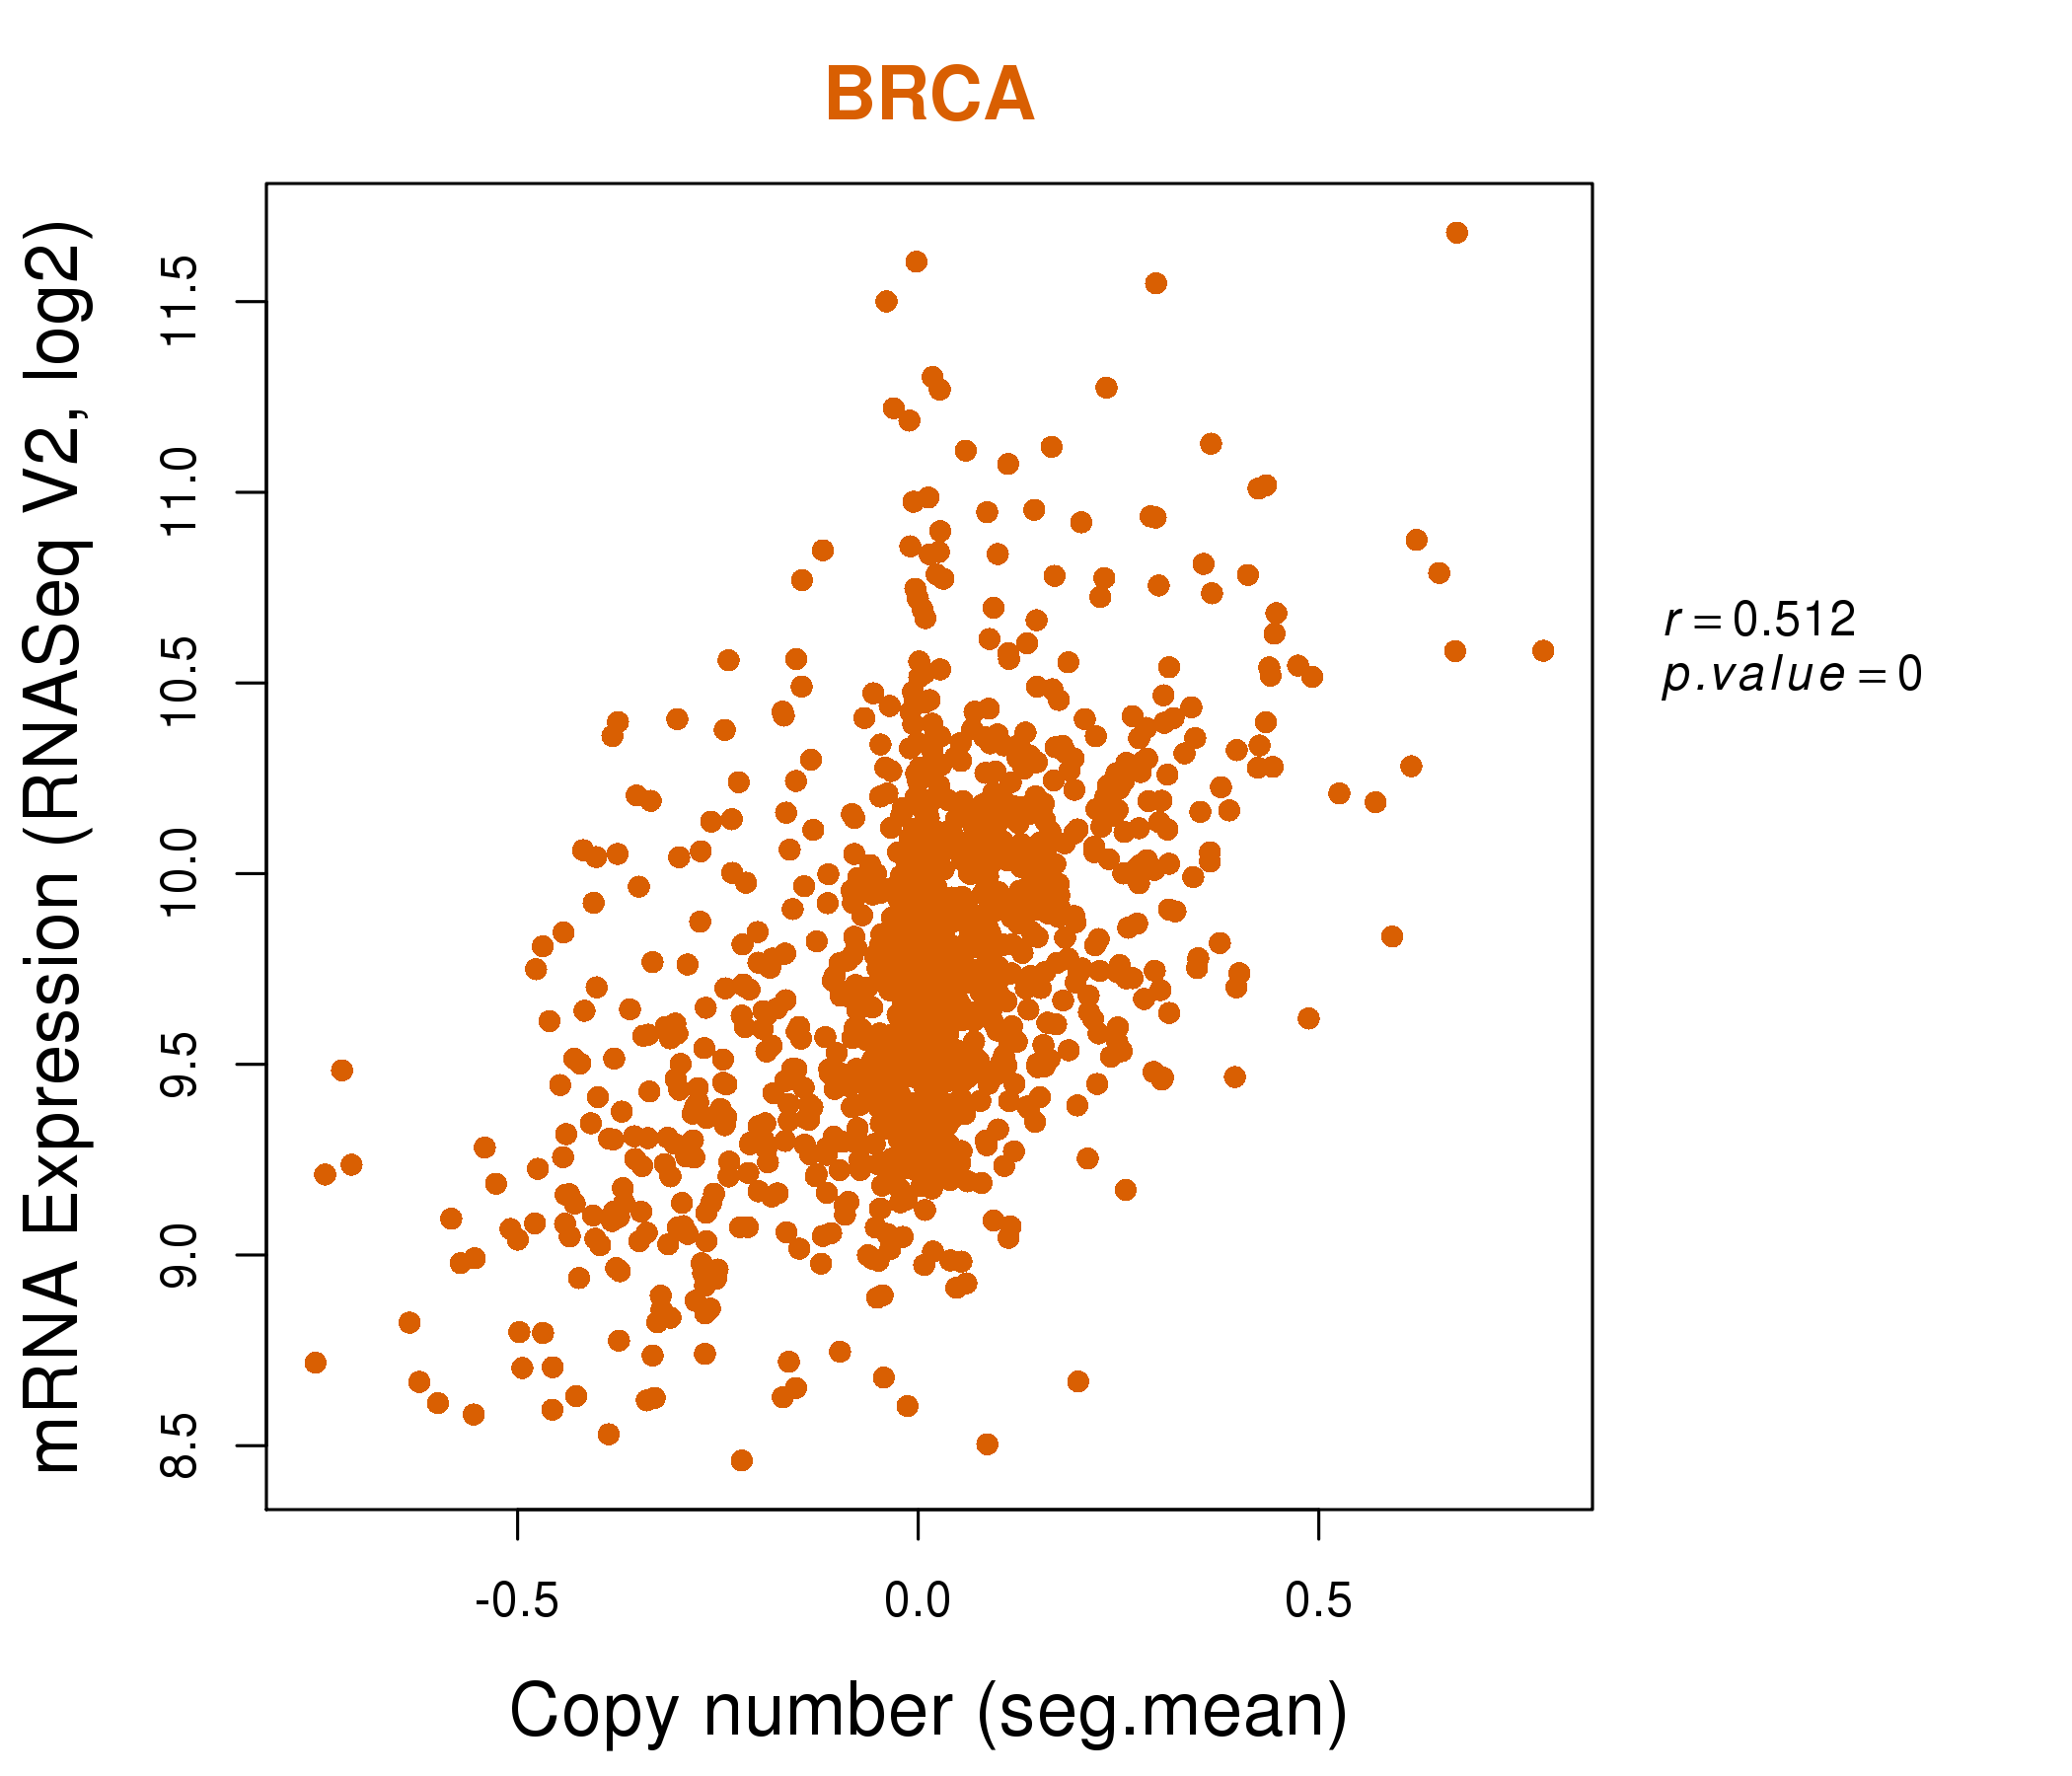
| * This plots show the correlation between CNV and gene expression. |
: Open all plots for all cancer types
 |
|
 |
|
| Top |
| Gene-Gene Network Information |
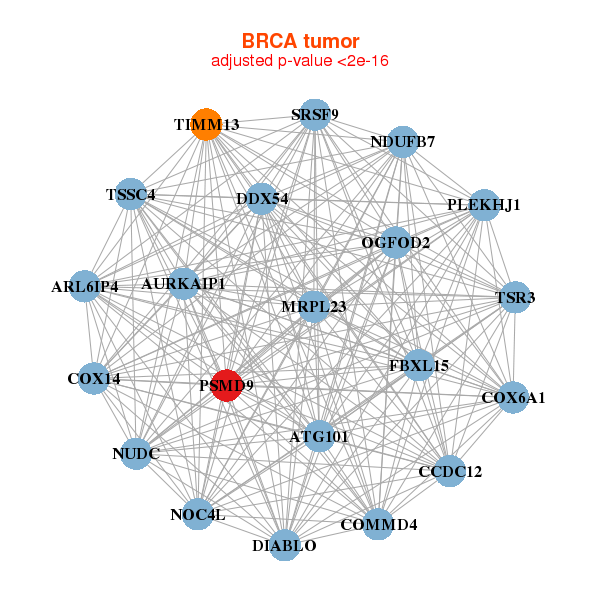
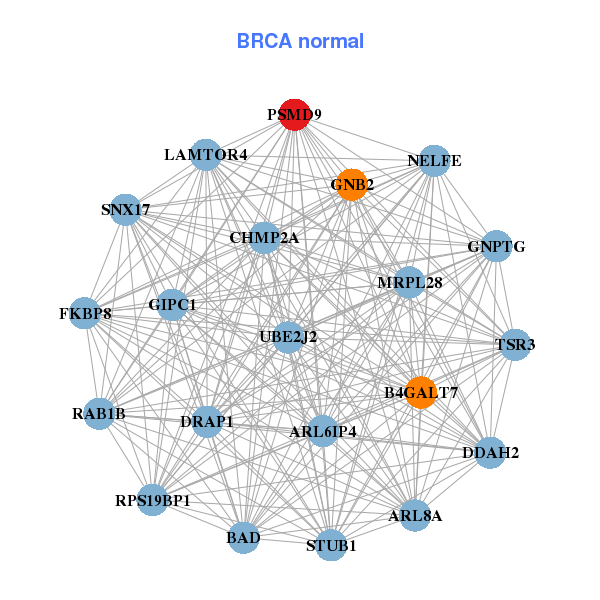
| * Co-Expression network figures were drawn using R package igraph. Only the top 20 genes with the highest correlations were shown. Red circle: input gene, orange circle: cell metabolism gene, sky circle: other gene |
: Open all plots for all cancer types
 |
|
| ARL6IP4,AURKAIP1,ATG101,COX14,TSR3,CCDC12,COMMD4, COX6A1,DDX54,DIABLO,FBXL15,MRPL23,NDUFB7,NOC4L, NUDC,OGFOD2,PLEKHJ1,PSMD9,SRSF9,TIMM13,TSSC4 | ARL6IP4,ARL8A,B4GALT7,BAD,TSR3,LAMTOR4,CHMP2A, DDAH2,DRAP1,FKBP8,GIPC1,GNB2,GNPTG,MRPL28, PSMD9,RAB1B,NELFE,RPS19BP1,SNX17,STUB1,UBE2J2 |
 |
|
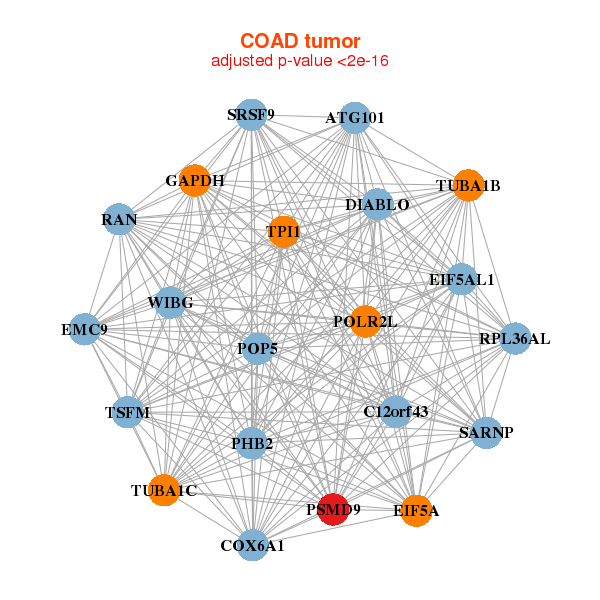
| C12orf43,ATG101,COX6A1,DIABLO,EIF5A,EIF5AL1,EMC9, GAPDH,PHB2,POLR2L,POP5,PSMD9,RAN,RPL36AL, SARNP,SRSF9,TPI1,TSFM,TUBA1B,TUBA1C,WIBG | ABT1,BUD31,COX14,C1orf43,COA4,ICT1,LINC00493, MRPL49,MRPL54,LINC00116,NDUFA6,NDUFA7,NDUFB4,NDUFB6, POLR2F,PRDX2,PSMD8,PSMD9,NELFE,STOML2,TUSC2 |
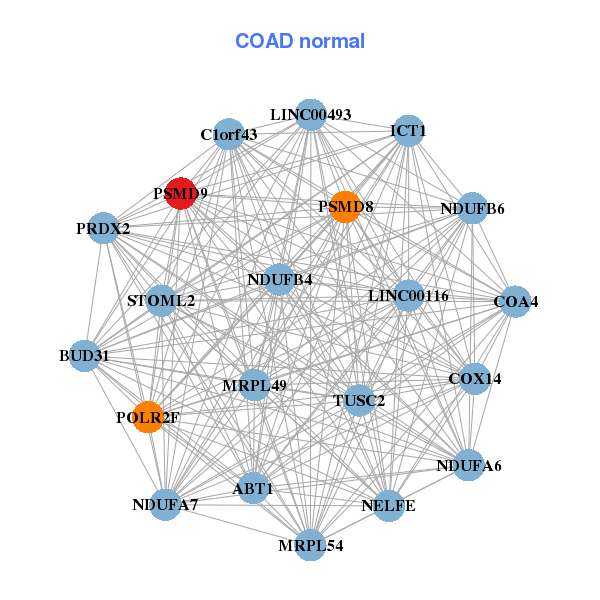
| * Co-Expression network figures were drawn using R package igraph. Only the top 20 genes with the highest correlations were shown. Red circle: input gene, orange circle: cell metabolism gene, sky circle: other gene |
: Open all plots for all cancer types
| Top |
: Open all interacting genes' information including KEGG pathway for all interacting genes from DAVID
| Top |
| Pharmacological Information for PSMD9 |
| There's no related Drug. |
| Top |
| Cross referenced IDs for PSMD9 |
| * We obtained these cross-references from Uniprot database. It covers 150 different DBs, 18 categories. http://www.uniprot.org/help/cross_references_section |
: Open all cross reference information
|
Copyright © 2016-Present - The Univsersity of Texas Health Science Center at Houston @ |