|
||||||||||||||||||||||||||||||||||||||||||||||||||||||||||||||||||||||||||||||||||||||||||||||||||||||||||||||||||||||||||||||||||||||||||||||||||||||||||||||||||||||||||||||||||||||||||||||||||||||||||||||||||||||||||||||||||||||||||||||||||||||||||||||||||||||||||||||||||||||||||||||||||||||||||||||||||||||||||
| |
| Phenotypic Information (metabolism pathway, cancer, disease, phenome) |
| |
| |
| Gene-Gene Network Information: Co-Expression Network, Interacting Genes & KEGG |
| |
|


| Gene Summary for SLC44A2 |
| Top |
| Phenotypic Information for SLC44A2(metabolism pathway, cancer, disease, phenome) |
| Cancer | CGAP: SLC44A2 |
| Familial Cancer Database: SLC44A2 | |
| * This gene is included in those cancer gene databases. |
|
|
|
|
|
|
| ||||||||||||||||||||||||||||||||||||||||||||||||||||||||||||||||||||||||||||||||||||||||||||||||||||||||||||||||||||||||||||||||||||||||||||||||||||||||||||||||||||||||||||||||||||||||||||||||||||||||||||||||||||||||||||||||||||||||||||||||||||||||||||||||||||||||||||||||||||||||||||||||||||||||||||||||||||
Oncogene 1 | Significant driver gene in | |||||||||||||||||||||||||||||||||||||||||||||||||||||||||||||||||||||||||||||||||||||||||||||||||||||||||||||||||||||||||||||||||||||||||||||||||||||||||||||||||||||||||||||||||||||||||||||||||||||||||||||||||||||||||||||||||||||||||||||||||||||||||||||||||||||||||||||||||||||||||||||||||||||||||||||||||||||||||
| cf) number; DB name 1 Oncogene; http://nar.oxfordjournals.org/content/35/suppl_1/D721.long, 2 Tumor Suppressor gene; https://bioinfo.uth.edu/TSGene/, 3 Cancer Gene Census; http://www.nature.com/nrc/journal/v4/n3/abs/nrc1299.html, 4 CancerGenes; http://nar.oxfordjournals.org/content/35/suppl_1/D721.long, 5 Network of Cancer Gene; http://ncg.kcl.ac.uk/index.php, 1Therapeutic Vulnerabilities in Cancer; http://cbio.mskcc.org/cancergenomics/statius/ |
| REACTOME_PHOSPHOLIPID_METABOLISM REACTOME_METABOLISM_OF_LIPIDS_AND_LIPOPROTEINS | |
| Mutations for SLC44A2 |
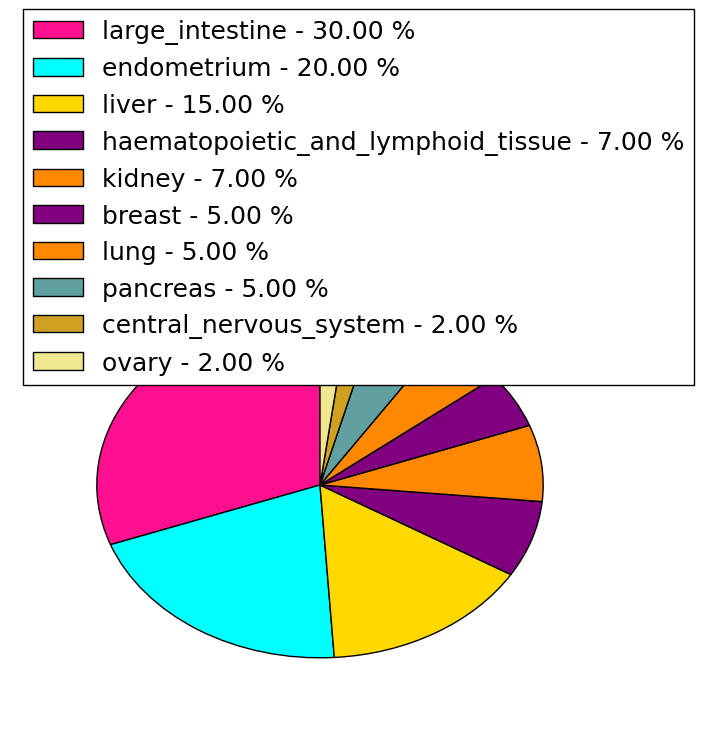
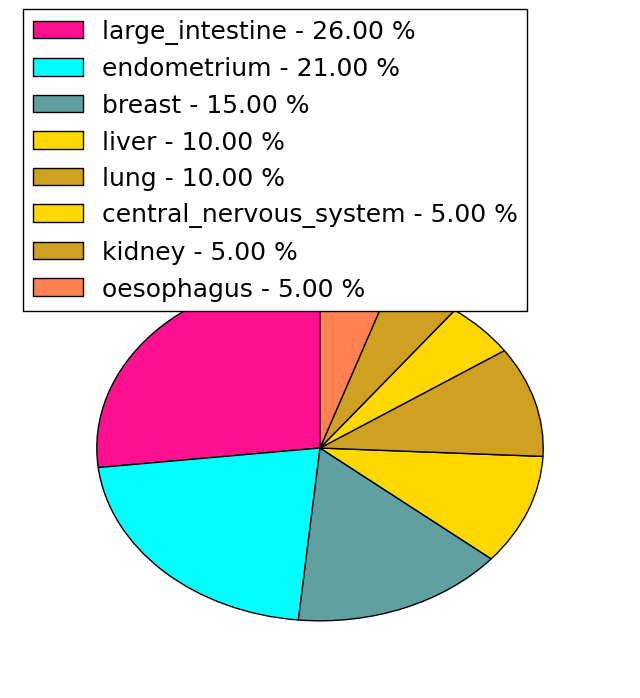
| * Under tables are showing count per each tissue to give us broad intuition about tissue specific mutation patterns.You can go to the detailed page for each mutation database's web site. |
| There's no structural variation information in COSMIC data for this gene. |
| * From mRNA Sanger sequences, Chitars2.0 arranged chimeric transcripts. This table shows SLC44A2 related fusion information. |
| ID | Head Gene | Tail Gene | Accession | Gene_a | qStart_a | qEnd_a | Chromosome_a | tStart_a | tEnd_a | Gene_a | qStart_a | qEnd_a | Chromosome_a | tStart_a | tEnd_a |
| DA801918 | NOP56 | 1 | 53 | 20 | 2637288 | 2637340 | SLC44A2 | 54 | 450 | 19 | 10713131 | 10741815 | |
| BE765019 | SLC44A2 | 14 | 84 | 19 | 10754667 | 10754737 | DST | 71 | 278 | 6 | 56323139 | 56323346 | |
| BE068966 | SLC44A2 | 1 | 82 | 19 | 10748564 | 10748738 | VCL | 75 | 132 | 10 | 75878537 | 75878594 | |
| BF376932 | KCNIP1 | 2 | 257 | 5 | 170050712 | 170050965 | SLC44A2 | 250 | 325 | 19 | 10754082 | 10754157 | |
| BF376933 | KCNIP1 | 1 | 290 | 5 | 170050678 | 170050965 | SLC44A2 | 283 | 358 | 19 | 10754082 | 10754157 | |
| Top |
| Mutation type/ Tissue ID | brca | cns | cerv | endome | haematopo | kidn | Lintest | liver | lung | ns | ovary | pancre | prost | skin | stoma | thyro | urina | |||
| Total # sample | 1 | 1 | ||||||||||||||||||
| GAIN (# sample) | 1 | |||||||||||||||||||
| LOSS (# sample) | 1 |
| cf) Tissue ID; Tissue type (1; Breast, 2; Central_nervous_system, 3; Cervix, 4; Endometrium, 5; Haematopoietic_and_lymphoid_tissue, 6; Kidney, 7; Large_intestine, 8; Liver, 9; Lung, 10; NS, 11; Ovary, 12; Pancreas, 13; Prostate, 14; Skin, 15; Stomach, 16; Thyroid, 17; Urinary_tract) |
| Top |
|
 |
| Top |
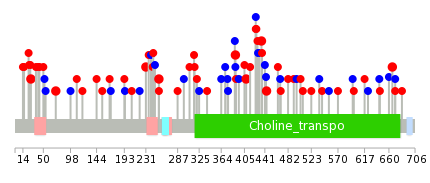
| Stat. for Non-Synonymous SNVs (# total SNVs=40) | (# total SNVs=19) |
 |  |
(# total SNVs=0) | (# total SNVs=0) |
| Top |
| * When you move the cursor on each content, you can see more deailed mutation information on the Tooltip. Those are primary_site,primary_histology,mutation(aa),pubmedID. |
| GRCh37 position | Mutation(aa) | Unique sampleID count |
| chr19:10742214-10742214 | p.? | 3 |
| chr19:10747068-10747068 | p.E435K | 2 |
| chr19:10746180-10746180 | p.C408R | 2 |
| chr19:10736945-10736945 | p.Y18* | 2 |
| chr19:10742770-10742770 | p.R254H | 2 |
| chr19:10738649-10738649 | p.E72K | 2 |
| chr19:10747096-10747096 | p.G444D | 2 |
| chr19:10753110-10753110 | p.T666M | 2 |
| chr19:10741819-10741819 | p.? | 2 |
| chr19:10742609-10742609 | p.S231C | 2 |
| Top |
|
 |
| Point Mutation/ Tissue ID | 1 | 2 | 3 | 4 | 5 | 6 | 7 | 8 | 9 | 10 | 11 | 12 | 13 | 14 | 15 | 16 | 17 | 18 | 19 | 20 |
| # sample | 1 | 2 | 1 | 14 | 2 | 5 | 1 | 1 | 2 | 3 | 1 | 14 | 3 | 1 | 11 | |||||
| # mutation | 1 | 2 | 1 | 14 | 2 | 5 | 1 | 1 | 2 | 3 | 1 | 16 | 3 | 1 | 12 | |||||
| nonsynonymous SNV | 1 | 1 | 9 | 1 | 2 | 1 | 2 | 2 | 1 | 9 | 3 | 1 | 8 | |||||||
| synonymous SNV | 1 | 1 | 5 | 1 | 3 | 1 | 1 | 7 | 4 |
| cf) Tissue ID; Tissue type (1; BLCA[Bladder Urothelial Carcinoma], 2; BRCA[Breast invasive carcinoma], 3; CESC[Cervical squamous cell carcinoma and endocervical adenocarcinoma], 4; COAD[Colon adenocarcinoma], 5; GBM[Glioblastoma multiforme], 6; Glioma Low Grade, 7; HNSC[Head and Neck squamous cell carcinoma], 8; KICH[Kidney Chromophobe], 9; KIRC[Kidney renal clear cell carcinoma], 10; KIRP[Kidney renal papillary cell carcinoma], 11; LAML[Acute Myeloid Leukemia], 12; LUAD[Lung adenocarcinoma], 13; LUSC[Lung squamous cell carcinoma], 14; OV[Ovarian serous cystadenocarcinoma ], 15; PAAD[Pancreatic adenocarcinoma], 16; PRAD[Prostate adenocarcinoma], 17; SKCM[Skin Cutaneous Melanoma], 18:STAD[Stomach adenocarcinoma], 19:THCA[Thyroid carcinoma], 20:UCEC[Uterine Corpus Endometrial Carcinoma]) |
| Top |
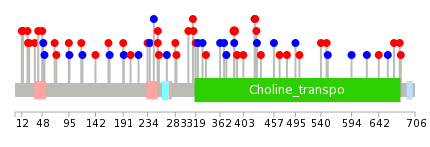
| * We represented just top 10 SNVs. When you move the cursor on each content, you can see more deailed mutation information on the Tooltip. Those are primary_site, primary_histology, mutation(aa), pubmedID. |
| Genomic Position | Mutation(aa) | Unique sampleID count |
| chr19:10746124 | p.N387S,SLC44A2 | 2 |
| chr19:10742381 | p.L119L,SLC44A2 | 1 |
| chr19:10747171 | p.R285H,SLC44A2 | 1 |
| chr19:10745468 | p.R424H,SLC44A2 | 1 |
| chr19:10753125 | p.F669S,SLC44A2 | 1 |
| chr19:10738649 | p.T12M,SLC44A2 | 1 |
| chr19:10742416 | p.K142E,SLC44A2 | 1 |
| chr19:10747210 | p.Y306C,SLC44A2 | 1 |
| chr19:10736932 | p.Q426L,SLC44A2 | 1 |
| chr19:10745531 | p.S679L,SLC44A2 | 1 |
| * Copy number data were extracted from TCGA using R package TCGA-Assembler. The URLs of all public data files on TCGA DCC data server were gathered on Jan-05-2015. Function ProcessCNAData in TCGA-Assembler package was used to obtain gene-level copy number value which is calculated as the average copy number of the genomic region of a gene. |
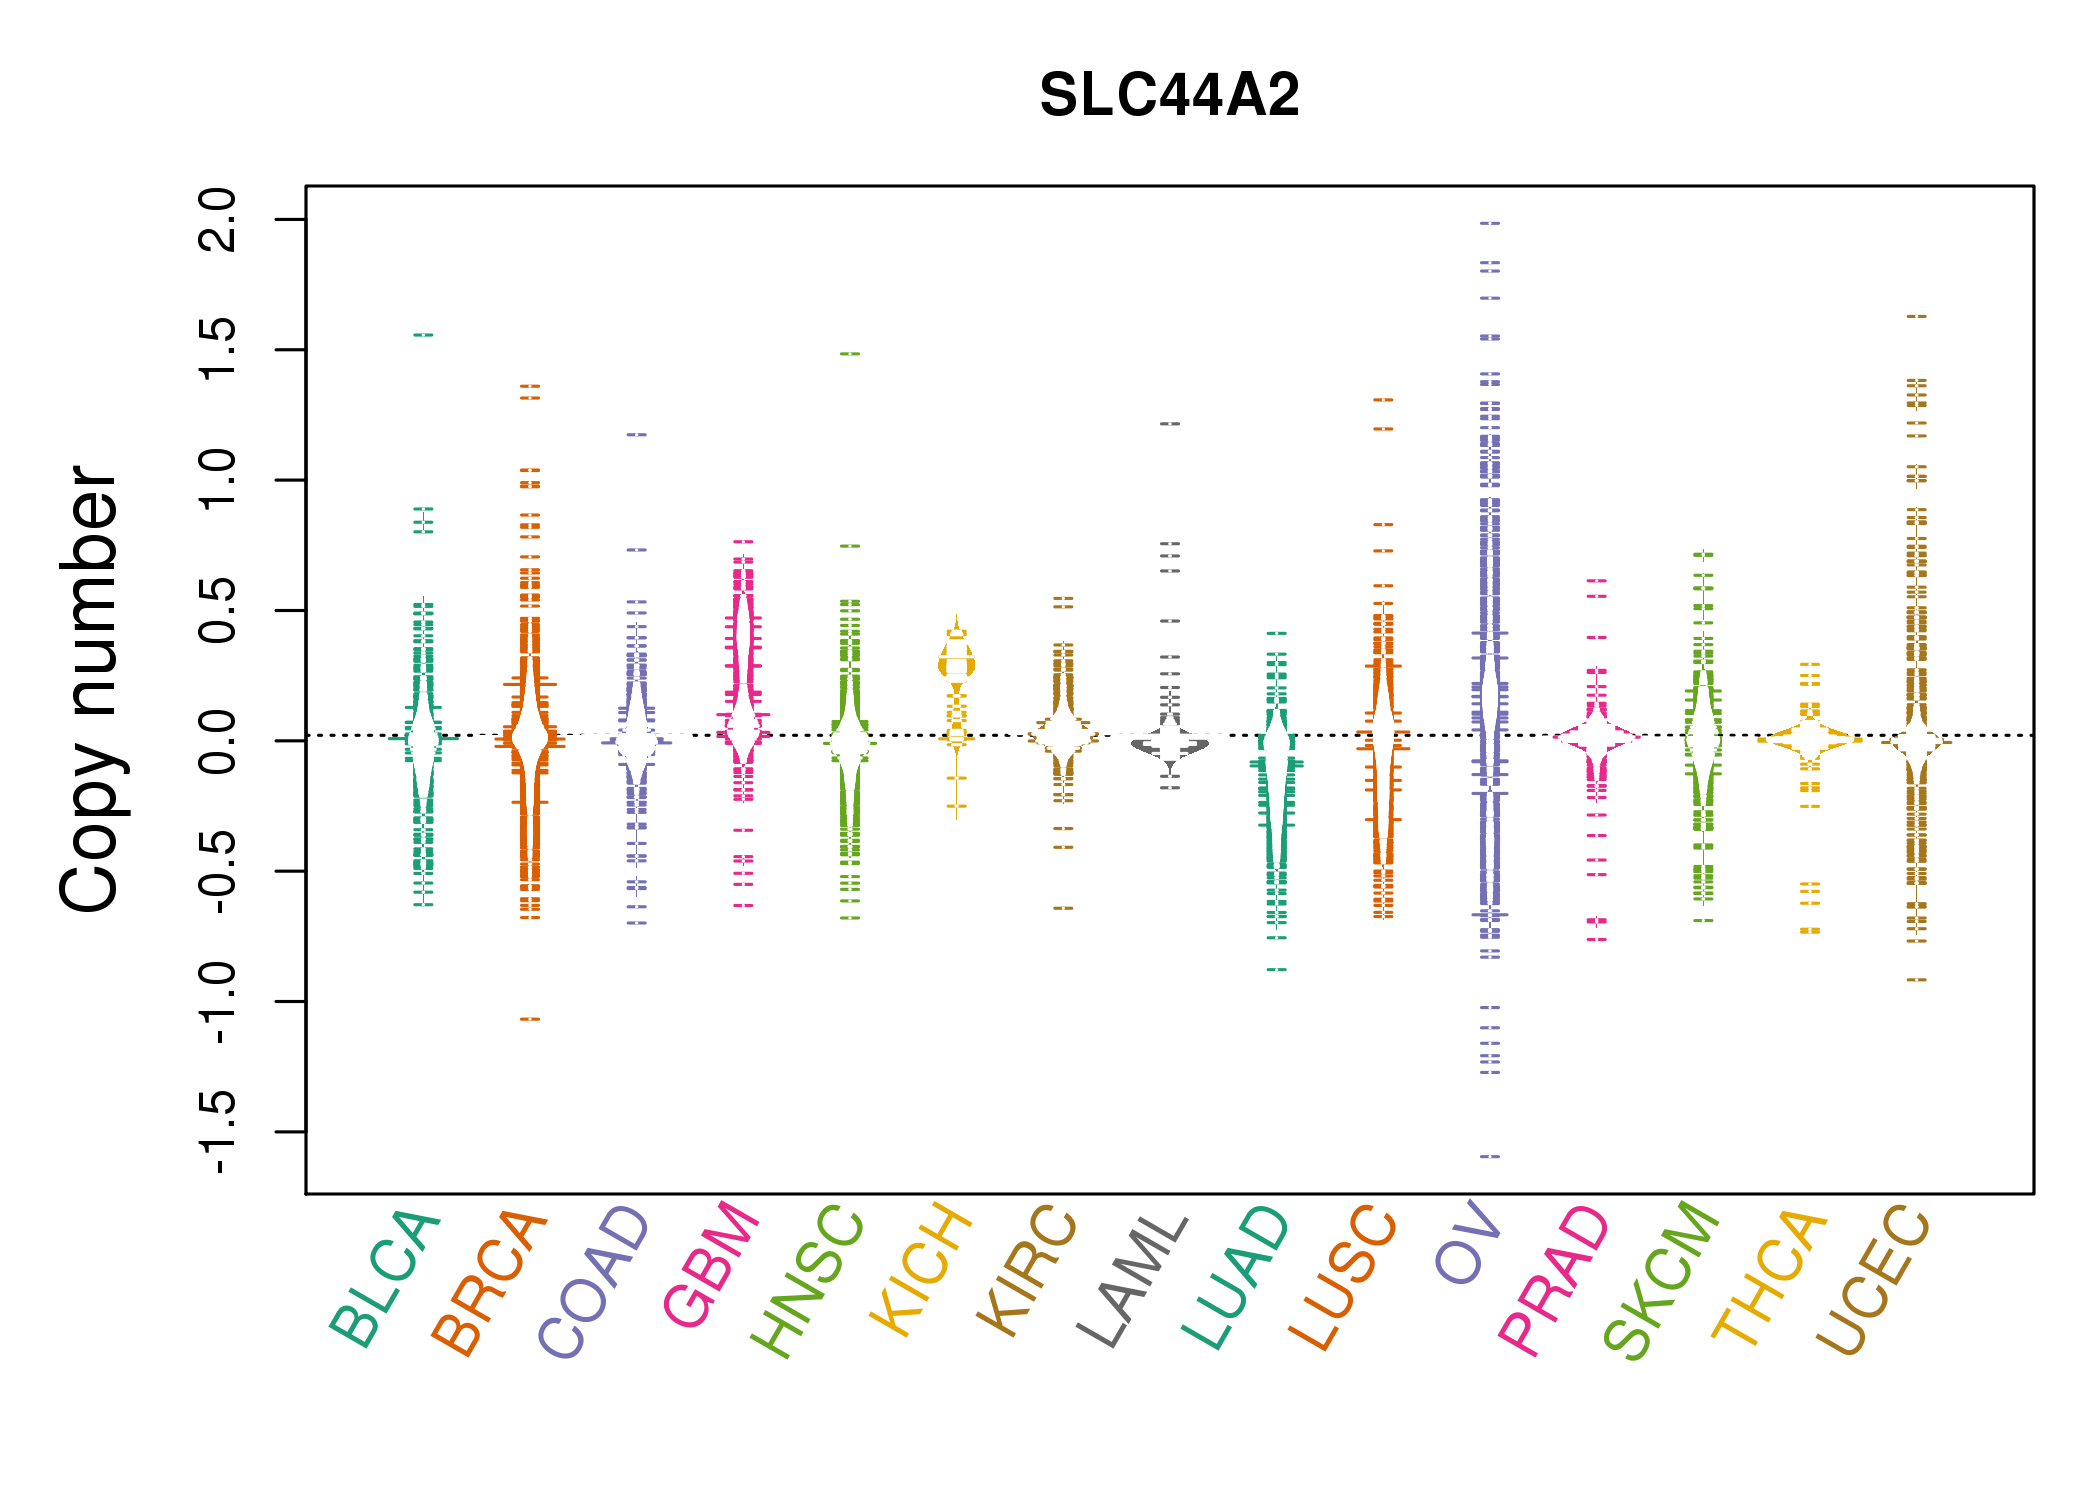 |
| cf) Tissue ID[Tissue type]: BLCA[Bladder Urothelial Carcinoma], BRCA[Breast invasive carcinoma], CESC[Cervical squamous cell carcinoma and endocervical adenocarcinoma], COAD[Colon adenocarcinoma], GBM[Glioblastoma multiforme], Glioma Low Grade, HNSC[Head and Neck squamous cell carcinoma], KICH[Kidney Chromophobe], KIRC[Kidney renal clear cell carcinoma], KIRP[Kidney renal papillary cell carcinoma], LAML[Acute Myeloid Leukemia], LUAD[Lung adenocarcinoma], LUSC[Lung squamous cell carcinoma], OV[Ovarian serous cystadenocarcinoma ], PAAD[Pancreatic adenocarcinoma], PRAD[Prostate adenocarcinoma], SKCM[Skin Cutaneous Melanoma], STAD[Stomach adenocarcinoma], THCA[Thyroid carcinoma], UCEC[Uterine Corpus Endometrial Carcinoma] |
| Top |
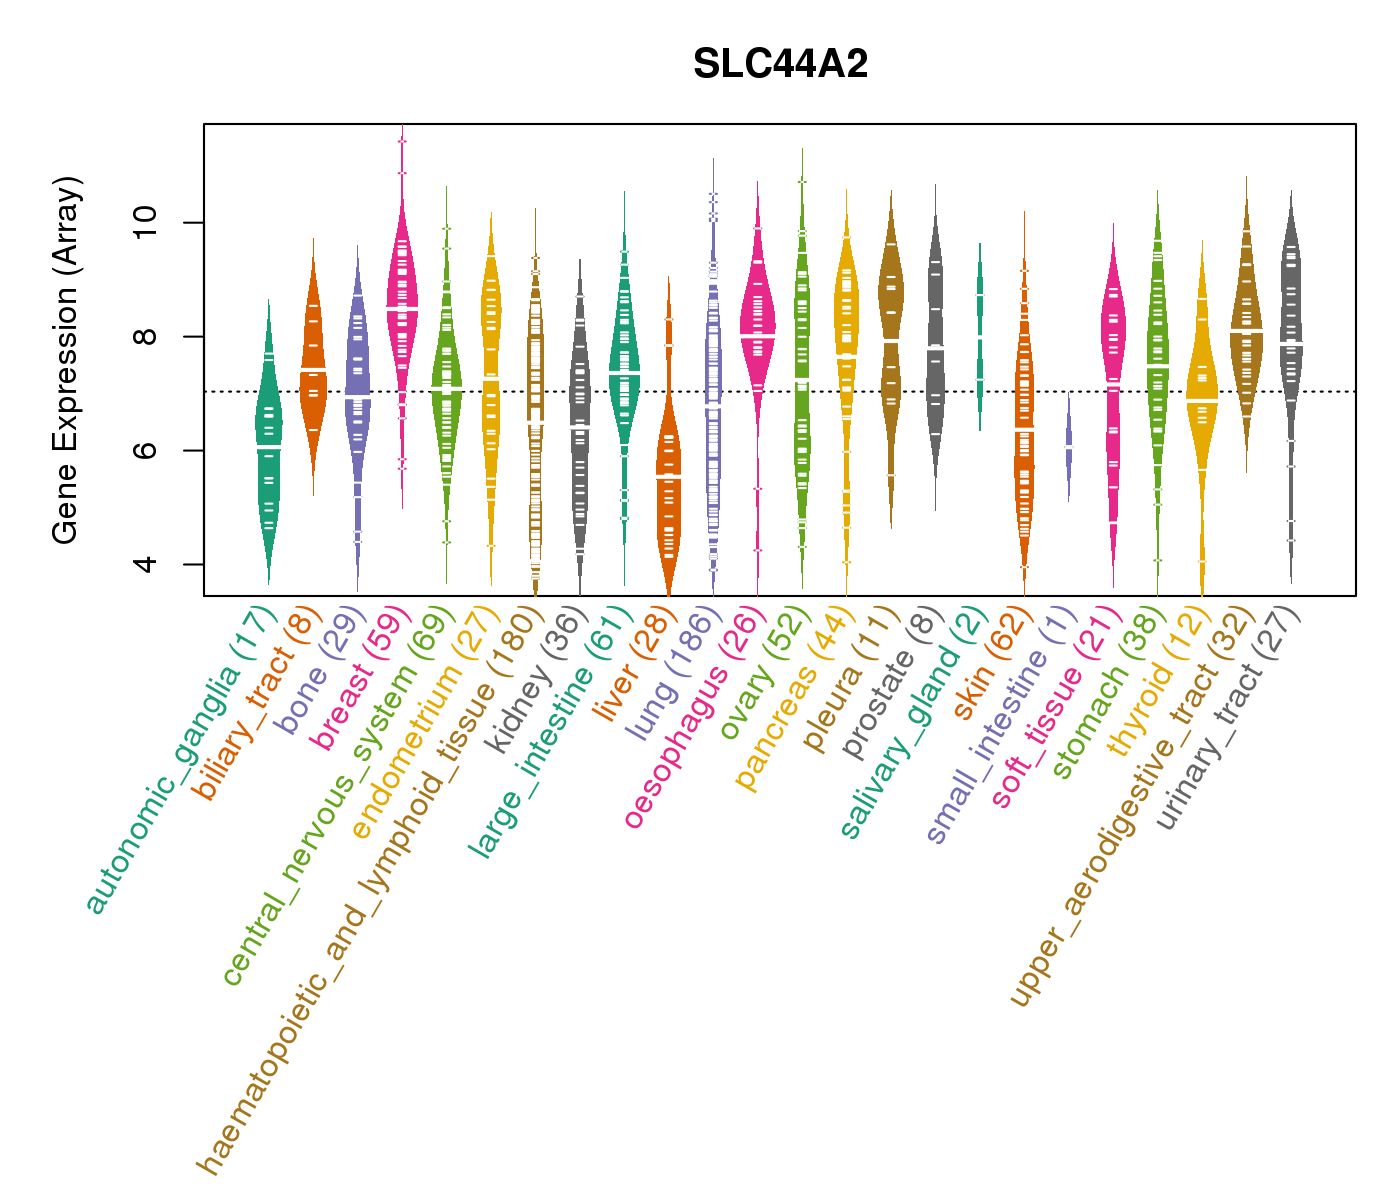
| Gene Expression for SLC44A2 |
| * CCLE gene expression data were extracted from CCLE_Expression_Entrez_2012-10-18.res: Gene-centric RMA-normalized mRNA expression data. |
 |
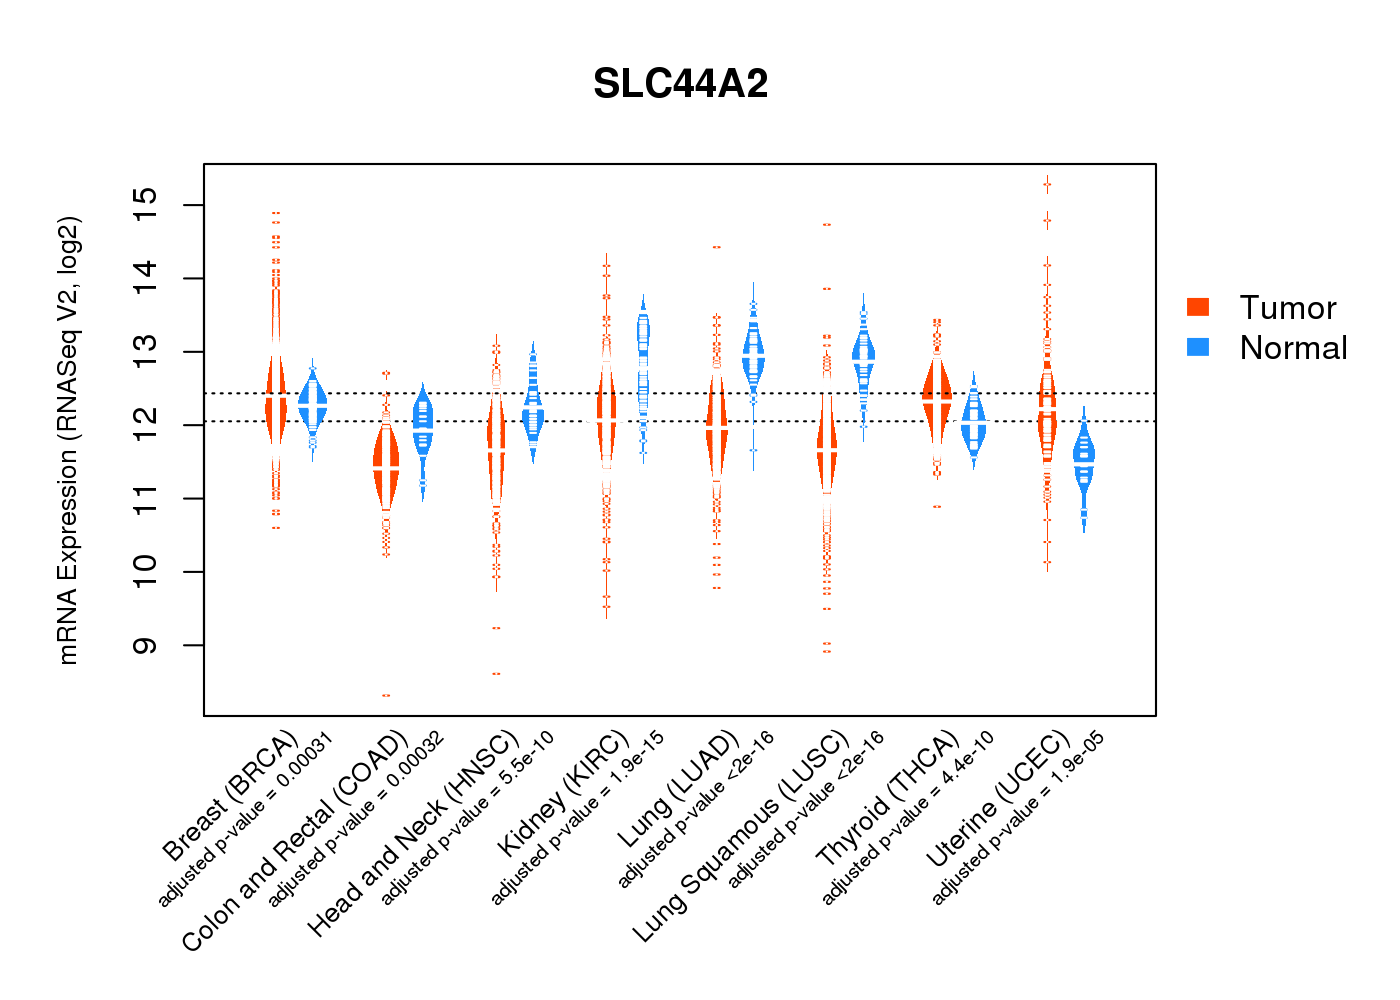
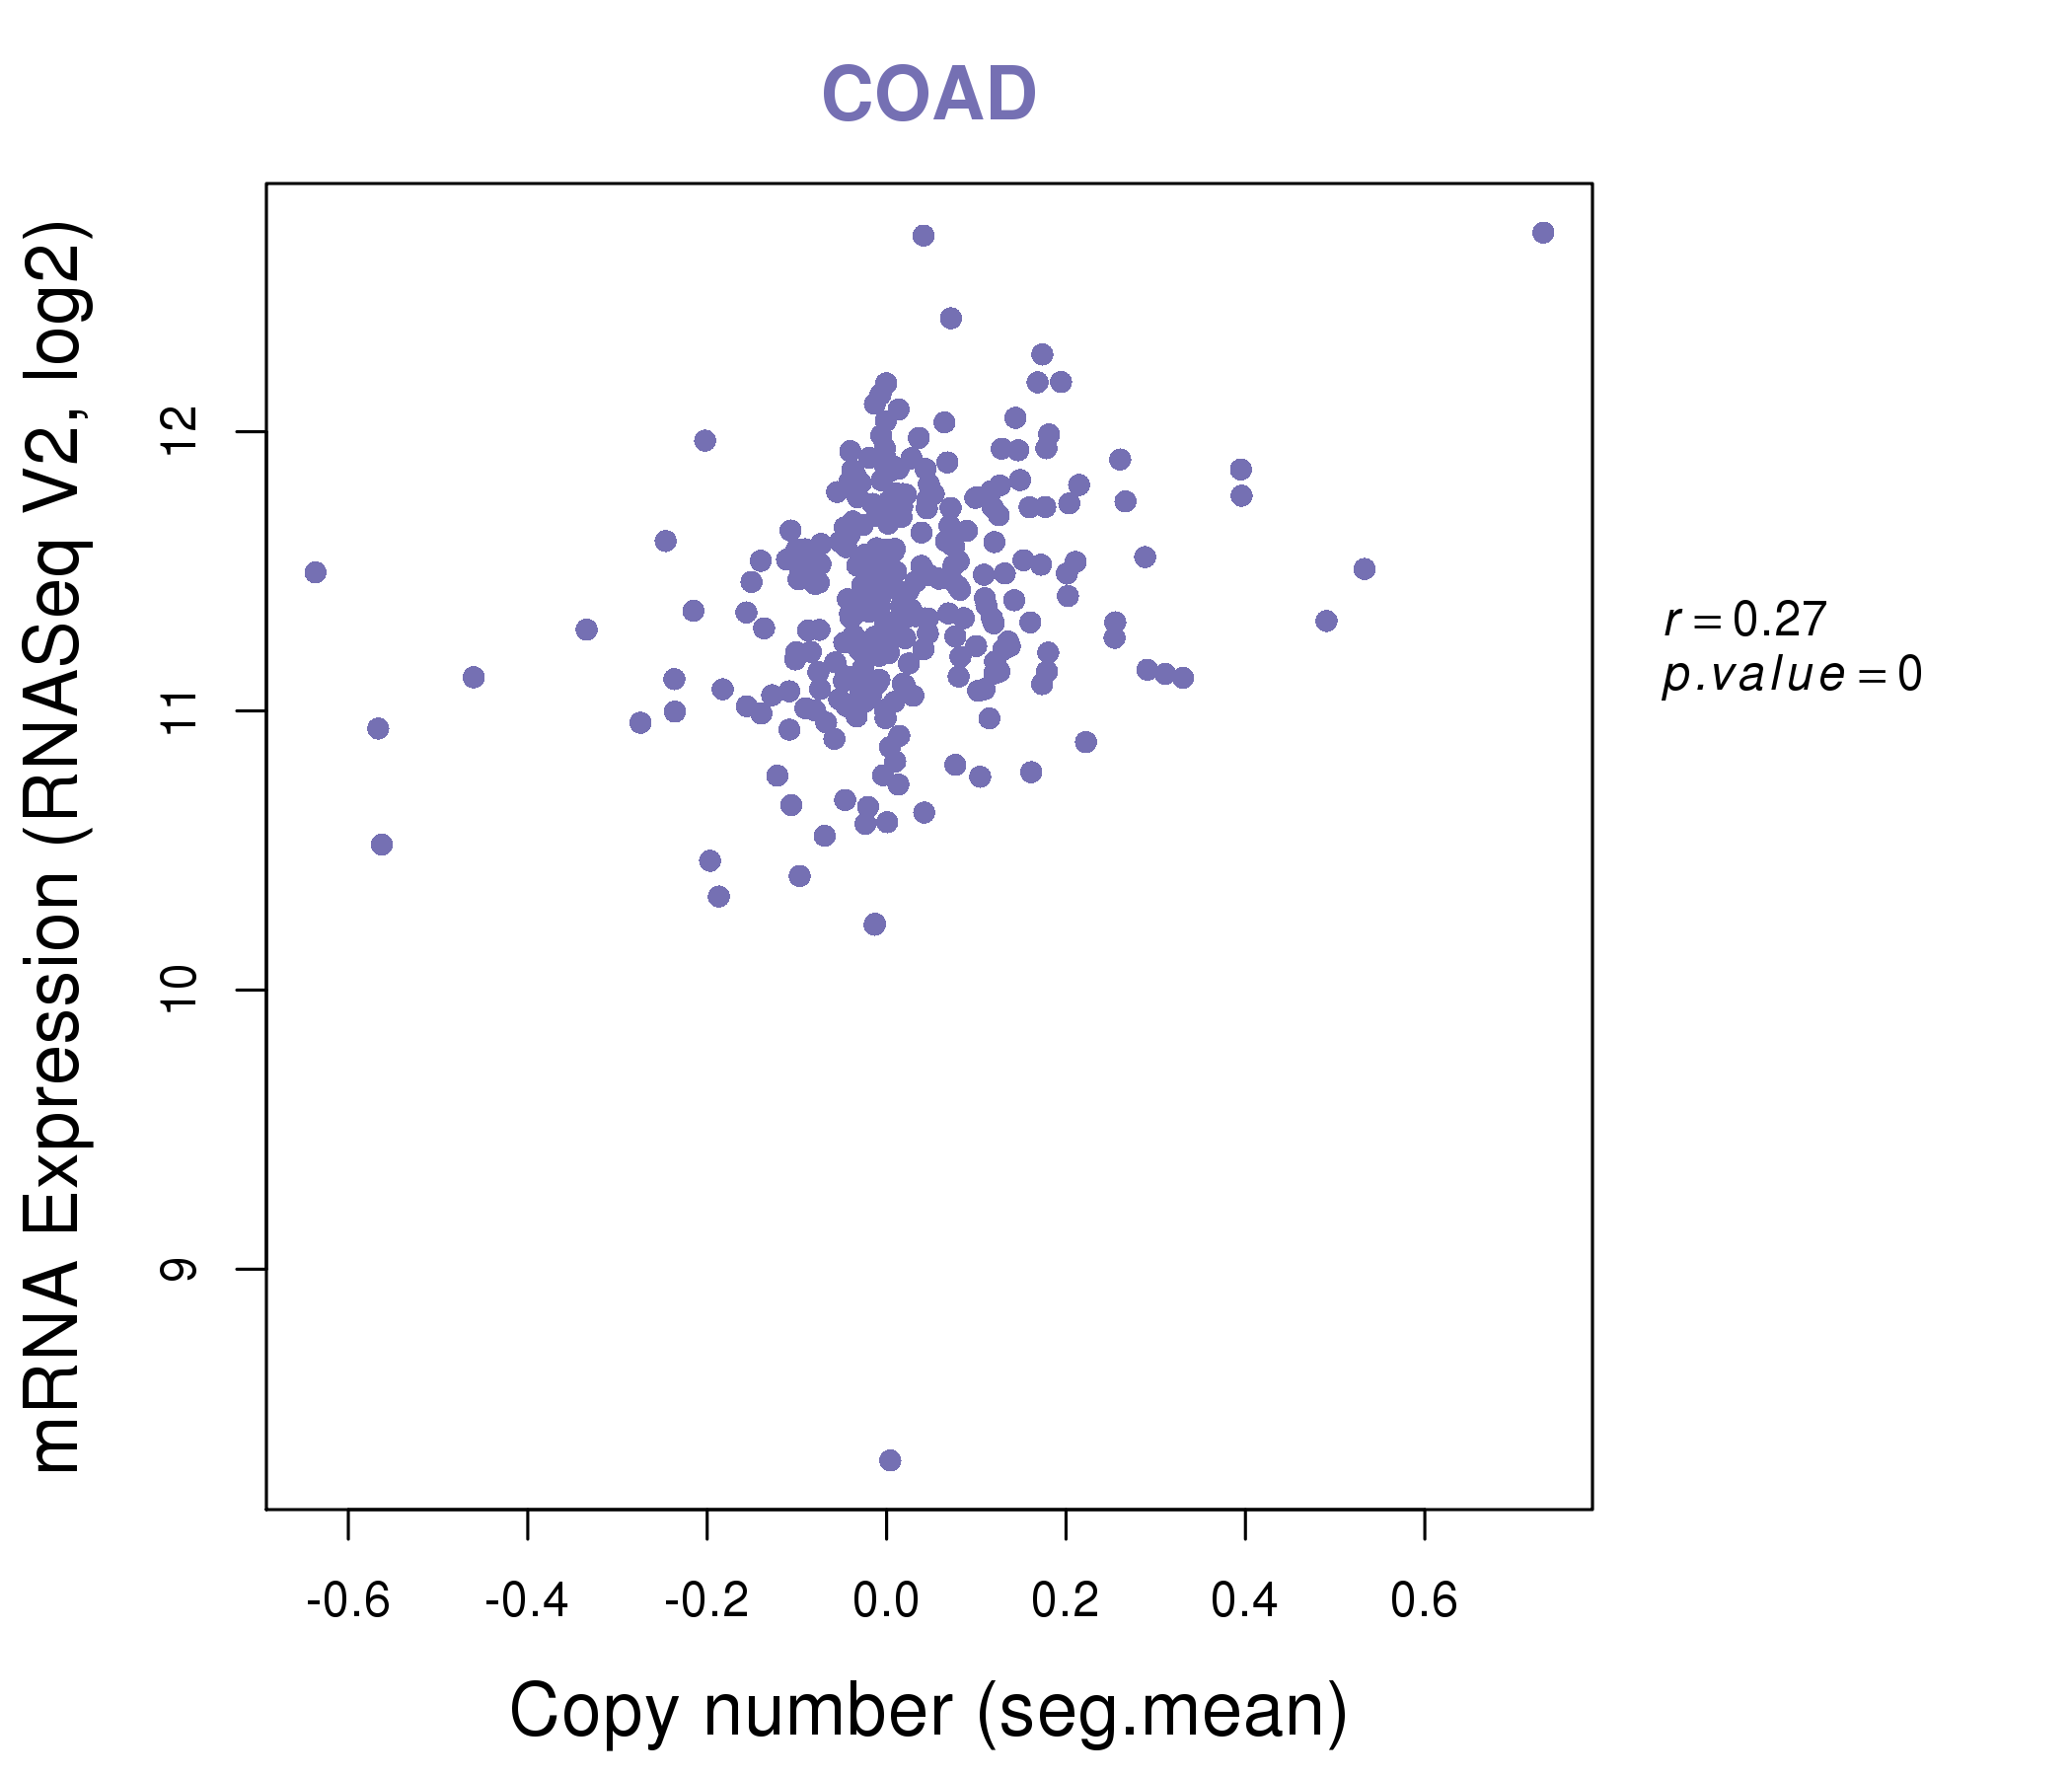
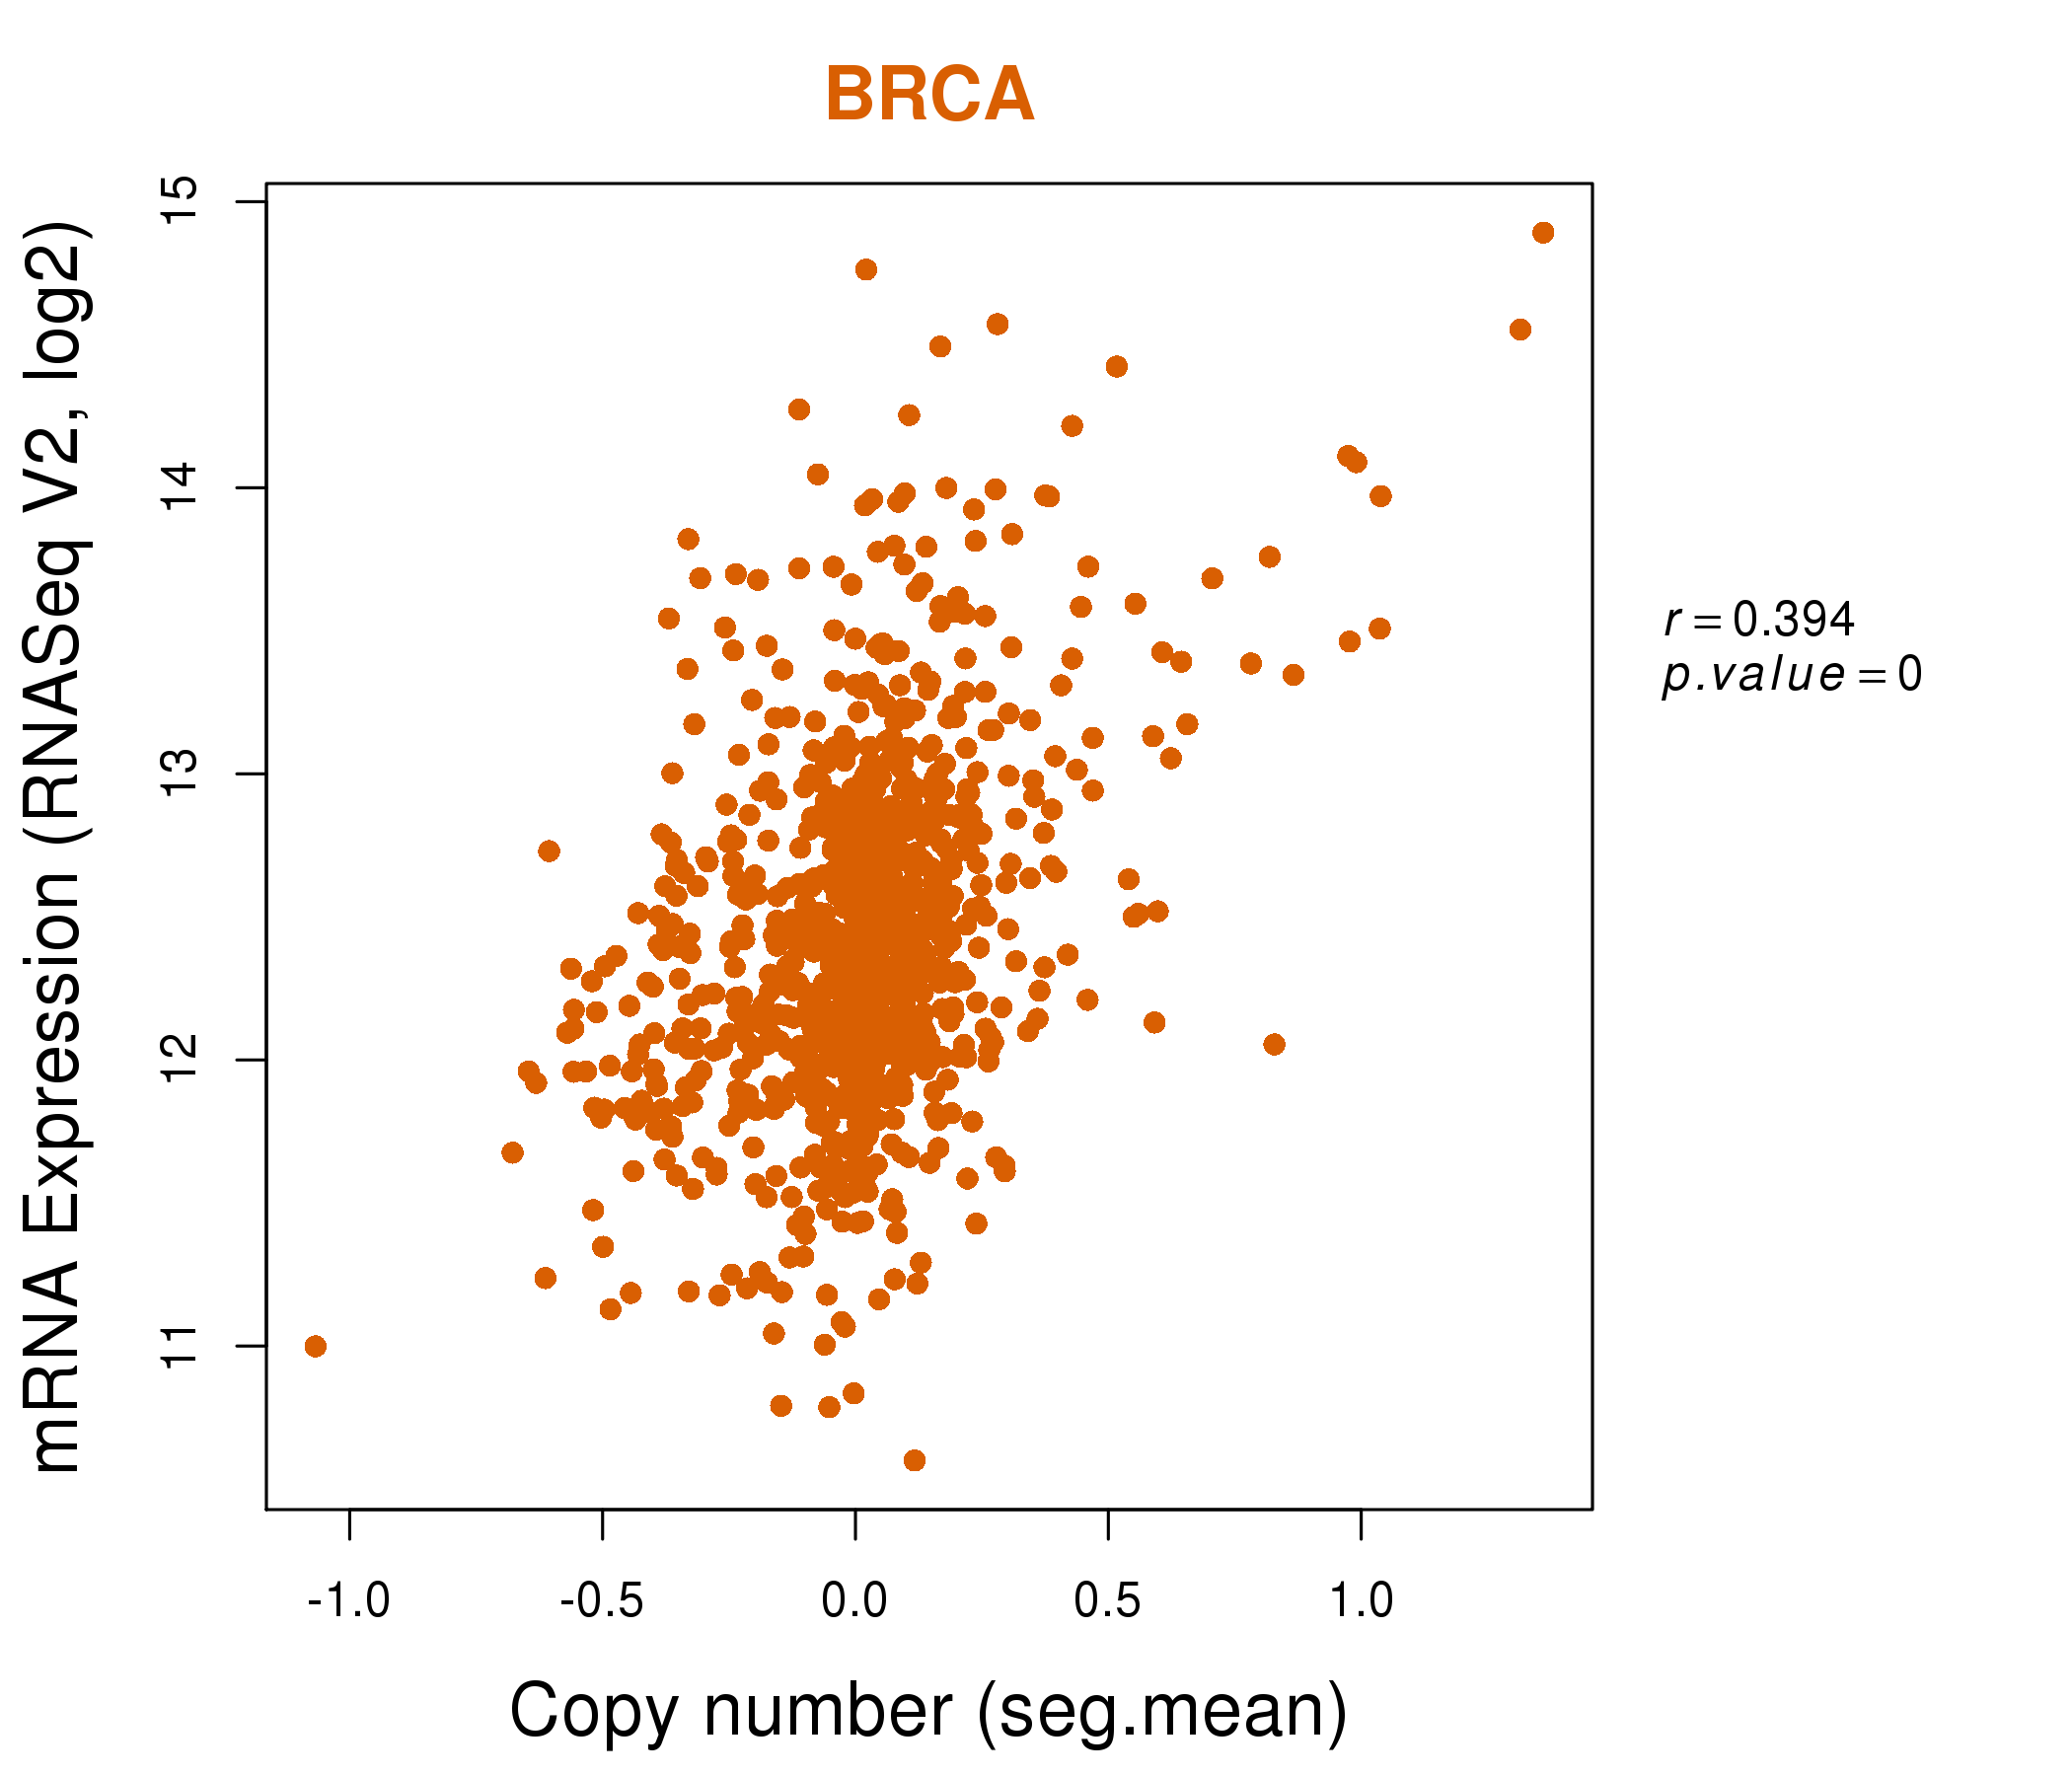
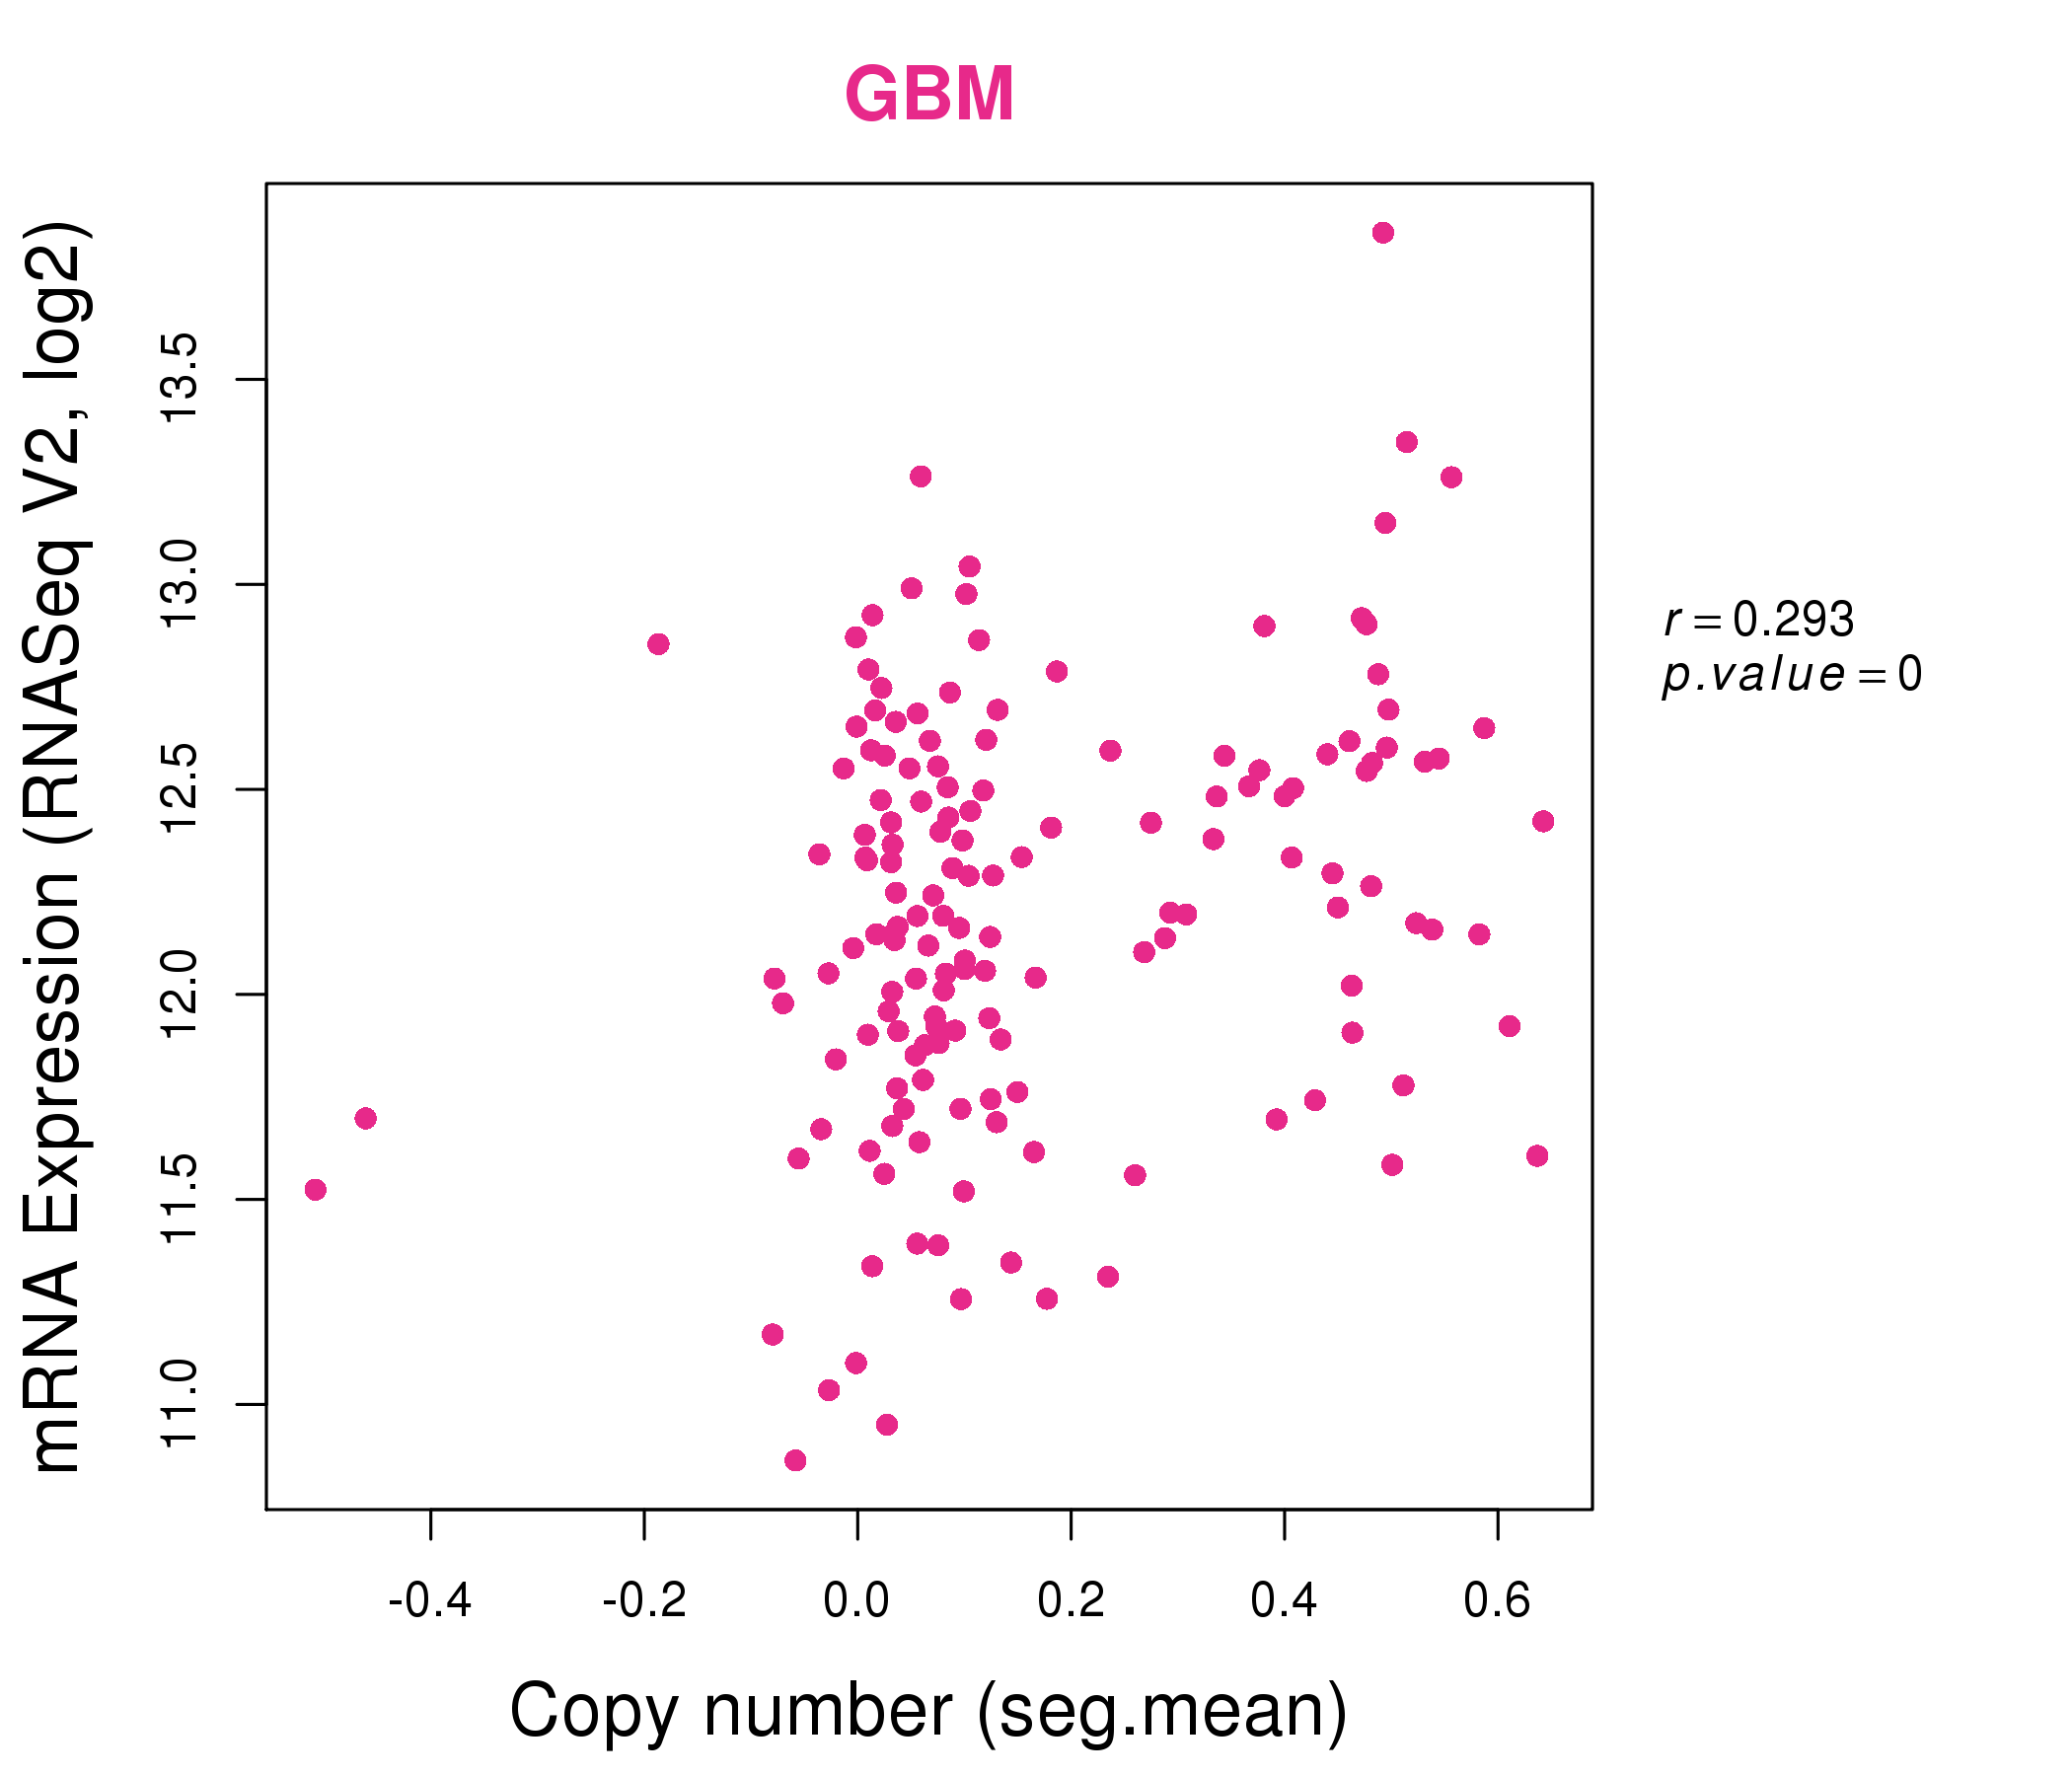
| * Normalized gene expression data of RNASeqV2 was extracted from TCGA using R package TCGA-Assembler. The URLs of all public data files on TCGA DCC data server were gathered at Jan-05-2015. Only eight cancer types have enough normal control samples for differential expression analysis. (t test, adjusted p<0.05 (using Benjamini-Hochberg FDR)) |
 |
| Top |
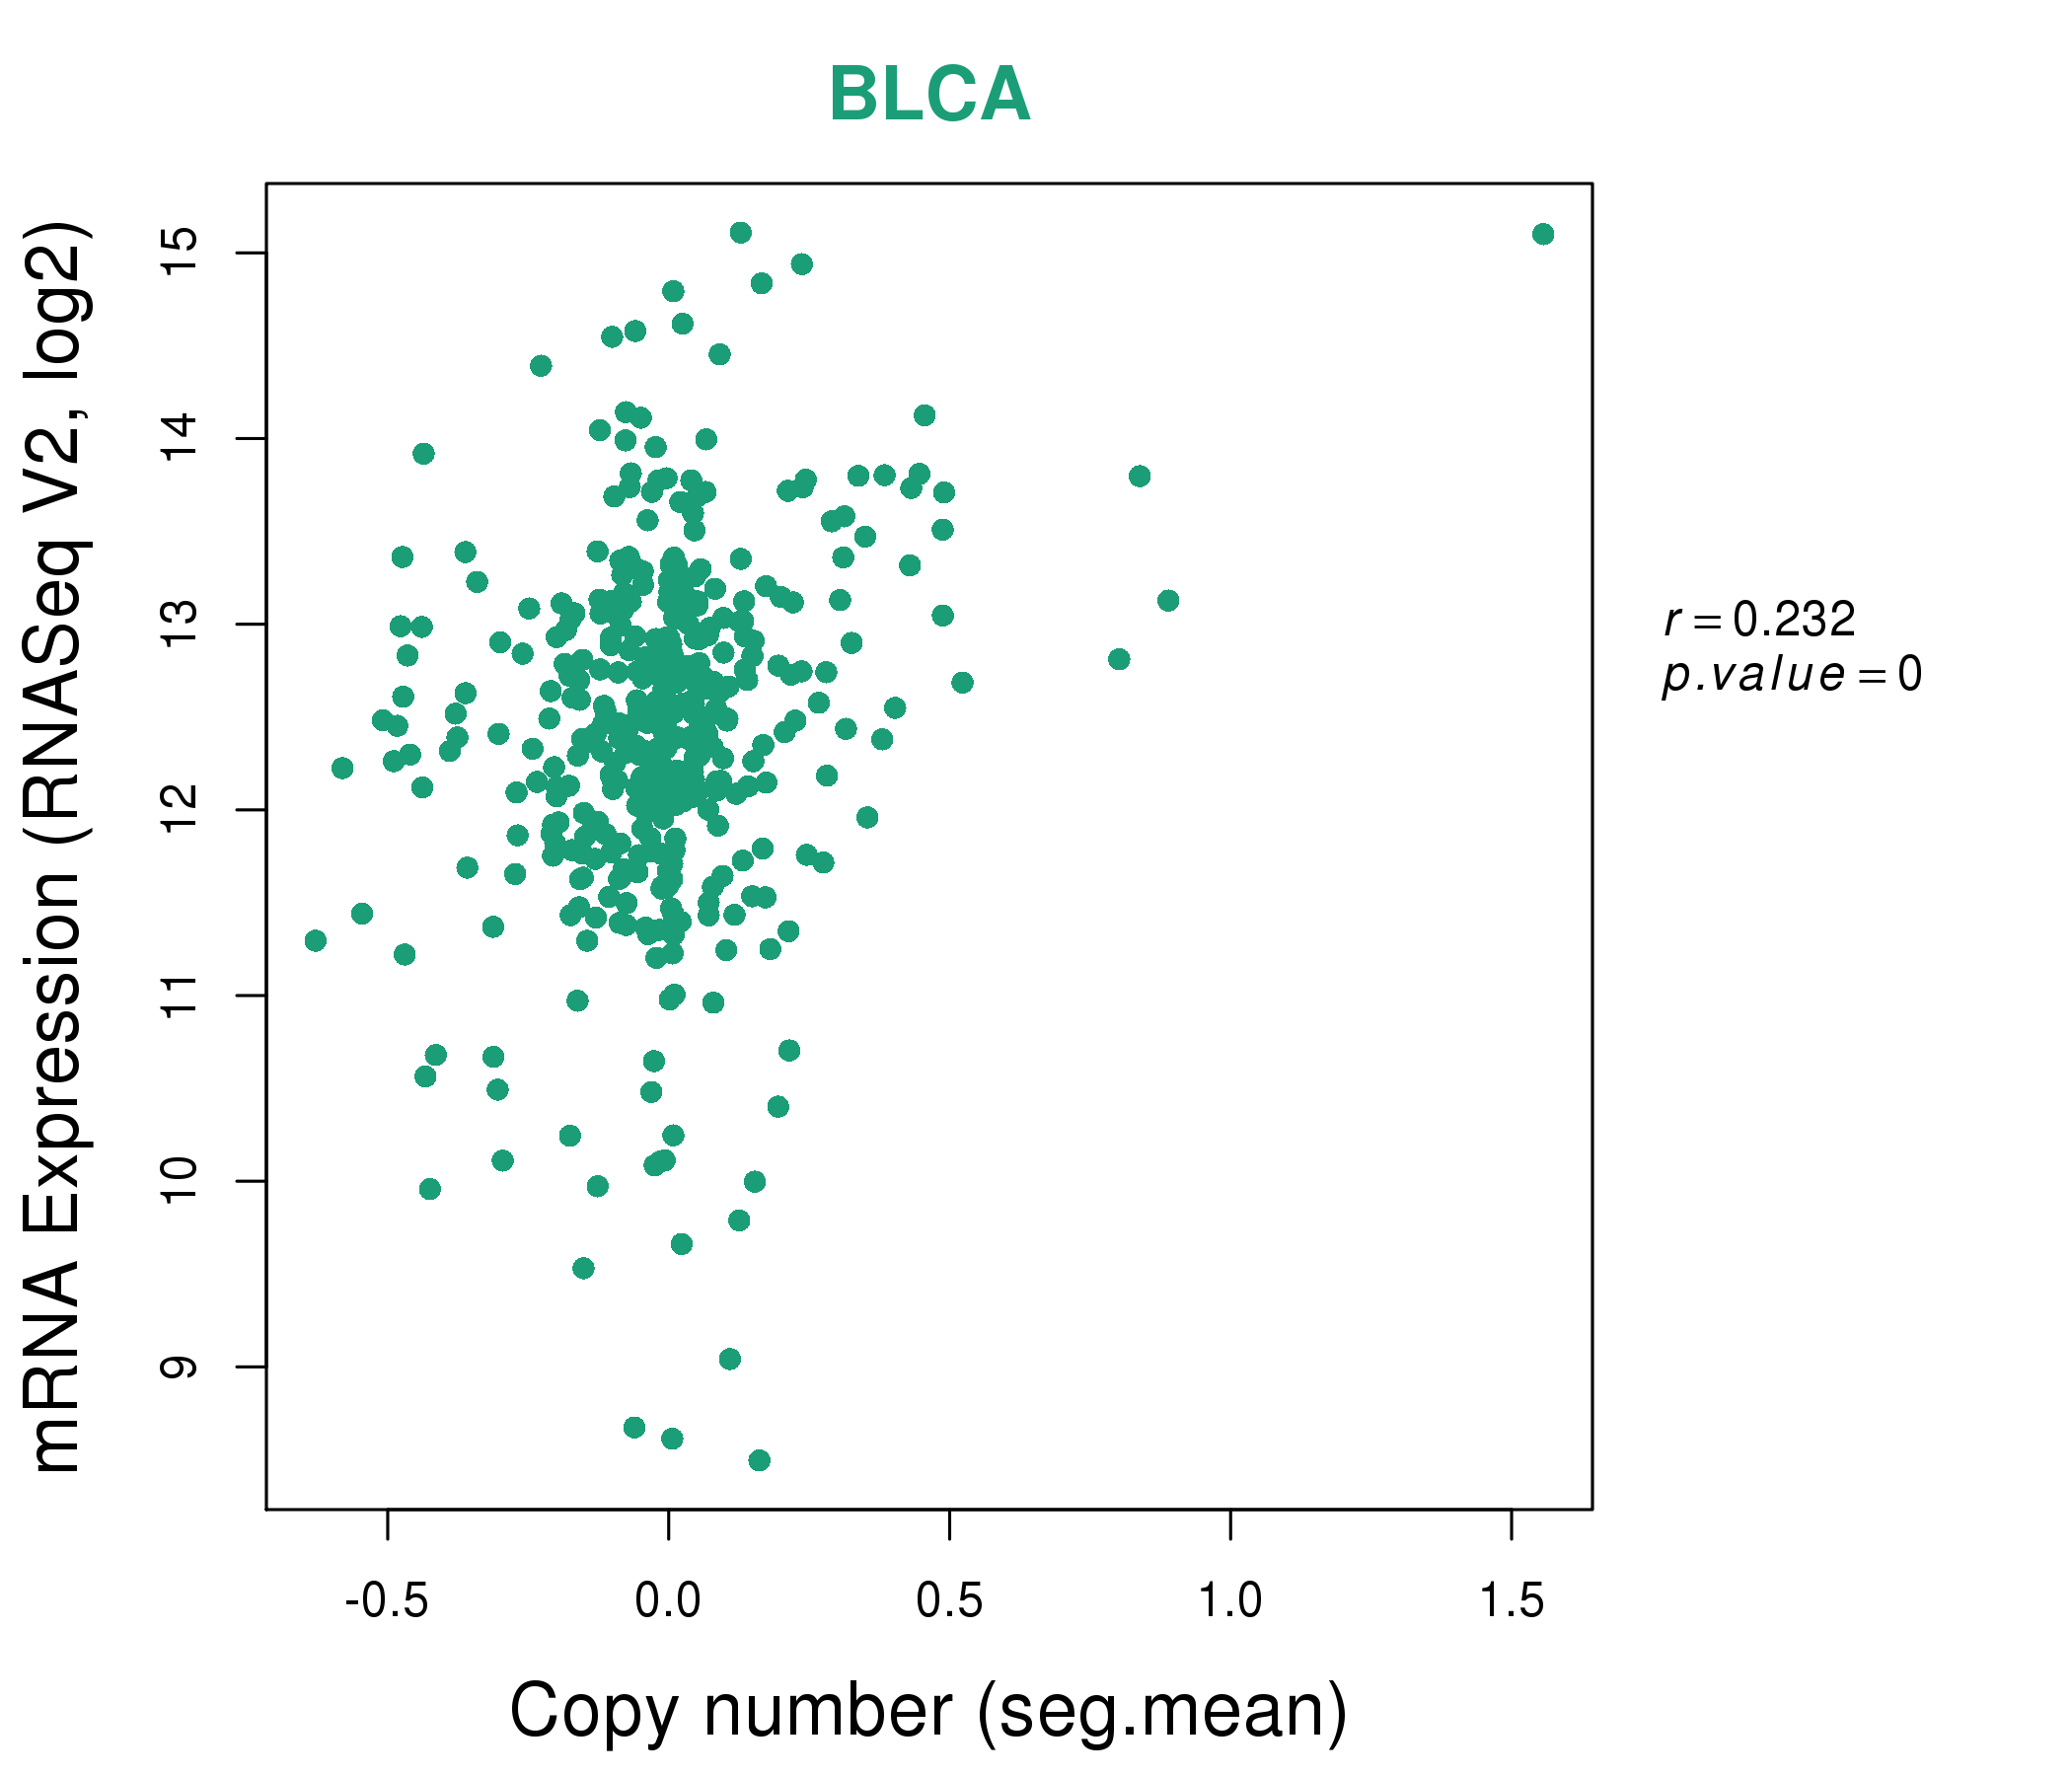
| * This plots show the correlation between CNV and gene expression. |
: Open all plots for all cancer types
 |
|
 |
|
| Top |
| Gene-Gene Network Information |
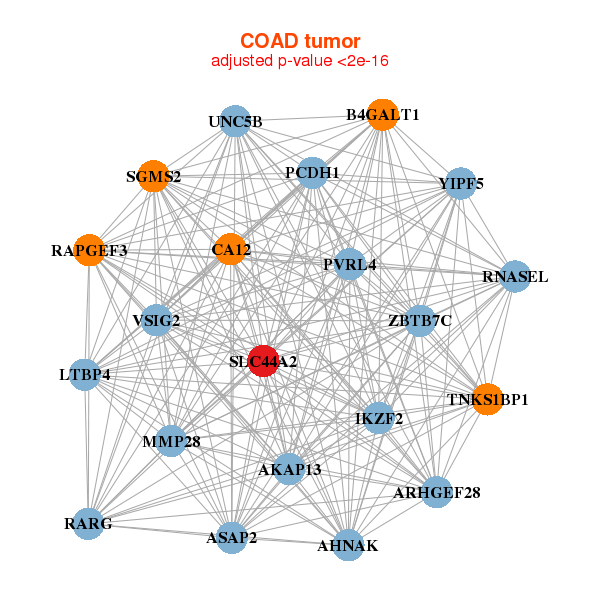
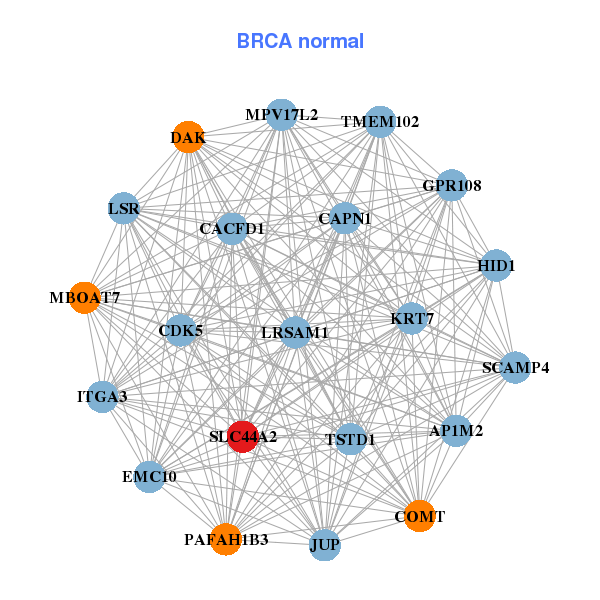
| * Co-Expression network figures were drawn using R package igraph. Only the top 20 genes with the highest correlations were shown. Red circle: input gene, orange circle: cell metabolism gene, sky circle: other gene |
: Open all plots for all cancer types
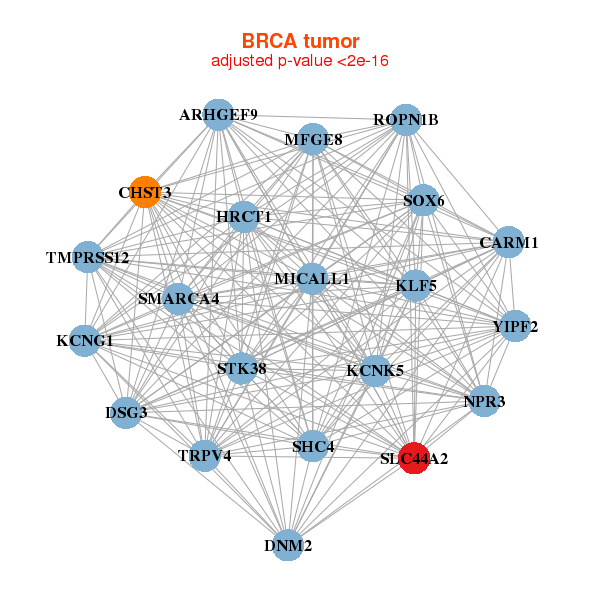 |
|
| ARHGEF9,NPR3,CARM1,CHST3,DNM2,DSG3,HRCT1, KCNG1,KCNK5,KLF5,MFGE8,MICALL1,ROPN1B,SHC4, SLC44A2,SMARCA4,SOX6,STK38,TMPRSS12,TRPV4,YIPF2 | AP1M2,HID1,EMC10,CACFD1,CAPN1,CDK5,COMT, DAK,GPR108,ITGA3,JUP,KRT7,LRSAM1,LSR, MBOAT7,MPV17L2,PAFAH1B3,SCAMP4,SLC44A2,TMEM102,TSTD1 |
 |
|
| AHNAK,AKAP13,ASAP2,B4GALT1,CA12,IKZF2,LTBP4, MMP28,PCDH1,PVRL4,RAPGEF3,RARG,ARHGEF28,RNASEL, SGMS2,SLC44A2,TNKS1BP1,UNC5B,VSIG2,YIPF5,ZBTB7C | APOBR,ATP6AP1,CDH1,CLSTN1,CNNM2,EDC4,GAK, GRAMD4,HNF4A,MARK2,MINK1,MVP,NR2F6,RAB19, SCAP,SLC44A2,SLC9A1,SREBF2,TMEM63B,WWP2,ZBTB7C |
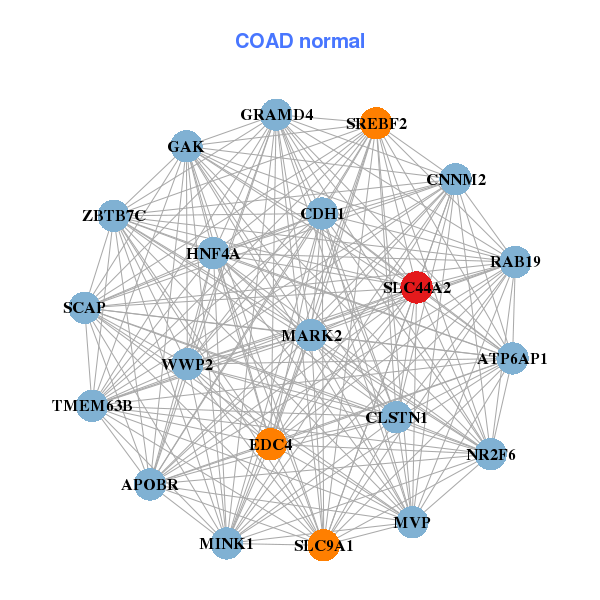
| * Co-Expression network figures were drawn using R package igraph. Only the top 20 genes with the highest correlations were shown. Red circle: input gene, orange circle: cell metabolism gene, sky circle: other gene |
: Open all plots for all cancer types
| Top |
: Open all interacting genes' information including KEGG pathway for all interacting genes from DAVID
| Top |
| Pharmacological Information for SLC44A2 |
| There's no related Drug. |
| Top |
| Cross referenced IDs for SLC44A2 |
| * We obtained these cross-references from Uniprot database. It covers 150 different DBs, 18 categories. http://www.uniprot.org/help/cross_references_section |
: Open all cross reference information
|
Copyright © 2016-Present - The Univsersity of Texas Health Science Center at Houston @ |