|
|||||||||||||||||||||||||||||||||||||||||||||||||||||||||||||||||||||||||||||||||||||||||||||||||||||||||||||||||||||||||||||||||||||||||||||||||||||||||||||||||||||||||||||||||||||||||||||||||||||||||||||||||||||||||||||||||||||||||||||||||||||||||||||||||||||||||||||||||||||||||||||||||||||||||||||||||||||||||||||||||||||||||||||||||||
| |
| Phenotypic Information (metabolism pathway, cancer, disease, phenome) |
| |
| |
| Gene-Gene Network Information: Co-Expression Network, Interacting Genes & KEGG |
| |
|


| Gene Summary for PSMD11 |
| Basic gene info. | Gene symbol | PSMD11 |
| Gene name | proteasome (prosome, macropain) 26S subunit, non-ATPase, 11 | |
| Synonyms | Rpn6|S9|p44.5 | |
| Cytomap | UCSC genome browser: 17q11.2 | |
| Genomic location | chr17 :30771501-30808042 | |
| Type of gene | protein-coding | |
| RefGenes | NM_001270482.1, NM_002815.3, | |
| Ensembl id | ENSG00000108671 | |
| Description | 26S proteasome non-ATPase regulatory subunit 1126S proteasome regulatory subunit 926S proteasome regulatory subunit RPN626S proteasome regulatory subunit S926S proteasome regulatory subunit p44.5 | |
| Modification date | 20141207 | |
| dbXrefs | MIM : 604449 | |
| HGNC : HGNC | ||
| Ensembl : ENSG00000108671 | ||
| HPRD : 05119 | ||
| Vega : OTTHUMG00000132811 | ||
| Protein | UniProt: O00231 go to UniProt's Cross Reference DB Table | |
| Expression | CleanEX: HS_PSMD11 | |
| BioGPS: 5717 | ||
| Gene Expression Atlas: ENSG00000108671 | ||
| The Human Protein Atlas: ENSG00000108671 | ||
| Pathway | NCI Pathway Interaction Database: PSMD11 | |
| KEGG: PSMD11 | ||
| REACTOME: PSMD11 | ||
| ConsensusPathDB | ||
| Pathway Commons: PSMD11 | ||
| Metabolism | MetaCyc: PSMD11 | |
| HUMANCyc: PSMD11 | ||
| Regulation | Ensembl's Regulation: ENSG00000108671 | |
| miRBase: chr17 :30,771,501-30,808,042 | ||
| TargetScan: NM_001270482 | ||
| cisRED: ENSG00000108671 | ||
| Context | iHOP: PSMD11 | |
| cancer metabolism search in PubMed: PSMD11 | ||
| UCL Cancer Institute: PSMD11 | ||
| Assigned class in ccmGDB | B - This gene belongs to cancer gene. | |
| Top |
| Phenotypic Information for PSMD11(metabolism pathway, cancer, disease, phenome) |
| Cancer | CGAP: PSMD11 |
| Familial Cancer Database: PSMD11 | |
| * This gene is included in those cancer gene databases. |
|
|
|
|
|
| . | |||||||||||||||||||||||||||||||||||||||||||||||||||||||||||||||||||||||||||||||||||||||||||||||||||||||||||||||||||||||||||||||||||||||||||||||||||||||||||||||||||||||||||||||||||||||||||||||||||||||||||||||||||||||||||||||||||||||||||||||||||||||||||||||||||||||||||||||||||||||||||||||||||||||||||||||||||||||||||||||||||||||||||||
Oncogene 1 | Significant driver gene in | ||||||||||||||||||||||||||||||||||||||||||||||||||||||||||||||||||||||||||||||||||||||||||||||||||||||||||||||||||||||||||||||||||||||||||||||||||||||||||||||||||||||||||||||||||||||||||||||||||||||||||||||||||||||||||||||||||||||||||||||||||||||||||||||||||||||||||||||||||||||||||||||||||||||||||||||||||||||||||||||||||||||||||||||||||
| cf) number; DB name 1 Oncogene; http://nar.oxfordjournals.org/content/35/suppl_1/D721.long, 2 Tumor Suppressor gene; https://bioinfo.uth.edu/TSGene/, 3 Cancer Gene Census; http://www.nature.com/nrc/journal/v4/n3/abs/nrc1299.html, 4 CancerGenes; http://nar.oxfordjournals.org/content/35/suppl_1/D721.long, 5 Network of Cancer Gene; http://ncg.kcl.ac.uk/index.php, 1Therapeutic Vulnerabilities in Cancer; http://cbio.mskcc.org/cancergenomics/statius/ |
| REACTOME_METABOLISM_OF_AMINO_ACIDS_AND_DERIVATIVES REACTOME_METABOLISM_OF_MRNA REACTOME_METABOLISM_OF_RNA | |
| OMIM | 604449; gene. |
| Orphanet | |
| Disease | KEGG Disease: PSMD11 |
| MedGen: PSMD11 (Human Medical Genetics with Condition) | |
| ClinVar: PSMD11 | |
| Phenotype | MGI: PSMD11 (International Mouse Phenotyping Consortium) |
| PhenomicDB: PSMD11 | |
| Mutations for PSMD11 |
| * Under tables are showing count per each tissue to give us broad intuition about tissue specific mutation patterns.You can go to the detailed page for each mutation database's web site. |
| There's no structural variation information in COSMIC data for this gene. |
| * From mRNA Sanger sequences, Chitars2.0 arranged chimeric transcripts. This table shows PSMD11 related fusion information. |
| ID | Head Gene | Tail Gene | Accession | Gene_a | qStart_a | qEnd_a | Chromosome_a | tStart_a | tEnd_a | Gene_a | qStart_a | qEnd_a | Chromosome_a | tStart_a | tEnd_a |
| AI291788 | LINC00340 | 87 | 112 | 6 | 22054080 | 22054105 | PSMD11 | 112 | 458 | 17 | 30800904 | 30806905 | |
| BF083127 | PSMD11 | 6 | 62 | 17 | 30806292 | 30806348 | PSMD11 | 55 | 222 | 17 | 30796104 | 30800878 | |
| AW835516 | PSMD11 | 161 | 180 | 17 | 30777413 | 30777432 | CTNND1 | 165 | 564 | 11 | 57536507 | 57537167 | |
| Top |
| Mutation type/ Tissue ID | brca | cns | cerv | endome | haematopo | kidn | Lintest | liver | lung | ns | ovary | pancre | prost | skin | stoma | thyro | urina | |||
| Total # sample | 1 | 1 | ||||||||||||||||||
| GAIN (# sample) | 1 | |||||||||||||||||||
| LOSS (# sample) | 1 |
| cf) Tissue ID; Tissue type (1; Breast, 2; Central_nervous_system, 3; Cervix, 4; Endometrium, 5; Haematopoietic_and_lymphoid_tissue, 6; Kidney, 7; Large_intestine, 8; Liver, 9; Lung, 10; NS, 11; Ovary, 12; Pancreas, 13; Prostate, 14; Skin, 15; Stomach, 16; Thyroid, 17; Urinary_tract) |
| Top |
|
 |
| Top |
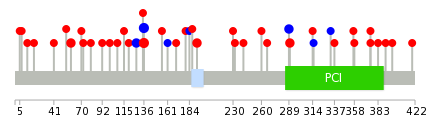
| Stat. for Non-Synonymous SNVs (# total SNVs=34) | (# total SNVs=8) |
 |  |
(# total SNVs=1) | (# total SNVs=0) |
 |
| Top |
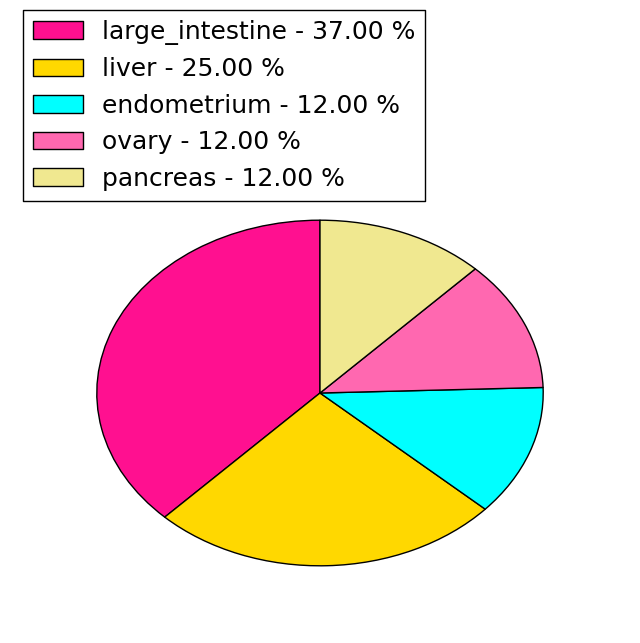
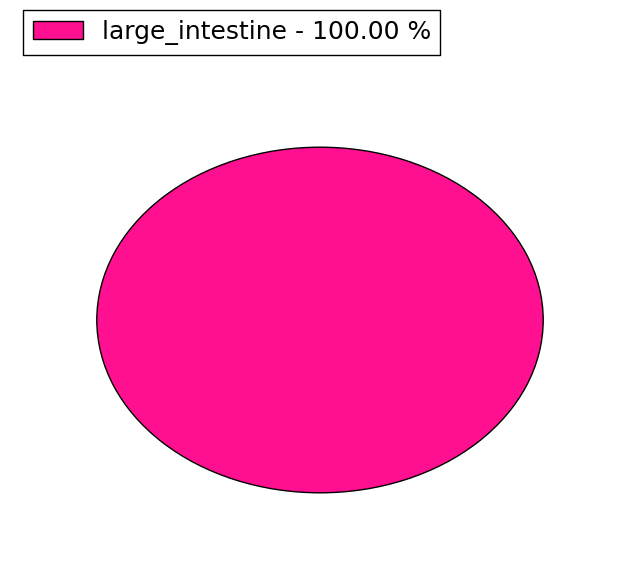
| * When you move the cursor on each content, you can see more deailed mutation information on the Tooltip. Those are primary_site,primary_histology,mutation(aa),pubmedID. |
| GRCh37 position | Mutation(aa) | Unique sampleID count |
| chr17:30791555-30791555 | p.L136S | 3 |
| chr17:30804557-30804557 | p.V290M | 2 |
| chr17:30791091-30791091 | p.E115K | 2 |
| chr17:30791132-30791132 | p.A128A | 2 |
| chr17:30796143-30796143 | p.S192Y | 2 |
| chr17:30774048-30774048 | p.K59N | 2 |
| chr17:30791554-30791554 | p.L136L | 2 |
| chr17:30806861-30806861 | p.? | 2 |
| chr17:30807212-30807212 | p.H375N | 2 |
| chr17:30804556-30804556 | p.C289C | 2 |
| Top |
|
 |
| Point Mutation/ Tissue ID | 1 | 2 | 3 | 4 | 5 | 6 | 7 | 8 | 9 | 10 | 11 | 12 | 13 | 14 | 15 | 16 | 17 | 18 | 19 | 20 |
| # sample | 2 | 2 | 9 | 3 | 2 | 5 | 1 | 1 | 1 | 3 | 7 | |||||||||
| # mutation | 2 | 2 | 6 | 3 | 2 | 5 | 1 | 1 | 1 | 3 | 7 | |||||||||
| nonsynonymous SNV | 2 | 2 | 4 | 1 | 2 | 5 | 1 | 2 | 6 | |||||||||||
| synonymous SNV | 2 | 2 | 1 | 1 | 1 | 1 |
| cf) Tissue ID; Tissue type (1; BLCA[Bladder Urothelial Carcinoma], 2; BRCA[Breast invasive carcinoma], 3; CESC[Cervical squamous cell carcinoma and endocervical adenocarcinoma], 4; COAD[Colon adenocarcinoma], 5; GBM[Glioblastoma multiforme], 6; Glioma Low Grade, 7; HNSC[Head and Neck squamous cell carcinoma], 8; KICH[Kidney Chromophobe], 9; KIRC[Kidney renal clear cell carcinoma], 10; KIRP[Kidney renal papillary cell carcinoma], 11; LAML[Acute Myeloid Leukemia], 12; LUAD[Lung adenocarcinoma], 13; LUSC[Lung squamous cell carcinoma], 14; OV[Ovarian serous cystadenocarcinoma ], 15; PAAD[Pancreatic adenocarcinoma], 16; PRAD[Prostate adenocarcinoma], 17; SKCM[Skin Cutaneous Melanoma], 18:STAD[Stomach adenocarcinoma], 19:THCA[Thyroid carcinoma], 20:UCEC[Uterine Corpus Endometrial Carcinoma]) |
| Top |
| * We represented just top 10 SNVs. When you move the cursor on each content, you can see more deailed mutation information on the Tooltip. Those are primary_site, primary_histology, mutation(aa), pubmedID. |
| Genomic Position | Mutation(aa) | Unique sampleID count |
| chr17:30791555 | p.L136S,PSMD11 | 3 |
| chr17:30796051 | p.V290M,PSMD11 | 2 |
| chr17:30804557 | p.L136L,PSMD11 | 2 |
| chr17:30791554 | p.D161D,PSMD11 | 2 |
| chr17:30771600 | p.M260V,PSMD11 | 1 |
| chr17:30806346 | p.D25V,PSMD11 | 1 |
| chr17:30771615 | p.A280A,PSMD11 | 1 |
| chr17:30791556 | p.E40Q,PSMD11 | 1 |
| chr17:30806355 | p.C289C,PSMD11 | 1 |
| chr17:30773989 | p.G54R,PSMD11 | 1 |
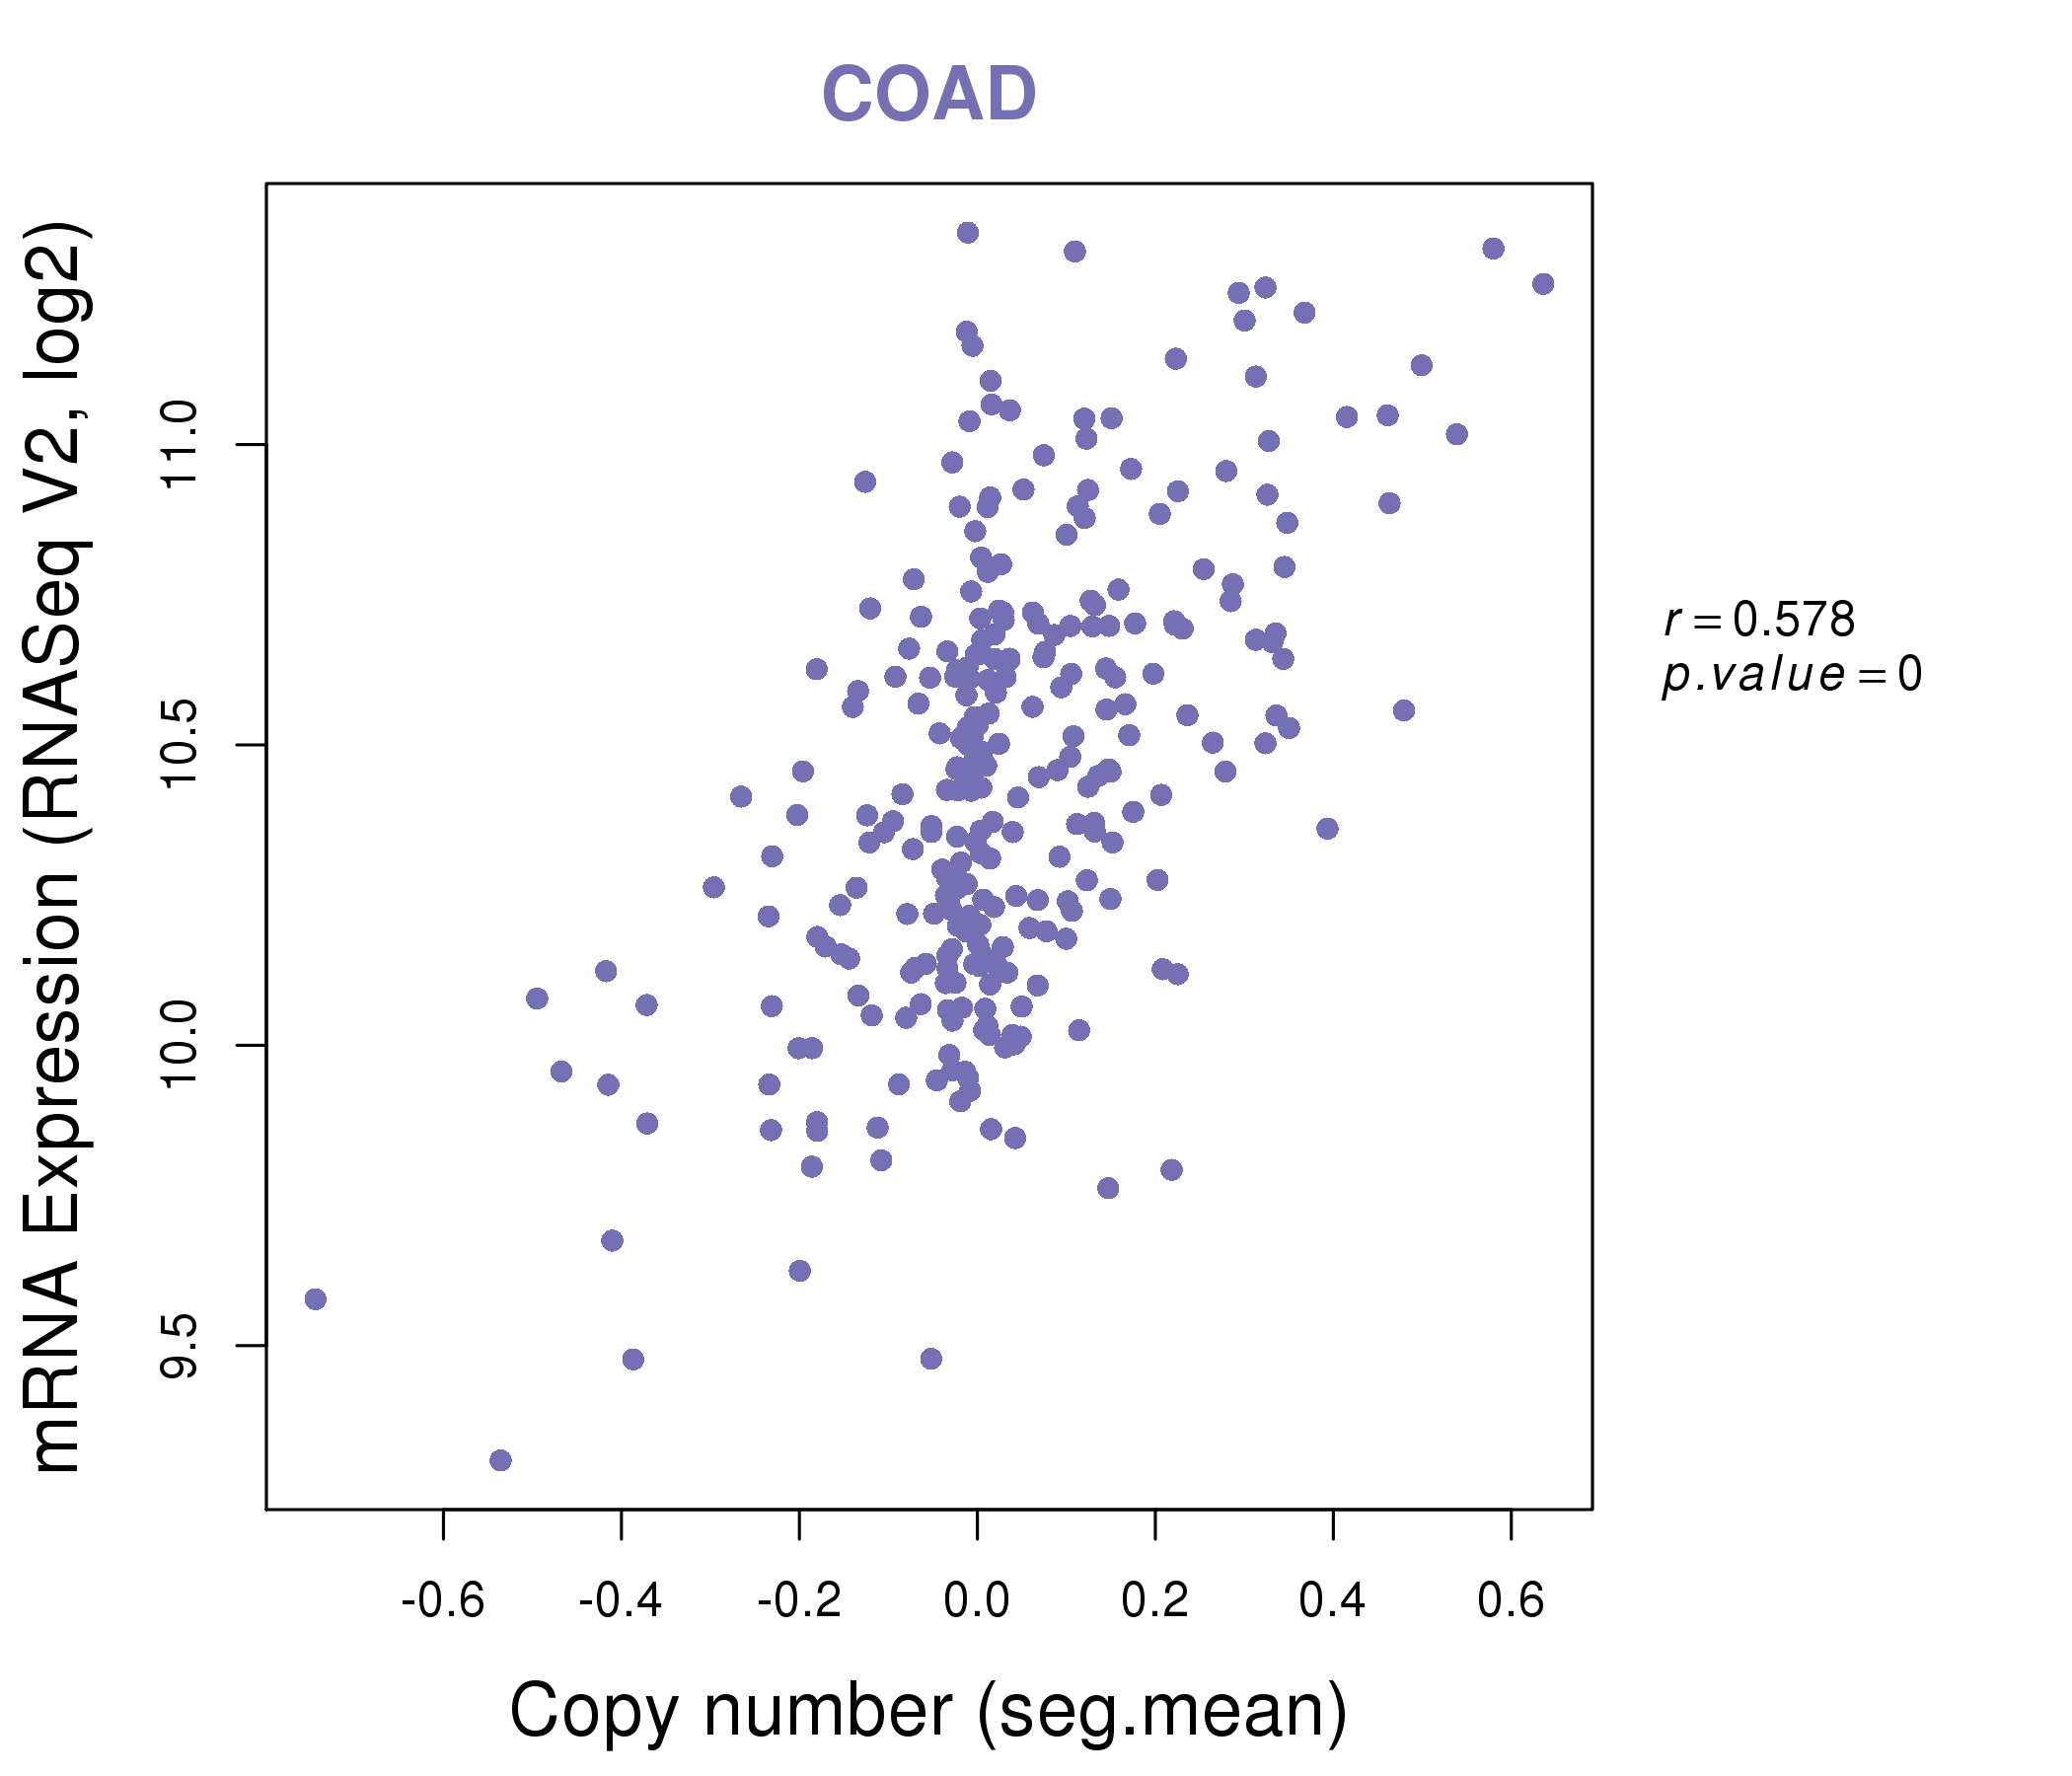
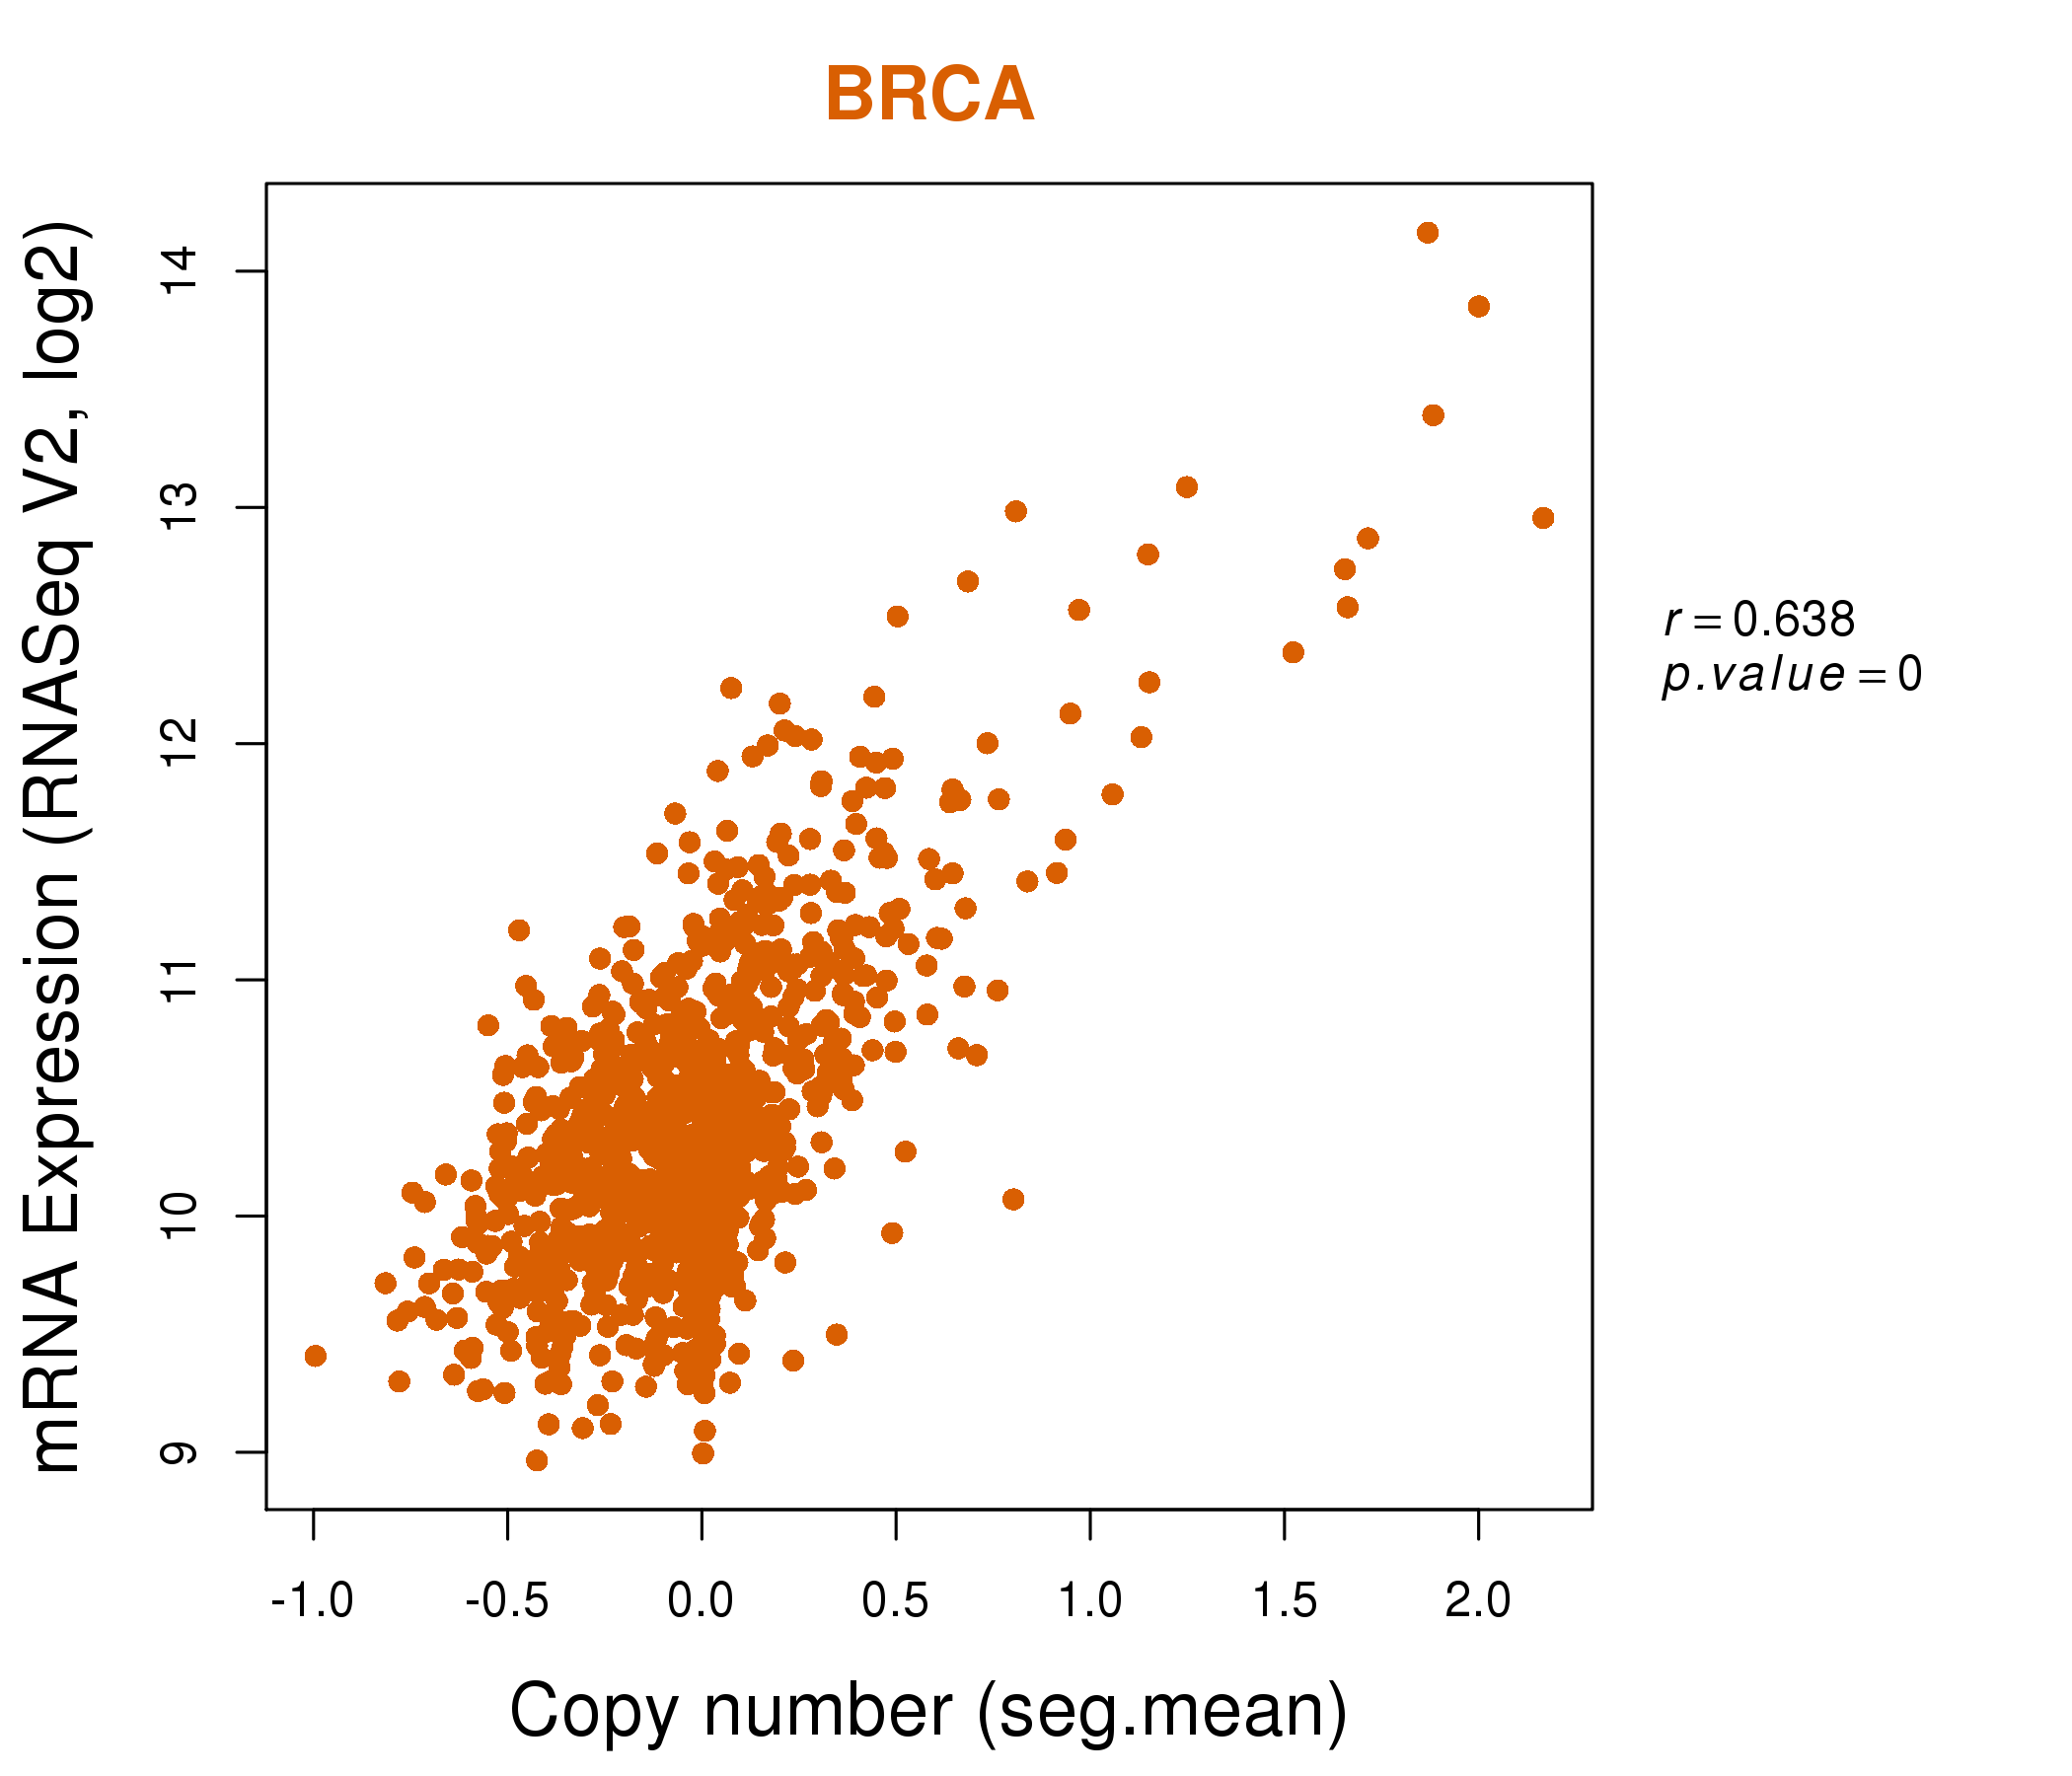
| * Copy number data were extracted from TCGA using R package TCGA-Assembler. The URLs of all public data files on TCGA DCC data server were gathered on Jan-05-2015. Function ProcessCNAData in TCGA-Assembler package was used to obtain gene-level copy number value which is calculated as the average copy number of the genomic region of a gene. |
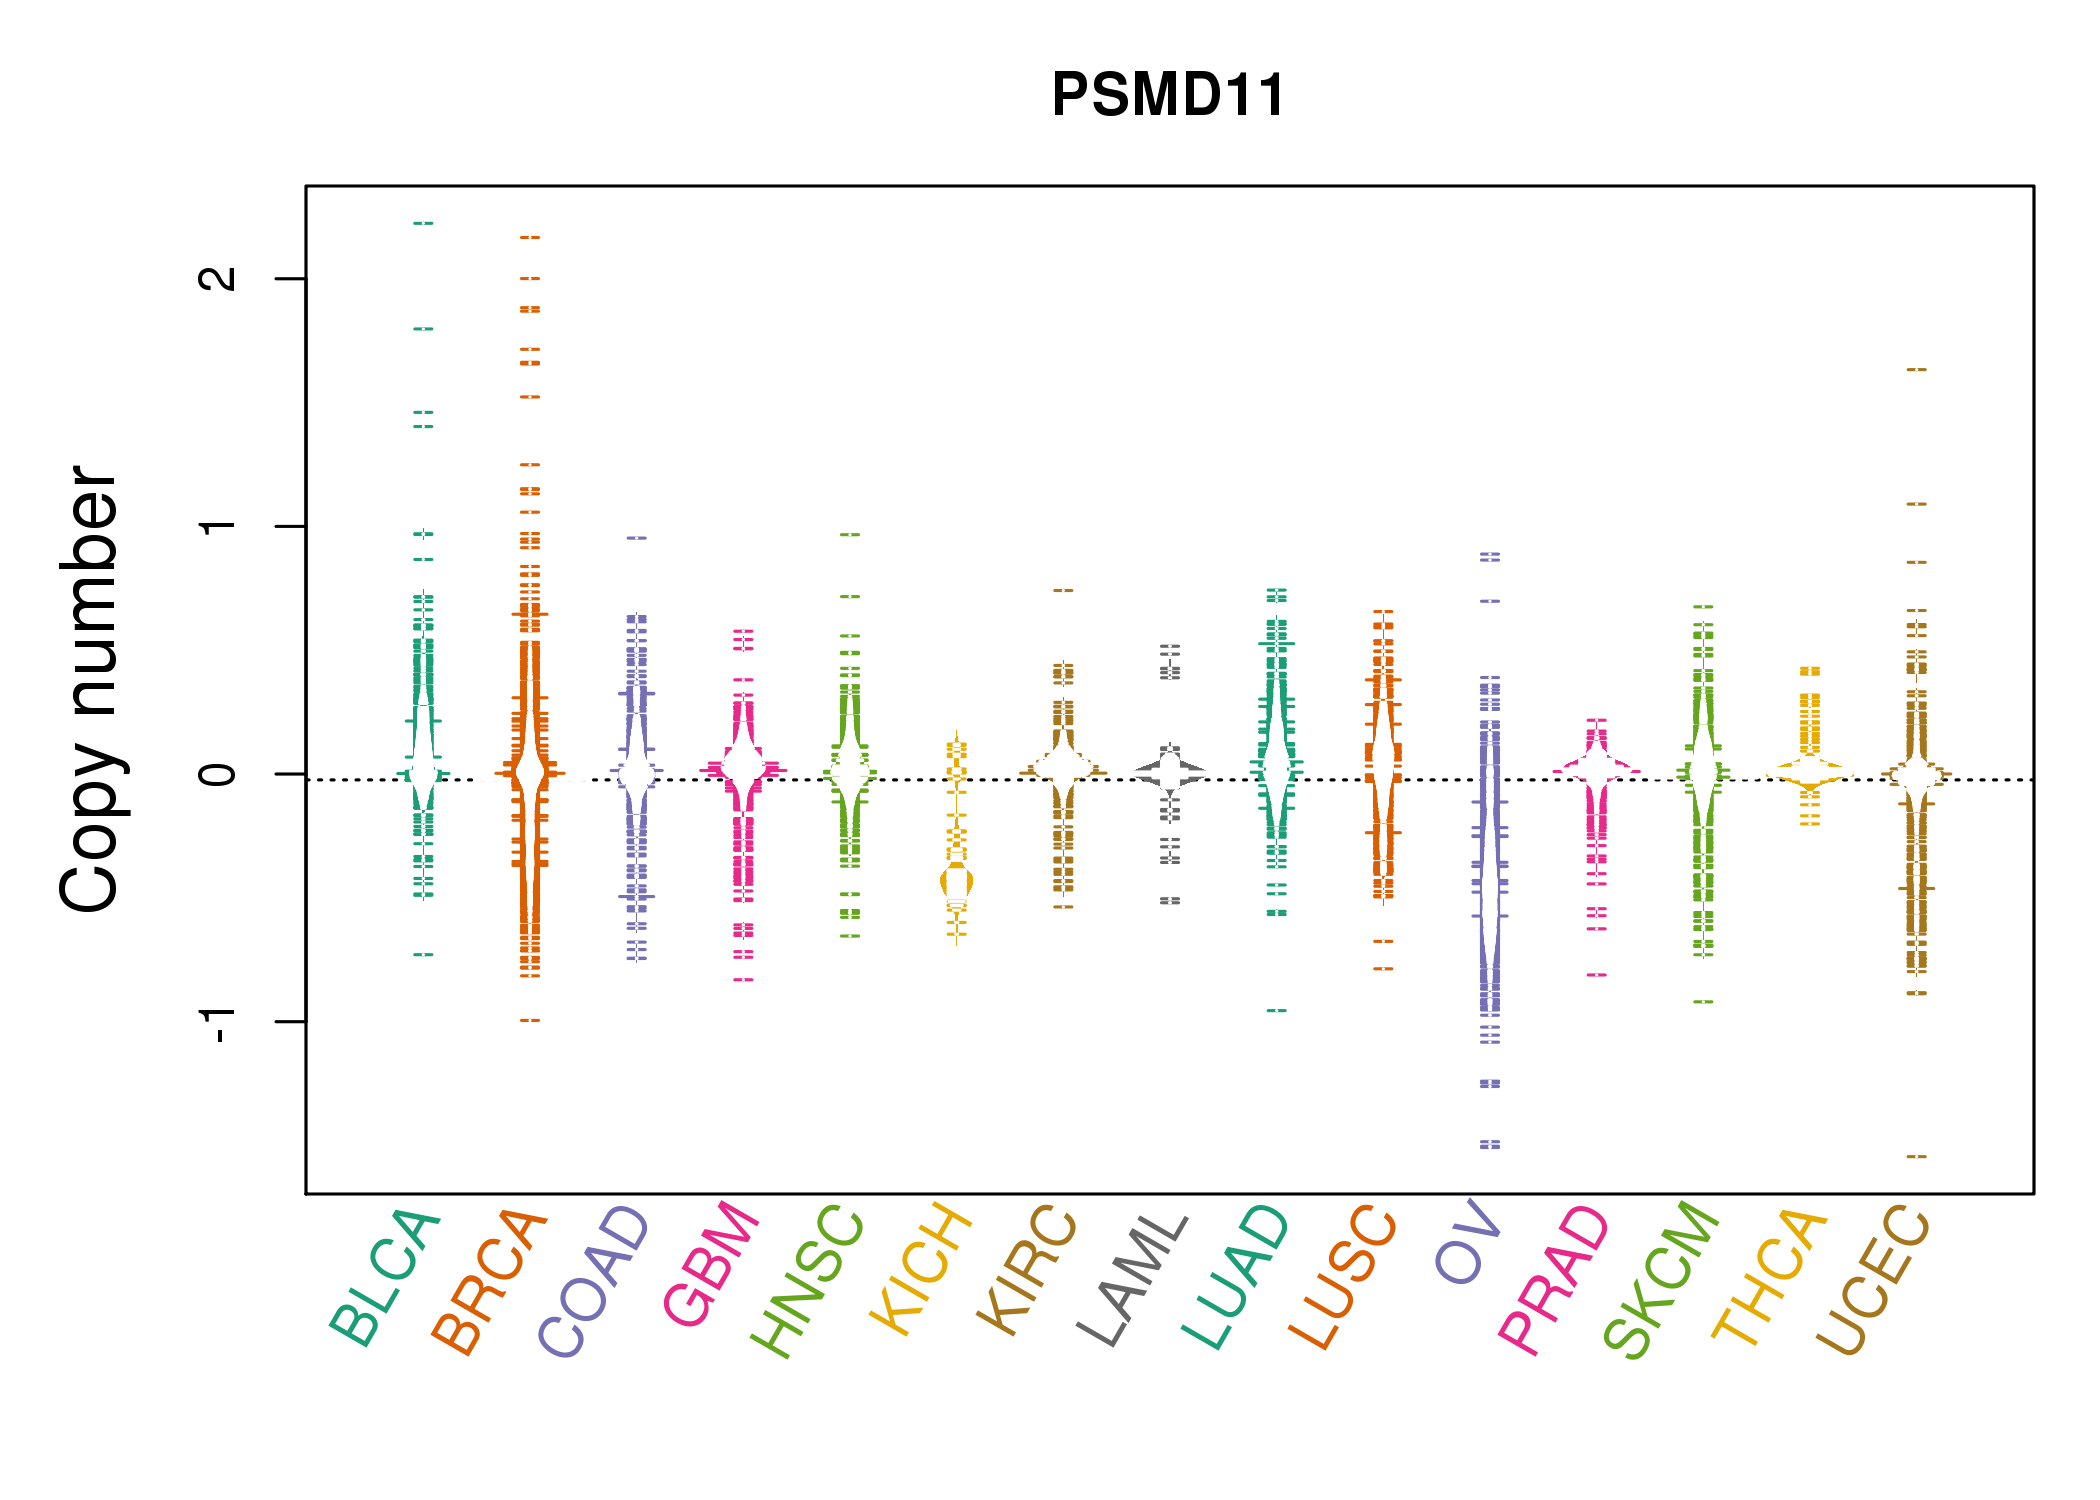 |
| cf) Tissue ID[Tissue type]: BLCA[Bladder Urothelial Carcinoma], BRCA[Breast invasive carcinoma], CESC[Cervical squamous cell carcinoma and endocervical adenocarcinoma], COAD[Colon adenocarcinoma], GBM[Glioblastoma multiforme], Glioma Low Grade, HNSC[Head and Neck squamous cell carcinoma], KICH[Kidney Chromophobe], KIRC[Kidney renal clear cell carcinoma], KIRP[Kidney renal papillary cell carcinoma], LAML[Acute Myeloid Leukemia], LUAD[Lung adenocarcinoma], LUSC[Lung squamous cell carcinoma], OV[Ovarian serous cystadenocarcinoma ], PAAD[Pancreatic adenocarcinoma], PRAD[Prostate adenocarcinoma], SKCM[Skin Cutaneous Melanoma], STAD[Stomach adenocarcinoma], THCA[Thyroid carcinoma], UCEC[Uterine Corpus Endometrial Carcinoma] |
| Top |
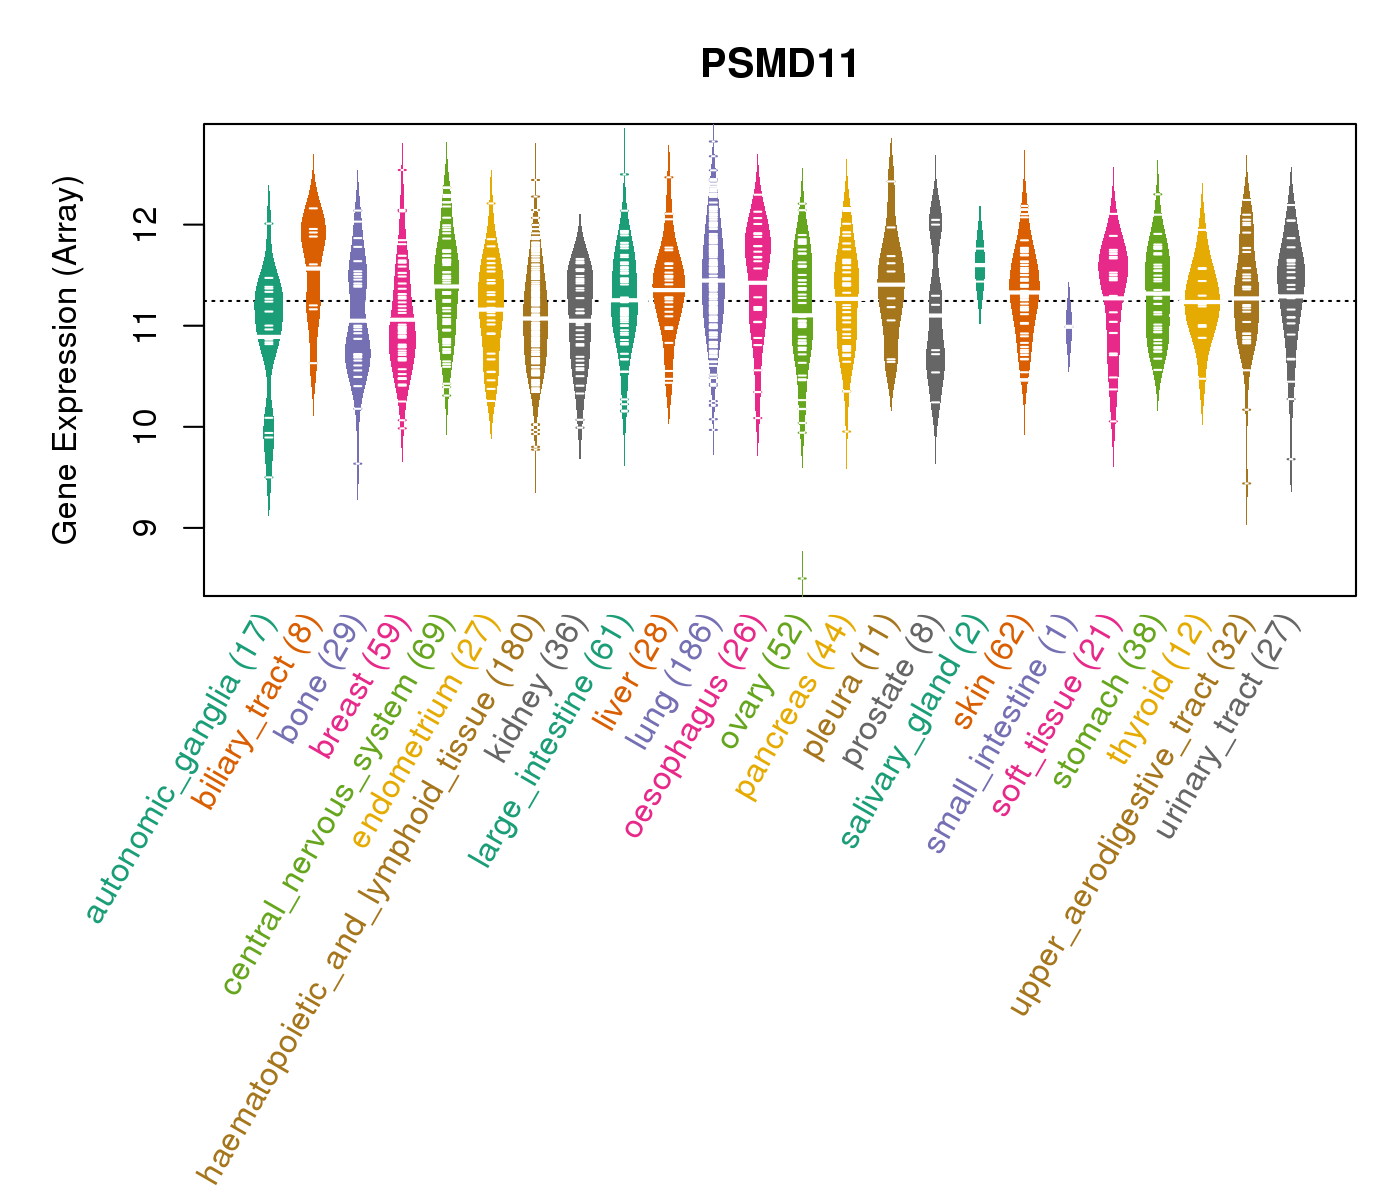
| Gene Expression for PSMD11 |
| * CCLE gene expression data were extracted from CCLE_Expression_Entrez_2012-10-18.res: Gene-centric RMA-normalized mRNA expression data. |
 |
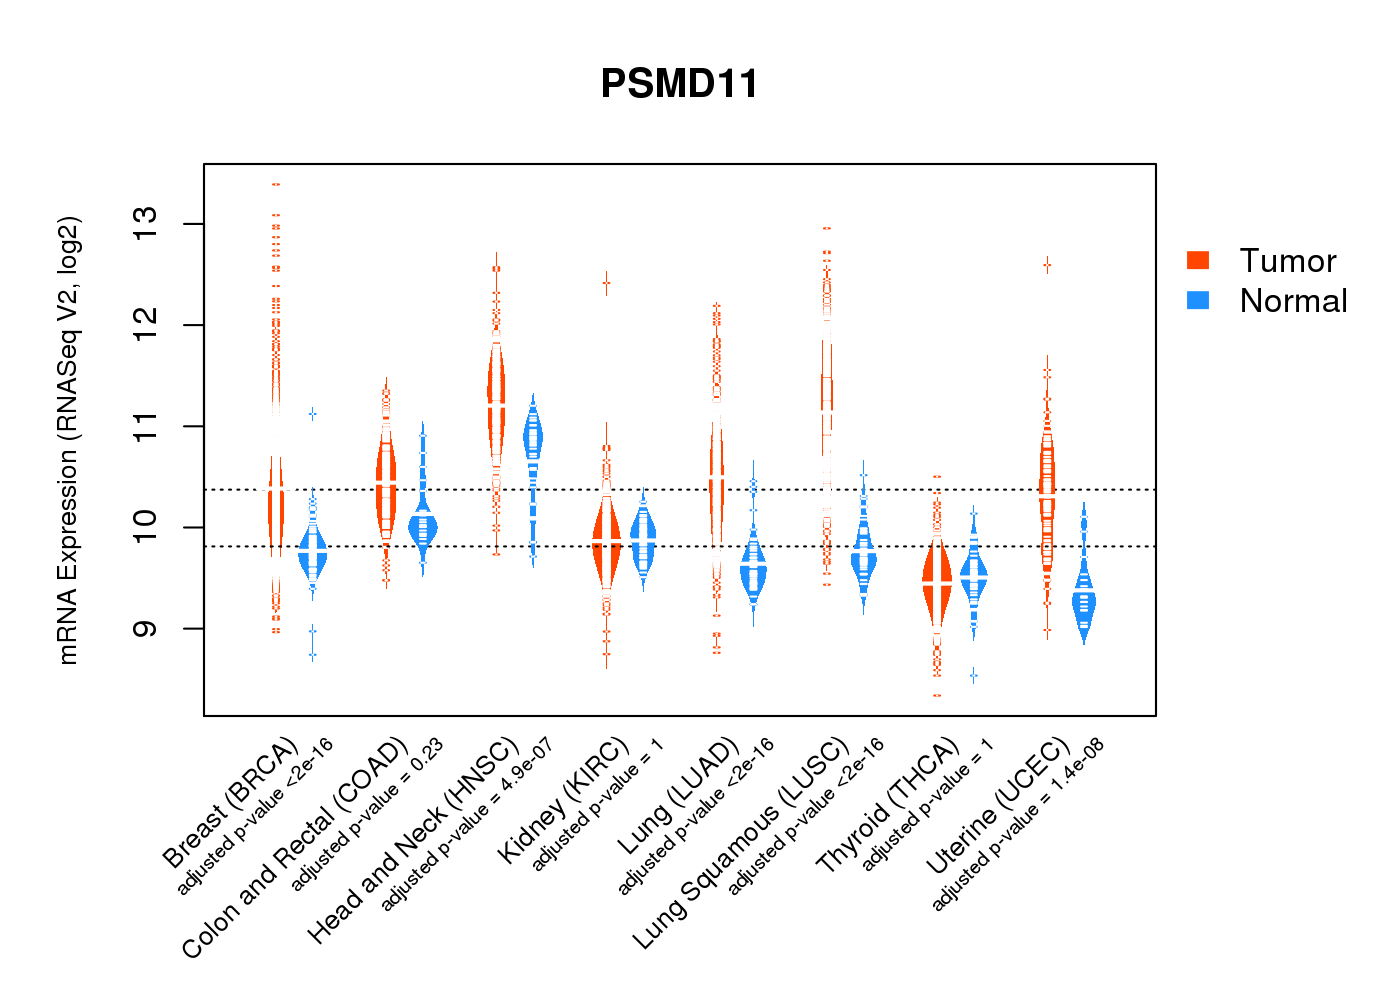
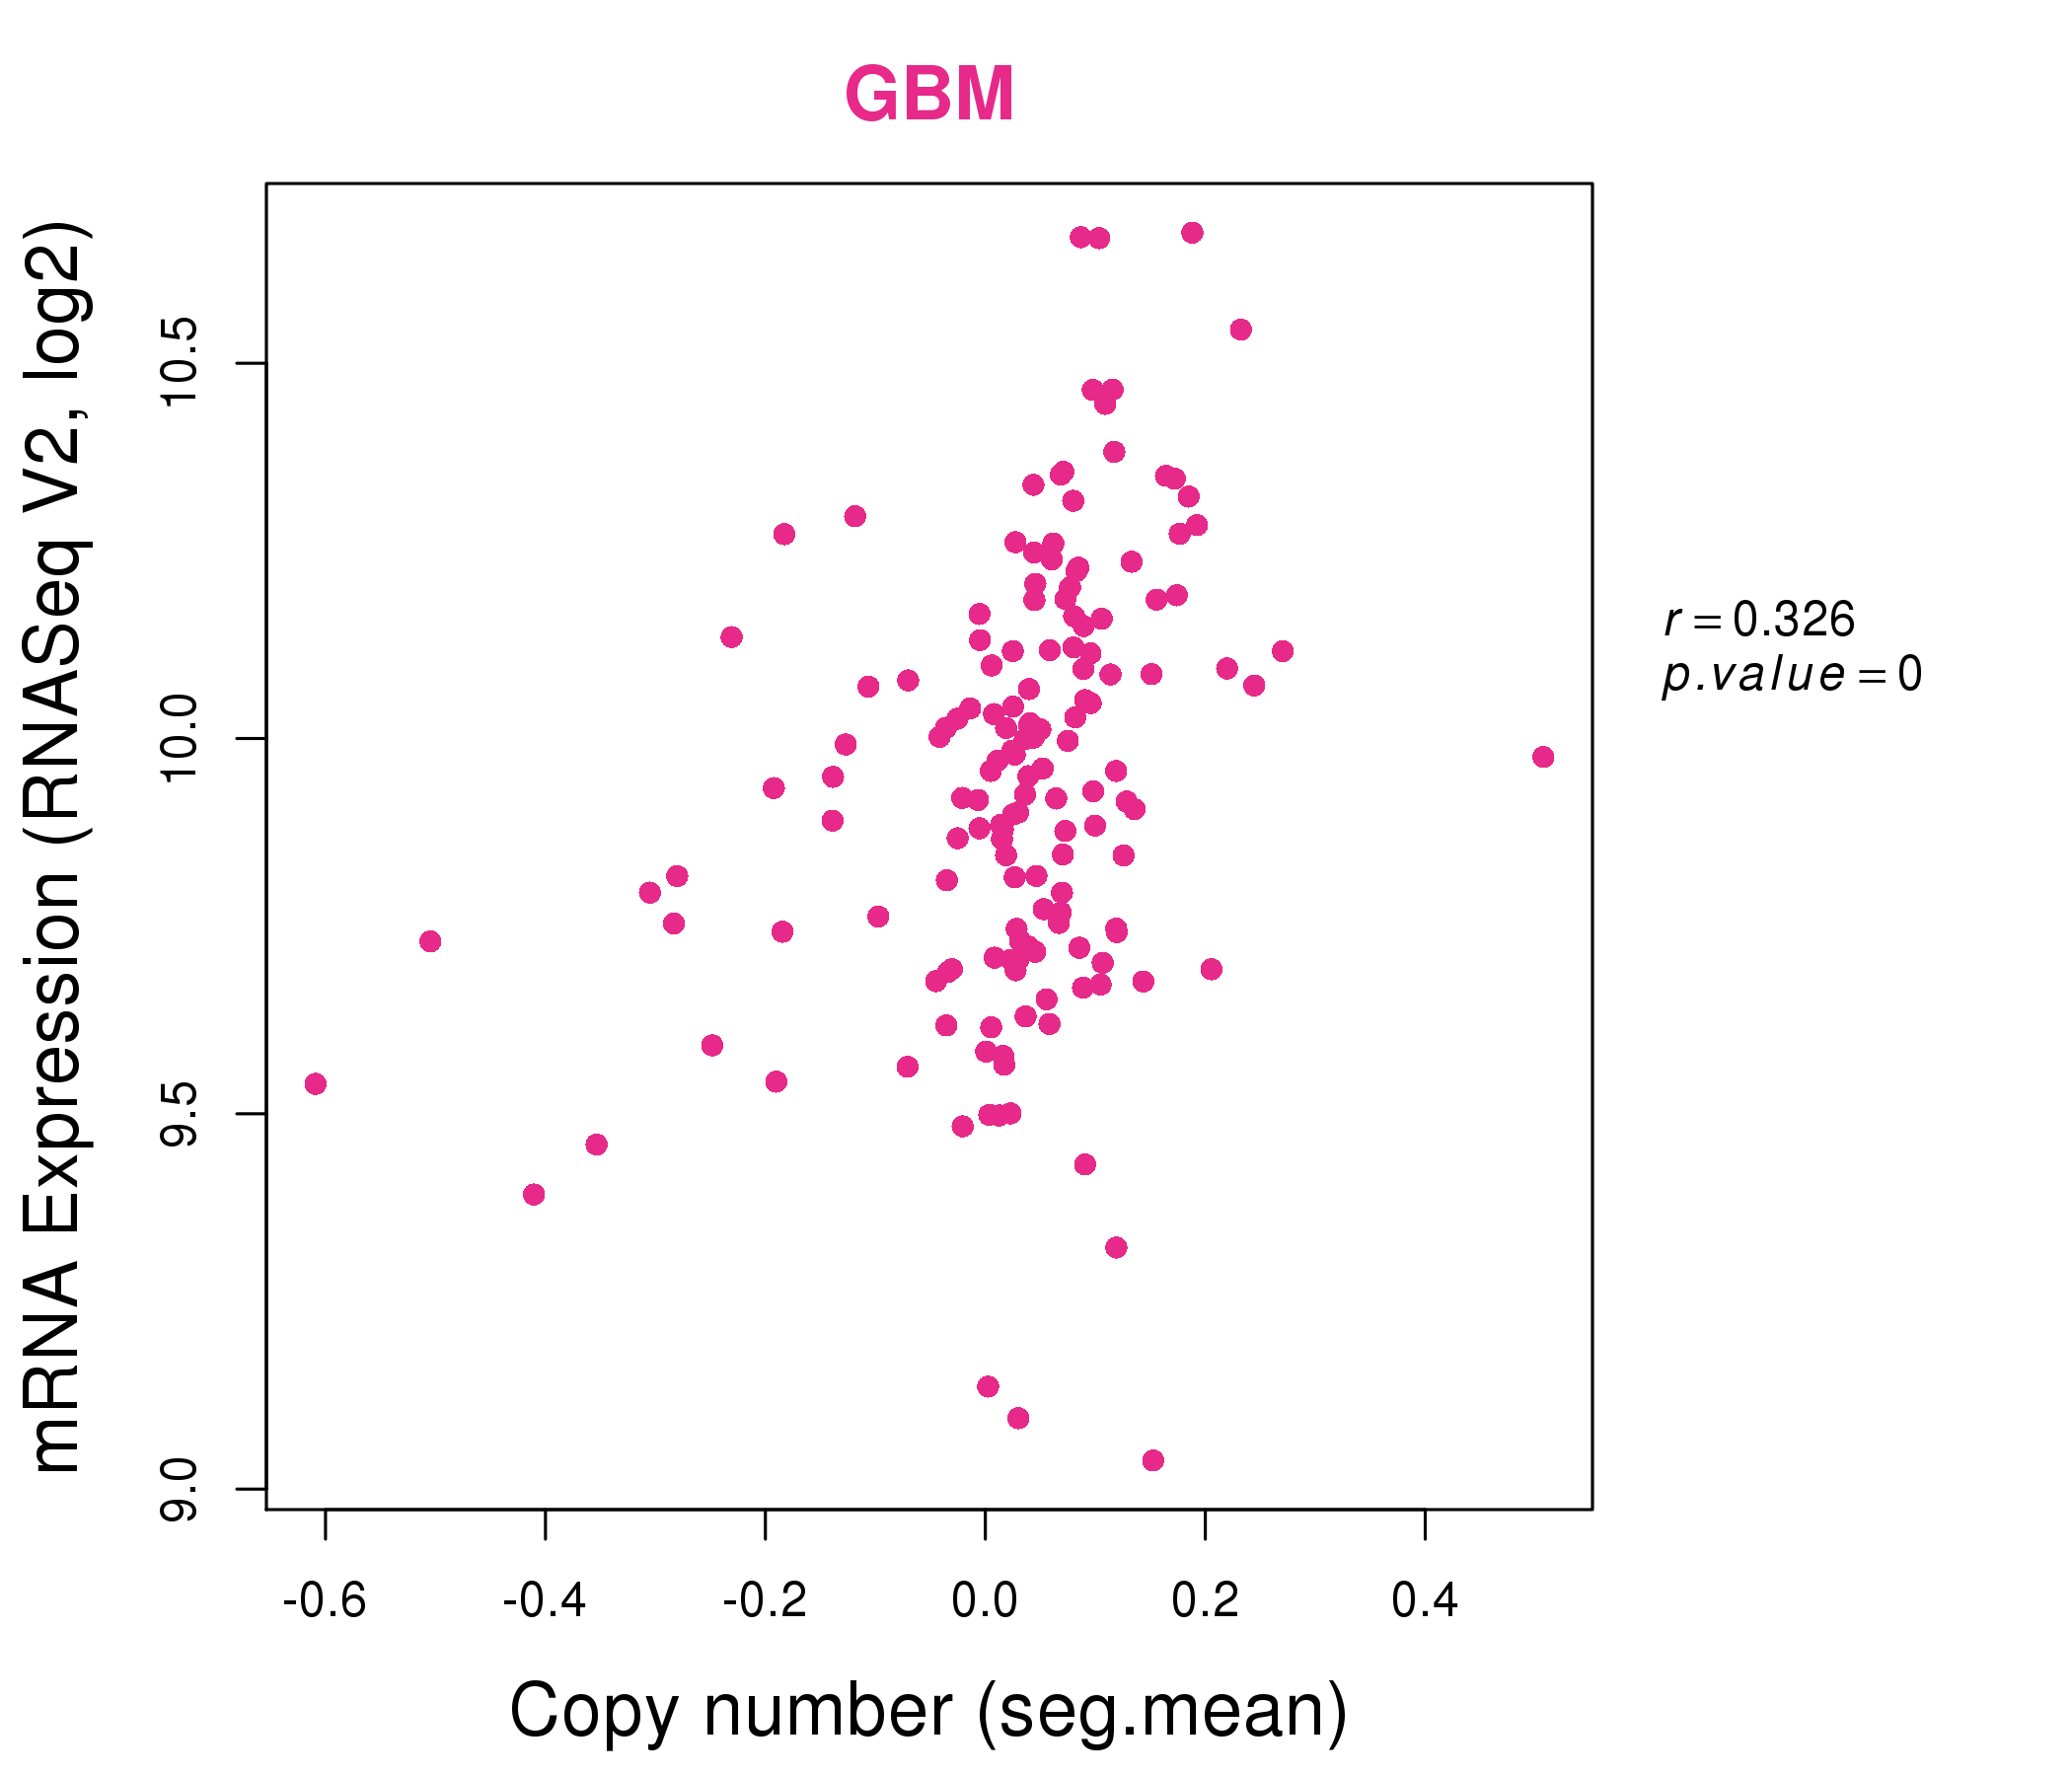
| * Normalized gene expression data of RNASeqV2 was extracted from TCGA using R package TCGA-Assembler. The URLs of all public data files on TCGA DCC data server were gathered at Jan-05-2015. Only eight cancer types have enough normal control samples for differential expression analysis. (t test, adjusted p<0.05 (using Benjamini-Hochberg FDR)) |
 |
| Top |
| * This plots show the correlation between CNV and gene expression. |
: Open all plots for all cancer types
 |
|
 |
|
| Top |
| Gene-Gene Network Information |
| * Co-Expression network figures were drawn using R package igraph. Only the top 20 genes with the highest correlations were shown. Red circle: input gene, orange circle: cell metabolism gene, sky circle: other gene |
: Open all plots for all cancer types
 |
| ||||
| TEFM,C17orf75,CDK5R1,CES1,CES1P1,CSHL1,DDX52, DUSP14,EME1,KPNA2,LIN28A,MYO1D,PSMD11,PSMD12, PSMD14,RAB11FIP4,RHOT1,SPAG5,SUZ12,UTP6,ZNF207 | DNAJA4,DUSP3,EPM2A,FYCO1,IDE,KLHL31,KPNA1, KPNA3,MFN2,NDUFS1,NRD1,OGDH,PRKAR2A,PSMC2, PSMD11,PSMD2,PSMD7,SAR1B,SIX1,TACC2,UBE3C | ||||
 |
| ||||
| ATAD5,BLMH,COPRS,EFTUD2,EIF4A3,EPR1,GOSR1, KPNB1,LIG3,NCAPH,NMT1,POLDIP2,PSMD11,PSME3, RAD51D,SPAG5,SUZ12,ALYREF,TUBG1,UTP18,UTP6 | CAP1,CEACAM1,DHRS9,GDPD3,GHITM,GNAI3,HSPA4, KRT20,NAT1,NT5C3A,PLAC8,PSMD11,PSMD1,RALB, SEC61G,TPM3,TPMT,TTC39B,VDAC2,VPS26A,YWHAB |
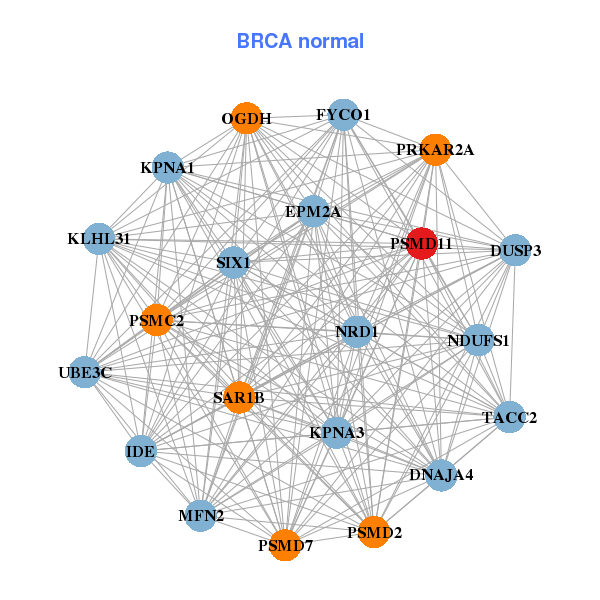
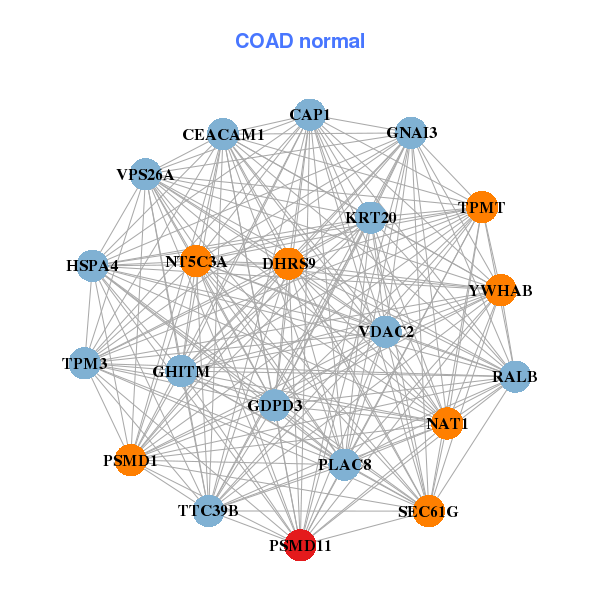
| * Co-Expression network figures were drawn using R package igraph. Only the top 20 genes with the highest correlations were shown. Red circle: input gene, orange circle: cell metabolism gene, sky circle: other gene |
: Open all plots for all cancer types
| Top |
: Open all interacting genes' information including KEGG pathway for all interacting genes from DAVID
| Top |
| Pharmacological Information for PSMD11 |
| DB Category | DB Name | DB's ID and Url link |
| Organism-specific databases | PharmGKB | PA33902; -. |
| Organism-specific databases | CTD | 5717; -. |
| * Gene Centered Interaction Network. |
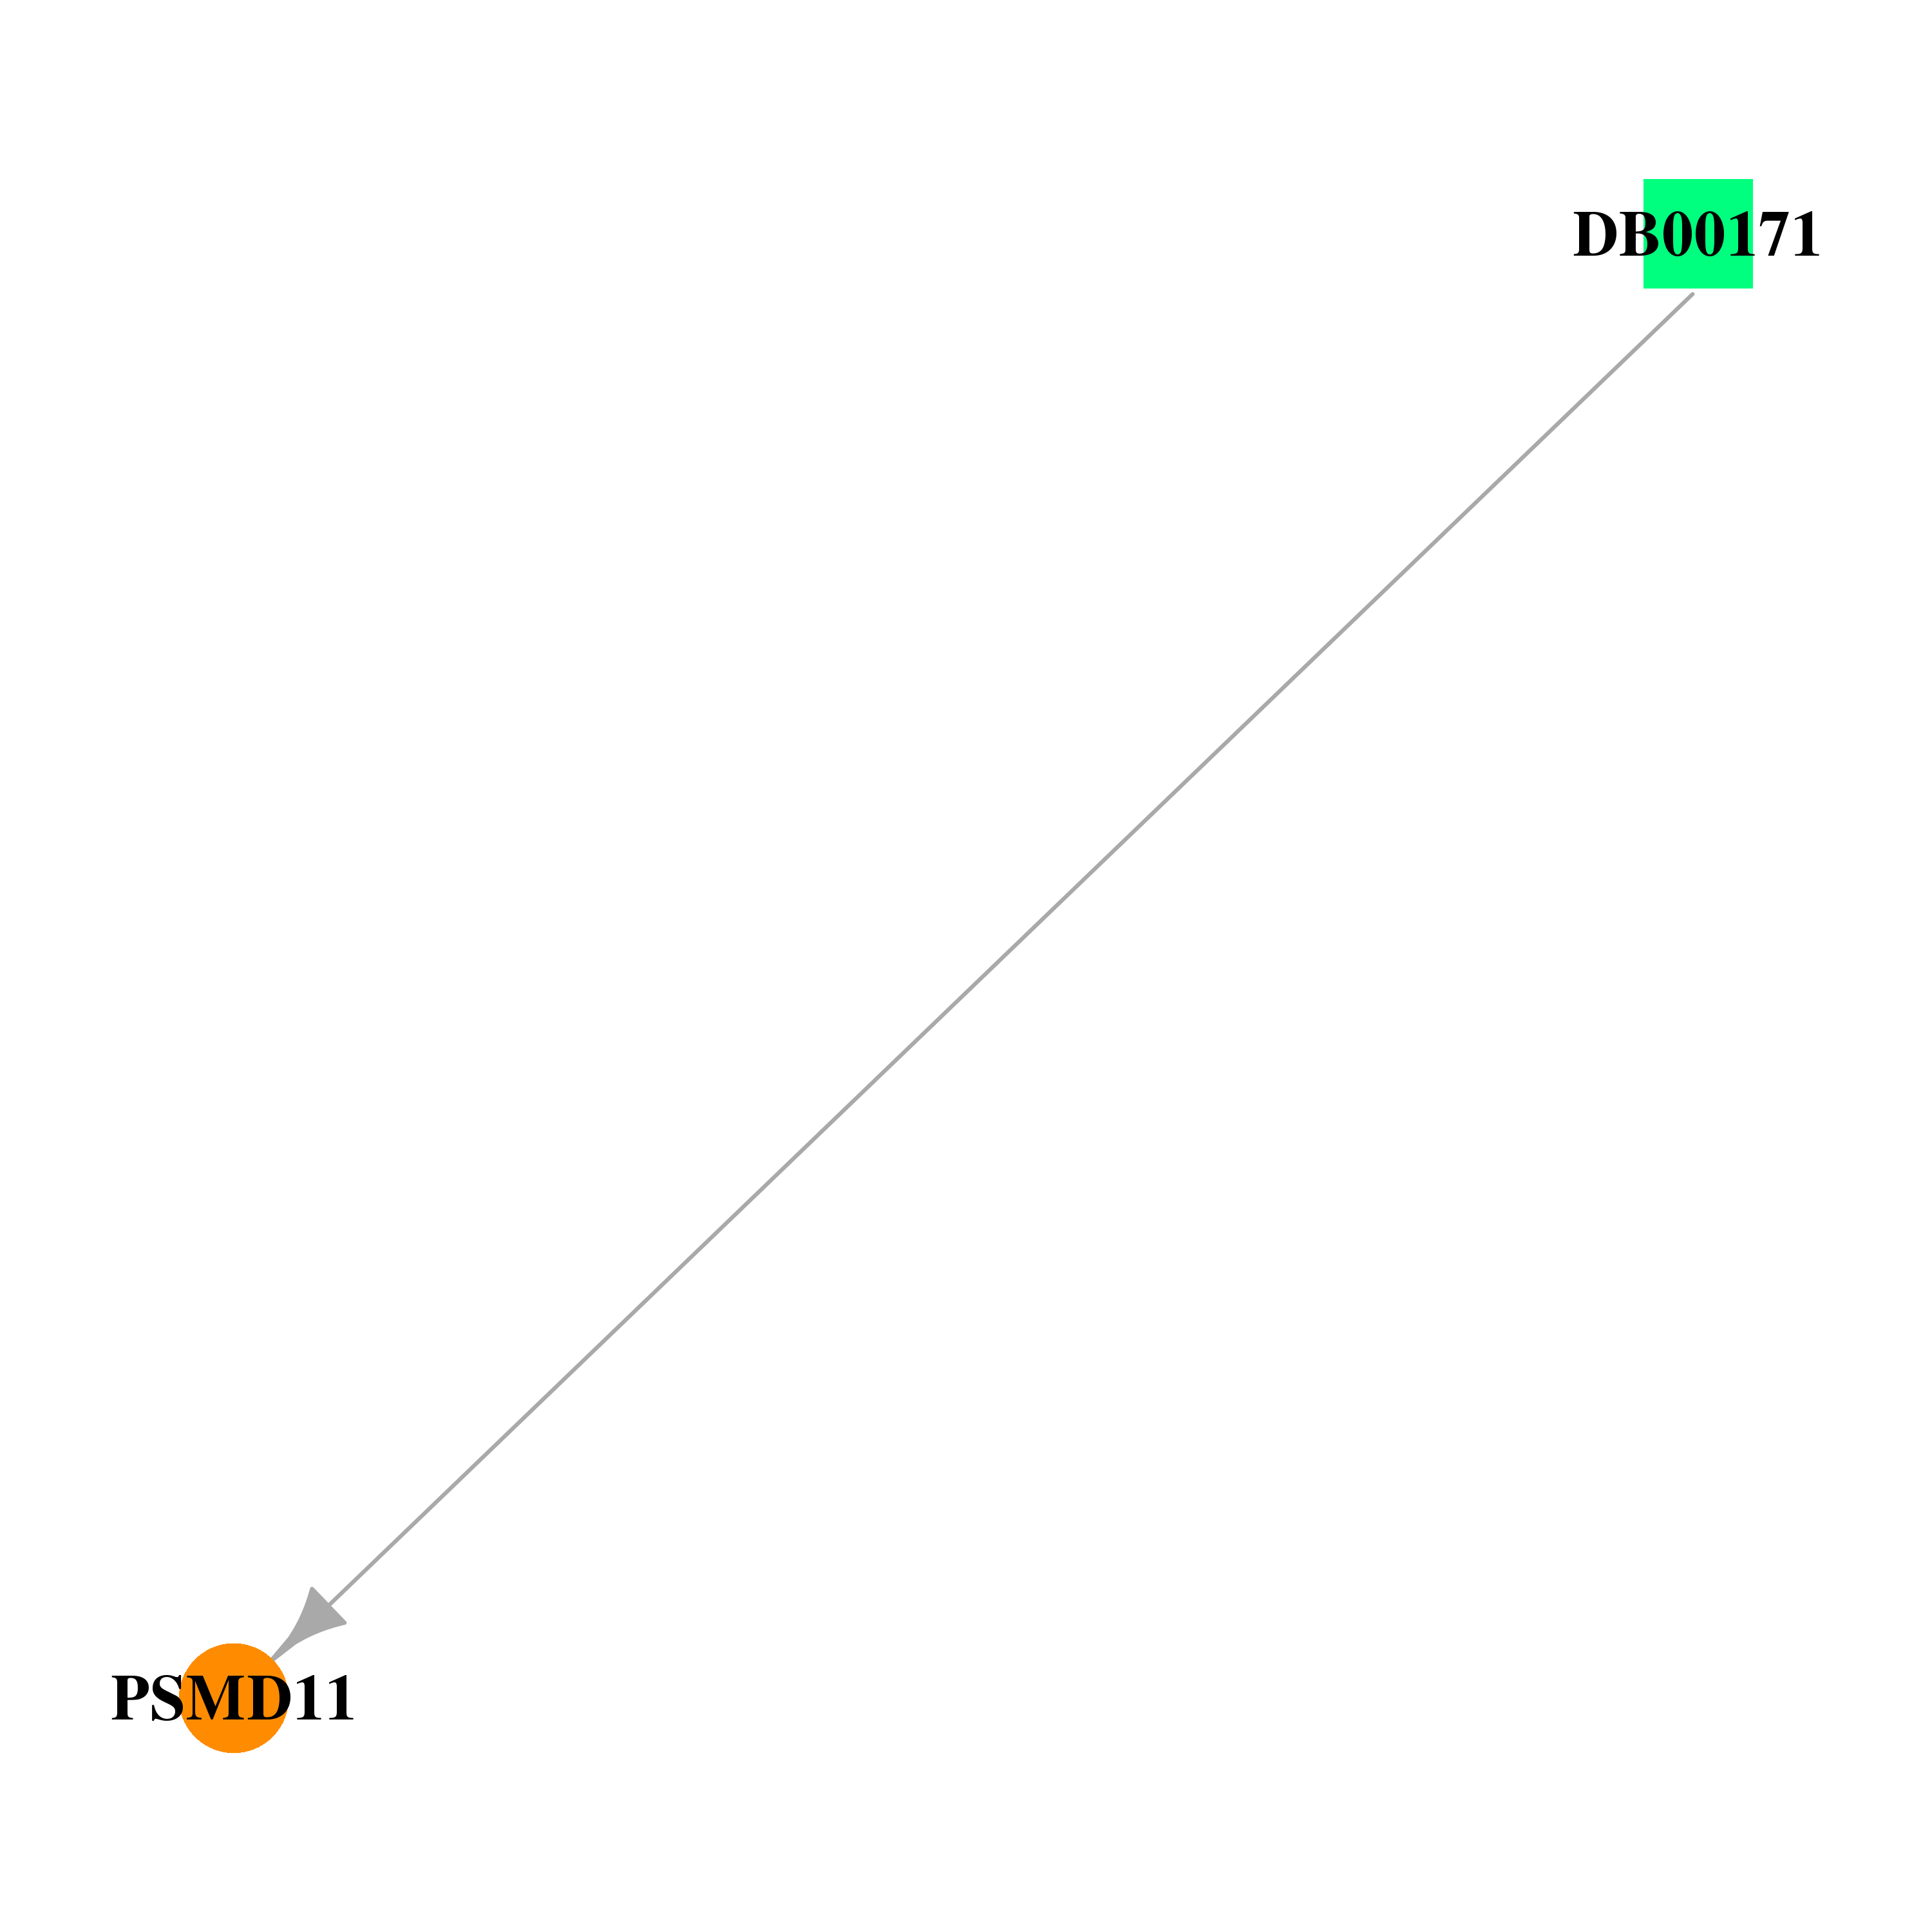 |
| * Drug Centered Interaction Network. |
| DrugBank ID | Target Name | Drug Groups | Generic Name | Drug Centered Network | Drug Structure |
| DB00171 | proteasome (prosome, macropain) 26S subunit, non-ATPase, 11 | approved; nutraceutical | Adenosine triphosphate |  |  |
| Top |
| Cross referenced IDs for PSMD11 |
| * We obtained these cross-references from Uniprot database. It covers 150 different DBs, 18 categories. http://www.uniprot.org/help/cross_references_section |
: Open all cross reference information
|
Copyright © 2016-Present - The Univsersity of Texas Health Science Center at Houston @ |