|
||||||||||||||||||||
| |
| Phenotypic Information (metabolism pathway, cancer, disease, phenome) |
| |
| |
| Gene-Gene Network Information: Co-Expression Network, Interacting Genes & KEGG |
| |
|


| Gene Summary for PSMD13 |
| Basic gene info. | Gene symbol | PSMD13 |
| Gene name | proteasome (prosome, macropain) 26S subunit, non-ATPase, 13 | |
| Synonyms | HSPC027|Rpn9|S11|p40.5 | |
| Cytomap | UCSC genome browser: 11p15.5 | |
| Genomic location | chr11 :236807-252984 | |
| Type of gene | protein-coding | |
| RefGenes | NM_002817.3, NM_175932.2, | |
| Ensembl id | ENSG00000185627 | |
| Description | 26S proteasome non-ATPase regulatory subunit 1326S proteasome regulatory subunit RPN926S proteasome regulatory subunit S1126S proteasome regulatory subunit p40.526S proteasome subunit p40.5 | |
| Modification date | 20141207 | |
| dbXrefs | MIM : 603481 | |
| HGNC : HGNC | ||
| Ensembl : ENSG00000185627 | ||
| HPRD : 04595 | ||
| Vega : OTTHUMG00000119072 | ||
| Protein | UniProt: Q9UNM6 go to UniProt's Cross Reference DB Table | |
| Expression | CleanEX: HS_PSMD13 | |
| BioGPS: 5719 | ||
| Gene Expression Atlas: ENSG00000185627 | ||
| The Human Protein Atlas: ENSG00000185627 | ||
| Pathway | NCI Pathway Interaction Database: PSMD13 | |
| KEGG: PSMD13 | ||
| REACTOME: PSMD13 | ||
| ConsensusPathDB | ||
| Pathway Commons: PSMD13 | ||
| Metabolism | MetaCyc: PSMD13 | |
| HUMANCyc: PSMD13 | ||
| Regulation | Ensembl's Regulation: ENSG00000185627 | |
| miRBase: chr11 :236,807-252,984 | ||
| TargetScan: NM_002817 | ||
| cisRED: ENSG00000185627 | ||
| Context | iHOP: PSMD13 | |
| cancer metabolism search in PubMed: PSMD13 | ||
| UCL Cancer Institute: PSMD13 | ||
| Assigned class in ccmGDB | B - This gene belongs to cancer gene. | |
| Top |
| Phenotypic Information for PSMD13(metabolism pathway, cancer, disease, phenome) |
| Cancer | CGAP: PSMD13 |
| Familial Cancer Database: PSMD13 | |
| * This gene is included in those cancer gene databases. |
|
|
|
|
|
| . | ||||||||||||||
Oncogene 1 | Significant driver gene in | |||||||||||||||||||
| cf) number; DB name 1 Oncogene; http://nar.oxfordjournals.org/content/35/suppl_1/D721.long, 2 Tumor Suppressor gene; https://bioinfo.uth.edu/TSGene/, 3 Cancer Gene Census; http://www.nature.com/nrc/journal/v4/n3/abs/nrc1299.html, 4 CancerGenes; http://nar.oxfordjournals.org/content/35/suppl_1/D721.long, 5 Network of Cancer Gene; http://ncg.kcl.ac.uk/index.php, 1Therapeutic Vulnerabilities in Cancer; http://cbio.mskcc.org/cancergenomics/statius/ |
| REACTOME_METABOLISM_OF_AMINO_ACIDS_AND_DERIVATIVES REACTOME_METABOLISM_OF_MRNA REACTOME_METABOLISM_OF_RNA | |
| OMIM | 603481; gene. |
| Orphanet | |
| Disease | KEGG Disease: PSMD13 |
| MedGen: PSMD13 (Human Medical Genetics with Condition) | |
| ClinVar: PSMD13 | |
| Phenotype | MGI: PSMD13 (International Mouse Phenotyping Consortium) |
| PhenomicDB: PSMD13 | |
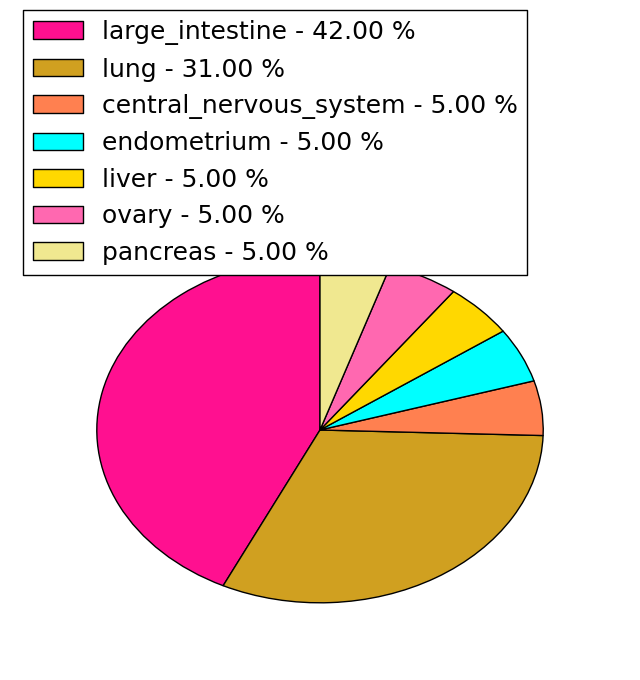
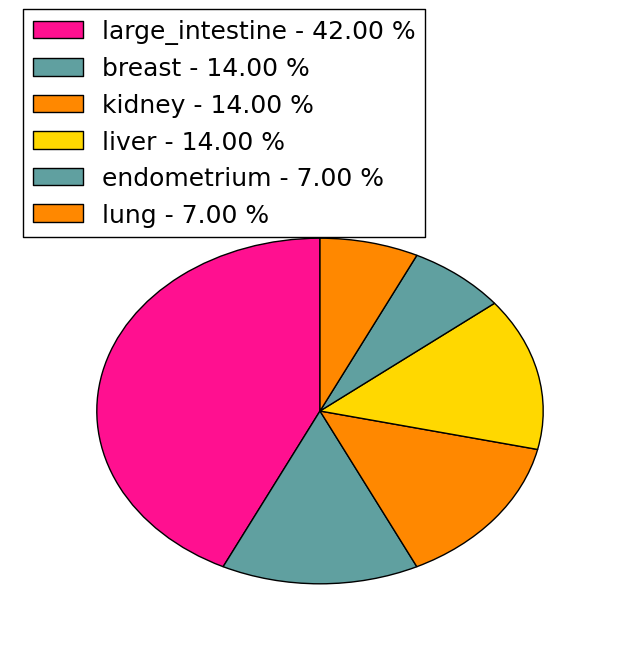
| Mutations for PSMD13 |
| * Under tables are showing count per each tissue to give us broad intuition about tissue specific mutation patterns.You can go to the detailed page for each mutation database's web site. |
| - Statistics for Tissue and Mutation type | Top |
 |
| - For Inter-chromosomal Variations |
| * Inter-chromosomal variantions includes 'interchromosomal amplicon to amplicon', 'interchromosomal amplicon to non-amplified dna', 'interchromosomal insertion', 'Interchromosomal unknown type'. |
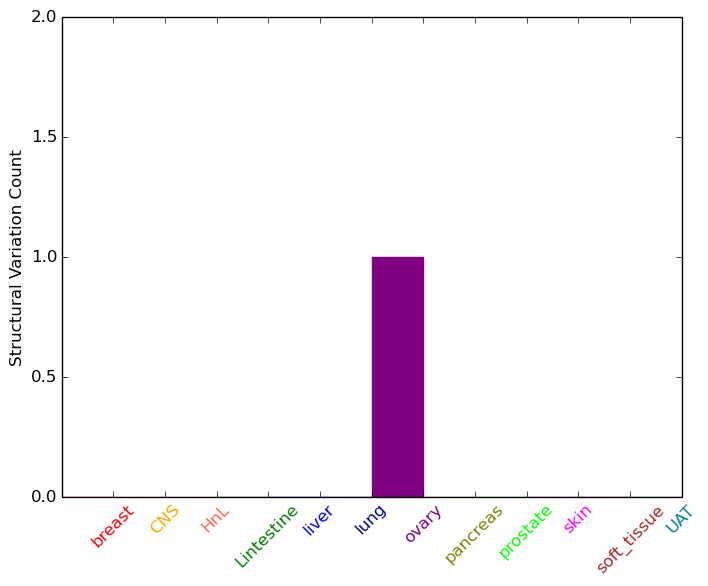 |
| - For Intra-chromosomal Variations |
| There's no intra-chromosomal structural variation. |
| Sample | Symbol_a | Chr_a | Start_a | End_a | Symbol_b | Chr_b | Start_b | End_b |
| ovary | PSMD13 | chr11 | 237770 | 237790 | chr16 | 21518285 | 21518305 |
| cf) Tissue number; Tissue name (1;Breast, 2;Central_nervous_system, 3;Haematopoietic_and_lymphoid_tissue, 4;Large_intestine, 5;Liver, 6;Lung, 7;Ovary, 8;Pancreas, 9;Prostate, 10;Skin, 11;Soft_tissue, 12;Upper_aerodigestive_tract) |
| * From mRNA Sanger sequences, Chitars2.0 arranged chimeric transcripts. This table shows PSMD13 related fusion information. |
| ID | Head Gene | Tail Gene | Accession | Gene_a | qStart_a | qEnd_a | Chromosome_a | tStart_a | tEnd_a | Gene_a | qStart_a | qEnd_a | Chromosome_a | tStart_a | tEnd_a |
| BX103504 | PSMD13 | 1 | 401 | 11 | 237045 | 244761 | FAM157B | 400 | 493 | 9 | 141131447 | 141131540 | |
| BF768948 | EIF3D | 2 | 312 | 22 | 36914891 | 36916733 | PSMD13 | 303 | 404 | 11 | 252820 | 252921 | |
| Top |
| There's no copy number variation information in COSMIC data for this gene. |
| Top |
|
 |
| Top |
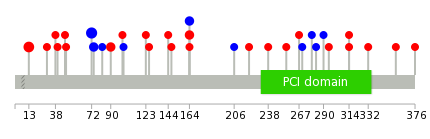
| Stat. for Non-Synonymous SNVs (# total SNVs=19) | (# total SNVs=14) |
 |  |
(# total SNVs=0) | (# total SNVs=0) |
| Top |
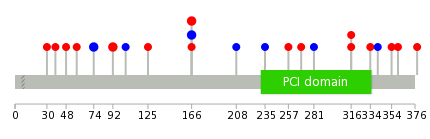
| * When you move the cursor on each content, you can see more deailed mutation information on the Tooltip. Those are primary_site,primary_histology,mutation(aa),pubmedID. |
| GRCh37 position | Mutation(aa) | Unique sampleID count |
| chr11:244167-244167 | p.N72N | 5 |
| chr11:237087-237087 | p.N13S | 4 |
| chr11:247370-247370 | p.Q164K | 3 |
| chr11:247372-247372 | p.Q164Q | 2 |
| chr11:244171-244171 | p.L74L | 2 |
| chr11:244428-244428 | p.P90S | 2 |
| chr11:250827-250827 | p.Q267* | 2 |
| chr11:250838-250838 | p.R270R | 1 |
| chr11:239022-239022 | p.Q40H | 1 |
| chr11:247311-247311 | p.N144I | 1 |
| Top |
|
 |
| Point Mutation/ Tissue ID | 1 | 2 | 3 | 4 | 5 | 6 | 7 | 8 | 9 | 10 | 11 | 12 | 13 | 14 | 15 | 16 | 17 | 18 | 19 | 20 |
| # sample | 1 | 1 | 9 | 2 | 3 | 1 | 1 | 3 | 2 | 1 | ||||||||||
| # mutation | 1 | 1 | 8 | 2 | 4 | 1 | 1 | 2 | 2 | 2 | ||||||||||
| nonsynonymous SNV | 6 | 3 | 1 | 1 | 2 | 2 | 1 | |||||||||||||
| synonymous SNV | 1 | 1 | 2 | 2 | 1 | 1 |
| cf) Tissue ID; Tissue type (1; BLCA[Bladder Urothelial Carcinoma], 2; BRCA[Breast invasive carcinoma], 3; CESC[Cervical squamous cell carcinoma and endocervical adenocarcinoma], 4; COAD[Colon adenocarcinoma], 5; GBM[Glioblastoma multiforme], 6; Glioma Low Grade, 7; HNSC[Head and Neck squamous cell carcinoma], 8; KICH[Kidney Chromophobe], 9; KIRC[Kidney renal clear cell carcinoma], 10; KIRP[Kidney renal papillary cell carcinoma], 11; LAML[Acute Myeloid Leukemia], 12; LUAD[Lung adenocarcinoma], 13; LUSC[Lung squamous cell carcinoma], 14; OV[Ovarian serous cystadenocarcinoma ], 15; PAAD[Pancreatic adenocarcinoma], 16; PRAD[Prostate adenocarcinoma], 17; SKCM[Skin Cutaneous Melanoma], 18:STAD[Stomach adenocarcinoma], 19:THCA[Thyroid carcinoma], 20:UCEC[Uterine Corpus Endometrial Carcinoma]) |
| Top |
| * We represented just top 10 SNVs. When you move the cursor on each content, you can see more deailed mutation information on the Tooltip. Those are primary_site, primary_histology, mutation(aa), pubmedID. |
| Genomic Position | Mutation(aa) | Unique sampleID count |
| chr11:247370 | p.Q166K,PSMD13 | 3 |
| chr11:244167 | p.N74N,PSMD13 | 2 |
| chr11:244428 | p.P92S,PSMD13 | 2 |
| chr11:247372 | p.Q166Q,PSMD13 | 2 |
| chr11:244118 | p.I58T | 1 |
| chr11:250865 | p.R354S,PSMD13 | 1 |
| chr11:251841 | p.T360M,PSMD13 | 1 |
| chr11:251842 | p.T378A,PSMD13 | 1 |
| chr11:244466 | p.E104E,PSMD13 | 1 |
| chr11:251895 | p.L125V,PSMD13 | 1 |
| * Copy number data were extracted from TCGA using R package TCGA-Assembler. The URLs of all public data files on TCGA DCC data server were gathered on Jan-05-2015. Function ProcessCNAData in TCGA-Assembler package was used to obtain gene-level copy number value which is calculated as the average copy number of the genomic region of a gene. |
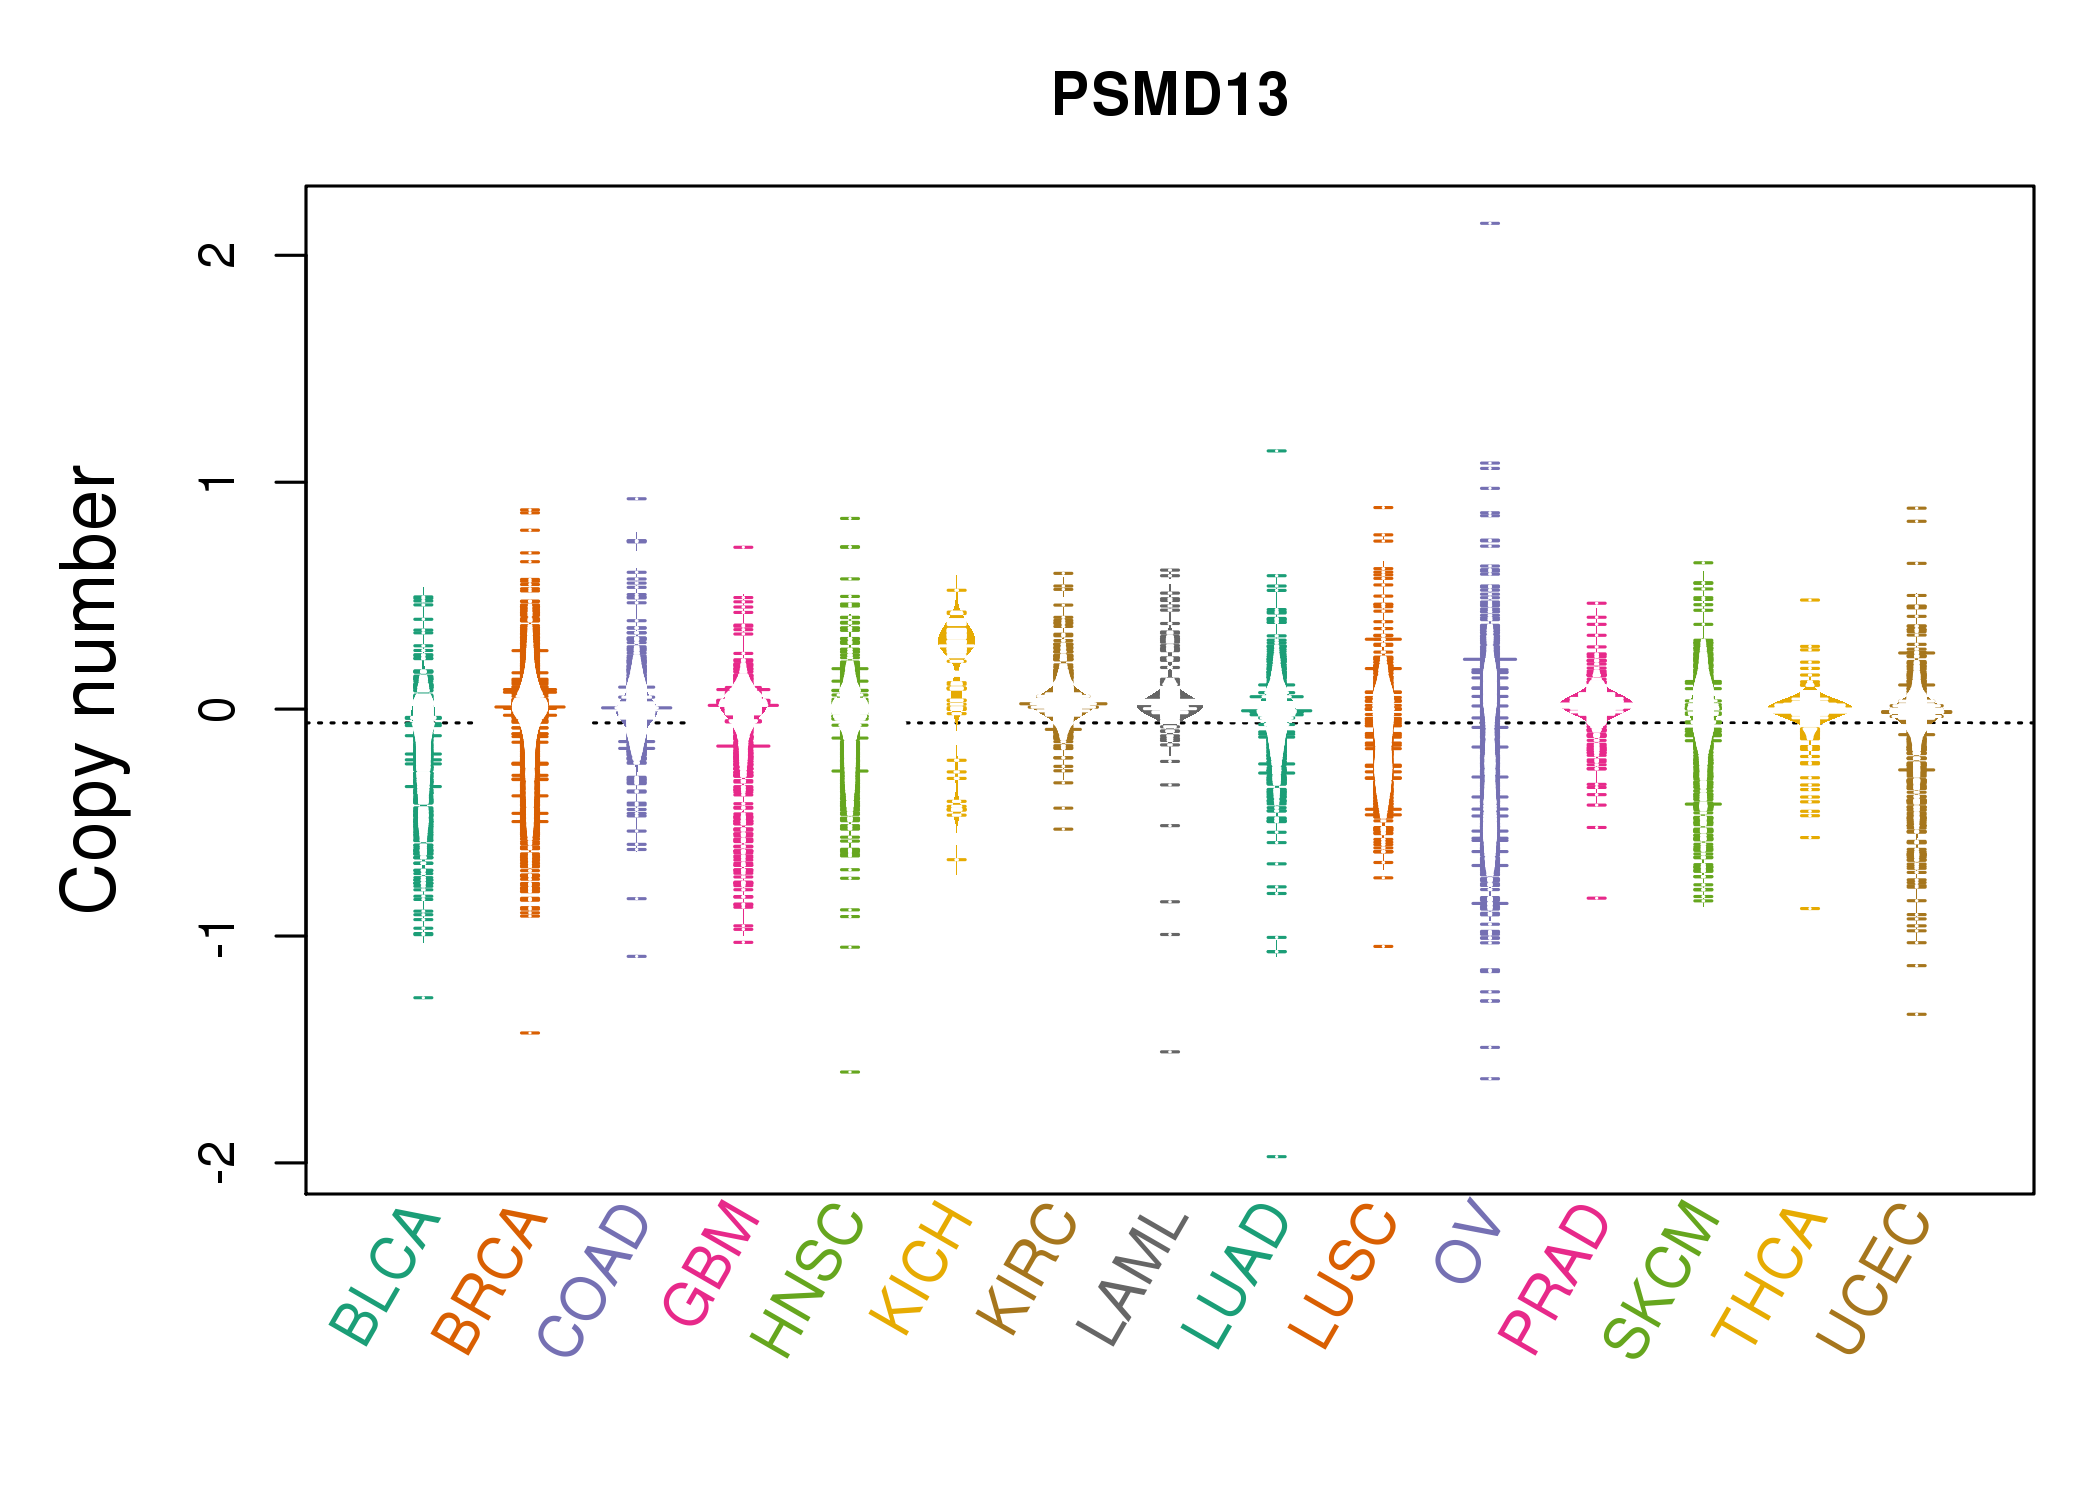 |
| cf) Tissue ID[Tissue type]: BLCA[Bladder Urothelial Carcinoma], BRCA[Breast invasive carcinoma], CESC[Cervical squamous cell carcinoma and endocervical adenocarcinoma], COAD[Colon adenocarcinoma], GBM[Glioblastoma multiforme], Glioma Low Grade, HNSC[Head and Neck squamous cell carcinoma], KICH[Kidney Chromophobe], KIRC[Kidney renal clear cell carcinoma], KIRP[Kidney renal papillary cell carcinoma], LAML[Acute Myeloid Leukemia], LUAD[Lung adenocarcinoma], LUSC[Lung squamous cell carcinoma], OV[Ovarian serous cystadenocarcinoma ], PAAD[Pancreatic adenocarcinoma], PRAD[Prostate adenocarcinoma], SKCM[Skin Cutaneous Melanoma], STAD[Stomach adenocarcinoma], THCA[Thyroid carcinoma], UCEC[Uterine Corpus Endometrial Carcinoma] |
| Top |
| Gene Expression for PSMD13 |
| * CCLE gene expression data were extracted from CCLE_Expression_Entrez_2012-10-18.res: Gene-centric RMA-normalized mRNA expression data. |
 |
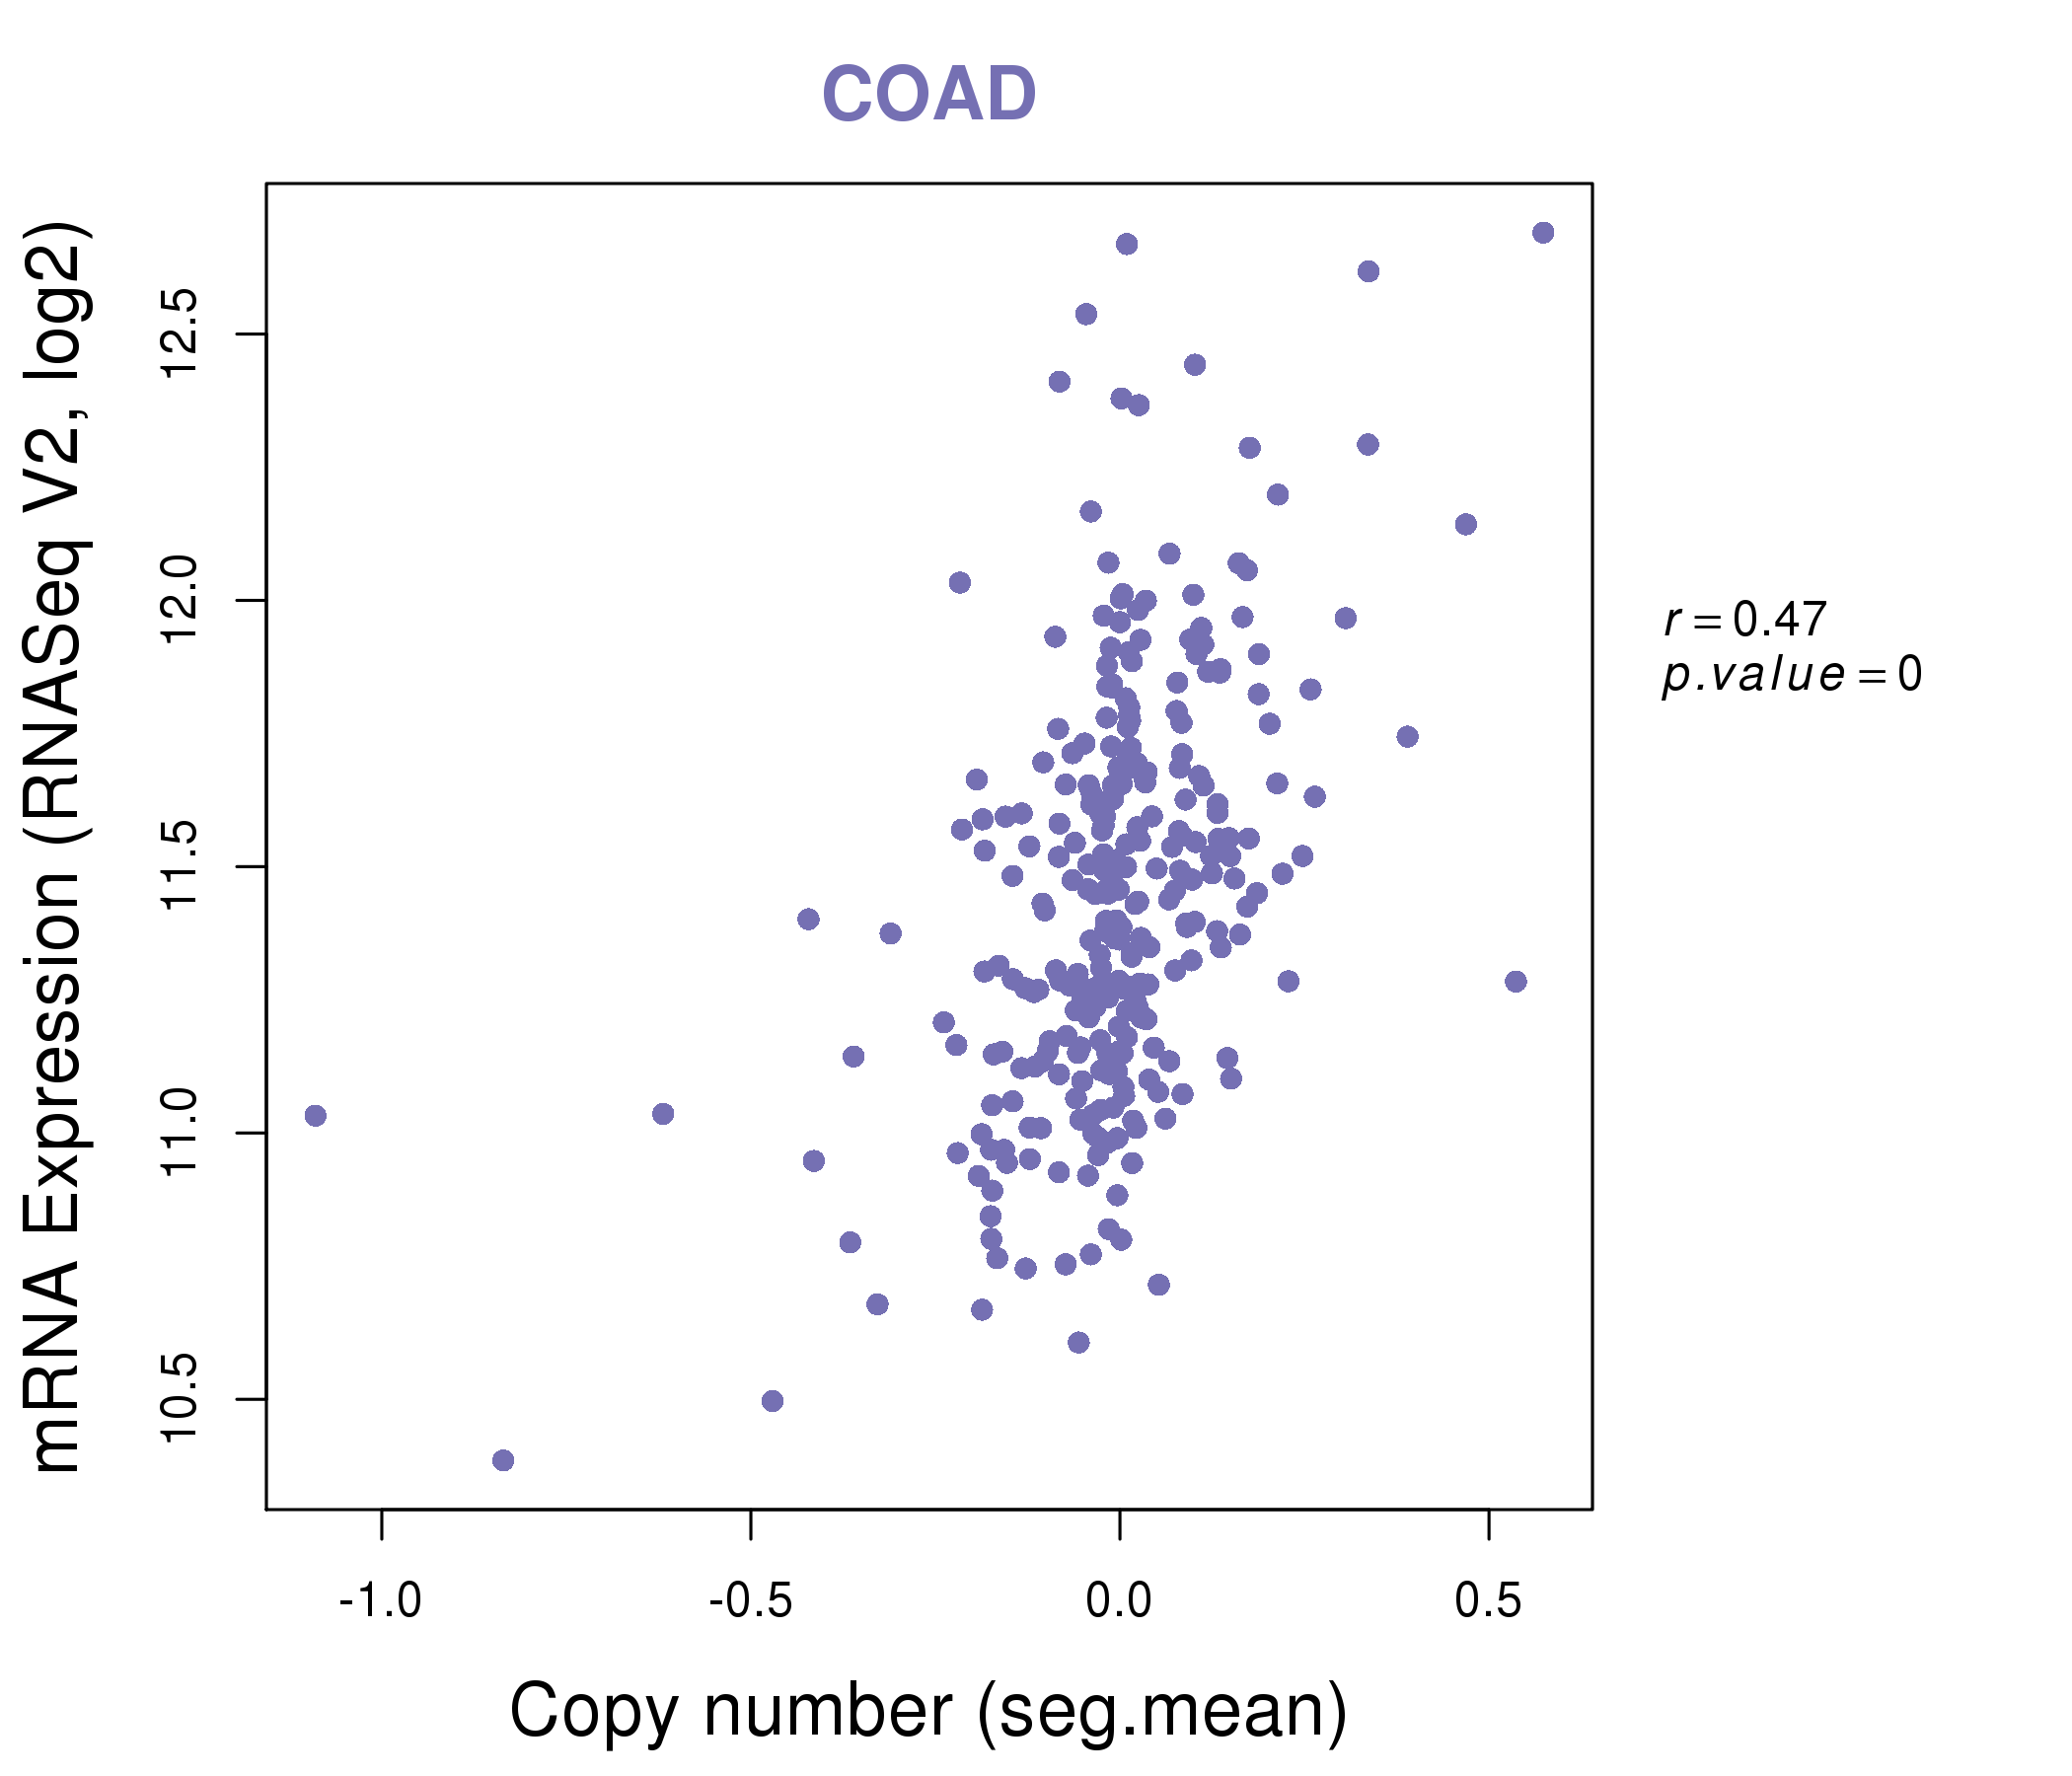
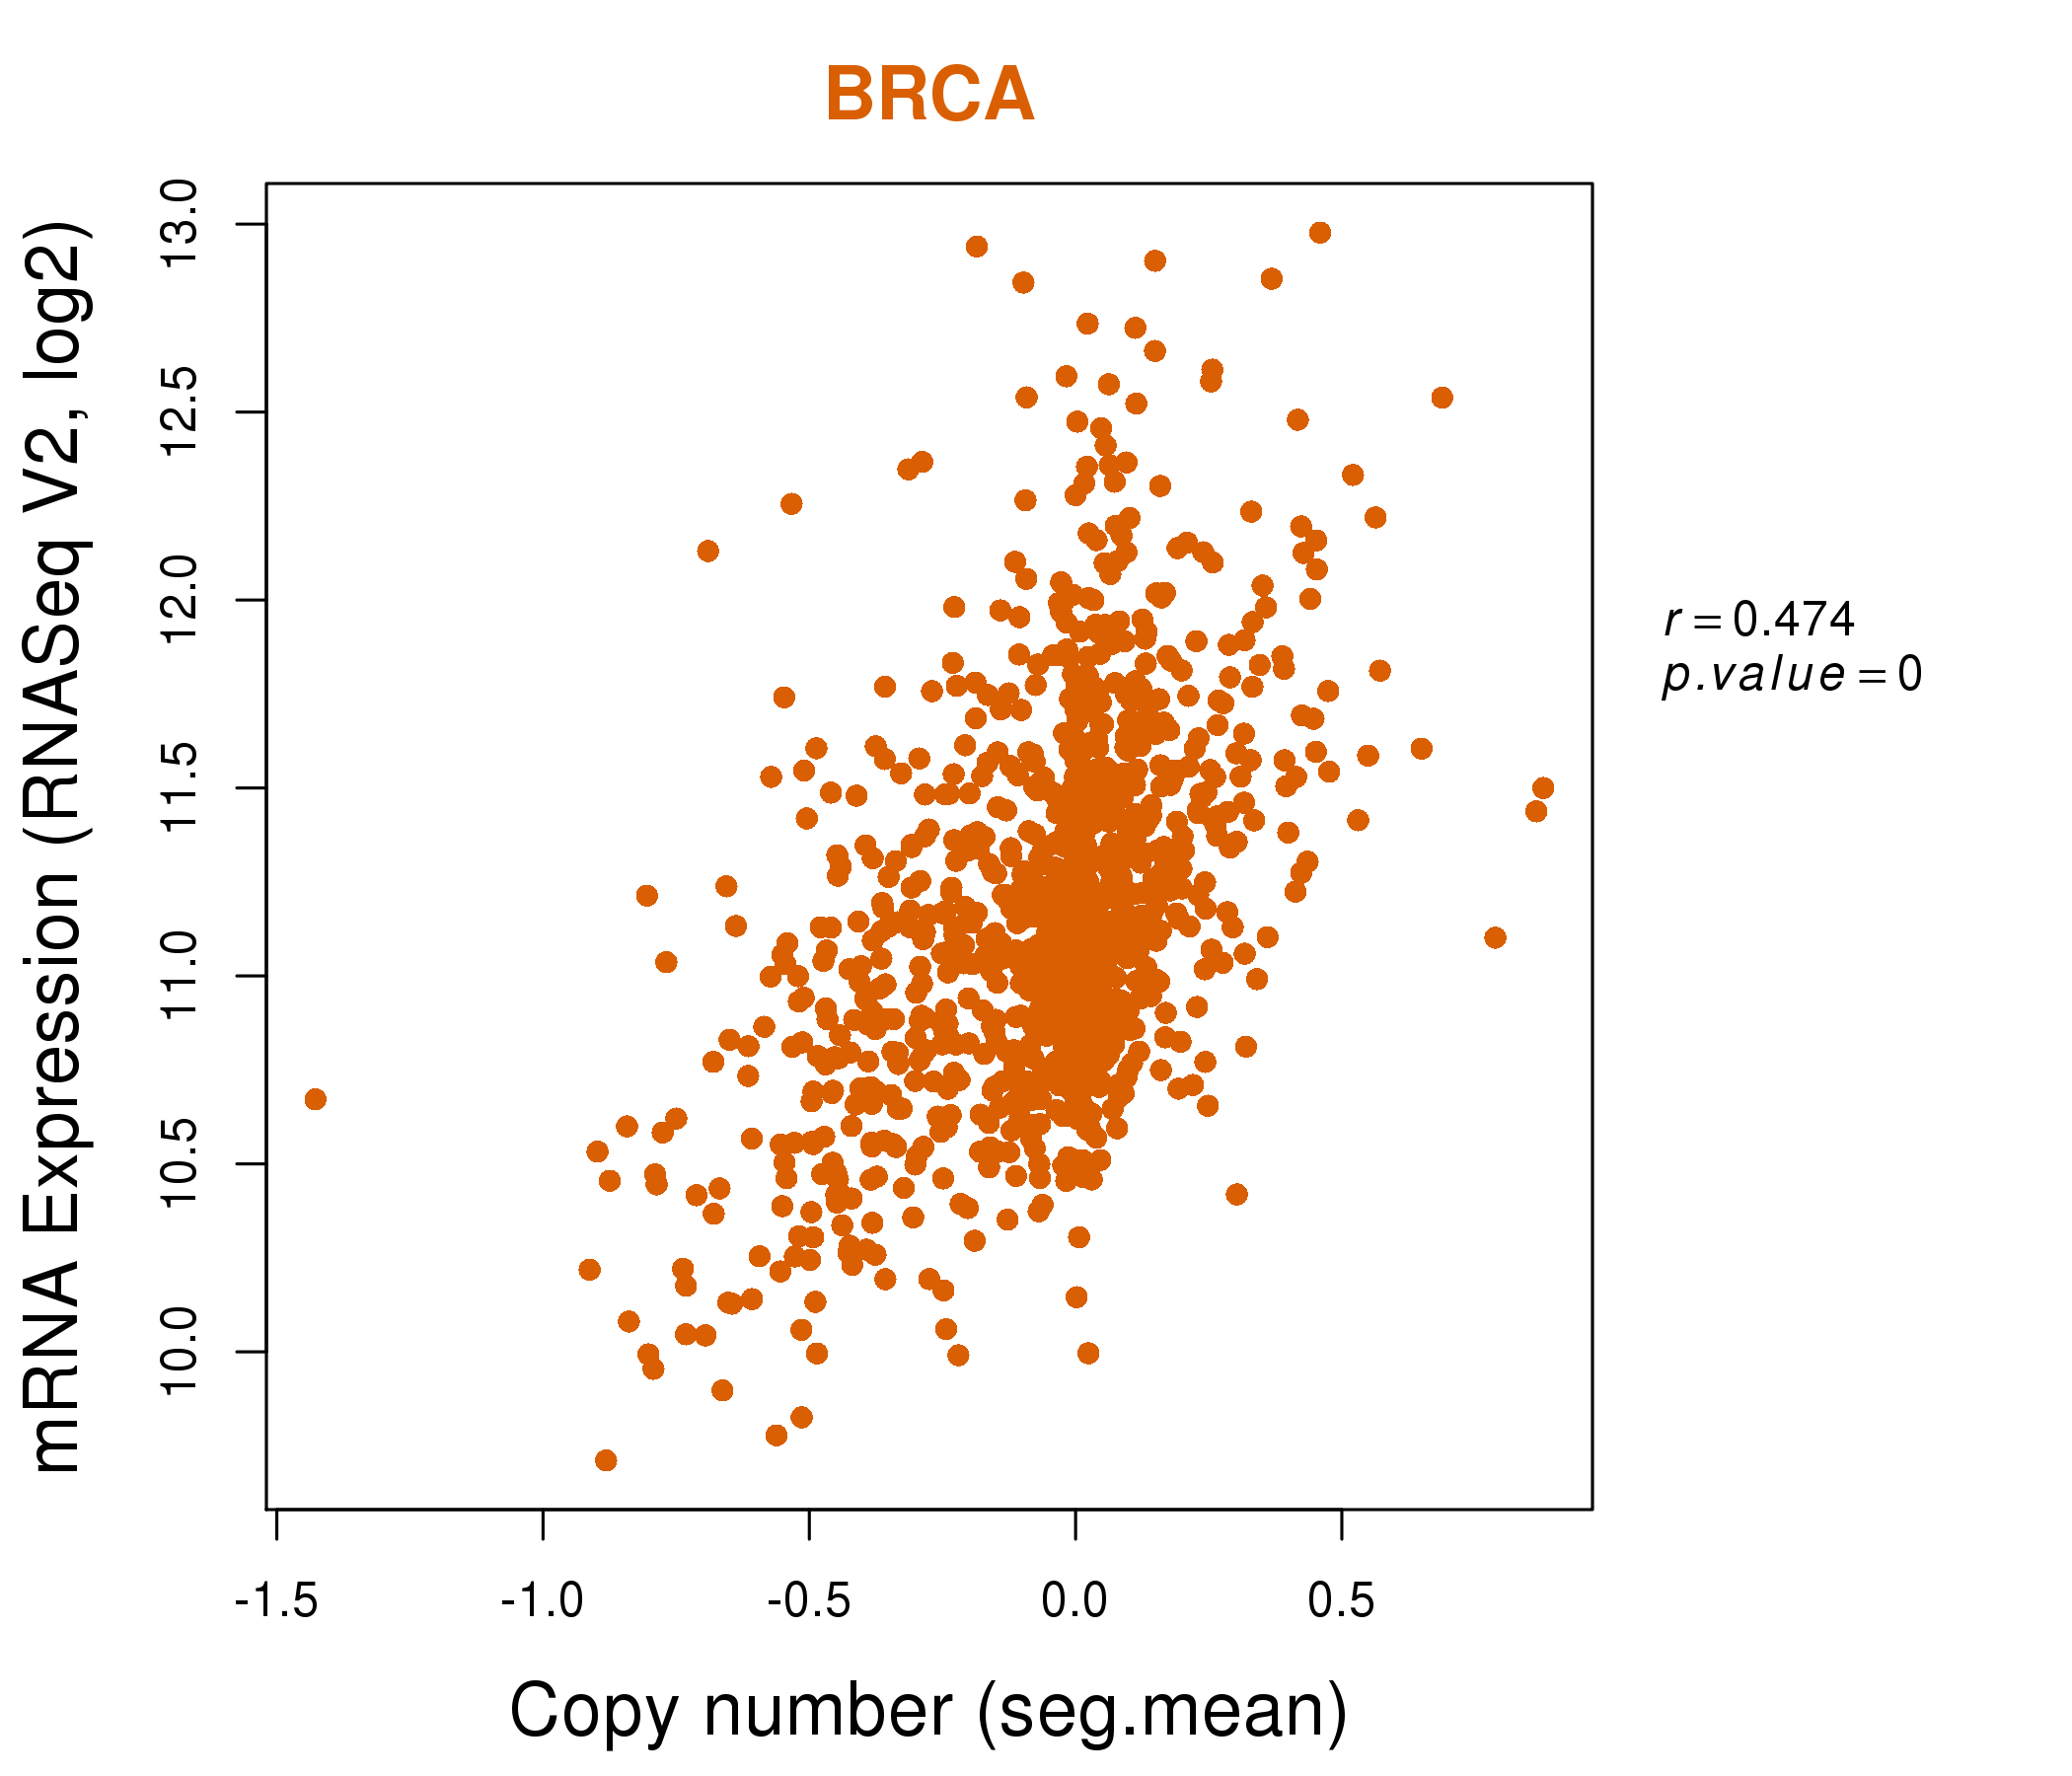
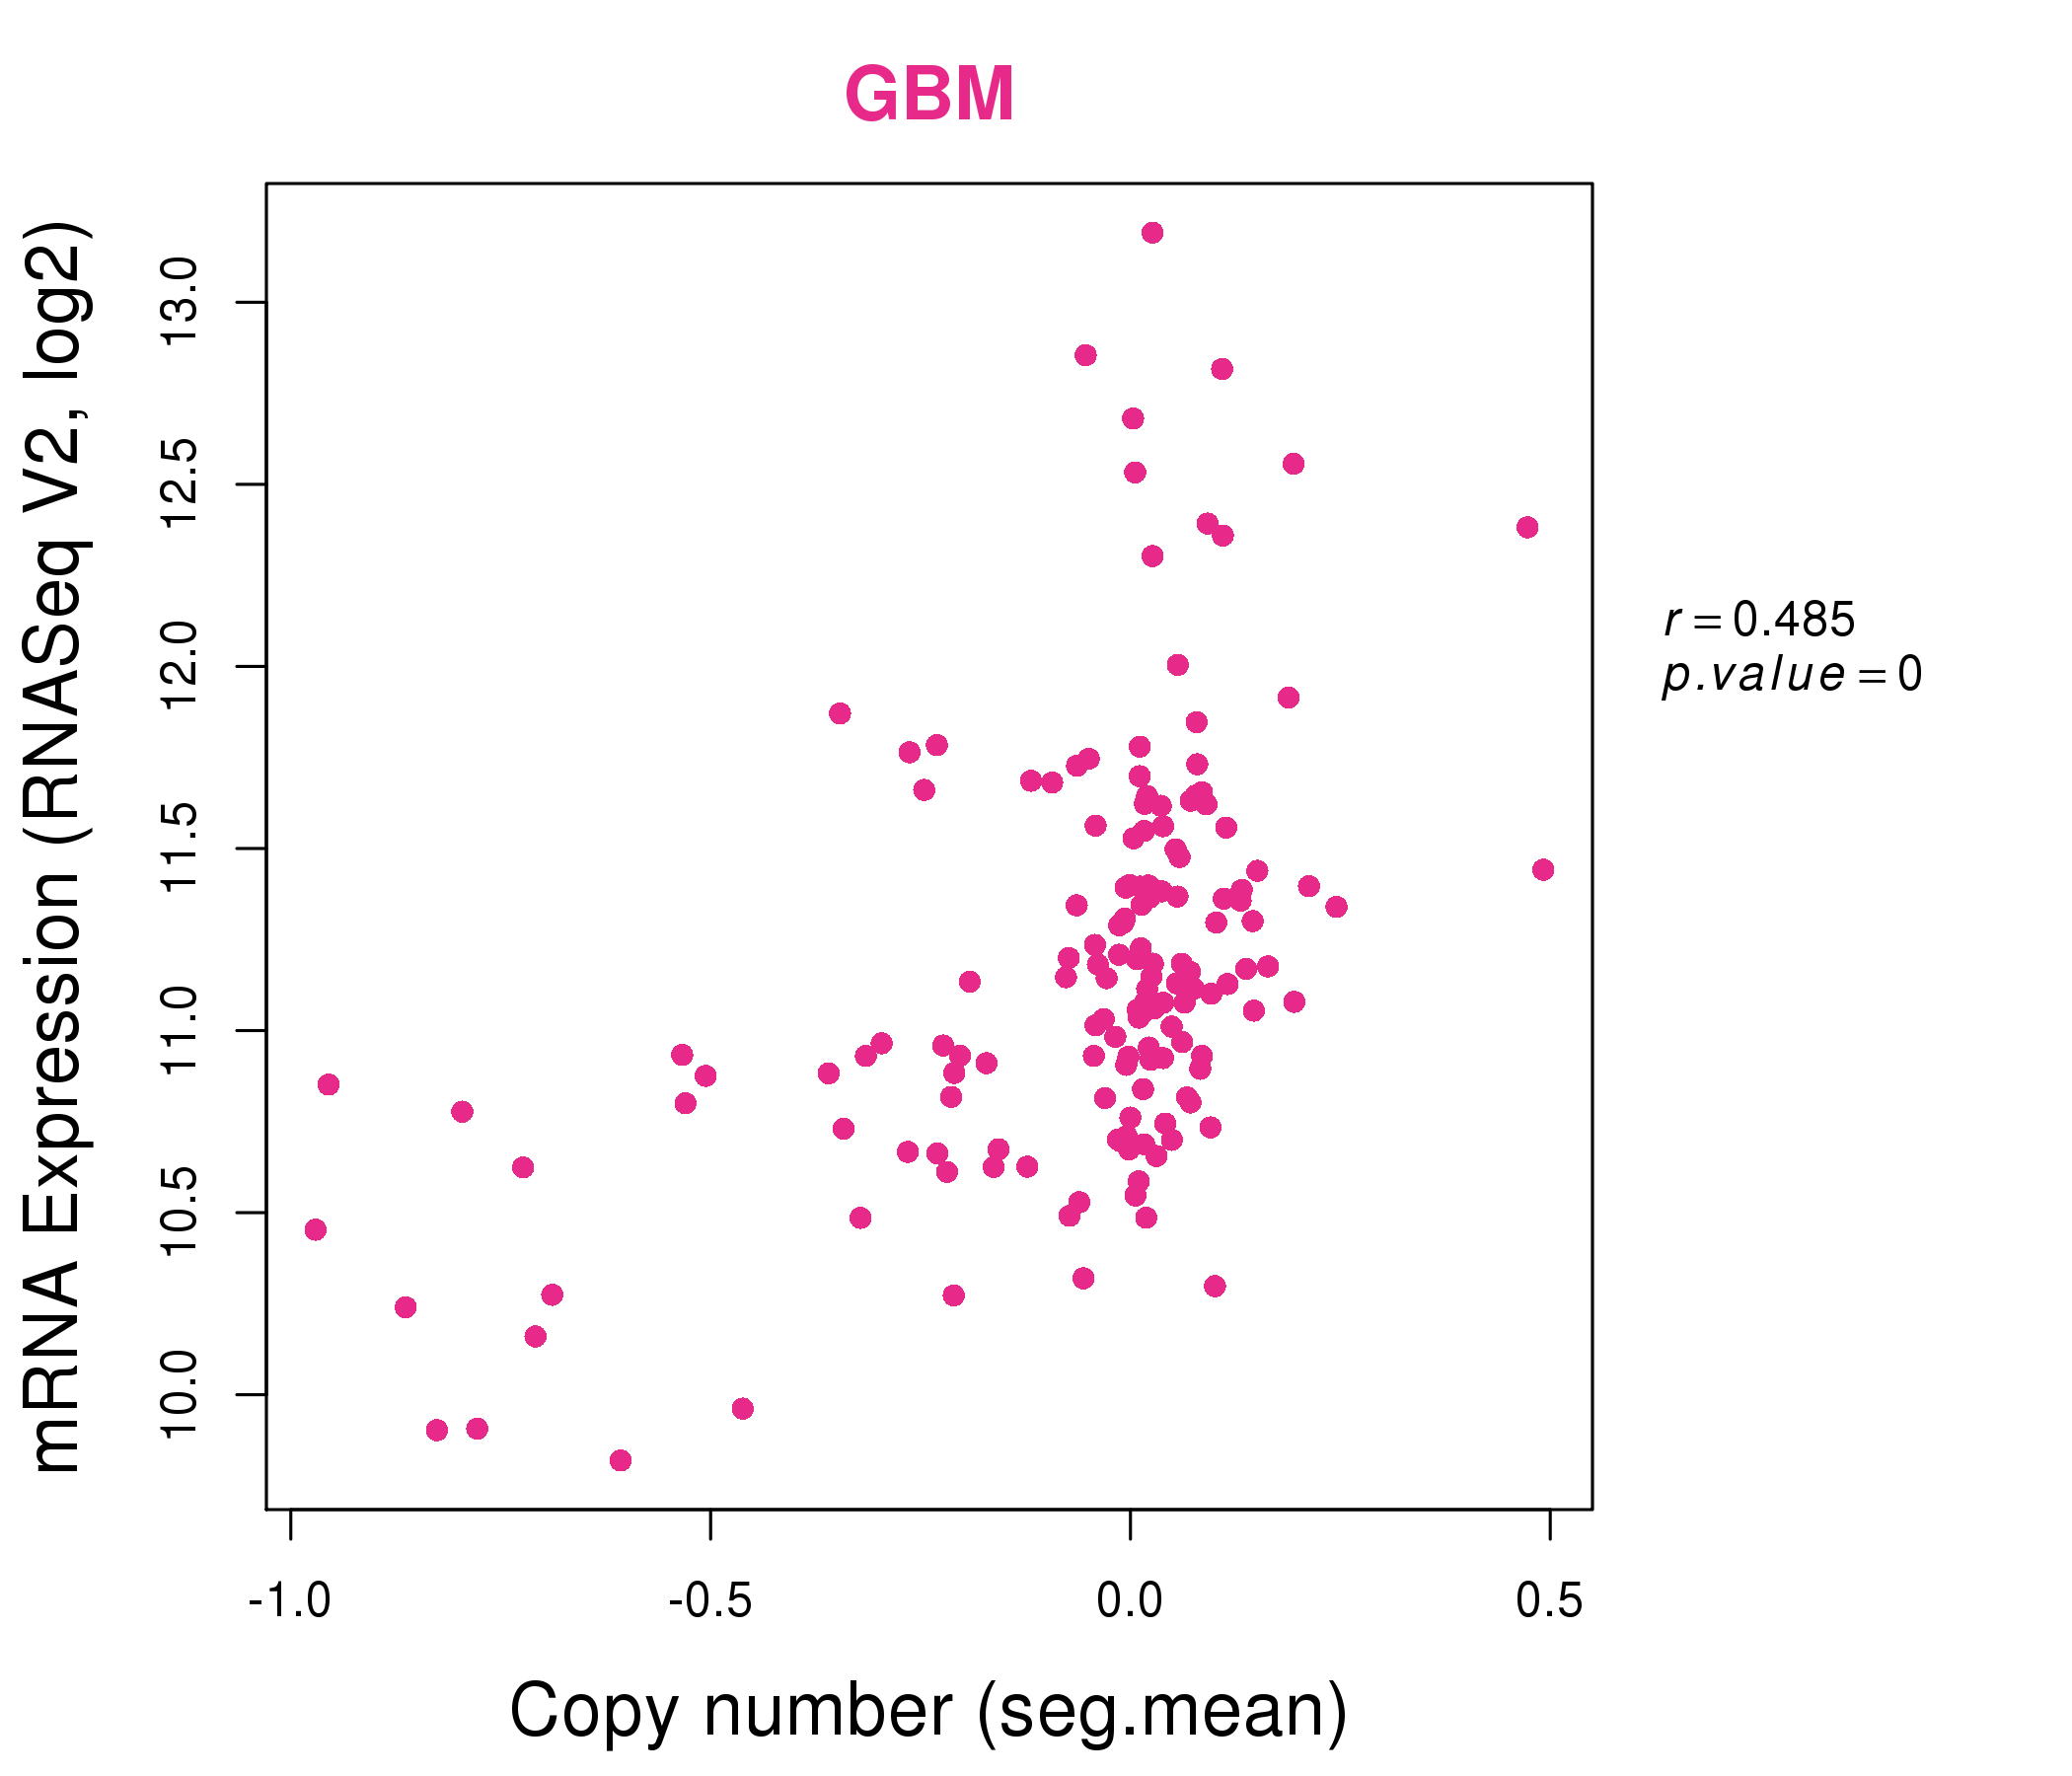
| * Normalized gene expression data of RNASeqV2 was extracted from TCGA using R package TCGA-Assembler. The URLs of all public data files on TCGA DCC data server were gathered at Jan-05-2015. Only eight cancer types have enough normal control samples for differential expression analysis. (t test, adjusted p<0.05 (using Benjamini-Hochberg FDR)) |
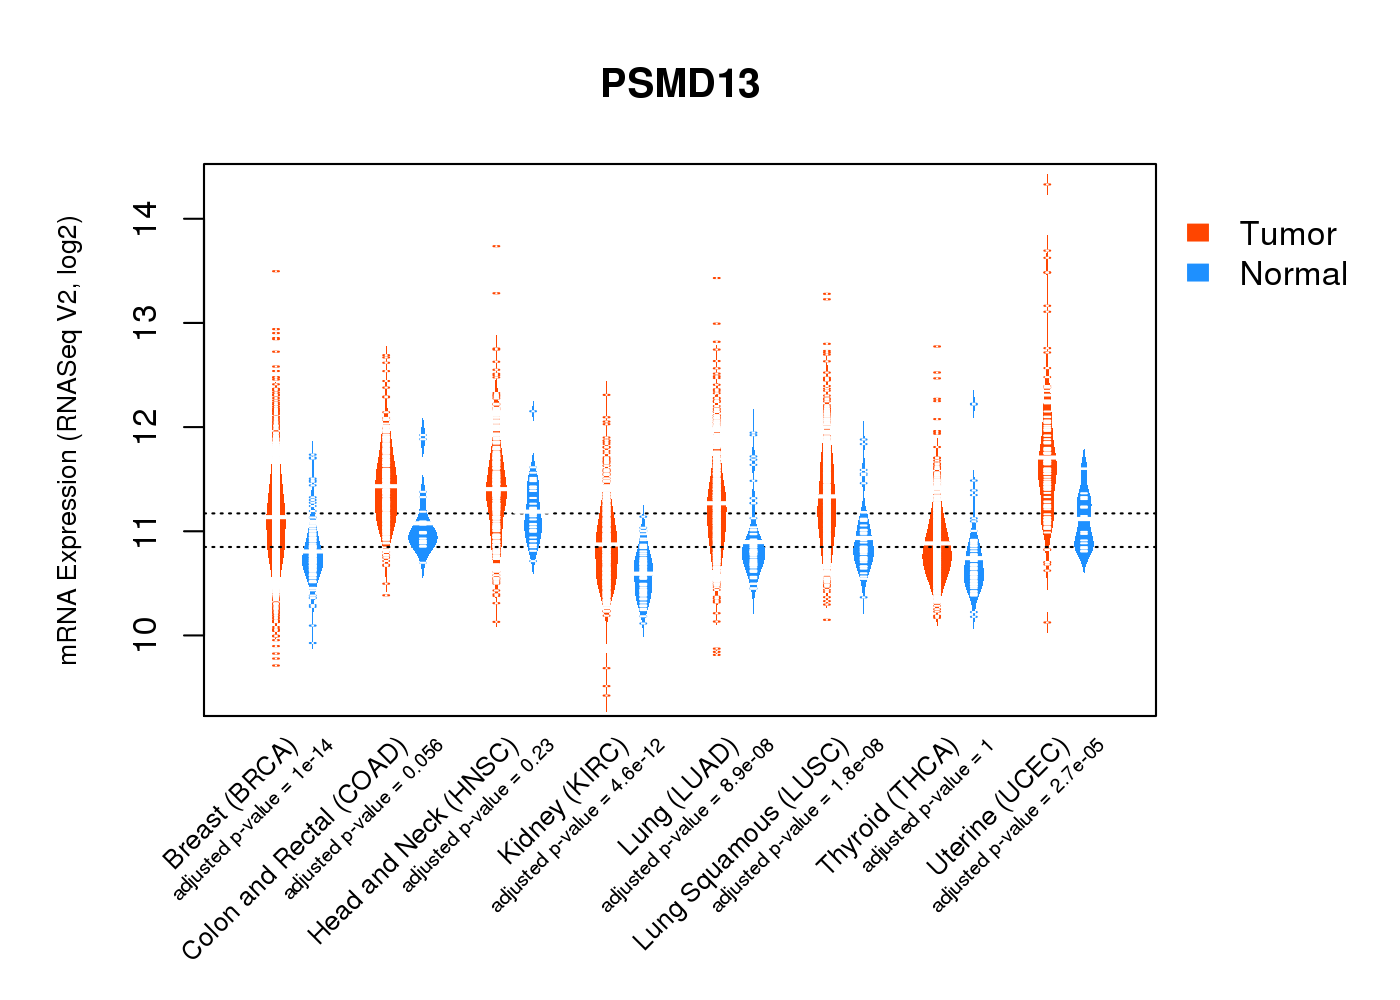 |
| Top |
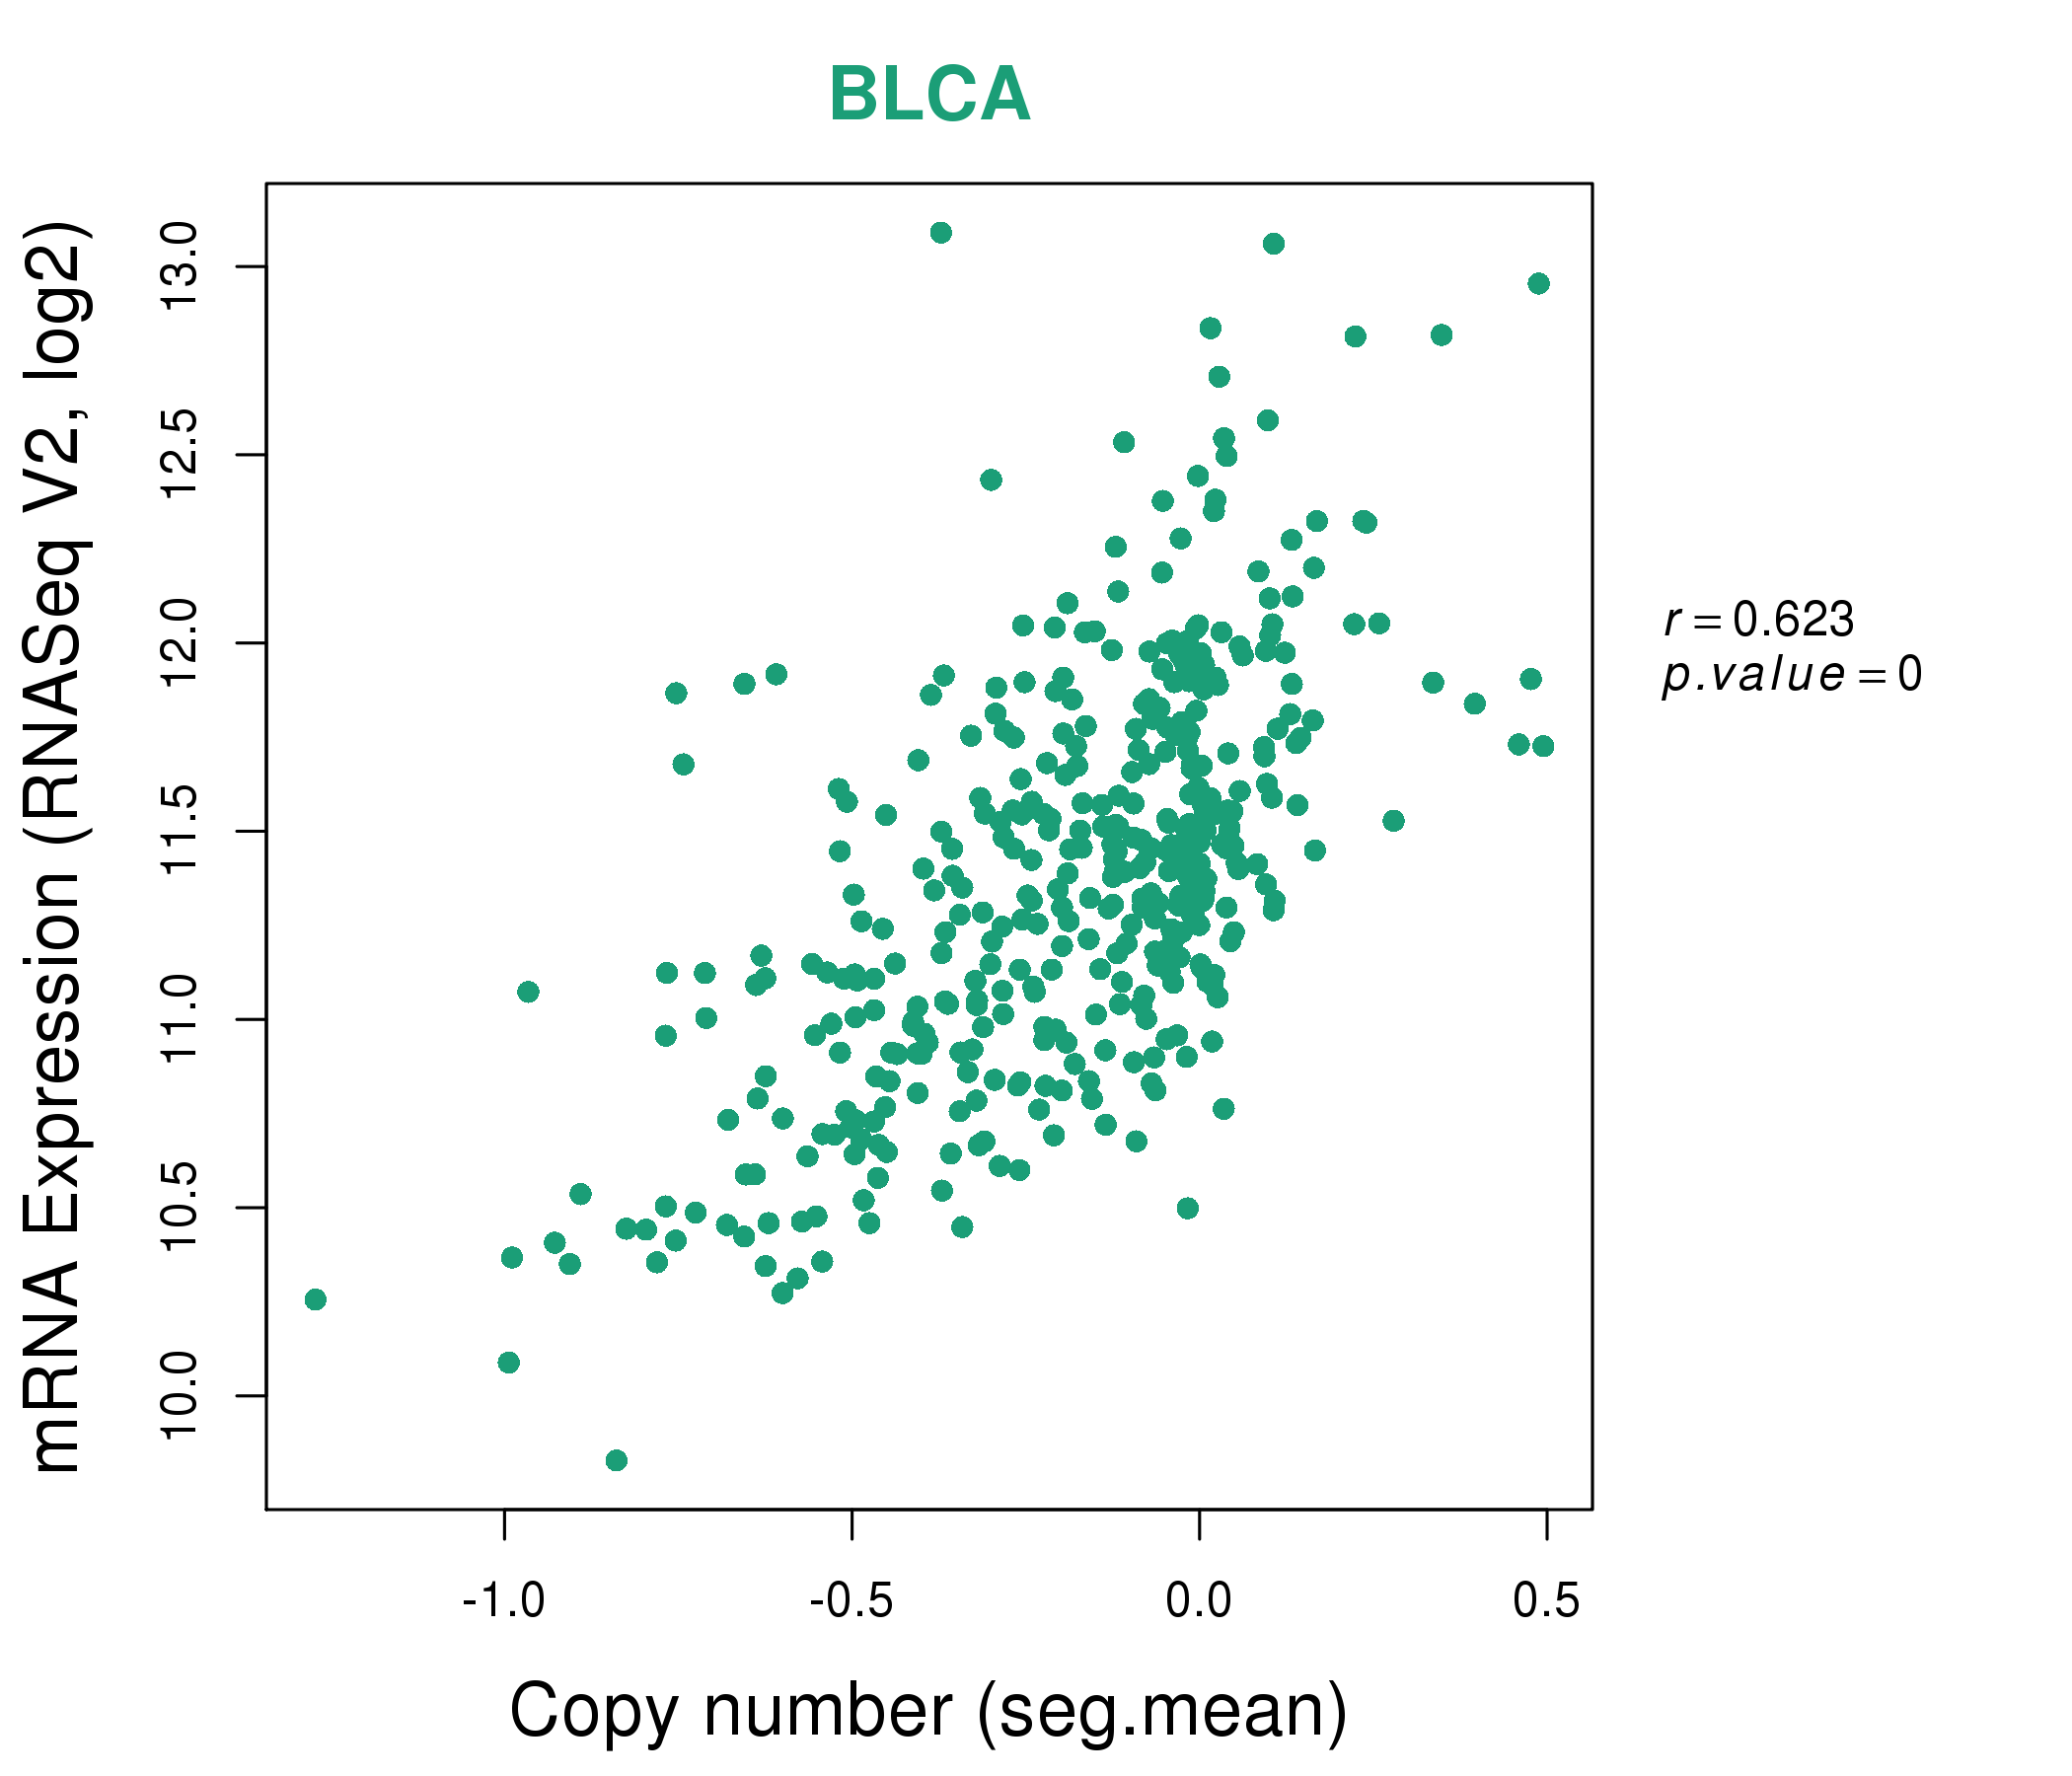
| * This plots show the correlation between CNV and gene expression. |
: Open all plots for all cancer types
 |
|
 |
|
| Top |
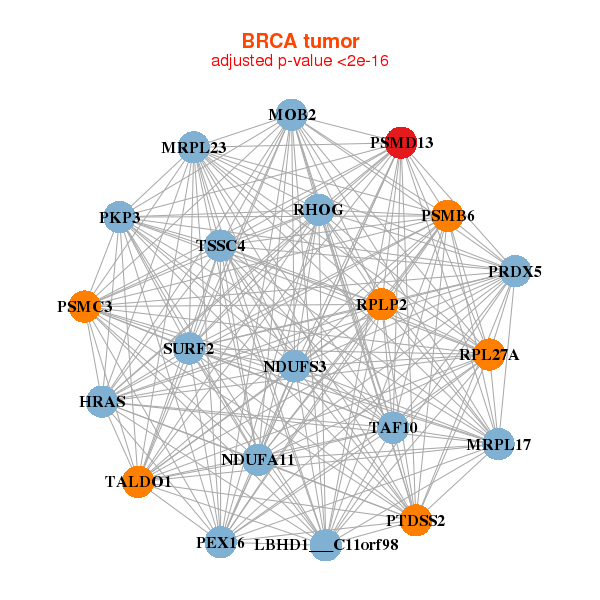
| Gene-Gene Network Information |
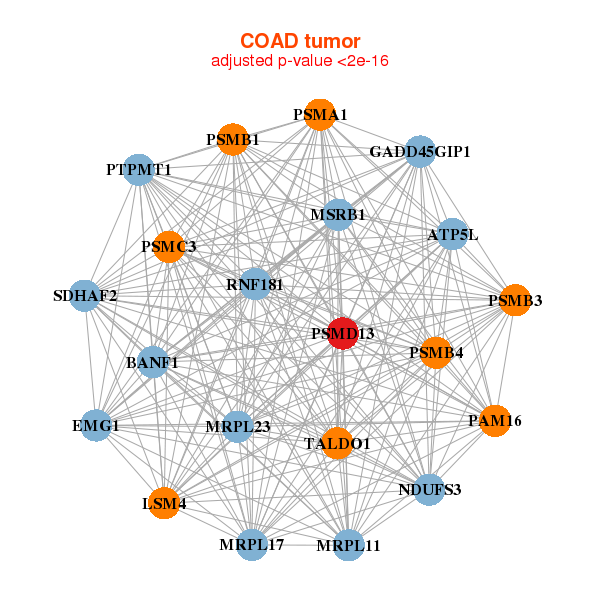
| * Co-Expression network figures were drawn using R package igraph. Only the top 20 genes with the highest correlations were shown. Red circle: input gene, orange circle: cell metabolism gene, sky circle: other gene |
: Open all plots for all cancer types
 |
|
| LBHD1___C11orf98,HRAS,MOB2,MRPL17,MRPL23,NDUFA11,NDUFS3, PEX16,PKP3,PRDX5,PSMB6,PSMC3,PSMD13,PTDSS2, RHOG,RPL27A,RPLP2,SURF2,TAF10,TALDO1,TSSC4 | ASNA1,ELP6,CHMP2A,FAM58A,MRPL28,MRPL51,MRPS34, NUDC,PFDN6,PMF1,PMVK,POLR2F,POP7,PPP1CA, PSMC5,PSMD13,RAB1B,RNF187,SNRNP35,UBE2J2,WBSCR22 |
 |
|
| ATP5L,BANF1,EMG1,GADD45GIP1,LSM4,MRPL11,MRPL17, MRPL23,NDUFS3,PSMA1,PSMB1,PSMB3,PSMB4,PSMC3, PSMD13,PTPMT1,RNF181,SDHAF2,MSRB1,TALDO1,PAM16 | SLIRP,EMC7,DAD1,LSM1,MRPL20,PGK1,POMP, PSMA1,PSMA2,PSMA5,PSMA6,PSMA7,PSMB1,PSMB4, PSMC6,PSMD13,PSMD8,PTS,RBX1,STRA13,UFD1L |
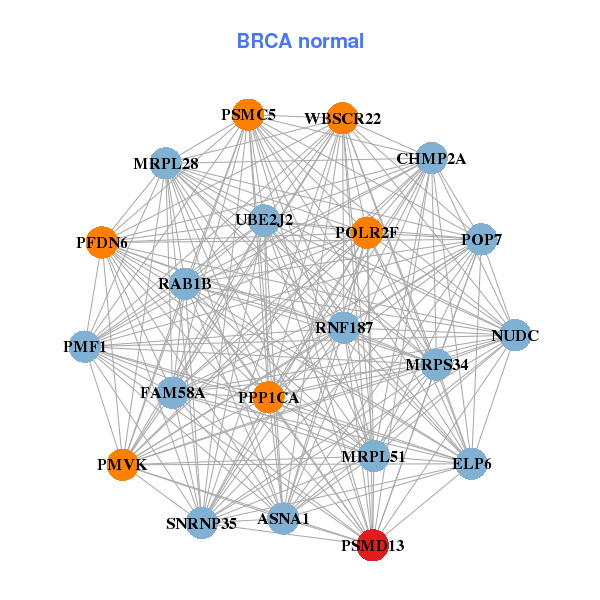
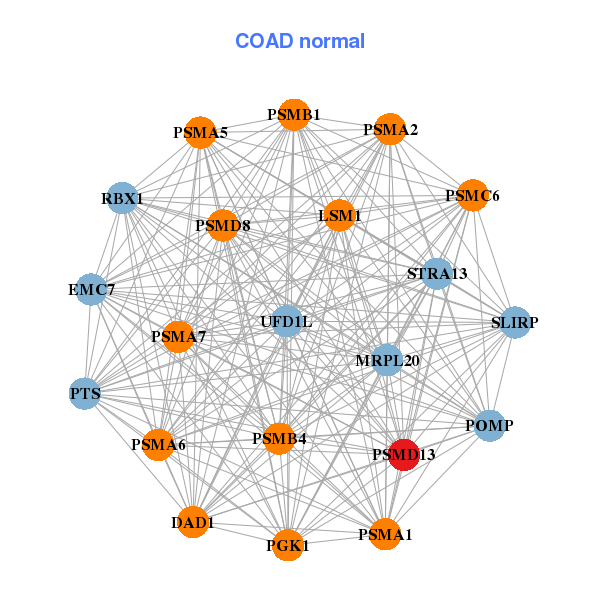
| * Co-Expression network figures were drawn using R package igraph. Only the top 20 genes with the highest correlations were shown. Red circle: input gene, orange circle: cell metabolism gene, sky circle: other gene |
: Open all plots for all cancer types
| Top |
: Open all interacting genes' information including KEGG pathway for all interacting genes from DAVID
| Top |
| Pharmacological Information for PSMD13 |
| There's no related Drug. |
| Top |
| Cross referenced IDs for PSMD13 |
| * We obtained these cross-references from Uniprot database. It covers 150 different DBs, 18 categories. http://www.uniprot.org/help/cross_references_section |
: Open all cross reference information
|
Copyright © 2016-Present - The Univsersity of Texas Health Science Center at Houston @ |